The authors wish to make the following corrections to this paper [
1]:
The authors would like to apologize for any inconvenience caused to the readers by these changes.
We have found two inadvertent errors in our paper published in
Water [
1].
1. A typo in
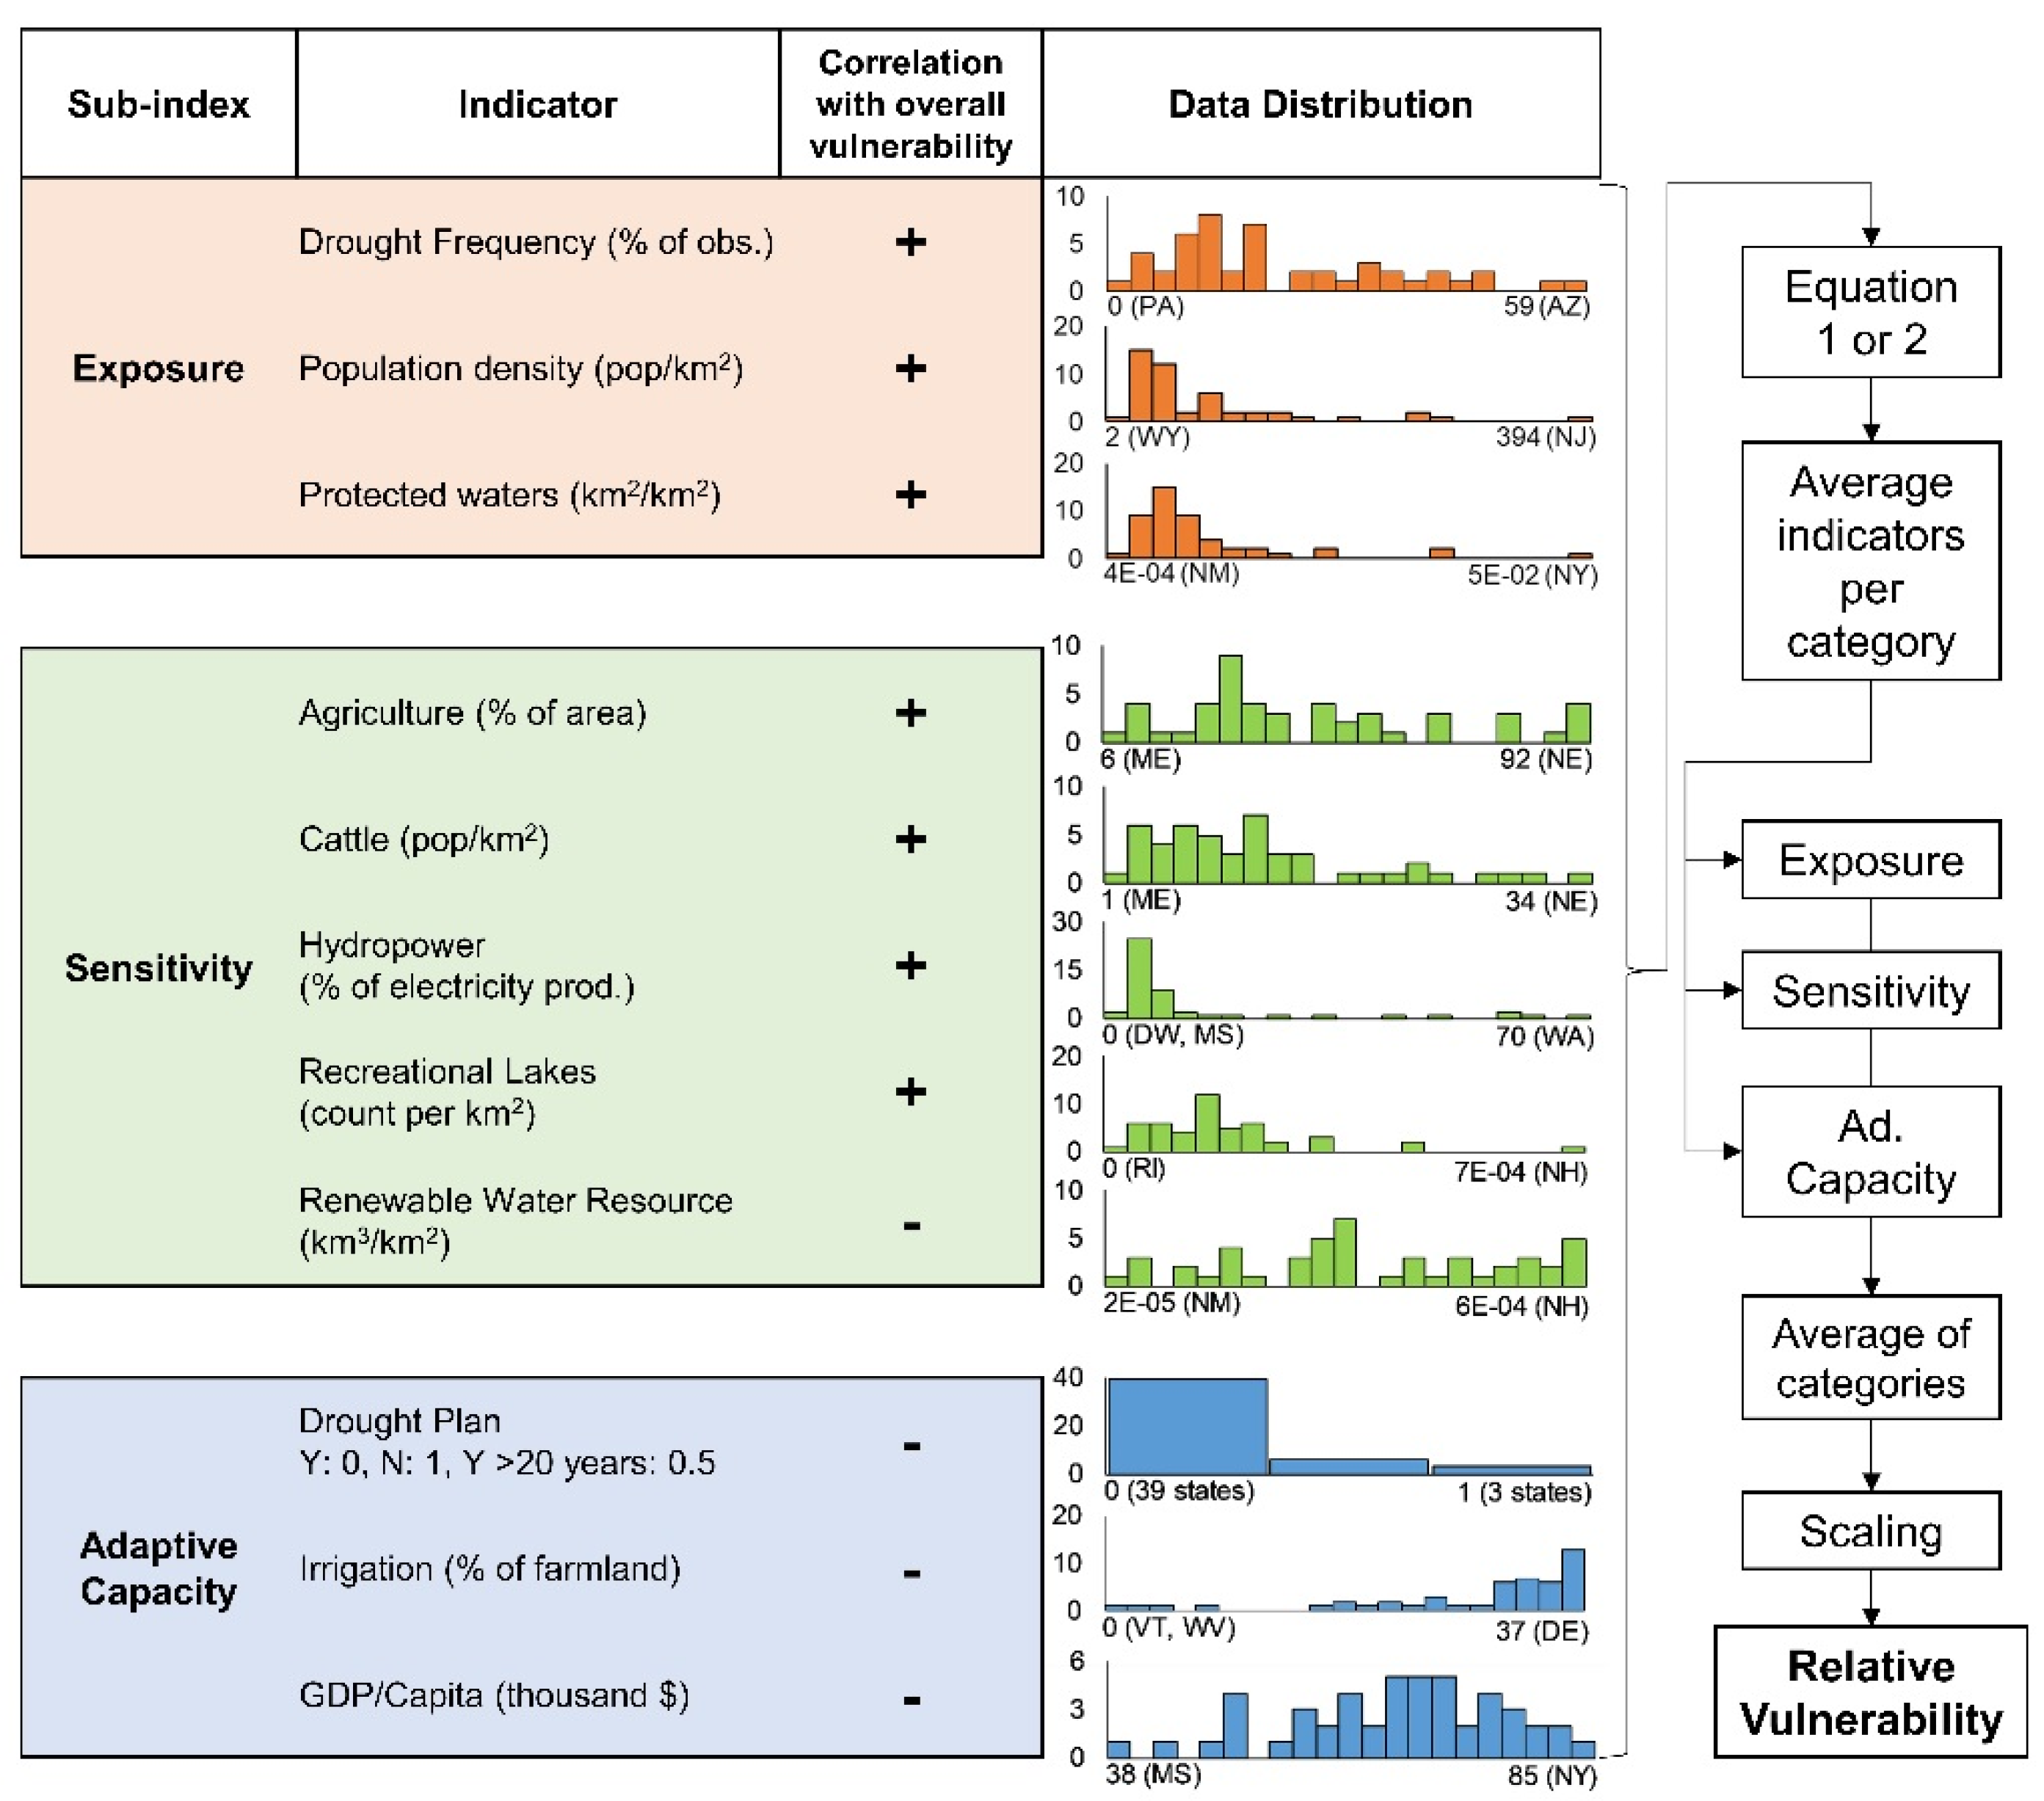
Figure 1. The first histogram’s highest value should be labelled AZ, not NY.
2. A miscalculation of the vulnerability score, leading to the need to update
Figure 4 and
Figure 8 (see below). As the results are updated, so is the text, and the following corrections have been made:
Page 5, paragraph 2, line 11–14: The first group (DVI < 0.2) represents states with very low vulnerability (4 states), the second group (DVI 0.2–0.4) states with low vulnerability (13 states), the third group (DVI 0.4–0.6) states with medium vulnerability (21 states), the fourth group (DVI 0.6–0.8) states with high vulnerability (7 states), and the fifth group (DVI 0.8–1) states with very high vulnerability (3 states).
Page 7, paragraph 1, line 4–7: the least vulnerable. A region that stands out as being less vulnerable than the rest of the country can be found in the northeast, extending into the eastern Mississippi Valley and the southeast (
Figure 4).
Figure 4 Caption: State-wise drought vulnerability across the U.S. Only three states are found in the most vulnerable category, namely Oklahoma, Montana and Iowa. Four states are identified as having very low vulnerability to drought, of which Delaware is the least vulnerable.
Page 9, paragraph 4, line 1–2: The spectrum of vulnerability among the arid states in the southwestern part of the country spans from the “Very low” (CA) to the “High” (AZ, UT, NM) category.
Page 9, paragraph 4, line 8–10: index is also low due to limited agricultural activities, hydropower, and recreational lakes, and its overall vulnerability is ranked as medium. In the same geographic cluster, Arizona, New Mexico and Utah are also found. Arizona is the single driest state in the contiguous U.S., and its extremely limited water resources make it vulnerable to the exceptional water shortages associated with a drought. In New Mexico’s case, the high vulnerability score can be explained in part by extensive farming.
Page 13, paragraph 2, line 2–4: each drought vulnerability category is shown in
Figure 8. Of this area, 25% is in the low or very low category, 42% is in the medium category, and 33% is in the high or very high categories. It should be noted that the high and very high categories only contain seven and three states respectively.
Page 14, paragraph 2, line 7–8: The states of Oklahoma, Montana and Iowa are ranked as the most vulnerable states, while Delaware, Massachusetts, Connecticut and California are ranked as the most resilient.
Change in Figures/Tables
The author wishes to make the following correction to this paper [
1].
Due to mislabeling, replace:
with
Figure 1.
The indicators used in the analysis, grouped into their respective sub-indices, Exposure, Sensitivity, and Adaptive Capacity. The correlation sign with the overall relative vulnerability is also noted. The distribution of the indicator data is shown in color-coded histograms, with the y-axis representing the number of states in each bin. The histograms also show the min and max value for each indicator and from what state the extreme values originate. The indicator data are then entered into Equation (1) or (2) for normalization, and the normalized data are then averaged by category, resulting in the sub-indices. In the final step, the three sub-indices are averaged and scaled to become the overall Relative Vulnerability score. An overview of the calculation procedure can be seen on the right-hand side of this figure.
Due to corrections of the results, replace
with
Figure 4.
State-wise drought vulnerability across the U.S. Only three states are found in the most vulnerable category, namely Oklahoma, Montana and Iowa. Four states are identified as having very low vulnerability to drought, of which Delaware is the least vulnerable.
Figure 4.
State-wise drought vulnerability across the U.S. Only three states are found in the most vulnerable category, namely Oklahoma, Montana and Iowa. Four states are identified as having very low vulnerability to drought, of which Delaware is the least vulnerable.
and
with
Figure 8.
Areal portion of the contiguous U.S. found in each vulnerability category.
Figure 8.
Areal portion of the contiguous U.S. found in each vulnerability category.
These changes have no material impact on the conclusions of our paper. We apologize to our readers.


