Slope Erosion and Hydraulics during Thawing of the Sand-Covered Loess Plateau


Abstract
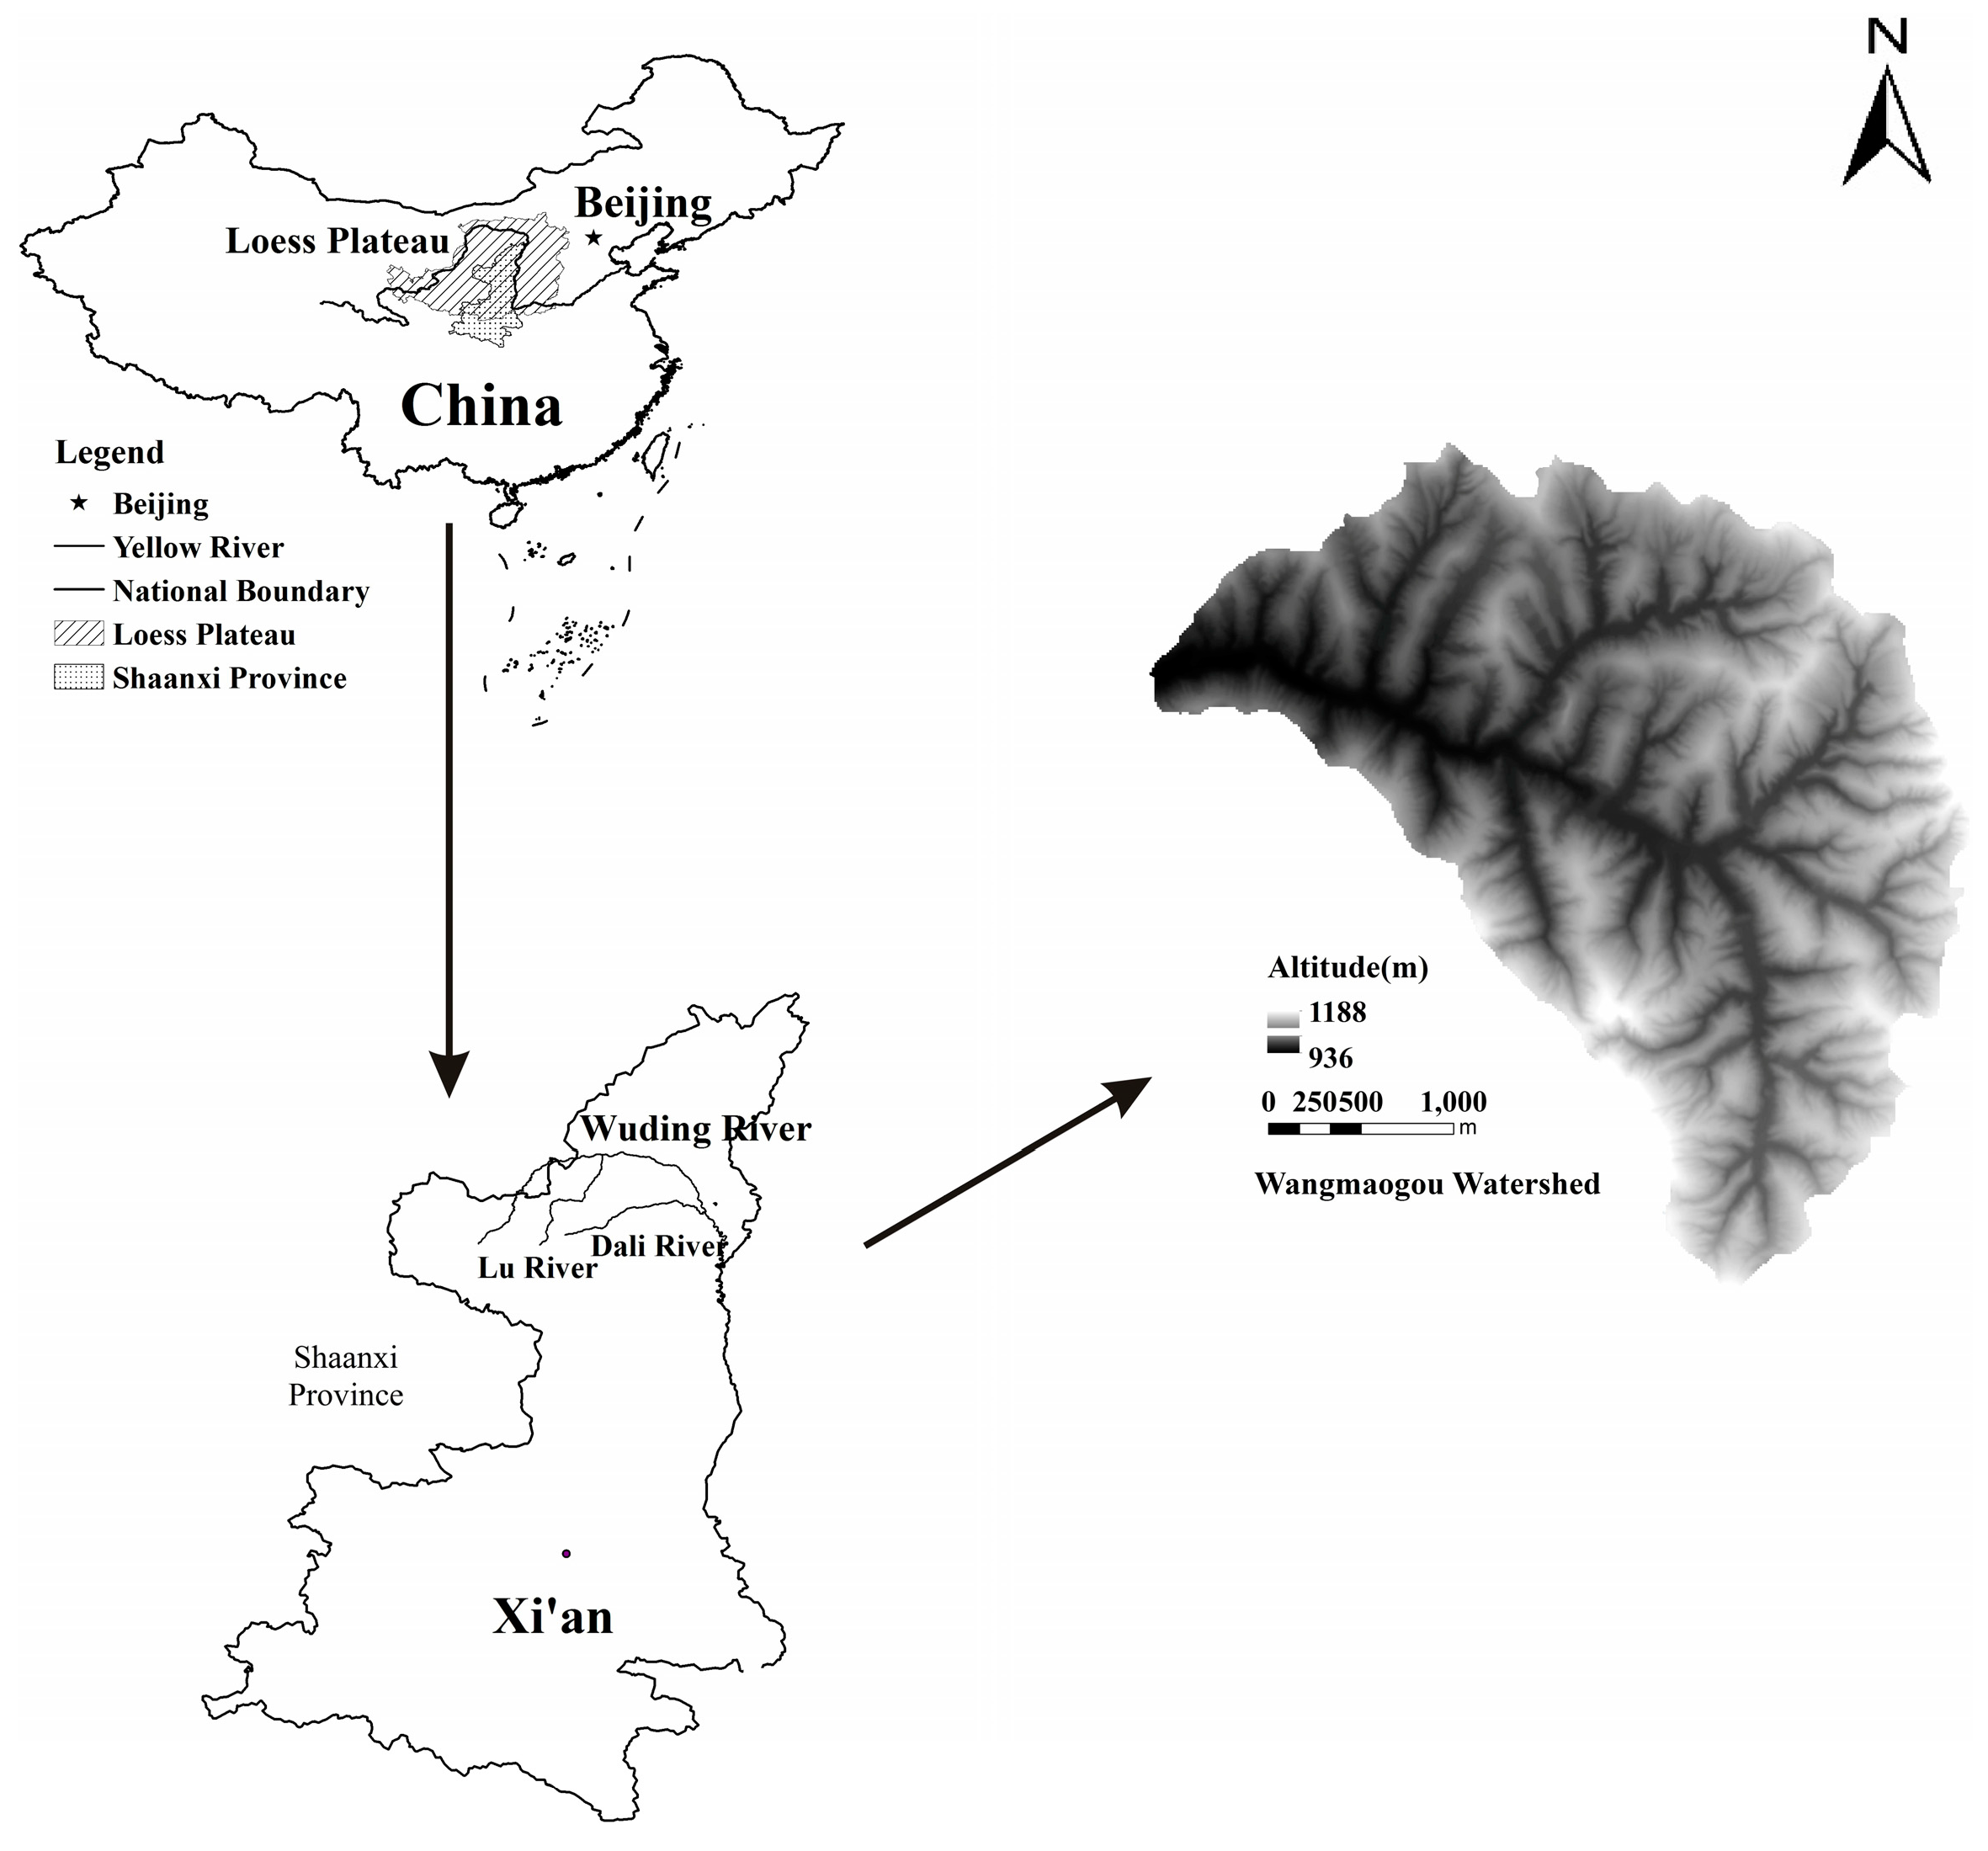
:1. Introduction
2. Materials and Methods
2.1. Material and Device
2.2. Experimental Design
2.3. Hydraulics Parameter Calculation and Methods
2.3.1. Calculation of Hydraulics Parameters
2.3.2. Methods
3. Results
3.1. Erosion, Runoff, and Sediment Yield
3.1.1. Characteristics Values of Runoff and Sediment Yield
3.1.2. Correlation between Accumulative Runoff and Accumulative Sediment Yield
3.2. Hydraulics of Slope Runoff
3.2.1. Spatiotemporal Variations of Flow Velocity
3.2.2. Spatiotemporal Variations of the Reynolds Number
3.2.3. Spatiotemporal Variations of the Froude Number
3.2.4. Spatiotemporal Variations of the Darcy-Weisbach Roughness Coefficient
3.3. Quantification of Hydrodynamic Parameters of Slope Erosion under US and FS
3.3.1. Relationship between Flow Velocity and Hydraulic Parameters under US and FS
3.3.2. Interrelations of Flow Velocity and Hydraulic Parameters with Runoff Rate Response under US and FS
4. Discussion
4.1. Effects of Slope, Sand Cover, and Soil Freezing on Soil Erosion
4.2. Effects of Slope Sand Covered and Soil Freezed on Hydraulic Parameters
4.3. Implications for the Relationship between Hydraulic Parameters and Slope Erosion
5. Conclusions
Author Contributions
Funding
Acknowledgments
Conflicts of Interest
Abbreviations
| US | unfrozen slope |
| U0 (1,2,3) | unfrozen slope, the thickness of sand covering is 0 (1,2,3) cm |
| FS | frozen slope |
| F0 (1,2,3) | frozen slope, the thickness of sand covering is 0 (1,2,3) cm |
References
- Cao, L.X.; Zhang, K.L.; Dai, H.L.; Liang, Y. Modeling interrill erosion on unpaved roads in the loess plateau of China. Land Degrad. Dev. 2015, 26, 825–832. [Google Scholar] [CrossRef]
- Wang, G.Y.; Joho, I.; Yang, Y.S.; Chen, S.M.; Judi, K.; Xie, J.S.; Lin, W.L. Extent of soil erosion and surface runoff associated with large-scale infrastructure development in Fujian Province, China. Catena 2012, 89, 22–30. [Google Scholar] [CrossRef]
- Cheng, B.; Lv, Y.; Zhan, Y.; Su, D. Constructing China’s roads as works of art: A case study of “Esthetic Greenway” construction in the Shennongjia Region of China. Land Degrad. Dev. 2013, 26, 324–330. [Google Scholar] [CrossRef]
- Xu, J.X. The wind-water two-phase erosion and sediment-producing processes in the middle Yellow River basin, China. Sci. China 2000, 43, 176–186. [Google Scholar] [CrossRef]
- Xu, J.X.; Yang, J.S.; Yan, Y.X. Erosion and sediment yields as influenced by coupled eolian and fluvial processes: The Yellow River, China. Geomorphology 2006, 73, 1–15. [Google Scholar] [CrossRef]
- Xie, L.Y.; Bai, Y.J.; Zhang, F.B.; Yang, M.Y.; Li, Z.B. Effects of thickness and particle size composition of overlying sand laye on runoff and sediment yield on sand-covered loess slopes. Acta Pedol. Sin. 2017, 54, 60–72. [Google Scholar]
- Xu, G.C.; Tang, S.S.; Lu, K.X.; Li, P.; Li, Z.B.; Gao, H.D.; Zhao, B.H. Runoff and sediment yield under simulated rainfall on sand-covered slopes in a region subject to wind-water erosion. Environ. Earth Sci. 2015, 74, 2523–2530. [Google Scholar] [CrossRef]
- Zhang, F.B.; Bai, Y.J.; Xie, L.Y.; Yang, M.Y.; Li, Z.B.; Wu, X.R. Runoff and soil loss characteristics on loess slopes covered with aeolian sand layers of different thicknesses under simulated rainfall. J. Hydrol. 2017, 549, 244–251. [Google Scholar] [CrossRef]
- Zhang, F.B.; Yang, M.Y.; Li, B.B.; Li, Z.B.; Shi, W.Y. Effects of slope gradient on hydro-erosional processes on an aeolian sand-covered loess slope under simulated rainfall. J. Hydrol. 2017, 553, 447–456. [Google Scholar] [CrossRef]
- Zhang, X.; Li, Z.B.; Li, P.; Tang, S.S.; Wang, T.; Zhang, H. Influences of sand cover on erosion processes of loess slopes based on rainfall simulation experiments. J. Arid. Land 2018, 10, 39–52. [Google Scholar] [CrossRef] [Green Version]
- Zhang, L.P.; Tang, K.L.; Zhang, C.P. Research on soil wind erosion laws in loess hilly-gully region covered by Sheet Sand. J. Soil Water Conserv. 1999, 5, 40–45. [Google Scholar]
- Wu, X.R.; Zhang, F.B.; Wang, Z.L. Variation of sand and loess properties of binary structure profile in Hilly Region covered by sand of the Loess Plateau. J. Soil Water Conserv. 2014, 28, 190–193. [Google Scholar]
- Tang, S.S.; Li, Z.B.; Ren, Z.P.; Yao, J.W.; Tang, H. Experimental study on the process of runoff and sediment yield on sand-covered slope. J. Soil Water Conserv. 2015, 29, 25–28. [Google Scholar]
- Tang, S.S.; Li, Z.B.; Li, C.; Zhao, B.H. Runoff and Sediment yield process on sand covered slope under simulated rainfall. J. Northwest A F Univ. Nat. Sci. Ed. 2016, 44, 139–146. [Google Scholar]
- Tang, S.S.; Li, Z.B.; Lu, K.X.; Liu, Y.; Su, Y.Y.; Ma, Y.Y. Relationship between hydrodynamic parameters and runoff and sediment yield on sand-covered slope in rainfall simulation study. Trans. Chin. Soc. Agric. Eng. 2017, 33, 136–143. [Google Scholar]
- Zhao, B.H.; Li, Z.B.; Li, P.; Xu, G.C.; Gao, H.D.; Cheng, Y.T.; Chang, E.H.; Yuan, L.; Zhang, Y.; Feng, Z.H. Spatial distribution of soil organic carbon and its influencing factors under the condition of ecological construction in a hilly-gully watershed of the Loess Plateau, China. Geoderma 2017, 296, 10–17. [Google Scholar] [CrossRef]
- Shi, P.; Qin, Y.; Liu, Q.; Zhu, T.T.; Li, Z.B.; Li, P.; Ren, Z.P.; Liu, Y.; Wang, F.C. Soil respiration and response of carbon source changes to vegetation restoration in the Loess Plateau, China. Sci. Total Environ. 2019, 707, 135507. [Google Scholar] [CrossRef]
- Shi, P.; Feng, Z.H.; Gao, H.D.; Li, P.; Xiao, L. Has “Grain for Green” threaten food security on the Loess Plateau of China? Ecosyst. Health Sustain. 2020, 6, 1709560. [Google Scholar] [CrossRef] [Green Version]
- Zhang, Y.; Li, P.; Liu, X.J.; Xiao, L.; Shi, P.; Zhao, B.H. Effects of farmland conversion on the stoichiometry of carbon, nitrogen, and phosphorus in soil aggregates on the Loess Plateau of China. Geoderma 2019, 351, 188–196. [Google Scholar] [CrossRef]
- Wang, T.; Li, P.; Li, Z.B.; Hou, J.M.; Xiao, L.; Ren, Z.P.; Xu, G.C.; Yu, K.X.; Su, Y.Y. The effects of freeze–thaw process on soil water migration in dam and slope farmland on the Loess Plateau, China. Sci. Total Environ. 2019, 666, 721–730. [Google Scholar] [CrossRef]
- Wang, T.; Li, P.; Liu, Y.; Hou, J.M.; Li, Z.B.; Ren, Z.P.; Cheng, S.D.; Zhao, J.H.; Hinkelmann, R. Experimental investigation of freeze-thaw meltwater compound erosion and runoff energy consumption on loessal slopes. Catena 2020, 185, 104310. [Google Scholar] [CrossRef]
- Kirkby, M.J. Modeling Water Erosion Processes. In Soil Erosion; Kirkby, M.J., Morgan, R.P.C., Eds.; Wiley: Chichester, UK, 1980; pp. 183–196. [Google Scholar]
- Zuzel, J.; Pikul, J. Effects of straw mulch on runoff and erosion from small agricultural plots in northeastern oregon. Soil Sci. 1993, 156, 111–117. [Google Scholar] [CrossRef]
- Edwards, L.M.; Burney, J.R. The effect of antecedent freeze-thaw frequency on runoff and soil loss from frozen soil with and without subsoil compaction and ground cover. Can. J. Soil Sci. 1989, 69, 799–811. [Google Scholar] [CrossRef]
- Fan, H.; Liu, Y.; Xu, X.; Wu, M.; Zhou, L. Simulation of rill erosion in black soil and albic soil during the snowmelt period. Acta Agric. Scand. Sect. B Soil Plant. Sci. 2017, 67, 510–517. [Google Scholar] [CrossRef]
- Ting, J.M.; Torrence, M.R.; Ladd, C.C. Mechanisms of strength for frozen sand. J. Geotech. Eng. 1983, 109, 1286–1302. [Google Scholar] [CrossRef]
- Sharratt, B.S.; Lindstrom, M.J.; Benoit, G.R.; Young, R.A.; Wilts, A. Runoff and soil erosion during spring thaw in the northern US Corn Belt. J. Soil Water Conserv. 2000, 55, 487–494. [Google Scholar]
- Henry, H.A.L. Soil freeze—Thaw cycle experiments: Trends, methodological weaknesses and suggested improvements. Soil Biol. Biochem. 2007, 39, 977–986. [Google Scholar] [CrossRef]
- Pawluk, S. Freeze-thaw effects on granular structure reorganization for soil materials of varying texture and moisture content. Can. J. Soil Sci. 1988, 68, 485–494. [Google Scholar] [CrossRef]
- Shi, Z.H.; Fang, N.F.; Wu, F.Z. Soil erosion processes and sediment sorting associated with transport mechanisms on steep slopes. J. Hydrol. Amst. 2012, 454, 123–130. [Google Scholar] [CrossRef]
- Zhang, L.T.; Gao, Z.L.; Yang, S.W.; Yang, S.W.; Li, Y.H.; Tian, H.W. Dynamic processes of soil erosion by runoff on engineered landforms derived from expressway construction: A case study of typical steep spoil heap. Catena 2015, 128, 108–121. [Google Scholar] [CrossRef]
- Sharratt, B.S.; Lindstrom, M.J. Laboratory simulation of erosion from a partially frozen soil. In Soil Erosion; American Society of Agricultural and Biological Engineers: Honolulu, HI, USA, 2001; pp. 159–162. [Google Scholar]
- Pikul, J.L.; Aase, J.K. Fall contour ripping increases water infiltration into frozen soil. Soil Sci. Soc. Am. J. 1998, 62, 1017. [Google Scholar] [CrossRef] [Green Version]
- Ma, Q.; Zhang, K.; Jabro, J.D.; Ren, L.; Liu, H. Freeze–thaw cycles effects on soil physical properties under different degraded conditions in Northeast China. Environ. Earth Sci. 2019, 78, 321. [Google Scholar] [CrossRef]
- Kimaro, D.N.; Poesen, J.; Msanya, B.M.; Deckers, J.A. Magnitude of soil erosion on the northern slope of the Uluguru Mountains, Tanzania: Interrill and rill erosion. Catena 2008, 75, 38–44. [Google Scholar] [CrossRef]
- Wischmeier, W.H.; Smith, D.D. Predicting rainfall erosion losses: A guide to conservation planning. In Agriculture Handbook (USA); Department of Agriculture, Science and Education Administration: Washington, DC, USA, 1978; Volume 537, pp. 5–8. [Google Scholar]
- Xiao, L.; Zhang, Y.; Li, P.; Xu, G.C.; Shi, P.; Zhang, Y. Effects of freeze-thaw cycles on aggregate-associated organic carbon and glomalin-related soil protein in natural-succession grassland and Chinese pine forest on the Loess Plateau. Geoderma 2019, 334, 1–8. [Google Scholar] [CrossRef]
- Xiao, L.; Yao, K.H.; Li, P.; Liu, Y.; Zhang, Y. Effects of freeze-thaw cycles and initial soil moisture content on soil aggregate stability in natural grassland and Chinese pine forest on the Loess Plateau of China. J. Soils Sediments 2019, 20, 1222–1230. [Google Scholar] [CrossRef]
- Øygarden, L. Rill and gully development during extreme winter runoff event in Norway. Catena 2003, 50, 217–242. [Google Scholar] [CrossRef]
- Saxton, K.E.; Mccool, D.K.; Papendick, R.I. Slot mulch for runoff and erosion control. J. Soil Water Conserv. 1981, 36, 44–47. [Google Scholar]
- Sun, B.Y.; Xiao, J.B.; Li, Z.B.; Ma, B.; Zhang, L.T.; Huang, Y.L.; Bai, L.F. An analysis of soil detachment capacity under freeze-thaw conditions using the Taguchi method. Catena 2018, 162, 100–107. [Google Scholar] [CrossRef]
- Ferrick, M.G.; Gatto, L.W. Quantifying the effect of a freeze–thaw cycle on soil erosion: Laboratory experiments. Earth Surf. Process. Landf. 2005, 30, 1305–1326. [Google Scholar] [CrossRef]
- Wang, T.; Li, P.; Ren, Z.P.; Xu, G.C.; Li, Z.B.; Yang, Y.Y.; Yao, J.W. Effects of freeze-thaw on soil erosion processes and sediment selectivity under simulated rainfall. J. Arid Land 2017, 9, 234–243. [Google Scholar] [CrossRef] [Green Version]
- Asadi, H.; Ghadiri, H.; Rose, C.W. An investigation of flow-driven soil erosion processes at low streampowers. J. Hydrol. 2007, 342, 134–142. [Google Scholar] [CrossRef] [Green Version]
- Asadi, H.; Moussavi, A.; Ghadiri, H. Flow-driven soil erosion processes and the size selectivity of sediment. J. Hydrol. Amst. 2011, 406, 73–81. [Google Scholar] [CrossRef] [Green Version]
- Bao, Y.X.; Wang, X.; Zhou, L.L.; Chen, Z.Q.; Zhang, K. A study on the temporal and spatial evolutionary processes of the dynamic responses of hydrodynamic erosion parameters on freeze-thaw slopes. J. Soil Water Conserv. 2017, 31, 103–110. [Google Scholar]
- Layton, J.B.; Skidmore, E.L.; Thompson, C.A. Winter-associated changes in dry-soil aggregation as influenced by management. Soil Sci. Soc. Am. J. 1993, 57, 1568. [Google Scholar] [CrossRef]
- Bullock, M.S.; Nelson, S.D.; Kemper, W.D. Soil Cohesion as affected by freezing, water content, time and tillage. Soil Sci. Soc. Am. J. 1988, 52, 770. [Google Scholar] [CrossRef] [Green Version]
- Bochove, E.V.; Danielle, P.; Pelletier, F. Effects of freeze-thaw and soil structure on nitrous oxide produced in a clay Soil. Soil Sci. Soc. Am. J. 2000, 64, 1638–1643. [Google Scholar] [CrossRef]
- Dagesse, D.F. Freezing-induced bulk soil volume changes. Can. J. Soil Sci. 2010, 90, 389–401. [Google Scholar] [CrossRef] [Green Version]
- Sahin, U.; Anapali, O. Short communication: The effect of freeze-thaw cycles on soil aggregate stability in different salinity and sodicity conditions. Span. J. Agric. Res. 2007, 5, 431–434. [Google Scholar] [CrossRef]
- Cheng, Y.T.; Li, P.; Xu, G.C. The effect of soil water content and erodibility on losses of available nitrogen and phosphorus in simulated freeze-thaw conditions. Catena 2018, 166, 21–33. [Google Scholar] [CrossRef]
- Wang, S.J. Characteristics of freeze and thaw weathering and its contribution to sediment yield in middle Yellow River basin. Bull. Soil Water Conserv. 2004, 24, 1–5. [Google Scholar]
- Zhang, R.F.; Wang, X.; Fan, H.M.; Zhou, L.L.; Wu, M.; Liu, Y.H. Study on the regionalization of freeze-thaw zones in China and the erosion characteristics. Sci. Soil Water Conserv. 2009, 7, 24–28. [Google Scholar]
- Wang, F.; Fan, H.M.; Guo, C.J.; Zhou, L.L.; Wu, M.; Liu, Y.H.; Chen, Y.B. Comparison and analysis of climate and environment variation in two main freeze-thaw erosion regions in China. Ecol. Environ. 2008, 1, 173–177. [Google Scholar]
- Bryan, R.B. Soil erodibility and processes of water erosion on hillslope. Geomorphology 2000, 32, 385–415. [Google Scholar] [CrossRef]
- Knapen, A.; Poesen, J.; Govers, G.; Gyssels, G.; Nachtergaele, J. Resistance of soils to concentrated flow erosion: A review. Earth Sci. Rev. 2007, 80, 75–109. [Google Scholar] [CrossRef]


| State of Slope | Treatment | Depth of Sand (cm) | Flow Rate (L/min) | Slope (°) | Initial Soil Moisture Content (%) | Time (min) |
|---|---|---|---|---|---|---|
| Unfrozen slopes (US) | U0 | 0 | 1 | 12 | 15 | 15 |
| U1 | 1 | 1 | 12 | 15 | 15 | |
| U2 | 2 | 1 | 12 | 15 | 15 | |
| U3 | 3 | 1 | 12 | 15 | 15 | |
| Frozen slopes (FS) | F0 | 0 | 1 | 12 | 15 | 15 |
| F1 | 1 | 1 | 12 | 15 | 15 | |
| F2 | 2 | 1 | 12 | 15 | 15 | |
| F3 | 3 | 1 | 12 | 15 | 15 |
| Treatment | Initial Runoff Time/(s) | Runoff | Sediment Yield | ||
|---|---|---|---|---|---|
| Total Runoff/L | CV/(%) | Total Sediment Yield/kg | CV/(%) | ||
| U0 | 39.38 | 9.64 | 22.14 | 0.93 | 27.80 |
| U1 | 138.01 | 11.01 | 14.05 | 3.13 | 31.67 |
| U2 | 186.36 | 11.3 | 15.51 | 4.03 | 51.16 |
| U3 | 250.58 | 10.69 | 20.67 | 4.59 | 63.3 |
| F0 | 24.45 | 13.82 | 2.48 | 7.76 | 3.33 |
| F1 | 31.91 | 14.18 | 6.17 | 8.23 | 26.34 |
| F2 | 34.02 | 13.46 | 13.86 | 10.04 | 26.22 |
| F3 | 32.41 | 12.24 | 11.93 | 10.17 | 35.22 |
| Treatment | Fitted Equation | MC | |
|---|---|---|---|
| U0 | M = 0.093 Q + 0.029 | R2 = 0.997, p < 0.001 | 0.31 |
| U1 | M = 0.283 Q − 0.016 | R2 = 0.990, p < 0.001 | |
| U2 | M = 0.397 Q − 0.035 | R2 = 0.972, p < 0.001 | |
| U3 | M = 0.465 Q + 0.263 | R2 = 0.930, p < 0.001 | |
| F0 | M = 0.565 Q + 0.001 | R2 = 0.999, p < 0.001 | 0.67 |
| F1 | M = 0.593 Q − 0.361 | R2 = 0.987, p < 0.001 | |
| F2 | M = 0.740 Q + 0.566 | R2 = 0.986, p < 0.001 | |
| F3 | M = 0.778 Q + 1.003 | R2 = 0.993, p < 0.001 | |
| Treatment | Distance from the Top of the Slope E/m | Fitted Equation | |||
|---|---|---|---|---|---|
| 0.5 | 1 | 1.5 | 2 | ||
| U0 | 0.26 | 0.29 | 0.29 | 0.32 | VU = 0.071E + 0.212 R2 = 0.893, p > 0.05 |
| U1 | 0.21 | 0.27 | 0.33 | 0.29 | |
| U2 | 0.22 | 0.31 | 0.31 | 0.35 | |
| U3 | 0.23 | 0.33 | 0.37 | 0.39 | |
| F0 | 0.19 | 0.20 | 0.26 | 0.33 | VF = 0.091E + 0.146 R2 = 0.952, p < 0.05 |
| F1 | 0.18 | 0.21 | 0.31 | 0.37 | |
| F2 | 0.19 | 0.22 | 0.29 | 0.28 | |
| F3 | 0.24 | 0.25 | 0.33 | 0.32 | |
| Treatment | Distance from the Top of the Slope E/m | Fitted Equation | |||
|---|---|---|---|---|---|
| 0.5 | 1 | 1.5 | 2 | ||
| U0 | 283.55 | 194.56 | 172.46 | 181.68 | ReU = −135.01E + 484.59 R2 = 0.712, p > 0.05 |
| U1 | 570.51 | 380.66 | 433.42 | 309.84 | |
| U2 | 636.61 | 375.33 | 371.24 | 392.56 | |
| U3 | 587.71 | 463.96 | 388.73 | 410.48 | |
| F0 | 518.21 | 499.82 | 444.29 | 430.38 | ReF = −57.09E + 489.25 R2 = 0.998, p < 0.01 |
| F1 | 433.68 | 410.35 | 340.95 | 350.17 | |
| F2 | 396.99 | 499.04 | 399.28 | 347.70 | |
| F3 | 488.91 | 328.52 | 326.88 | 371.09 | |
| Treatment | Distance from the Top of the Slope E/m | Fitted Equation | |||
|---|---|---|---|---|---|
| 0.5 | 1 | 1.5 | 2 | ||
| U0 | 3.37 | 4.47 | 4.67 | 5.32 | FrU = 1.488E + 1.656 R2 = 0.899, p > 0.05 |
| U1 | 1.86 | 2.89 | 3.67 | 3.66 | |
| U2 | 1.40 | 3.74 | 3.76 | 4.34 | |
| U3 | 1.76 | 2.98 | 4.07 | 4.29 | |
| F0 | 1.35 | 1.45 | 1.92 | 3.18 | FrF = 1.362E + 0.656 R2 = 0.956, p < 0.05 |
| F1 | 1.25 | 1.68 | 3.39 | 4.03 | |
| F2 | 1.37 | 1.62 | 2.72 | 2.86 | |
| F3 | 1.74 | 2.38 | 3.56 | 3.24 | |
| Treatment | Distance from the Top of the Slope E/m | Fitted Equation | |||
|---|---|---|---|---|---|
| 0.5 | 1 | 1.5 | 2 | ||
| U0 | 0.21 | 0.09 | 0.08 | 0.06 | fU = −0.348E + 0.694 R2 = 0.719, p > 0.05 |
| U1 | 0.72 | 0.25 | 0.13 | 0.13 | |
| U2 | 1.04 | 0.14 | 0.13 | 0.09 | |
| U3 | 0.65 | 0.24 | 0.11 | 0.09 | |
| F0 | 1.71 | 1.57 | 0.85 | 0.26 | fF = −0.754E + 1.695 R2 = 0.972, p < 0.05 |
| F1 | 1.57 | 0.95 | 0.33 | 0.16 | |
| F2 | 1.18 | 1.09 | 0.45 | 0.36 | |
| F3 | 0.78 | 0.43 | 0.17 | 0.19 | |
| Runoff/L | Hydraulic Parameters | |||
|---|---|---|---|---|
| V/(m/s) | Re | Fr | f | |
| US | R = −6.394V + 2.559 | R = 0.0033Re − 0.443 | R = −0.278Fr + 1.788 | R = 1.207f + 0.445 |
| R2 = 0.813, p < 0.01 | R2 = 0.725, p < 0.01 | R2= 0.767, p < 0.01 | R2 = 0.655, p < 0.01 | |
| FS | R = −1.474V + 1.273 | R = 0.0013Re + 0.437 | R = −0.084Fr + 1.141 | R = 0.167f + 0.791 |
| R2 = 0.787, p < 0.01 | R2 = 0.85, p < 0.01 | R2 = 0.866, p < 0.01 | R2 = 0.668, p < 0.01 | |
© 2020 by the authors. Licensee MDPI, Basel, Switzerland. This article is an open access article distributed under the terms and conditions of the Creative Commons Attribution (CC BY) license (http://creativecommons.org/licenses/by/4.0/).
Share and Cite
Su, Y.; Li, P.; Ren, Z.; Xiao, L.; Wang, T.; Zhang, Y. Slope Erosion and Hydraulics during Thawing of the Sand-Covered Loess Plateau. Water 2020, 12, 2461. https://doi.org/10.3390/w12092461
Su Y, Li P, Ren Z, Xiao L, Wang T, Zhang Y. Slope Erosion and Hydraulics during Thawing of the Sand-Covered Loess Plateau. Water. 2020; 12(9):2461. https://doi.org/10.3390/w12092461
Chicago/Turabian StyleSu, Yuanyi, Peng Li, Zongping Ren, Lie Xiao, Tian Wang, and Yi Zhang. 2020. "Slope Erosion and Hydraulics during Thawing of the Sand-Covered Loess Plateau" Water 12, no. 9: 2461. https://doi.org/10.3390/w12092461