1. Introduction
Compared to surface water, groundwater offers the beneficial features of high reliability, year-round availability and easy access at the place of use. Thus, groundwater has become an important resource for irrigation in arid and semi-arid areas worldwide, covering about 43% of water use in global irrigation [
1]. On the other hand, the beneficial feature of easy access leads to the dispersed nature of groundwater use, which makes it much more difficult to monitor and control. Overpumping is common and causes continuous groundwater level decline in many regions. It is estimated that about 20% of the total groundwater abstraction world-wide is not sustainable [
2]. Serious environmental problems such as drying up of wetlands and streams, land subsidence, saltwater intrusion, and others are the consequences, e.g., [
3,
4,
5]. The most direct impact of declining groundwater levels on irrigation is the increase in energy cost due to a decrease in well yield and an increase in energy consumption to pump one unit of water volume, e.g., [
6,
7]. Finally, the decrease of groundwater storage leads to the loss of its function as a buffer during droughts.
Effective management to achieve sustainable groundwater use is based on the premise that groundwater abstraction is monitored and quantified reliably. Monitoring data allow to study the groundwater balance in detail and to assess the sustainability of groundwater use under different management interventions e.g., [
8,
9]. Lack of groundwater abstraction data undermines the ability to formulate suitable policies and implement effective management. It usually can be attributed to lack of financial and technical support or resistance from users [
10]. Due to the “invisible” nature of groundwater and difficulties in monitoring and control, trade-offs have to be made between measurement accuracy, monitoring cost and ease of implementation. This aspect has not been covered sufficiently by previous research.
The cheapest method of directly metering abstraction, using mechanical meters at the outlet pipe of a pump, is the most vulnerable and notorious for tampering. It is not used any more by the Chinese water administration. A more advanced method, the smart water meter operated by swipe card, is basically tamper proof, as it is connected in real time to a server, where its functioning can be verified several times a day. However, the application of such a metering system is limited by installation and maintenance cost [
11,
12,
13]. Only in few cases has smart water metering been implemented in agriculture, and the approach proved successful only where sufficient and sustainable financial and technical resources were available to maintain the system. Some successful cases can be found in Jordan, Oman, Iran and northwest China [
14,
15,
16,
17,
18,
19,
20,
21].
Indirect methods use proxies to estimate abstraction volume, e.g., traditionally irrigation time and area irrigated. However, estimates of water use based on crop area and irrigation norms are rather inaccurate as water applied to a unit area of a crop can vary substantially from field to field, even if weather and soil conditions are identical. In connection with remote sensing methods the approach can still yield good results [
22,
23,
24] provided remote sensing data of sufficient quality and quantity are available and accessible. The most important proxy for groundwater use is energy consumption, which is in a good approximation proportional to water abstraction. For any electricity powered groundwater abstraction, using electric energy consumption as a proxy offers a solution to solve the problems of maintenance and acceptance, as electricity is usually metered for fee collection and the metering is well accepted. Electricity meters generally require less effort in maintenance than water meters.
The key component in indirect abstraction monitoring is the conversion from proxy to water volume pumped. The conversion determines the accuracy of the monitoring strategy. Constant yearly conversion factors over a region (e.g., at village, country and basin levels) have been commonly used to relate energy consumption and groundwater abstraction in previous studies [
25,
26,
27,
28]. Such a conversion can be based on the theoretical relation between lift, energy use and pumping rate. However, heterogeneity in hydrogeological conditions and the variability of types, ages and working conditions of pumps lead to large deviations of the actual relation from the theoretical one. Field experiments present a more reliable method to obtain the actual relation between energy consumed and water volume pumped. Despite its importance in the quantification of groundwater abstraction, studies that look into energy-to-water conversion are hardly found in recent decades. Most of the previous studies were carried out before the 1990s in the US [
29,
30,
31,
32].
In many areas of intensive agricultural pumping such as India, Pakistan, and China, groundwater is extracted through huge numbers of wells of small capacity [
33,
34]. In the North China Plain, for example, groundwater abstraction has increased drastically due to the decrease in availability of surface water over recent decades, and the simultaneous introduction of winter wheat/summer maize double cropping. The difficulties of implementing a monitoring approach lie in the large number and small capacity of pumping wells. The typical irrigation well that extracts water from the shallow unconfined aquifer in the North China Plain covers an irrigation area of only 20 to 80 mu (1.3 to 5.3 hectares). The farmland owned by one farming family is only about 1/3 of a hectare, thus one well is usually shared by several households. Wells, pumps and water-conveying pipes are primitive so that additional investment for updating the pumping infrastructure is needed before modern smart water metering systems can be installed. The conditions are quite different from the situation in Europe, the US, Mexico and even Northwest China where agricultural wells are fewer in number, larger in capacity, and owned and controlled by a small fraction of the population [
33]. Monitoring and quantification of groundwater abstraction in these regions is feasible through direct monitoring of pumping activity. In contrast, any monitoring or control action on the small wells in the North China Plain involves millions of individual users, which greatly complicates an effective abstraction management. Thus, the case study of a typical county in the North China Plain has fundamental implications for the praxis of groundwater abstraction monitoring, not only for the whole of the North China Plain but also for comparable regions in the developing world.
In this paper, a study of Guantao County in the North China Plain is presented, which illustrates the feasibility and application of groundwater abstraction monitoring using electric energy as a proxy. Monitoring methods based on the existing electric power monitoring system are introduced in
Section 2. The quantification of groundwater abstraction, i.e., the method and accuracy of the conversion from electric energy consumption to groundwater abstraction, is introduced in detail in
Section 3.1 and
Section 3.2, based on which the applicability of groundwater abstraction monitoring in modelling and control is discussed in
Section 3.3 and
Section 3.4. Conclusions are given in the final section.
2. Materials and Methods
2.1. Study Area
Guantao County is located in the southern part of Hebei Province in the North China Plain. It has an area of 456 km
2 (
Figure 1) containing 277 villages. Guantao County is a typical agricultural county in the North China Plain facing the problem of groundwater over-exploitation.
Due to the lack of surface water and the scarcity of rainfall in the growing period of winter wheat (from October to June the following), groundwater is the main source of irrigation water for winter wheat. Supplemental irrigation is also needed for summer maize in drier years when rain is insufficient in the key growing stages (from June to September) [
35,
36]. There are more than 8000 irrigation wells in Guantao County, most of which pump groundwater from the shallow unconfined aquifer, while the rest exploit the deep confined aquifer or lift surface water from canals. The irrigation area served by each shallow well is small, on average 3.3 hectares. The amount of water pumped is not metered due to the usually primitive condition of the wells and high cost of both investment and maintenance of a metering system. A typical well is shown in
Figure 2a.
In Guantao County, the Department of Water Resources (DWR) is responsible for groundwater management. The groundwater control policy released in 2017 entitles farmers to pump groundwater not exceeding a water quota of 296 m
3/mu/year (1 mu = 1/15 ha) [
37]. Water tax is collected for the amount of water in excess of the water quota on a yearly basis [
38]. Effective groundwater abstraction monitoring is the prerequisite to implement the groundwater control measures.
The existing electricity metering system is the fundamental infrastructure for groundwater abstraction monitoring. Electric power is supplied and managed by Guantao Electric Power Supply Company (EPSC) which is affiliated with the State Grid Corporation of China. The EPSC is in charge of 11 Electric Power Supply Agencies (EPSA) at district level. The control area of an EPSA is generally determined according to the administrative boundaries of eight townships in Guantao; and one or two EPSA districts cover the area of one township. Each EPSA manages the electric power supply of about 20 villages. In each village, one or two electricians employed by EPSA are responsible for power infrastructure maintenance.
All irrigation wells are equipped with electricity meters, most of which are traditional mechanical electricity meters without data transmission (
Figure 2b). It is expected that by 2020, all pumping wells will be equipped with smart electricity meters with daily remote data transmission. The electricity fee is collected by the well manager on a monthly basis, according to the energy consumption records of individual farmers. All fees are then transferred to EPSC through the village electricians. This system could also be the basis for pumping control by collecting electricity-proportional water fees.
In this study, the analysis of electricity-to-water conversion focuses on shallow wells, as groundwater from the shallow unconfined aquifer is the main source of irrigation water in Guantao County. The control area of Shoushansi EPSA (located in Shoushansi Township, see
Figure 1) was selected as the pilot area as all the wells in this area are shallow wells. The depth to static groundwater table is around 30 m (±6 m). Groundwater is conveyed by flexible plastic pipe or underground pipe to the field for flood irrigation. Sprinklers are used at very few locations.
2.2. Field Tests for Electricity-to-Water Conversion
The key technical component of indirect monitoring of groundwater abstraction is the conversion from the proxy measurement of electric energy consumed to water volume pumped. The most straightforward way is to use a conversion factor that represents the relation between the two quantities:
where
is the water volume pumped (m
3);
is the measured electric energy consumption for pumping (kWh); and
is the electricity-to-water conversion factor (m
3/kWh). Use of a static conversion factor would be justified if the relation between the energy consumed and the water volume pumped was constant in space and time. In reality, this is not the case, e.g., due to heterogeneity of hydrogeological conditions, pumps’ working conditions and seasonal changes in groundwater levels. Field experiments can serve to verify whether or to which degree of accuracy the use of a static conversion factor is justified.
Two types of field experiments were used to determine the conversion factor: (1) electricity-to-water pumping tests on single wells, (2) continuous pseudo pumping tests by water and energy metering devices on single wells.
• Electricity-to-water pumping tests on single wells
The pumping test measures flow rate of pumped groundwater and the corresponding electric power of the pump. Theoretically, water volume and electricity consumption should be measured over the same period of time to determine the electricity-to-water conversion factor. This is difficult to achieve in reality due to the limited testing time and the usually large distance between electricity meter and measuring point of the water volume. A solution is offered by measuring electric power input and flow rate separately instead, and calculate the conversion factor as:
where
is the pumping rate (m
3/h) and
is the electric power input (kW). Power input was calculated as electricity consumption divided by the corresponding time period. Flow rate was measured by a portable ultrasonic flow meter or by the volumetric method.
Electricity-to-water pumping tests have been performed at 281 wells in the pilot area. The pumping tests were done in four groups in March and June 2016, March 2017 and March 2018. Data of additional explanatory variables such as irrigation method, pump’s rated power and age, depth to groundwater table were also collected wherever it was possible. After switching on the pump, the flow rate decreases with falling water level in the well. Only when the rate of decrease levels off (i.e., the well water level approaches a new steady state), the flow rate is recorded. This usually takes about 10 min and determines the minimum time needed for a pumping test. Flow rate was measured at the outlet of the pipe in the well tube wherever it was possible or otherwise at the outlet of the conveying pipe in the irrigated field.
• Continuous pseudo pumping tests using smart flow meters and electricity meters
Continuous pseudo pumping tests on single wells can be performed by smart meters with data transmission. Both groundwater abstraction and electricity consumption were measured and transmitted to the data platform at a frequency of at least once per hour. The energy-to-water conversion factor can be calculated as the ratio of groundwater abstraction and energy consumption in the same time interval:
where
and
are water volume pumped and electricity consumed in time interval
, respectively. This method is only applicable in places where the well conditions are suitable for installing the metering device. 6 locations were selected to do the continuous pseudo pumping tests using three pairs of water meters from three different manufacturers. Due to the conditions of the tested wells, the groundwater level could only be recorded at one location.
2.3. Groundwater Abstraction Monitoring Strategies
Considering data accuracy and the efforts in data collection, two indirect abstraction monitoring methods using electric energy as proxy were proposed and analysed:
• Energy metering plus pumping tests on all wells
Electric energy consumption of every well is metered by EPSC’s system of electricity fee collection. Pumping tests are done to determine the electricity-to-water conversion factor of each well. Groundwater abstraction of each well is estimated by converting its electric energy consumption with its tested conversion factor.
• Energy metering plus pumping tests on selected wells
Electric energy consumption of every well is metered by EPSC’s system of electricity fee collection. Pumping tests are performed on a set of representative wells to determine an average electricity-to-water conversion factor. Groundwater abstraction of each well is estimated by converting its electric energy consumption with the average conversion factor.
Direct abstraction monitoring by smart water meters on individual wells is also analysed for comparison. Four pairs of smart water meters (mechanical water meters or clamp-on ultrasonic water meters) from four manufacturers were deployed on eight wells in Shoushansi District to explore the feasibility of direct water metering strategy in the study area. Smart meters at 6 out of 8 locations served as continuous pseudo pumping tests as described in
Section 2.2.
3. Results
3.1. Spatial and Temporal Variability of Conversion Factors
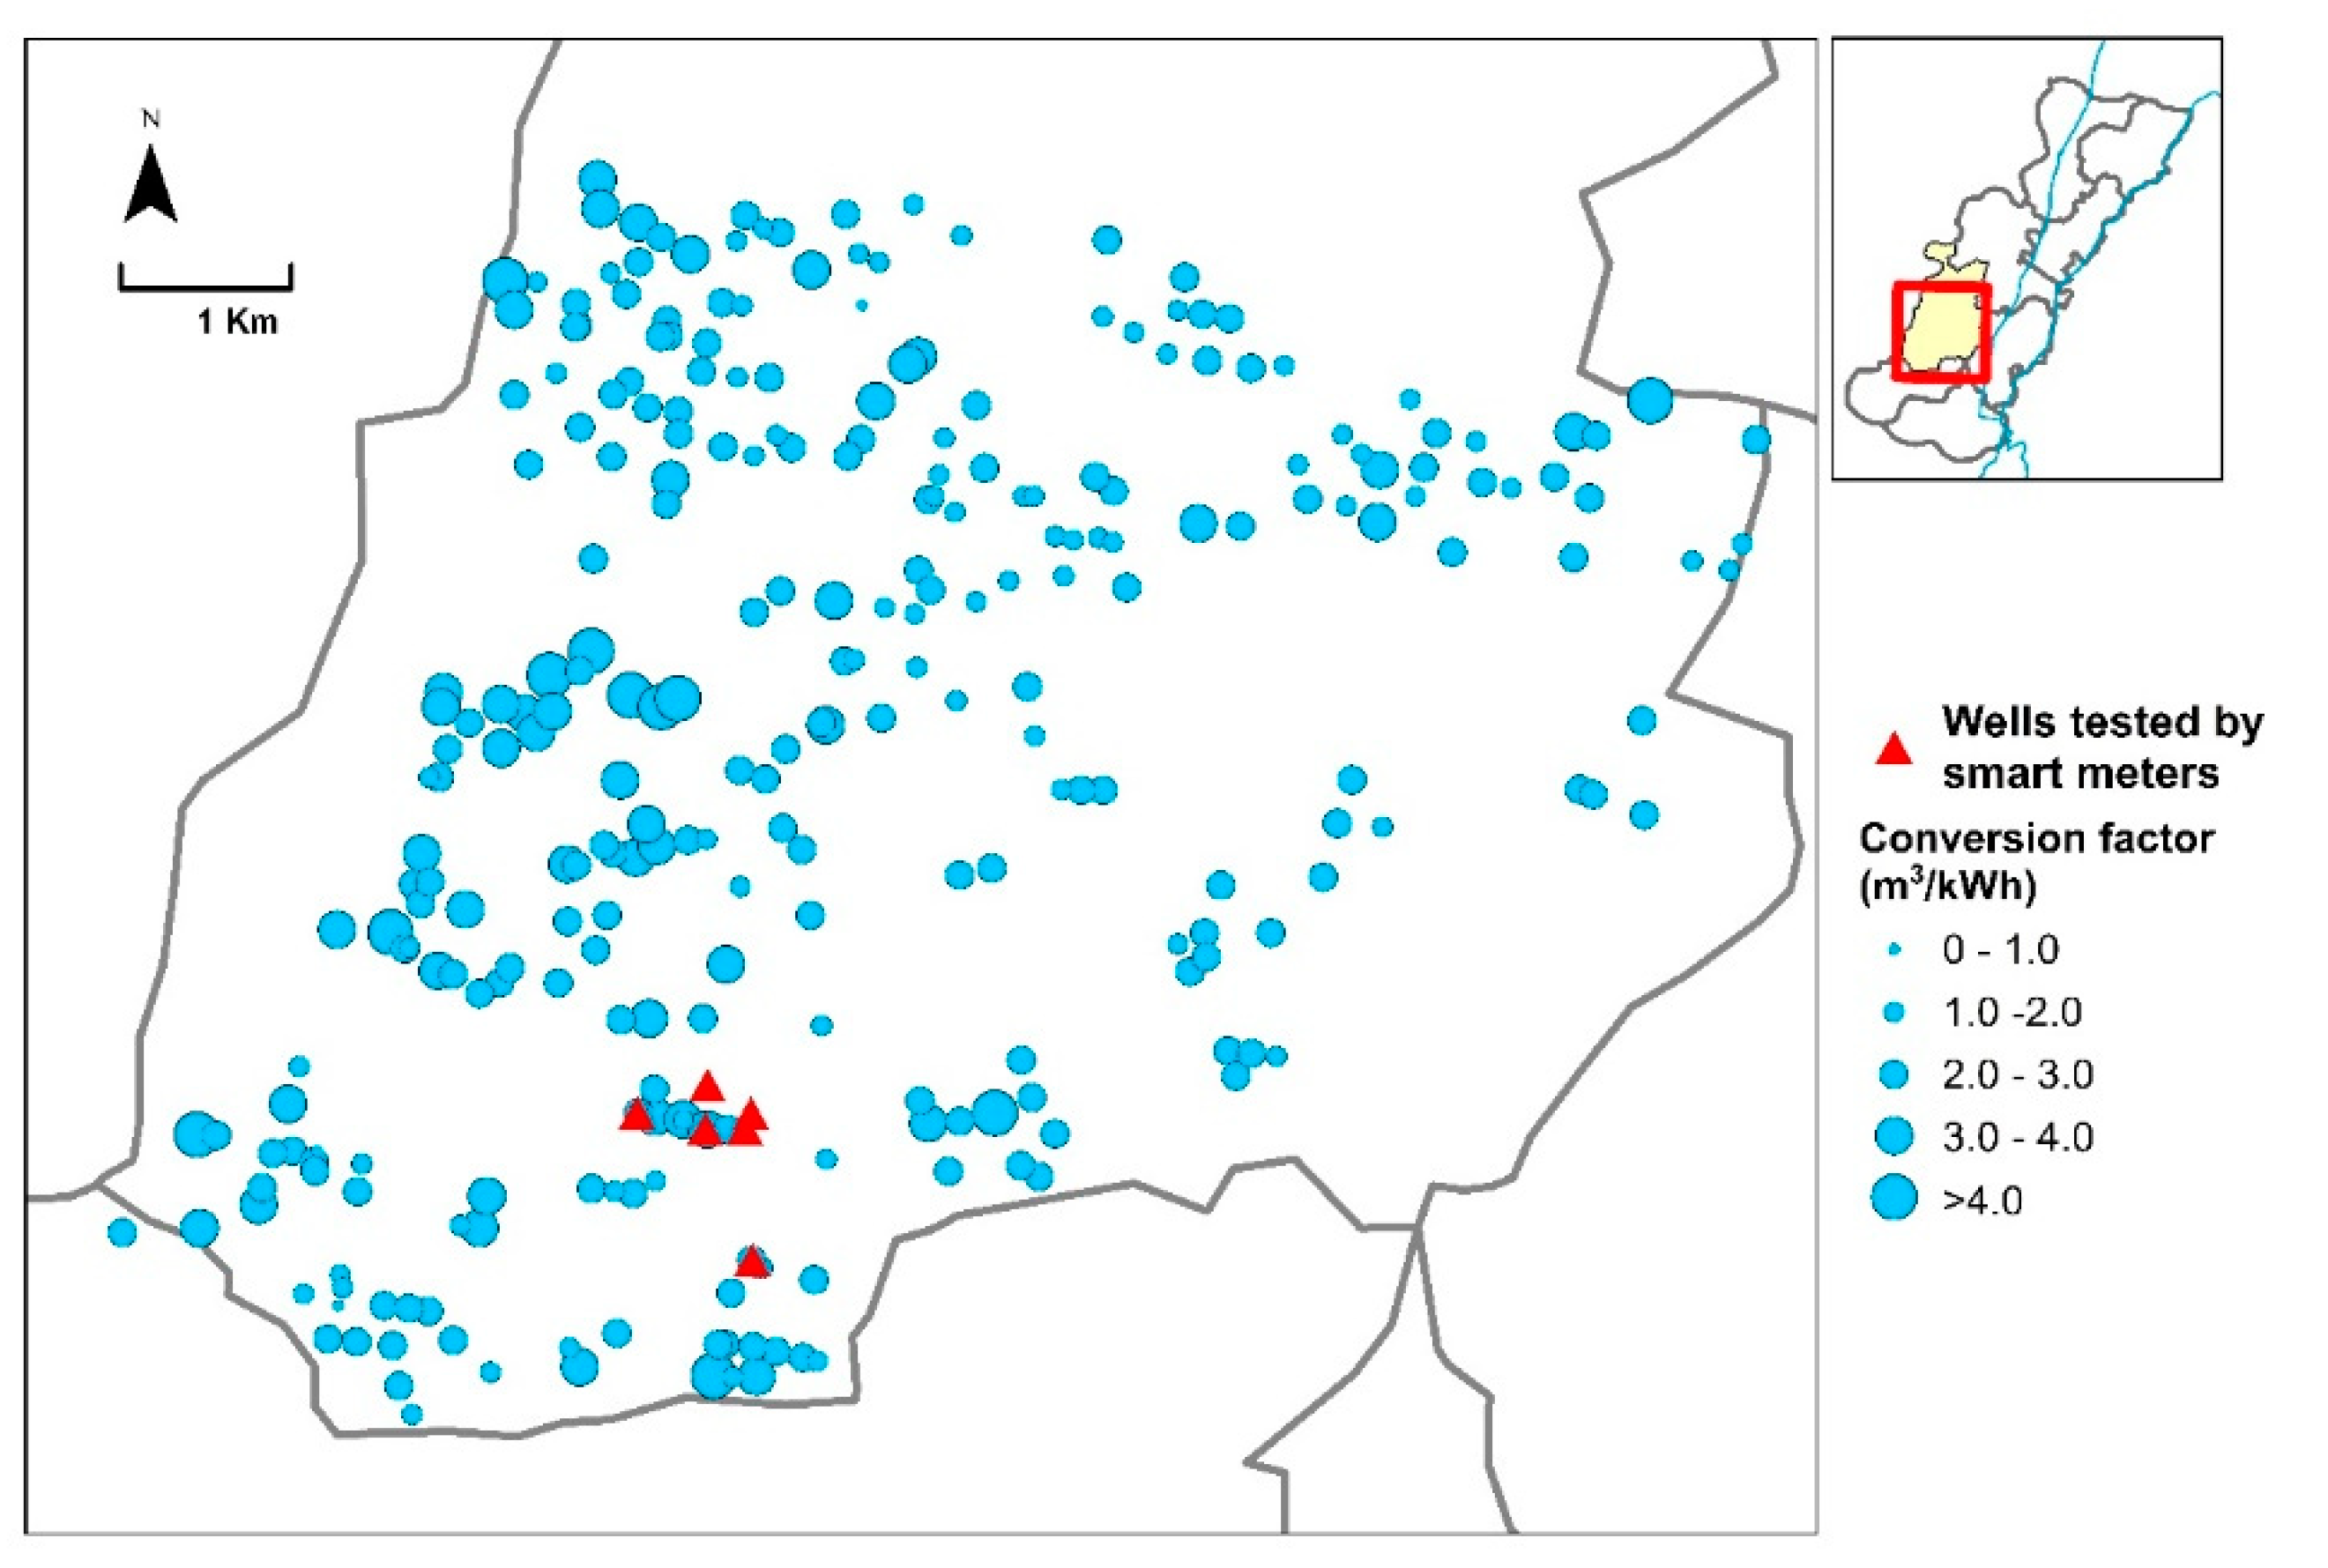
The results of the electricity-to-water pumping tests in the pilot area reveal the spatial variability of conversion factors among wells (
Figure 3). For the wells that have been tested more than once, the conversion factor shown is the average of the measurements at different times. The spread of the conversion factors between individual wells is large with most of the values varying between 1 m
3/kWh and 4 m
3/kWh.
This implies that using a uniform (average) conversion factor is not adequate for deriving the groundwater abstraction of an individual well within an acceptable error. The variability of the conversion factor has various causes including the hydrogeological conditions, the manufacturer, model and age of the pumps, and the accuracy of the input power and flow rate measurements. Transmissivity varies between wells not only due to hydrogeological conditions but also due to well characteristics e.g., (diameter, depth, and drilling technique used). Further, the choice of pump type is often not optimal, as farmers tend to overpower their wells.
To get an overview of which parameters have the greatest influence on the conversion factor, a correlation matrix was computed from the pumping test measurements (
Table 1). The conversion factor exhibits the highest correlation with the pumps’ input power and rated power. A linear relationship also exists between the conversion factor and the depth to dynamic water table, and a slightly weaker one with the depth to static water table. The other parameters’ correlation with the conversion factor is weaker.
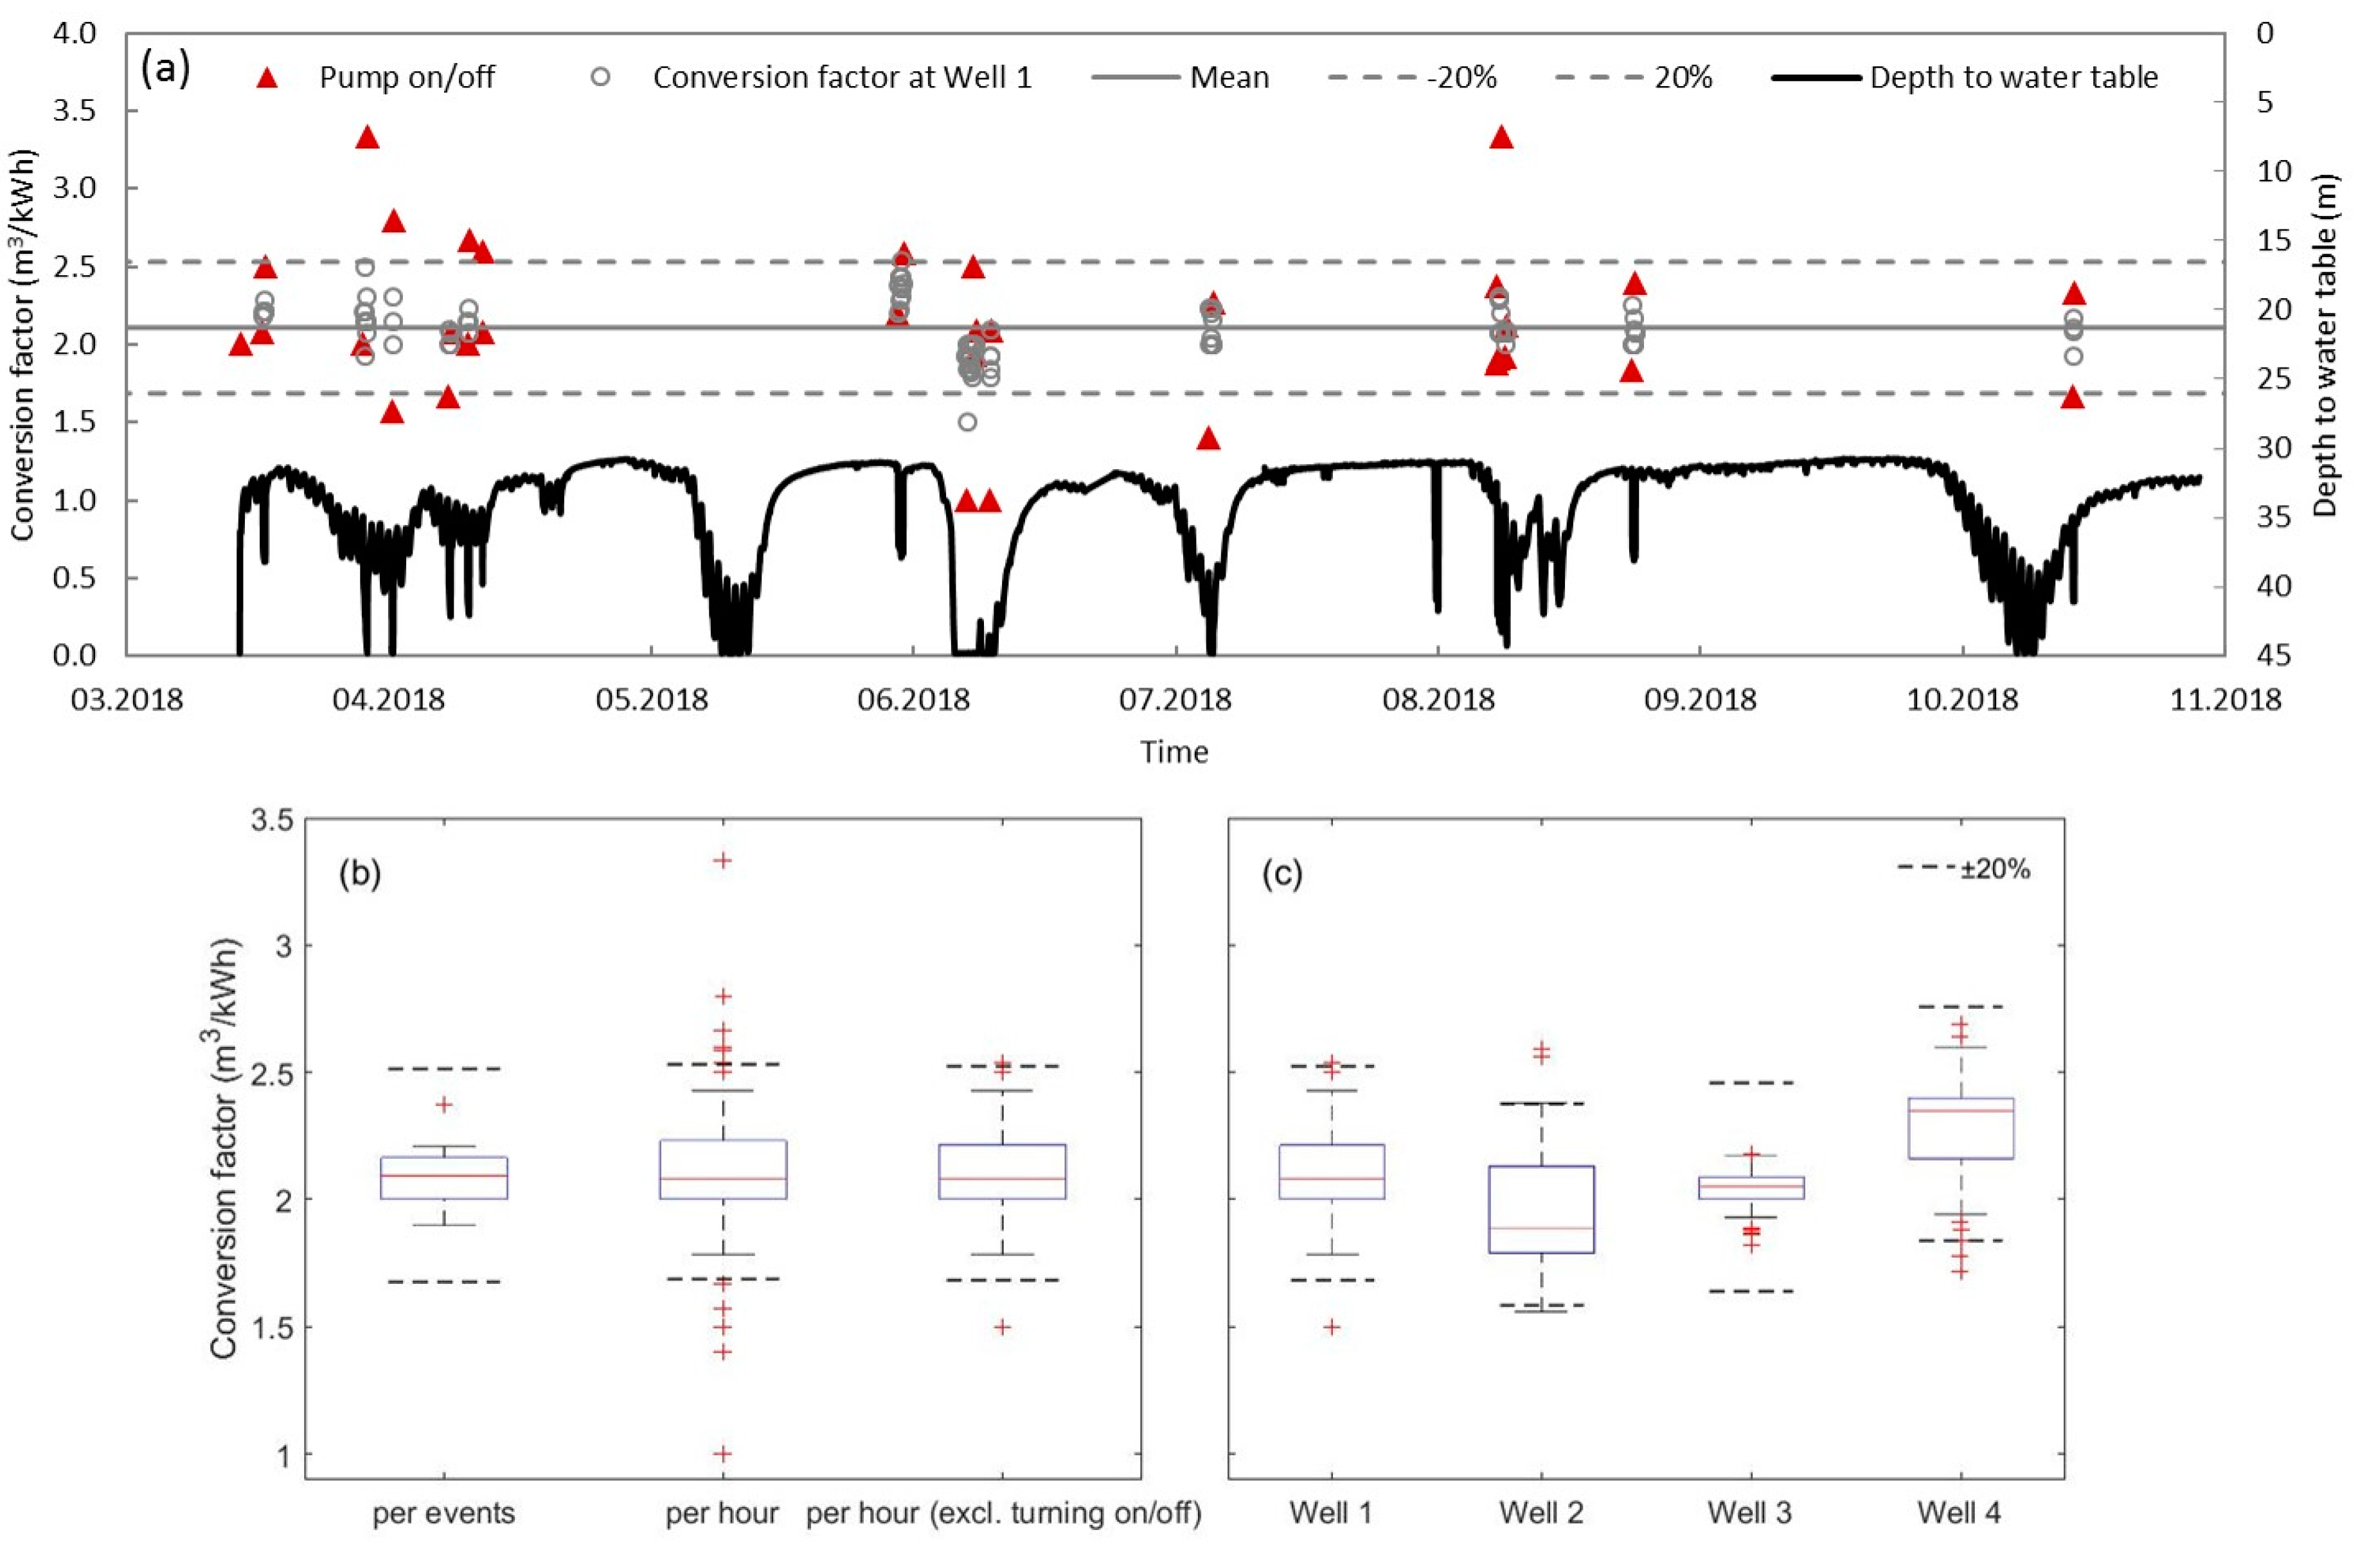
An electricity-to-water pumping test determines the conversion factor of a well at a specific time. The cyclical fluctuations of groundwater levels lead to changes in the pumps’ working lift, which will hence cause a temporal variability of the conversion factor. The magnitude of this temporal variability can be revealed by the measurements of pseudo continuous pumping tests using the smart metering devices on selected wells. The length of the monitoring period at six locations ranges from three months to seven months covering at least two irrigation cycles.
The conversion factors at one well with the longest monitoring period (Well 1) are shown in
Figure 4 as an example. The hourly conversion factor at this location generally varied within ±20% of the yearly average. Outliers occurred when the pump was turned on or off (see triangles in
Figure 4a). Lower outliers are caused by power surges when switching the pump on or off, while higher outliers are caused by measurement errors of the ultrasonic flow meters when the pipe contains significant amounts of air. They have to be excluded from the computation of the conversion factor. There are seasonal fluctuations in groundwater level leading to temporal variations of the conversion factor. The groundwater level reached its lowest point in June of 2018 and the corresponding conversion factor was smaller than in other irrigation seasons. A negative correlation between conversion factor and depth to groundwater table implies that more energy is needed per unit of water volume pumped when the groundwater table is lower. To analyze the seasonal variation, conversion factors were calculated for each pumping event, and the time series between pumps being turned on and off was taken as one pumping event. The seasonal variation is within approximately ±15% of the yearly average (
Figure 4b).
The conversion factors (excluding the measurements when turning the pump on or off) at other three locations also stayed within 20% of the yearly average (
Figure 4c) with very few outliers. This suggests that pumping tests performed in whichever irrigation season result in a conversion factor with a relative error of less than 20%. Exceptions due to malfunction of water meters occurred at Well 5 and Well 6 (provided in the
Supplementary Material). These records also show that a modern system of smart metering can be rather inaccurate due to inappropriate use (e.g., when there are air bubbles in the pipe).
3.2. Accuracy of Abstraction Estimates and Efforts in Data Collection
A procedure for estimating groundwater abstraction ideally should: (1) maintain an acceptable level of accuracy and (2) significantly reduce data collection efforts [
29]. Trade-offs have to be made between accuracy and efforts in data collection in a monitoring system. The key challenges of determining the relation between energy consumption and volume of water pumped in Guantao are: (1) the cyclical fluctuations and long-term declining in groundwater levels and (2) a wide range of conversion factors among wells.
The former leads to the temporal variability of conversion factors, while the latter requires efforts to obtain the spatial distribution of conversion factors at the level of individual wells. To resolve challenge (1) a well should be tested once a year to obtain a yearly conversion factor with an accuracy of 20%. It is recommended to do the test in the middle of an irrigation season to be as close as possible to the yearly average value. Addressing challenge (2), electricity-to-water pumping tests should be carried out for each individual well to achieve an accuracy of pumped volumes within 20% at individual wells. This accuracy is sufficient if pumping records are to be used for water pricing or quota control.
The required number of pumping tests can be much less, when only the aggregated areal groundwater abstraction is needed (e.g., for groundwater balances). Its accuracy depends on the accuracy of the areal conversion factor calculated as the average of tested conversion factors at individual wells. The question on how many wells in a region should be tested to obtain an average conversion factor with a relative error less than a threshold
, e.g., 20%, can be solved using the theory of interval estimation. Approximating the samples of conversion factors by a normal distribution and an unknown population variance
, the statistic:
obeys a t-distribution with
df =
n − 1 degrees of freedom, where
is the sample mean,
is the population mean,
n is the sample size and
S is the sample standard deviation. For a confidence level of 1 −
the minimum sample size
can be determined by satisfying:
is read from the t-distribution table. Taking four villages (
Table 2), in each of which more than 20 wells were tested, as examples, 11 to 16 wells per village need to be tested to obtain an estimate of the average conversion factor within an accuracy of 20% at a confidence level of 95%. This means that on average one fifth of the total number of wells in a village should be tested. The minimum sample size is tripled if the error should be less than 10%.
Two hundred and eighty one (281) wells tested in Shoushansi District were taken as a representative sample of the population of shallow wells in Guantao County. Given the confidence level of 95%, at least 14 wells should be tested in Guantao if the error of the areal mean conversion factor is expected to be less than 20% (
Table 2). The number increases to 46 wells if the error is expected to be less than 10%. Compared to the total of more than 8000 wells in the whole county, the required number of pumping tests is very small. It implies that reliable areal estimates of aggregated groundwater abstraction can be obtained by testing only a small proportion of wells in the region.
To estimate the average conversion factor of shallow wells at county level, pumping tests were carried out at 13 wells outside of Shoushansi District. Taking the average conversion factors of four villages in Shoushansi District (as shown in
Table 2) as four measurements, there are in total 17 measurements evenly distributed over the county (see dots in
Figure 1). From those the average conversion factor of shallow wells in Guantao County is estimated as 2.62 m
3/kWh. The error of this average conversion factor is within 20% given the confidence level of 95%.
3.3. Comparison of Abstraction Monitoring Methods
Direct abstraction monitoring by smart water meters on individual wells is the gold standard for comparison. According to the analysis in
Section 3.2, the methods of indirect monitoring with pumping tests can be further detailed regarding the frequency and quantity of pumping tests. The methods for monitoring 8000 wells in Guantao County are summarized as below:
• Method (1) Direct water metering
Pumped water volume of every well is metered by smart water meter with remote data transmission.
• Method (2) Energy metering plus pumping tests on all wells
Pumping tests are done once per year on all wells to determine the electricity-to-water conversion factor of each well. Groundwater abstraction of each well is estimated by converting its electric energy consumption with its tested conversion factor.
• Method (3) Energy metering plus pumping tests on selected wells
Pumping tests are performed once per year on at least 14 shallow wells, to account for an accuracy of 20% for the estimate of total abstraction from the shallow aquifer at county level, to determine an average electricity-to-water conversion factor. Groundwater abstraction of each well is estimated by converting its electric energy consumption with the average conversion factor.
Four criteria were considered in the comparison: cost, ease of implementation, accuracy and equitability. The results of comparison are shown in
Table 3.
Cost includes the investment and maintenance cost of the metering system for 8000 shallow wells in Guantao County over a life time of five years. The maintenance cost of smart water meters includes the costs for on-site inspection, hardware, data platform and data transmission. For the methods of indirect monitoring, only the operation cost of pumping tests is included as the energy consumption is monitored by an existing metering system and provided free of cost.
Ease of implementation relates to the efforts in data collection, i.e., motivating farmers to cooperate, the workload of hardware and data platform installation and maintenance.
Accuracy regards the level of accuracy, which the monitoring method can achieve at individual wells.
Equitability depends on the accuracy of direct or indirect measurements of abstraction. It expresses whether farmers are charged according to the quantity they actually pumped and whether the control method is transparent and the same for every individual farmer.
Although the method of direct water metering provides high data accuracy and equitability regarding abstraction estimates, it is the most expensive option and difficult to implement. The infrastructural investment of monitoring abstraction on each well is high, because investment is not only needed for flow meters, transmission modules and data management but also for upgrading the pipe system and wellheads at most of the wells. The monitoring system will not work reliably without efficient maintenance, which proved to require huge efforts. All flow meters have to be protected against vandalism, tampering and theft. On-site inspection and data examination are two indispensable parts of maintenance work. Accuracy in the field is much lower than specified in the manuals. Efforts are needed to educate farmers to accept the use of flow meters and to properly use and maintain them. After a 3-year testing period, seven of the eight experimental smart water meters were not functioning due to the various problems described above. Guantao DWR had the same experience on a larger scale. Of 700 smart water meters installed in 2015 only six were still working in early 2018. The experience gathered with the experimental smart water meters raises questions about the feasibility of implementing such a system in a well-intensive region such as the North China Plain.
The cost of indirect monitoring strategies is substantially lower, compared to the direct metering method, because energy consumption of each well is metered by the monitoring system of EPSC for electricity fee collection and only minor costs for pumping tests to determine the electricity-to-water conversion factors arise. An electricity-to-water pumping test, which takes about half an hour, is easy to implement and usually accepted by farmers. The accuracy of indirect monitoring is highly dependent on the accuracy of the electricity-to-water conversion factor. As discussed in
Section 3.2, the error of abstraction estimates of a single well, based on the conversion factor tested by a short-time pumping test on the same well, is less than 20%.
3.4. Application in Groundwater Management
The role of groundwater abstraction monitoring in the management context is twofold: it informs both modelling and control. Clearly, a smart water metering system provides both accuracy and equitability. It has been shown to work in places such as Minqin County in Northwest China [
20]. A water metering system is successful only when the system of water fee/tax collection produces sufficient financial resources to cover the cost of maintenance. The attractiveness of a direct water metering system lies in its potential accuracy and transparency of the measurements. Direct water metering systems can be applied in areas where agricultural wells are few in number and large in capacity. However, our experience in Guantao County suggests that the cost of maintenance necessitates a water fee, which is too high to be acceptable to the poor smallholders. Direct water metering is thus presently infeasible in the North China Plain.
Indirect abstraction monitoring using electric energy as proxy provides sufficient data accuracy for groundwater modelling. The aggregated abstraction on county level derived from the total pumping energy and an average conversion factor determined from pumping tests on selected wells is sufficiently accurate for the calculation of groundwater balances. For a two-dimensional groundwater model, average conversion factors and electricity consumptions on village level are sufficient.
Regarding groundwater control, ease of implementation and system robustness are more important than accuracy, as long as farmers are treated in an equitable way. Indirect metering with pumping tests on all wells achieves slightly lower accuracy than direct water metering and still acceptable equitability, however, at a much superior system robustness and a much lower price. Indirect metering with pumping tests on selected wells is the cheapest method and the easiest to implement. It is weak on equitability regarding water volume, but it is equitable from an energy-saving point of view. Farmers using less efficient pumps and wells are penalized by paying more for the same amount of water, which will push them to more efficient pumps and hence to energy saving. Using a uniform average conversion factor is the equivalent of taxing energy use instead of water use. This system has been applied in Qingxu County, China [
18]. The second method with pumping tests on all wells is a compromise which provides sufficient robustness and yet respects equitability. It is therefore our preferred option. In areas where the number of wells is extremely large, the third method with pumping tests on selected wells is recommended, as it significantly reduces the efforts of data collection but still provides reasonable equitability.
In 2017, Guantao DWR started a dry run of water tax calculation based on the indirect metering method with pumping tests on selected wells. Five selected wells were tested to calculate a uniform average conversion factor to convert energy consumption to groundwater abstraction at every single well. At the end of each year, the annual groundwater abstraction of each well was checked against the water quota. Farmers are supposed to pay water tax for the amount of water pumped that exceeds the water quota at a rate of 0.2 CNY/m3. Up to now, this tax is not collected, but data shows that in 2018 the total groundwater abstraction exceeded the total water quota by 11.7 million m3, which would have generated a total water tax of 2.34 million CNY. This amount of tax is not sufficient to maintain a direct water metering system. It is sufficient to cover the cost of pumping tests on 5200 wells amounting to about 65% of Guantao’s wells with at least 18 wells per village. Alternatively, it is however sufficient for performing pumping tests on all wells in Guantao every second year. Since the water tax of 0.2 CNY/m3 is only collected when farmers pump water exceeding the water quota, the water tax paid by most of farmers is minor compared to their income. This is the first step of introducing the water tax collection method. It is intended to avoid great resistance from farmers. The water quota will gradually be reduced to the sustainable level when farmers start to accept paying a tax for water. If taxing functions as intended and induces farmers to save water, the excess of pumping beyond quota decreases and water tax income will decrease with it. To make a monitoring system sustainable a basic water fee for all abstractions apart from a tax on exceeding quota is necessary. This fee is of course much lower in an indirect metering system based on electricity than in a direct metering system based on smart water meters.
Since the water fee for pumping is generated at the same point as the electricity fee, it is feasible and cost-efficient to collect water fees through the electricity fee collection system, instead of creating a second parallel system. Even in a quota system water fees can be collected proportional to electricity fees if overpayment is reimbursed according to quota at the end of the irrigation season. A system known as “pay first and get reimbursed later” has been experimented with in several villages of Hebei province [
39,
40].
4. Conclusions
Failures of smart water meter systems show that direct water metering is difficult to implement in areas of intensive pumping by numerous smallholders such as the North China Plain. It requires large investment and very high maintenance cost. In contrast, indirect groundwater abstraction metering using energy consumption as proxy is cheaper, more robust and easier to implement. Field experiments in Guantao revealed the large variability of the electricity-to-water conversion factors between individual wells. Therefore, an annual or bi-annual field test at each well is required. The error of electricity-to-water conversion for an individual well based on field test is within 20%. The same accuracy is achieved on spatially aggregated levels such as townships or the whole county with conversion factors averaged over a relatively small number of wells. Trade-offs between data accuracy and efforts in data collection can be made by selecting the number of pumping tests. Energy based groundwater abstraction monitoring substantially reduces the investment and efforts required in system maintenance and data collection. It is thus financially sustainable with the funds provided by the planned water tax collection. Meanwhile, it provides satisfactory data accuracy for use in groundwater modelling and planning.
The methodology is readily transferrable to all regions or countries where wells mainly run on electric energy such as the U.S., Jordan, Iran and Mexico. Diesel pumps are still in use in many areas, e.g., in Pakistan and India. A similar conversion can be achieved by relating the diesel energy and water volume pumped. However, diesel fuel use is not metered. A water tax would have to be added to the fuel price directly. Diesel pumps, though, are gradually replaced by electrical pumps in regions with large depth to water table. In India, there are still areas where pumping electricity of single wells is not metered. Transferring the methodology to these areas would be difficult. Still, in those regions, control of pumping is in practice achieved by the utility shutting off electricity for wells completely. Similarly, solar driven pumps would be difficult to monitor unless they are connected to the grid for selling excess electric energy. In that case, data on total electricity used and electricity delivered to the grid are available and electricity used for pumping can be determined.


