Abstract
Over the past several decades, urban flooding and other water-related disasters have become increasingly prominent and serious. Although the urban rain flood model’s benefits for urban flood simulation have been extensively documented, the impact of rainfall input to model simulation accuracy remains unclear. This systematic review aims to provide structured research on how rain inputs impact urban rain flood model’s simulation accuracy. The selected 48 peer-reviewed journal articles published between 2015 and 2019 on the Web of Science™ database were analyzed by key factors, including rainfall input type, calibration times and verification times. The results from meta-analysis reveal that when a traditional rain measurement was used as the rainfall input, model simulation accuracy was higher, i.e., the Nash–Sutcliffe efficiency coefficient (NSE) of traditional technology for rain measurement was higher than the 0.18 for the new technology rain measurement with respect to flow simulation. In addition, the single-field sub-flood calibration model was better than the multi-field sub-flood calibration model. NSE was higher than 0.14. The precision was better for the verification period; NSE of the calibration value showed a 0.07 higher verification value on average in flow simulation. These findings have certain significance for the development of future urban rain flood models and propose the development direction of the future urban rain flood model. Finally, in view of the rainfall input problem of the urban storm flood model, we propose the future development direction of the urban storm flood model.
1. Introduction
The frequent occurrence of urban flood events has caused severe losses to human life and property worldwide [1]. Climate change and the urban rain island effect have exacerbated the problem via increasing occurrence of extreme rainfall events [2]. Continuous development and expansion of cities have led to the transformation of natural permeable surfaces into impervious underlay surfaces, which accelerate the formation of runoff [3]. At the same time, continuous economic development has led to more severe flood losses [4]. The increasing complexity and harmfulness of urban flood events have made urban rain and flood issues important research topics. The basis of the study of urban rain and flood problems is to establish urban rain and flood models, calibrate and verify the models by simulating and reproducing historical flood events, and then providing technical support for urban hydrological forecasting, urban planning, and water resource utilization. The goal is to alleviate or even solve the problem of urban flooding.
Scholars have developed hundreds of urban rain and flood models. Model development can be divided into three stages (Figure 1): the foundational stage (1890–1971), the development stage (1972–1990), and the modern stage (1991–today) [5]. The introduction of mathematical formulas into urban drainage design calculations in 1889 marked the beginning of the foundational stage [6]. This phase mainly used empirical equations based on physical mechanisms to meet the needs of urban runoff calculations. The establishment of the US Environmental Protection Agency in 1971 marked the beginning of the development phase of the storm water management model (SWMM) [7]. The SWMM is a semi-distributed model that integrates surface runoff, surface confluence, and pipe network confluence. Its development is an important sign of the maturity of urban hydrological models [8]. At this stage, the research is mainly focused on urban hydrological processes and hydrodynamic process simulation. With algorithmic innovation, the model is able to meet the basic needs of urban rain and flood simulation. Since 1991, or the modern stage, developments in science and technology have provided a solid foundation for rapid development of urban rain and flood models, and comprehensive integration is now a remarkable feature of current models. The simulation method is more comprehensive, and the modeling process is more convenient. New methods, technologies, and models have been gradually introduced into urban rain and flood simulation, making simulation methods more accurate and complete [9]. Many scholars have conducted detailed systematic reviews of the performance of rain and flood models over time.
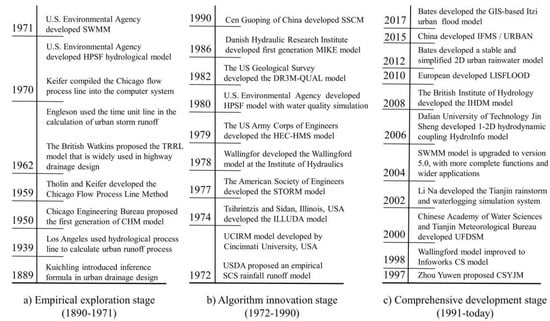
Figure 1.
Urban rain flood model research progress graph [21]. (The figure is adapted from reference [21]).
Verworn et al. [10] examined today’s basic principles of urban drainage, potential future advances, and their relevance to flood protection. Boughton et al. [11] systematically review the development and application of water balance models in Australia over a 40-year period. Winz, Ines et al. [12] traced the theoretical and practical evolution of system dynamics over a period of 50 years. From a review of the literature and selected case studies, the authors identified and discussed a number of the best practices and common pitfalls in the application of system dynamics simulation. Summarizing the calculation methods for urban rainwater discharge and examining development of urban rainwater models, Xia Jun et al. [13] compared commonly used urban rainwater models; with respect to the problems of insufficient data and investigative mechanisms in urban rainwater models, future development and improvement of the urban rainwater model are discussed. These review articles on urban rain flood models have discussed and evaluated the application effects of models in terms of structure principles, application characteristics, and development prospects, and they are all qualitative descriptions. However, there is little work on quantitative and intuitive descriptions of model application effect. In addition, there is almost no discussion about the influence of rainfall input on the effect of model application.
The accuracy of the urban rain flood model is determined by rainfall input, model structure, and model parameters [14,15]. Analysis and research have determined that uncertainty in rainfall input is the greatest source of model error. Based on a literature search of the Web of Science™ database, the present study, using a meta-analysis method, screens published research results on the urban rain flood model over the past five years, extracting model simulation accuracy data. The main analysis is divided into traditional rainfall input (rainfall station observations) and new technology rainfall input (radar rain measurement, numerical forecasting, and Web crawling). This study also systematically reviews the research and model development [16] work regarding recent urban rain flood models. Rainfall observation from rainfall stations has the advantage of high observation accuracy, but the spatiotemporal effect is poor [17]. New technology of rainfall measurement is designed to improve the spatial and temporal resolution of rainfall input to the model, but its observation accuracy is far from sufficient [18]. These limitations are the main reasons that rainfall input affects model accuracy [5]. In addition, rainfall duration, magnitude, model calibration times, and model verification times all have some impact on model accuracy.
Since the 1980s, meta-analysis has been recognized by researchers in different disciplines such as medicine, psychology, and pedagogy [19]. The research idea is to calculate the average effect of the data generated through experimental research and quasi-experimental research, so it belongs to the category of quantitative research methods. Sohn W et al. quantitatively evaluate the relationship between climate and low impact development (LID) effectiveness, which provides new ideas for rainwater management policies [20].
This study summarizes the development process behind urban rain flood models and points out the development characteristics of different stages of development, along with characteristics and model application. Further, it combines meta-analysis methods, quantitatively evaluating the impact of such factors as rainfall input type, calibration times, and verification times on model accuracy, developing quantitative analysis improvements. Finally, this study examines possible applications of emerging technologies in further development of urban rain flood models.
2. Materials and Methods
This review of the impact of rainfall input on the accuracy of urban rain flood models involves two review steps: (1) systematic selection and review of 58 peer-reviewed journal articles for study areas in 15 countries, published in 42 journals, and (2) employment of a meta-analysis [20] method to build a framework to quantitatively evaluate the simulation results of the model based on rainfall input.
2.1. Study Search and Selection
To search and select the literature comprehensively and extensively, a research entry point was established, along with determination of which factors most strongly affect the simulation accuracy of urban flood models. After selection and final determination, rainfall as the input condition of the model was determined to be the main factor. The study theme was then determined to be the influence of different rainfall input conditions on the simulation accuracy of urban rain flood models. Four keywords were selected: urban pluvial flood model, urban rain flood model, urban storm water model, and urban hydrological model. To highlight research trends in the urban rain flood model, five years were chosen as the study period. The search was conducted on the Web of Science™ database. The next step was to screen the literature. The keyword search yielded 3464 published papers; 2265 of these were filtered out to complete the first article screening. The second screening yielded 621 related papers. A third screening produced 195 additional papers. Additionally, 104 papers were obtained through full-text review. Finally, according to the research topic of the impact of key variables (rainfall input type, calibration times, and verification times) on model simulation accuracy and the requirements of meta-analysis methods, 48 documents were finalized (Figure 2).
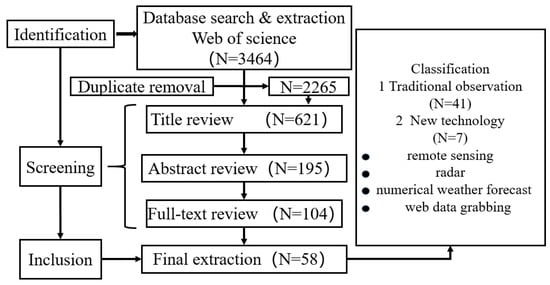
Figure 2.
Review structure of literature search and selection.
To explore the impact of rainfall input on the simulation results of urban rain and flood models, we must clarify the types of rainfall. This study divides rainfall into two categories according to method of observation: (1) traditionally observed rainfall, i.e., ground stations (hydrological stations, rainfall stations; 41 studies use ground-based observed rainfall as the model input); (2) new technology for rain measurement, i.e., rainfall data obtained via emerging technologies such as remote sensing, radar, numerical weather forecasting, and Web crawling (seven articles employed this method). Urban flood modeling has been an area of great research interest in recent years (Figure 3). The present study represents a systematic review of comprehensive observation of rainfall methods and research trends. Thus, the selected research period is 2015–2019. At the same time, to further enrich the content, 10 reference-related papers were included.
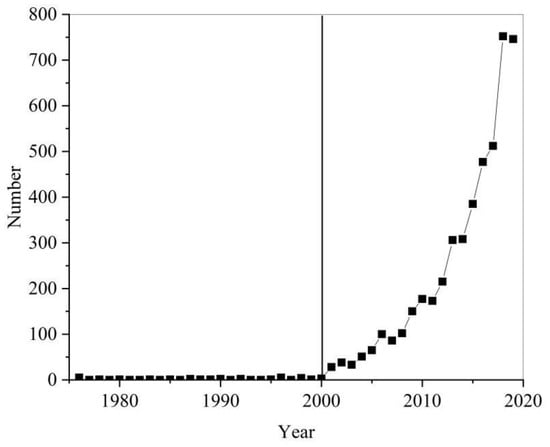
Figure 3.
Research trend graph. (This is the result of the number of documents retrieved in the Web of ScienceTM based on the keyword “urban rain flood model”. The black vertical line represents the turning point).
2.2. Model Performance Indicator Selection
Performance of different urban flood models is assessed via statistical error measures and characteristics of flood process error indicators, including Nash–Sutcliffe efficiency (NSE) [22], root mean square error (RMSE) [22], coefficient of determination (R2) [23,24,25], relative error (RE) [24,25], mean absolute error (MAE) [24], error of time to peak discharge (ETp) [26,27], and error of peak discharge (EQp) [19]. This study uses NSE, RMSE, R2, and RE as model performance indicators. These evaluation indicators are explained below.
2.2.1. Nash–Sutcliffe Efficiency
The Nash–Sutcliffe efficiency (NSE) is a traditional model performance indicator for evaluating the goodness-of-fit between simulated and observed values. The value of NSE varies between −∞ and 1, with higher values indicating better performance. If NSE > 0.5, then the simulated discharge can be regarded as satisfactory [22].
2.2.2. Root of the Mean Square Error
Root of the mean square error (RMSE) represents the error between the simulated and observed values. RMSE is non-negative, the smaller the value, the better the model simulation effect [22].
2.2.3. The Coefficient of Determination
The coefficient of determination (R2) is often used to describe the degree of fit between data. When R2 is closer to 1, it means that the reference value of the related equation is higher; on the contrary, when it is closer to 0, it means that the reference value is lower [23,24,25].
2.2.4. Relative Error
Relative error (RE) refers to the value obtained by multiplying the ratio of the absolute error caused by the measurement to the measured (conventional) true value by 100%, expressed as a percentage. Generally speaking, the relative error can better reflect the credibility of the measurement. It is mostly used in the evaluation of urban rain and flood models to indicate the credibility of the simulated value of flood peak discharge [24,25].
2.3. Data Analysis
The selected 48 peer-reviewed articles (Table 1) are characterized by the quantitative relationship description of different key variables to model accuracy, such as rainfall input type, calibration times, and verification times. We analyze the research trend by counting the frequency of related articles appearing in each year. To explain the influence of various factors on the accuracy of the model, we conducted a quantitative analysis of the accuracy problems corresponding to each key variable in the model. Different key variables are used as classification conditions, and evaluation indicators, such as NSE, RMSE, R2 and RE, are unified as data sources for meta-analysis. In accordance with the classification of research objects, data on research methods were selected from the 48 articles, including research locations, study area scales, model calibration, verification of rainfall events, and model accuracy evaluation indicators. The reviewed literature reveals the effect of different rainfall inputs on model application.

Table 1.
Information of 48 peer-published articles.
The application effect or model accuracy of an urban rain and flood model is usually determined by comparing the flow process, flood peak flow, total runoff, or water depth of the model with the observed values [28]. However, the number of quantitative indexes between studies is inconsistent. To select the quantitative verification indexes, a weighted average method was used to determine the verification accuracy of the model.
3. Results and Discussion
3.1. Overview of Urban Rain Flood Model Research Trends
Since the 1970s, urban flood modeling has developed rapidly, and a variety of urban rain and flood models have been developed [29,30]. Urban flood models can be divided into empirical models, conceptual models, and physical models [31]. The empirical model, also known as the “black box model”, only inputs and outputs sequences, but lacks physical mechanisms and sufficient analysis of hydrological processes. The conceptual model is based on water balance construction and has a certain physical significance. It is used in flood control planning and urban drainage and widely used in design [32]. The physical model has a strong physical foundation, takes hydrodynamics as its theoretical basis, requires a lot of data, and is complex to solve; however, it has the highest simulation accuracy and wide application prospects.
As shown in Figure 3, the number of research articles related to urban flood models in the Web of Science™ database has surged since 2000. There were three related articles in 2000, 177 in 2010, and 746 in 2019, or 248.6 times the number of articles published in 2000. This is because, since 2000, the urbanization process has seen unprecedented acceleration. On the other hand, human activity and climate change are leading to more frequent extreme rainfall events, and the characteristics of the urban rain island effect have become clear [33]. These two factors have led to increased rainfall and reduced infiltration in urban areas, leaving them prone to water accumulation and exacerbating frequent flooding disasters in cities [34]. Thus, urban rainwater models have been rapidly developed and applied.
The selected articles involve more than 20 urban flood models. As shown in Figure 4, the SWMM model has gradually become the most widely used model in the world since it emerged in 1971 [16,35,36]. It appears in our sample a total of 23 times, close to the total number of occurrences of all other models combined. The SWMM model is easy to operate, has a wide range of applications, and the source code can be shared [37,38]. These advantages make it one of the preferred models for studying urban hydrology. In addition, MIKE, UFDSM, geographic information systems (GIS) + and other urban rainfall runoff models are widely used [2,39].
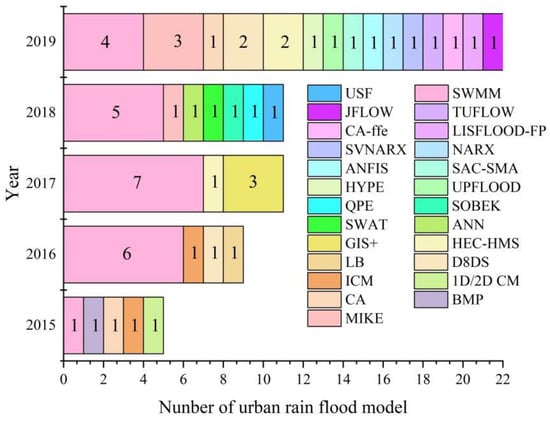
Figure 4.
Number of occurrences of urban flood model.
A rational formula was introduced into urban drainage design in 1889; this is considered the beginning of study of urban flood models [21]; however, study of urban hydrology in the true sense began in the 1960s. Continuous expansion of the scale of urban flooding brings ever greater attention to water problems caused by urbanization [40]. After 1980, with improvements in computing power and the emergence of geographic information systems (GIS) and remote sensing technology (RS) in hydrology, a series of urban hydrological–hydrodynamic models surfaced, including SWMM, STORM, and HSPF [29]. Among the many urban flood models, SWMM is still the most widely used. Scholars worldwide use the SWMM model to carry out in-depth research on storm flood simulation [41], urban non-point source load estimation [42], and effective evaluation of low impact development (LID) measures [16]. The applicability of this model has also been verified in some non-urban areas. It can be said that SWMM is representative of the urban flood model. After model development entered the modern stage, how to use emerging science and technology to improve the spatial and temporal accuracy of the urban flood model simulation has become a key consideration [5]. GIS, remote sensing, Internet, and Big Data technologies provide multiple possibilities for urban storm flood simulation and verification. Multi-data input, multi-method application, multi-technology paralleling, and multi-method verification of Big Data-driven simulation may become the direction for future development.
3.2. Influence of Rainfall Calibration and Verification Times on Model Accuracy
Rainfall input data are taken from the 41 articles with measured rainfall. Among these, 16 papers use NSE as the index for model calibration and verification. These 16 articles involve 24 urban flood models. Accuracy statistics for their calibration and verification are shown in Figure 5.
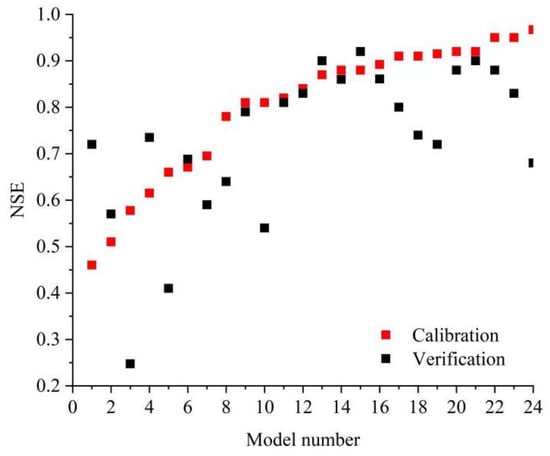
Figure 5.
Comparison of model accuracy during calibration and verification.
Figure 5 shows that in the 24 research simulations [3,16,36,41,43,44,45,46,47,48,49,50,51,52], the accuracy of the model in six verification periods was lower than that in the calibration period, and the accuracy of the model in 18 verification periods was higher than that in the calibration period. Calibration accuracy is 0.07 higher than verification accuracy on average and the overall trend of model calibration accuracy is positive.
This study also summarizes the comparison articles to compare the accuracy of the models for single-run (refers to a single historical flood to calibrate the model) and multiple-run (refers to calibrating the model with multiple historical floods) rainfall–runoff event calibration. The results are shown in Table 2. Among the 48 articles (Table 1), six articles (Su, Bon et al., 2019; Kim, Hyun Il et al., 2019; Chen et al., 2017; Akter, A. et al. 2017; Chen, Hao et al., 2016; Liu, L et al., 2015) use a single flood to calibrate the model. Analysis of these six articles finds that two articles (Kim, Hyun Il et al., 2019; Liu, L et al., 2015) use NSE as the evaluation indicator for flow simulation, involving three simulations with results, respectively, of 0.61, 0.81, and 0.85, the average is 0.76. Two articles (Akter, A. et al., 2017; Liu, L et al., 2015) use R2, with results of 0.77 and 0.965, respectively, the average is 0.87. One article (Su, Bon et al., 2019) uses RMSE, and with a result of almost 0, the outcome is very good. In an in-depth simulation, one article (Chen et al.,2017) uses the RE evaluation index, and with a result of 14.50%. Another representative multi-stage rainfall calibration model research article is selected for comparison, and the results are shown in Table 3. Note that in the simulation of flow, the six representative articles selected have NSE values of 0.25–0.735, the average is 0.62, and the R2 value of one article is 0.6975, significantly lower than the simulation effect of single-field calibration. There are two articles (Zhao, Gang et al., 2016; Chang, Xiaodong et al., 2016) on simulation of flood peak flow. RE was used to evaluate the effect in 10.5% and 29.90%, with large errors. Statistical analysis shows NSE higher than 0.14 and R2 higher than 0.17 on flow simulation; but in water depth simulation, RE is about 6% lower. Combining the two statistical tables, the single-run rainfall runoff event calibration model has higher simulation accuracy than the multi-run calibration model.
Table 2.
Single rainfall statistics [1,28,39,53,54,55].
Table 3.
Multiple rainfall statistics [16,43,44,47,49,56].
The internal reason is that this phenomenon occurs because of insufficient understanding of the urban hydrological process [13]. The study of urbanization hydrological effect is the basis for discriminating urban water problems, exploring urban water cycle rules and forming the theory of urban production and confluence. The mechanism of urban production and confluence is the theoretical basis for constructing urban hydrological models. Fully understanding the process of urban hydrological mechanism requires urban hydrological monitoring and forecasting. Perfect meteorological and hydrological observation data have always been an important condition for people to understand and study the laws of hydrology. Urban hydrological observation and forecasting are important contents and key technologies for urban hydrological research [57]. Strengthening the understanding of hydro-physical processes, conducting in-depth mechanism research and the dynamic calibration of model parameters are of great significance to the improvement of urban rain flood models.
3.3. Influence of Rain Measurement Method on Model Accuracy
There are many methods for rainfall observation, divided into two types according to observation technique. One is traditional rain measurement via rainfall stations, hydrological stations, meteorological stations, and other facilities to record rainfall on the ground. Rainfall data obtained via this method are the most commonly used rainfall data for rainfall input to urban flood models. However, this method has serious difficulties, including high station construction cost and low spatial resolution [17]. The other method is new technology measurement, mainly through radar, remote sensing, microwave, and numerical weather forecasting. An important feature of this method is completion of observations prior to rainfall. This method has a wide range of space–time observations [58,59]. Many studies have focused on increasing the time and space of rainfall input. Resolution seeks to improve the accuracy of simulated predictions of urban rain flood models [60,61]; this is likely to remain a developing trend in precipitation measurement. However, the observation accuracy of this method is not enough, and it usually needs to be corrected in conjunction with surface rain measurement [17]. In addition, the observation data usually need to be downscaled and inferred to be applied; this technology is very complex. Of the 48 articles screened for quantitative analysis, 41 use rainfall input data for the urban rain flood model observed by traditional methods; the remaining seven articles use new technology measurement. Figure 6 shows that current rainfall input to urban rain and flood models is still based mainly on ground observation of rainfall; application of new technology for rain measurement is less frequent but is a developing trend.
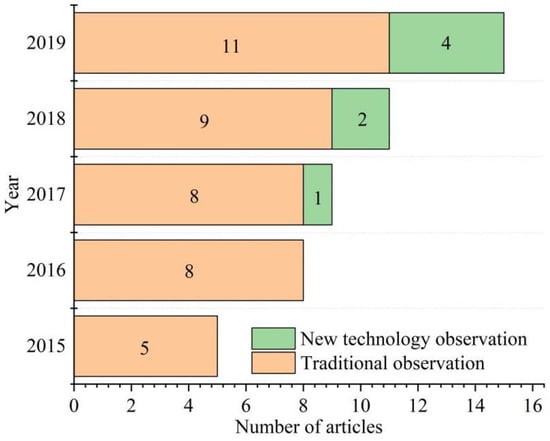
Figure 6.
Number of publications by technology observation.
Thus, the use of new technology for rain measurement attempts to improve the accuracy of urban rain flood model simulation or forecast by increasing the spatial and temporal resolution of rainfall input. However, how important are new technology methods? Seven articles (Woodson, David et al., 2019; Habibi, Hamideh et al., 2019; Barszcz, Mariusz Pawel et al., 2019; Simari, G. R. et al., 2018; Barszcz, Mariusz Pawel et al., 2018; Yoon, Seong-Sim et al., 2016; Yoon, Seong-Sim et al., 2017) that use new technologies to observe rainfall as model inputs were systematically analyzed. Table 4 shows that in Habibi, Hamideh et al. (2019), the NSE of flow simulation was greater than 0.6 and RE of flow simulation is as high as 131%. In the remaining five studies (Woodson, David et al., 2019; Barszcz, Mariusz Pawel et al., 2019; Simari, G. R. et al., 2018; Barszcz, Mariusz Pawel et al., 2018; Yoon, Seong-Sim et al., 2017), RE of hydrological element simulation is also 10–30%. Note that, from the perspective of model accuracy, the application effect of rainfall measured via new technology is not sufficient as a model input. To deeply demonstrate this problem, we have chosen seven supporting cases with the same evaluation index and study area scale (Table 5). Of these seven articles (Huang, Minmin et al., 2019; Roodsari, Babak K. et al., 2019; Thrysoe, Cecilie et al., 2019; Zhao, Gang et al., 2016; Granata, Francesco et al., 2016; Akter, A. et al., 2017), two (Roodsari, Babak K. et al., 2019; Thrysoe, Cecilie et al., 2019) use NSE as the evaluation index of flow observation, with values of 0.79–0.96, the average is 0.88. One uses R2, with a value of 0.77 for the observation of flood peak flow. Two articles (Huang, Minmin et al., 2019; Zhao, Gang et al., 2016) use RE, with values 5.69% and 7.5%, respectively. For observation of depth, one article uses both RMSE and RE, with values 0.194 mm and 24.55%, respectively. NSE of traditional technology for rain measurement is higher at 0.18 than new technology for rain measurement on flow simulation. Note that for simulation on the same hydrological elements, the simulation results obtained via traditional rain measurement input are better than that of new technology methods.
Table 4.
New technology rain test statistics table [17,62,63,64,65,66,67].
Table 5.
Traditional technology rain test statistics table [2,3,26,35,47,54].
Traditional rainfall measurement technology is not obsolete, because it continues to play an irreplaceable role in the input layer of the model. However, rain measurement technology continues to evolve, relying on the latest scientific and technological achievements to build a scientific and complete meteorological and hydrological surface and underground monitoring network system. Realizing comprehensive monitoring of urban rainfall, combined with multi-source information technology and satellite remote sensing, meteorological radar, urban video monitoring, and sensor equipment to obtain important information on the urban rainfall process from multiple angles is a new trend in rain measurement technology [57]. In addition, improving the accuracy of rainfall forecasting [68,69] is indirectly used as an effective means to improve the accuracy of urban storm flood simulation.
3.4. Application of Web Crawling Rainfall Data in Model Input
In the current information explosion era, Big Data technology uses Big Data to effectively crawl network data as the rainfall model input; this is a topic of intense interest in current urban hydrological research [70]. Not a single selected article uses clear quantitative evaluation criteria; however, a high-quality related paper was found. An article entitled “Critical rainfall thresholds for urban pluvial flooding inferred from citizen observations” was published in 2019 in Science of the Total Environment. The authors explore the possibility of using citizen flood observations to gain new insights [18] using a 10-year radar rain map dataset and 70,000 citizen flood reports in Rotterdam. The investigators trained three binary decision trees based on Big Data and used them to predict flood occurrence based on peak rainfall intensity at different time scales. They concluded that the decision tree correctly predicted 37–52% of all flood events and 95–97% of all non-flood events. This shows that Big Data fusion may be useful in studying urban flood simulation and forecasting. How to transform unstructured data into structured data and use dense data to drive urban rain and flood models will be a focus of future research.
Multi-source fusion of rainfall observations is an inevitable outcome of the combination of ground-level rain measurement and new technology rain measurement to strengthen rainfall observation and quantitative precipitation forecasting in the future [71]. This will further lead to multi-source information coupling technology to achieve high rainfall observation accuracy, which in turn improves the simulation ability of urban rain and flood models, providing a more accurate basis for urban flood control and disaster reduction. The problems of short forecast periods and low accuracy must be solved urgently to improve urban flood disaster forecasting and early warning. The advantages of massive data and efficient processing of Big Data should combine with urban flood disaster simulation principles to study urban flood disaster forecasting and early warning theory and methods. This will become the very direction toward solving the problem of urban rain and flooding events. It is necessary to construct urban flood forecast models and real-time correction methods, coupled with urban storm forecasting models driven by Big Data. In addition, urban flood dynamic simulation models and urban flood disaster loss assessment models are needed, along with an urban flood disaster loss index system and disaster rating evaluation method. For urban areas, developing a dynamic early warning mechanism for flood disasters is an urgent problem.
Next steps should include development of a multi-source data assimilation system and a standardized basic database. Better cooperation with government agencies is required, as well as scientific research institutions and network technology companies to build both a Big Data storage and sharing system and a rainfall proximity forecasting system based on multi-source information and data. This will provide short-term heavy rain forecasting. Another important issue is processing high-precision forecasting information, so as to provide scientific and technological support for urban rain and flood simulation, flood forecasting, flood control, and disaster reduction.
4. Conclusions
By using meta-analysis to evaluate the impact of rainfall input on the simulation effect of urban rain flood models, we found that the accuracy of the calibration period is higher than that of the verification period when the urban rainwater model is applied. NSE of the calibration value is a 0.07 higher verification value on average in flow simulation. This is because the model uses the measured runoff as the target of model fitting during the calibration period, and only takes into account the flood characteristics of the calibration period during the adjustment of the model parameters, while the model parameters still retain the flood characteristics of the calibration period during the model verification period, making the accuracy below calibration period. In the simulation results, the single-rainfall runoff event calibration model has higher accuracy than the multi-field calibration model. NSE is higher than 0.14 and R2 is higher than 0.17 on flow simulation; but in water depth simulation, RE is about 6% lower. As this is caused by the parameter rate tending to average, the application of the multi-field flood calibration model should be more reliable.
The variety of rain measurement methods leads to diverse rainfall inputs to the model. The current urban rain flood model rainfall input is still based on ground rain measurement, supplemented by emerging technology rain measurement. NSE of traditional technology for rain measurement is higher by 0.18 than new technology for rain measurement on flow simulation. Given the problems analyzed in this paper, the following guidance applies to the study of rainfall input in future urban rain and flood models: (1) optimize the layout and construction of existing ground rainfall stations, as ground rainfall measurement is still reliable and feasible as a method; (2) develop long-term accurate methods; (3) speed the development of radar, remote sensing satellites, and microwave technologies. These latter technologies are effective methods for observing rainfall and can improve the spatial and temporal resolution of rainfall measurement.
This paper conducts a meta-analysis of the literature on the impact of rainfall input on the accuracy of urban rainfall models. Quantification and systematic evaluation are carried out on several aspects of rainfall input type, calibration times and verification times. It further examines the feasibility of network crawling rainfall input. Finally, it provides new ideas for future development of urban rain and flood models.
Author Contributions
Conceptualization, C.H.; methodology, C.L. and B.M.; software, Y.Y.; validation, Q.W., B.M. and S.J.; formal analysis, Q.W.; investigation, C.L.; resources, C.H.; data curation, S.J. and C.L.; writing—original draft preparation, C.L.; writing—review and editing, C.H.; supervision, Q.W.; project administration, C.H.; funding acquisition, C.H. All authors have read and agreed to the published version of the manuscript.
Funding
This research was funded by Key projects of National Natural Science Foundation of China, grant number 51739009, National Key Research Priorities Program of China, grant number 2016YFC040240203, National Natural Science Foundation of China, grant number 51979250.
Acknowledgments
We would like to thank the potential reviewer very much for their valuable comments and suggestions. We also thank our other colleagues’ valuable comments and suggestions that have helped improve the manuscript.
Conflicts of Interest
The authors declare no conflict of interest.
References
- Su, B.; Huang, H.; Zhu, W. An urban pluvial flood simulation model based on diffusive wave approximation of shallow water equations. Hydrol. Res. 2019, 50, 138–154. [Google Scholar] [CrossRef]
- Thrysoe, C.; Arnbjerg-Nielsen, K.; Borup, M. Identifying fit-for-purpose lumped surrogate models for large urban drainage systems using GLUE. J. Hydrol. 2019, 568, 517–533. [Google Scholar] [CrossRef]
- Roodsari, B.K.; Chandler, D.G.; Kelleher, C.; Kroll, C.N. A comparison of SAC-SMA and Adaptive Neuro-fuzzy Inference System for real-time flood forecasting in small urban catchments. J. Flood Risk Manag. 2019, 12, e12492. [Google Scholar] [CrossRef]
- Nkwunonwo, U.C.; Whitworth, M.; Bally, B. Urban flood modelling combining cellular automata framework with semi-implicit finite difference numerical formulation. J. Afr. Earth Sci. 2019, 150, 272–281. [Google Scholar] [CrossRef]
- Song, X.; Zhang, J.; Wang, G.; He, R.; Wang, X. Development and challenges of urban hydrology in a changing environment: Ⅱ: Urban stormwater modeling and management. Adv. Water Sci. 2014, 25, 752–764. [Google Scholar]
- Wang, S.; Wang, H. Extending the Rational Method for assessing and developing sustainable urban drainage systems. Water Res. 2018, 144, 112–125. [Google Scholar] [CrossRef]
- Gironas, J.; Roesner, L.A.; Rossman, L.A.; Davis, J. A new applications manual for the Storm Water Management Model (SWMM). Environ. Model. Softw. 2010, 25, 813–814. [Google Scholar] [CrossRef]
- Bach, P.M.; Rauch, W.; Mikkelsen, P.S.; McCarthy, D.T.; Deletic, A. A critical review of integrated urban water modelling Urban drainage and beyond. Environ. Model. Softw. 2014, 54, 88–107. [Google Scholar] [CrossRef]
- Zhao, G.; Pang, B.; Xu, Z.; Peng, D.; Xu, L. Assessment of urban flood susceptibility using semi-supervised machine learning model. Sci. Total Environ. 2019, 659, 940–949. [Google Scholar] [CrossRef]
- Verworn, H.R. Advances in urban-drainage management and flood protection. Philos. Trans. R. Soc. Lond. Ser. A Math. Phys. Eng. Sci. 2002, 360, 1451–1460. [Google Scholar] [CrossRef]
- Boughton, W. Catchment water balance modelling in Australia 1960–2004. Agric. Water Manag. 2005, 71, 91–116. [Google Scholar] [CrossRef]
- Winz, I.; Brierley, G.; Trowsdale, S. The Use of System Dynamics Simulation in Water Resources Management. Water Resour. Manag. 2009, 23, 1301–1323. [Google Scholar] [CrossRef]
- Xia, J.; Zhang, Y.; Liang, C.; Liu, J. Review on urban storm water models. Eng. J. Wuhan Univ. 2018, 51, 95–105. [Google Scholar]
- Yang, X.; Wang, Y. Cognition in the uncertainty and equifinality of hydrological model: A systematic review. J. Hydraul. Eng. 2018, 49, 136–143. [Google Scholar]
- Kitanidis, P.K.; Bras, R.L. Real-time forecasting with a conceptual hydrologic model. I. Analysis of uncertainty. Water Resour. Res. 1980, 16, 1025–1033. [Google Scholar] [CrossRef]
- Zhu, Z.; Chen, Z.; Chen, X.; Yu, G. An assessment of the hydrologic effectiveness of low impact development (LID) practices for managing runoff with different objectives. J. Environ. Manag. 2019, 231, 504–514. [Google Scholar] [CrossRef]
- Barszcz, M.P. Radar Data Analyses for a Single Rainfall Event and Their Application for Flow Simulation in an Urban Catchment Using the SWMM Model. Water 2018, 10, 1007. [Google Scholar] [CrossRef]
- Tian, X.; Veldhuis, M.C.T.; Schleiss, M.; Bouwens, C.; van de Giesen, N. Critical rainfall thresholds for urban pluvial flooding inferred from citizen observations. Sci. Total Environ. 2019, 689, 258–268. [Google Scholar] [CrossRef]
- Qi, L.; Tang, Q. The multi-case literature meta-analysis method and its research ideas. J. Beihang Univ. 2019, 32, 139–145. [Google Scholar]
- Sohn, W.; Kim, J.-H.; Li, M.-H.; Brown, R. The influence of climate on the effectiveness of low impact development: A systematic review. J. Environ. Manag. 2019, 236, 365–379. [Google Scholar] [CrossRef]
- Zhang, D.; Yan, D.; Wang, Y.; Lu, F.; Liu, S. Research Progress on Risk Assessment and Integrated Strategies for Urban Pluvial Flooding. J. Catastrophology 2014, 29, 144–149. [Google Scholar]
- El Fels, A.E.A.; Bachnou, A.; Alaa, N. Combination of GIS and mathematical modeling to predict floods in semiarid areas: Case of Rheraya watershed (Western High Atlas, Morocco). Arab. J. Geosci. 2017, 10, 554. [Google Scholar] [CrossRef]
- Peng, H.; Liu, Y.; Wang, H.; Gao, X.; Chen, Y.; Ma, L. Urban stormwater forecasting model and drainage optimization based on water environmental capacity. Environ. Earth Sci. 2016, 75, 1094. [Google Scholar] [CrossRef]
- Russo, B.; Sunyer, D.; Velasco, M.; Djordjevic, S. Analysis of extreme flooding events through a calibrated 1D/2D coupled model: The case of Barcelona (Spain). J. Hydroinform. 2015, 17, 473–491. [Google Scholar] [CrossRef]
- Liu, N.-N.; Rui, X.-F.; Feng, J. Jinan Urban Rainstorm Model Based on Lattice Boltzmann Method. Water Resour. Power 2016, 34, 48–52. [Google Scholar]
- Granata, F.; Gargano, R.; de Marinis, G. Support Vector Regression for Rainfall-Runoff Modeling in Urban Drainage: A Comparison with the EPA’s Storm Water Management Model. Water 2016, 8, 69. [Google Scholar] [CrossRef]
- Hu, C.; Wu, Q.; Li, H.; Jian, S.; Li, N.; Lou, Z. Deep Learning with a Long Short-Term Memory Networks Approach for Rainfall-Runoff Simulation. Water 2018, 10, 1543. [Google Scholar] [CrossRef]
- Chen, H.; Hong, L.; Mei, C.; Lai, Y.; Zeng, Z. Distributed simulation of urban storm water based on D8 algorithm. Eng. J. Wuhan Univ. 2016, 49, 335–340. [Google Scholar]
- Zoppou, C. Review of urban storm water models. Environ. Model. Softw. 2001, 16, 195–231. [Google Scholar] [CrossRef]
- Terstriep, M.L.; Stall, J.B. ILLUDAS—The Illinois Urban Drainage Area Simulator. In Proceedings of the National Symposium on Urban Rainfall and Runoff and Sediment Control, Lexington, KY, USA, 29–31 July 1974; Illinois State Water Survey: Champaign, IL, USA, 1974; pp. 73–83. [Google Scholar]
- Cantone, J.; Schmidt, A. Improved understanding and prediction of the hydrologic response of highly urbanized catchments through development of the Illinois Urban Hydrologic Model. Water Resour. Res. 2011, 47. [Google Scholar] [CrossRef]
- Koudelak, P.; West, S. Sewerage network modelling in Latvia, use of InfoWorks CS and Storm Water Management Model 5 in Liepaja city. Water Environ. J. 2008, 22, 81–87. [Google Scholar] [CrossRef]
- Chen, W.; Huang, G.; Zhang, H.; Wang, W. Urban inundation response to rainstorm patterns with a coupled hydrodynamic model: A case study in Haidian Island, China. J. Hydrol. 2018, 564, 1022–1035. [Google Scholar] [CrossRef]
- Ochoa-Rodriguez, S.; Wang, L.-P.; Gires, A.; Pina, R.D.; Reinoso-Rondinel, R.; Bruni, G.; Ichiba, A.; Gaitan, S.; Cristiano, E.; van Assel, J.; et al. Impact of spatial and temporal resolution of rainfall inputs on urban hydrodynamic modelling outputs: A multi-catchment investigation. J. Hydrol. 2015, 531, 389–407. [Google Scholar] [CrossRef]
- Huang, M.; Jin, S. A methodology for simple 2-D inundation analysis in urban area using SWMM and GIS. Nat. Hazards 2019, 97, 15–43. [Google Scholar] [CrossRef]
- Yang, G.; Xu, Z.; Zhao, G.; Chang, X.; Du, L. Simulating urban rainfall-runoff and assessing LID facilities by SWMM model in Dahongmen catchment. J. Beijing Norm. Univ. 2018, 54, 628–634. [Google Scholar]
- Szymczak, T.; Krezalek, K. Prognostic model of total runoff and its components from a partially urbanized small lowland catchment. Acta Sci. Pol. Form. Circumiectus 2018, 17, 185–203. [Google Scholar] [CrossRef]
- Babaei, S.; Ghazavi, R.; Erfanian, M. Urban flood simulation and prioritization of critical urban sub-catchments using SWMM model and PROMETHEE II approach. Phys. Chem. Earth 2018, 105, 3–11. [Google Scholar] [CrossRef]
- Chen, W.; Huang, G.; Zhang, H. Urban stormwater inundation simulation based on SWMM and diffusive overland-flow model. Water Sci. Technol. 2017, 76, 3392–3403. [Google Scholar] [CrossRef]
- Zhang, J.; Song, X.; Wang, G.; He, R.; Wang, X. Development and challenges of urban hydrology in a changing environment: I: Hydrological response to urbanization. Adv. Water Sci. 2014, 25, 594–605. [Google Scholar]
- Rai, P.K.; Chahar, B.R.; Dhanya, C.T. GIS-based SWMM model for simulating the catchment response to flood events. Hydrol. Res. 2017, 48, 384–394. [Google Scholar] [CrossRef]
- Shon, T.S.; Kim, S.D.; Cho, E.Y.; Im, J.Y.; Min, K.S.; Shin, H.S. Estimation of NPS pollutant properties based on SWMM modeling according to land use change in urban area. Desalin. Water Treat. 2012, 38, 333–341. [Google Scholar] [CrossRef]
- Rujner, H.; Leonhardt, G.; Marsalek, J.; Viklander, M. High-resolution modelling of the grass swale response to runoff inflows with Mike SHE. J. Hydrol. 2018, 562, 411–422. [Google Scholar] [CrossRef]
- Rangari, V.A.; Gopi, K.V.; Umamahesh, N.V.; Patel, A.K. Simulation of Urban Drainage System Using Disaggregated Rainfall Data. In Hydrologic Modeling; Singh, V.P., Yadav, S., Yadava, R.N., Eds.; Springer: Singapore, 2018; pp. 123–133. [Google Scholar]
- Her, Y.; Jeong, J. Swat plus versus swat2012: Comparison of sub-daily urban runoff simulations. Trans. Asabe 2018, 61, 1287–1295. [Google Scholar] [CrossRef]
- Zhu, Z.; Chen, X. Evaluating the Effects of Low Impact Development Practices on Urban Flooding under Different Rainfall Intensities. Water 2017, 9, 548. [Google Scholar] [CrossRef]
- Zhao, G.; Shi, R.; Pang, B.; Xu, Z.; Du, L.; Chang, X. Impact of rapid urbanization on rainfall-runoff processes in urban catchment: Case study for Liangshui River basin. J. Hydroelectr. Eng. 2016, 35, 55–64. [Google Scholar]
- Li, C.; Liu, M.; Hu, Y.; Gong, J.; Xu, Y. Modeling the Quality and Quantity of Runoff in a Highly Urbanized Catchment Using Storm Water Management Model. Pol. J. Environ. Stud. 2016, 25, 1573–1581. [Google Scholar] [CrossRef]
- Chang, X.; Xu, Z.; Zhao, G.; Du, L. Urban rainfall-runoff simulations and assessment of low impact development facilities using SWMM model-A case study of Qinghe catchment in Beijing. J. Hydroelectr. Eng. 2016, 35, 84–93. [Google Scholar]
- Akhter, M.S.; Hewa, G.A. The Use of PCSWMM for Assessing the Impacts of Land Use Changes on Hydrological Responses and Performance of WSUD in Managing the Impacts at Myponga Catchment, South Australia. Water 2016, 8, 511. [Google Scholar] [CrossRef]
- Guan, M.; Sillanpaa, N.; Koivusalo, H. Modelling and assessment of hydrological changes in a developing urban catchment. Hydrol. Process. 2015, 29, 2880–2894. [Google Scholar] [CrossRef]
- Baek, S.-S.; Choi, D.-H.; Jung, J.-W.; Yoon, K.-S.; Cho, K.-H. Evaluation of a hydrology and run-off BMP model in SUSTAIN on a commercial area and a public park in South Korea. Desalin. Water Treat. 2015, 55, 347–359. [Google Scholar] [CrossRef]
- Kim, H.I.; Keum, H.J.; Han, K.Y. Real-Time Urban Inundation Prediction Combining Hydraulic and Probabilistic Methods. Water 2019, 11, 293. [Google Scholar] [CrossRef]
- Akter, A.; Mohit, S.A.; Chowdhury, M.A.H. Predicting urban storm water-logging for Chittagong city in Bangladesh. Int. J. Sustain. Built Environ. 2017, 6, 238–249. [Google Scholar] [CrossRef]
- Liu, L.; Liu, Y.; Wang, X.; Yu, D.; Liu, K.; Huang, H.; Hu, G. Developing an effective 2-D urban flood inundation model for city emergency management based on cellular automata. Nat. Hazards Earth Syst. Sci. 2015, 15, 381–391. [Google Scholar] [CrossRef]
- Tanouchi, H.; Olsson, J.; Lindstrom, G.; Kawamura, A.; Amaguchi, H. Improving Urban Runoff in Multi-Basin Hydrological Simulation by the HYPE Model Using EEA Urban Atlas: A Case Study in the Sege River Basin, Sweden. Hydrology 2019, 6, 28. [Google Scholar] [CrossRef]
- Xu, Z.; Cheng, T. Basic theory for urban water management and sponge city-review on urban hydrology. J. Hydraul. Eng. 2019, 50, 53–61. [Google Scholar]
- Dong-Eon, K.; Gourbesville, P.; Shie-Yui, L. Overcoming data scarcity in flood hazard assessment using remote sensing and artificial neural network. Smart Water 2019, 4, 2. [Google Scholar]
- de Souza, B.A.; da Silva Rocha Paz, I.; Ichiba, A.; Willinger, B.; Gires, A.; Amorim, J.C.C.; de Miranda Reis, M.; Tisserand, B.; Tchiguirinskaia, I.; Schertzer, D. Multi-hydro hydrological modelling of a complex peri-urban catchment with storage basins comparing C-band and X-band radar rainfall data. Hydrol. Sci. J. 2018, 63, 1619–1635. [Google Scholar] [CrossRef]
- Yoon, S.-S.; Nakakita, E. Application of an X-Band Multiparameter Radar Network for Rain-Based Urban Flood Forecasting. J. Hydrol. Eng. 2017, 22, e5015005. [Google Scholar] [CrossRef]
- Borup, M.; Grum, M.; Linde, J.J.; Mikkelsen, P.S. Dynamic gauge adjustment of high-resolution X-band radar data for convective rain storms: Model-based evaluation against measured combined sewer overflow. J. Hydrol. 2016, 539, 687–699. [Google Scholar] [CrossRef]
- Woodson, D.; Adams, T.E., III; Dymond, R. Precipitation Estimation Methods in Continuous, Distributed Urban Hydrologic Modeling. Water 2019, 11, 1340. [Google Scholar] [CrossRef]
- Habibi, H.; Dasgupta, I.; Noh, S.; Kim, S.; Zink, M.; Seo, D.-J.; Matthew, B.; Branko, K. High-resolution hydrologic forecasting for very large urban areas. J. Hydroinform. 2019, 21, 441–454. [Google Scholar] [CrossRef]
- Barszcz, M.P. Quantitative rainfall analysis and flow simulation for an urban catchment using input from a weather radar. Geomat. Nat. Hazards Risk 2019, 10, 2129–2144. [Google Scholar] [CrossRef]
- Yonese, Y.; Kawamura, A.; Amaguchi, H. Storm Runoff Prediction Using Rainfall Radar Map Supported by Global Optimization Methodology. In Ibero-American Conference on Artificial Intelligence; Springer: Berlin/Heidelberg, Germany, 2018. [Google Scholar]
- Yoon, S.-S. Adaptive Blending Method of Radar-Based and Numerical Weather Prediction QPFs for Urban Flood Forecasting. Remote Sens. 2019, 11, 642. [Google Scholar] [CrossRef]
- Yoon, S.-S.; Lee, B. Effects of Using High-Density Rain Gauge Networks and Weather Radar Data on Urban Hydrological Analyses. Water 2017, 9, 931. [Google Scholar] [CrossRef]
- Hossain, I.; Esha, R.; Imteaz, M.A. An Attempt to Use Non-Linear Regression Modelling Technique in Long-Term Seasonal Rainfall Forecasting for Australian Capital Territory. Geosciences 2018, 8, 282. [Google Scholar] [CrossRef]
- Yilmaz, A.G.; Hossain, I.; Perera, B.J.C. Effect of climate change and variability on extreme rainfall intensity-frequency-duration relationships: A case study of Melbourne. Hydrol. Earth Syst. Sci. 2014, 18, 4065–4076. [Google Scholar] [CrossRef]
- Yu, D.; Yin, J.; Liu, M. Validating city-scale surface water flood modelling using crowd-sourced data. Environ. Res. Lett. 2016, 11, 124011. [Google Scholar] [CrossRef]
- Wu, Z.; Shen, Y.; Wang, H. Research progress on data fusion of multi-source urban rainstorm forecast. Water Resour. Hydropower Eng. 2018, 49, 15–21. [Google Scholar]


© 2020 by the authors. Licensee MDPI, Basel, Switzerland. This article is an open access article distributed under the terms and conditions of the Creative Commons Attribution (CC BY) license (http://creativecommons.org/licenses/by/4.0/).