Abstract
Observation of the Hau River distributary of the Mekong River delta in Vietnam, conducted in dry and flood season (2009, 2014, and 2015), is utilized to investigate the mechanism of formation, distribution of estuarine turbidity maxima (ETM), and links with sediment transport in the system. Additionally, 3D (three-dimensional) numerical models are applied to simulate the seasonal tidal variation (flood and dry seasons) of the water and suspended sediment transport processes of the Mekong River Delta. The 3D model, with a combination of hydrodynamic-wave and suspended sediment transport, was set up and validated with measured data in the study area. The mechanism that measures ETM is the process of suspended sediment from the river when it interacts with seawater and speeds up the flocculation, combined with the asymmetry of the tidal current, which will create the region with ETM by moving in/out with the tidal current’s ups and downs. As there is surface flow velocity towards the sea, the bottom baroclinic flow has a decisive role in deposition and erosion, and it causes the suspended sediment concentration (SSC) to be maximized. During the flood season, the salt wedge near the river’s mouth, at the peak of the tide, pushes towards the sea’s direction when there are ebbing tides, with a scope of about 20 km. In the dry season, there is estuary disturbance as well; the salt wedge forms, but is relatively weak or does not exist, depending on the time of the tide. The maximum turbidity zone in the flood season moves the subaqueous delta with a scope of about 20 km and SSC of about 0.1 to 0.6 g L−1, whereas in the dry season, the seawater has high salinity, and seaward SSC penetrates the estuaries to cause a disturbance and flocculation. The penetration scope is up to 50 km and creates a water mass that has high SSC, from 0.2 to 0.7 g L−1, to run in/off by the tidal current’s ups and downs for several kilometers in the tidal phase.
1. Introduction
Estuarine turbidity maxima (ETMs) are zones of the interaction between a river and sea and are characterized by higher suspended sediment concentrations (SSCs) than in the river and lower parts [1]. The ETM dynamic is focused on long-term deposition in the estuaries and tidal flats [1,2]. Because of the strong interaction of marine water, tides, and river discharge, the mechanics of the formation of ETMs are very complex and not easy to predict [1,3,4,5,6,7,8]. The important role of the gravitational circulation and river flow are the main factors contributing to ETM formation [9,10,11,12,13]. Tidal resuspension is a key factor for creating high SSC concentration [6,7,14,15,16,17,18], and tidal asymmetry is another factor promote ETM formation [8,9,10,11,19]. On the other hand, tidal current is enhanced in near-surface waters at ebbs and is bottom-intensified during floods. The influence of vertical mixing may also be suppressed at ebbs and enhanced during floods [1,20]. The location of ETMs depend on the interaction of seawater and river water; they move to the upper river if there is weakened freshwater (in the dry season) and move downriver when the river water is stronger, as in the wet season [21,22,23,24,25]. The changes in SSC in ETM are rapid due to anthropogenic factors [8,26,27]. Therefore, the determination of the ETM dynamic can help us to understand the behaviors of SSC in estuaries and tidal flats.
Hau River (the other name of the Bassac river) is one of two main rivers of the Mekong River system, one of the largest river systems in the world in terms of both water discharge and sediment flux [28]. Before the sea, Hau River splits mainly into the Tran De and Dinh An mouths (Figure 1). This area is dominated by the tide, with a tidal range of up to 3 m in the spring tide and a strong water river discharge in the flood season. Because of the strong interaction between freshwater and seawater, the sediment dynamics of the Mekong distributaries have attracted the interest of many researchers [29,30,31]. Based on the measurement data, Wolanski et al. [30,32] reported a conceptual model of present-day sediment dynamics in the Bassac estuary (the southern main distributary of the Mekong River), which was completed by Hein et al. [33]. Most of the sediment brought by the river is deposited in the shallow coastal waters of depth <20 m (corresponding to the subaqueous delta) in the wet season, while a net flux of particles occurs upstream in the estuary during the dry season. Alongshore, numerical simulations by Hein et al. [33] have shown that deposition dominates over the annual cycle, directly off the mouths of the Mekong branches, where erosion prevails throughout the year in the shallow waters to the north and south (along the Cape), whereas erosion and deposition alternate further offshore with the seasonal cycle.
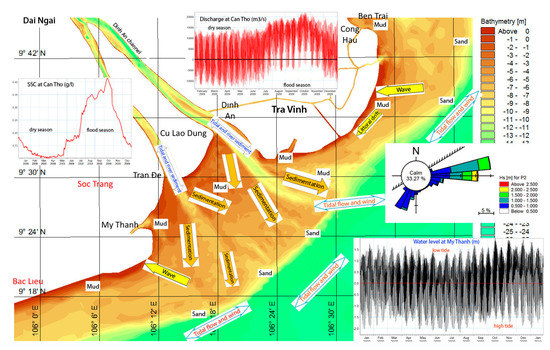
Figure 1.
The Hạu River systems. The colors present the water depth. The distribution of sand and mud bed sediments at the mouth of Bassac Estuary based on Portcoast data from 2009. River water discharge and suspended sediment concentration (SSC) measured in the period 2009–2015 at My Thuan (Tien River) and Can Tho (Hau River), supplied by the Vietnam Center of Hydrometeorological Data. The water level was measured during the 2009 low- and high-flow cruises. The location of the tide gauge is indicated in Figure 2.
Hau River mouth is known as a high deposition rate region among the Mekong estuaries. At the Dinh An mouth, the deposit rate can reach up to 0.04–0.53 m/month (in the flood season) and about 0.15–0.3 m/month (in the dry season). As a result, sediment deposition has occurred not only in the main channels but also created sandbars. To maintain the necessary depth channel for waterway transport, a volume of sediment in the channels have to be dredged every year. Several studies have targeted the sediment dynamics in the Hau River mouth [34], but few studies are based on measured data and a 3D numerical model to survey ETM formation. This study is based on serial data measurement (SSC, salinity, and current) at 12 in-situ stations in the flood and dry seasons at the Hau River area, and a 3D numerical model aims to survey formatting and distribution of the estuarine turbidity maximum in the Hau River mouth.
2. Regional Settings, Data, and Methods
2.1. Regional Setting
Hau River mouth belongs to the Mekong River delta (MRD; Figure 2) that progrades more than 250 km to the southeast [35,36,37,38]. During its development, the character of this region changed from tide-dominated into a combination of wave- and tide-dominated, and its shape and the orientation of the coastline have also changed through time [39]. This region is affected by semidiurnal tides and a spring tidal range of about 3.5 m near the mouth [31,40]. The amplitudes of tide M2 and S2 are up to 0.9 and 0.5 m, respectively, while diurnal tide K1 and O1 amplitudes are up to 0.7 m and 0.5 m, respectively [41].
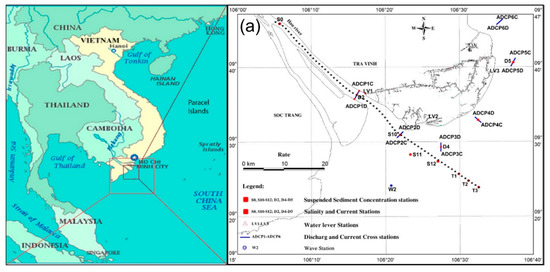
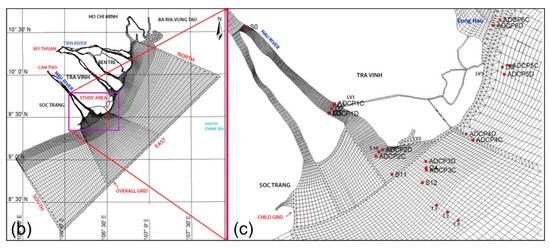
Figure 2.
Study location of Hau River mouth with locations of the river and sea boundaries of the model. (a) Study stations and cross-section; (b) parent overall grid and (c) child grid.
The total water discharge of the Mekong system river is about 500 km3 year−1, of which 85% flows in the flood season and 15% in the dry season [36,42]. Discharges at the Can Tho and My Thuan stations are almost the same and vary between 25,000 m3 s−1 in the flood season (September–October) and a minimum in the dry season (January to April, typically 2000 m3 s−1) [31,43]. The suspended sediments in the distributaries of the Mekong River delta are mostly composed of fine silt, with about 15% clay [30,32,44]. The suspended sediment flux to the coastal area is about 145 × 106 t year−1, and the average sediment concentration in the river is about 60 mg L−1; in some cases, maximum values can reach 500 mg L−1 in the wet season [45].
On the Hau River, water river discharge is reduced by branching upstream, and seasonal variation is diminished by the influence of the upstream flow [46,47]. The annual discharge of the Hau River ranges from 5000 to 12,000 m3 s−1 at Can Tho Gauge Station (Figure 1). During high flow, freshwater can extend to the mouth of the Dinh An, whereas during low flow, seawater has been observed to penetrate about 50 km landward of the mouth [30,32,35,47].
The suspended sediment in the Mekong River delta, as well as Hau River, is not flocculated in the freshwater region but is flocculated in the saline region. Mean floc size d50 was 82 µm and d10 and d90, respectively, 28 and 85 µm [32]. These floc characteristics thus resembled those in the high flow season; particle sizes in the Hau River are >50% fine silt and 15–20% clay [30,32]. Wolanski et al. [32] encountered salt wedge estuarine conditions where ebb flows were stronger than floods—no along-channel SSC gradient was observed, no turbidity maximum was present, and the river bed was mostly sandy in the high-flow period. They further found that deposition and erosion dominated SSC variability, and the system exported sediment to the ocean.
SSC at the mouth varies temporally and vertically. SSC values were always in the range of enhanced settling (SSC <1.2 g L−1) and never reached values (>5 g L−1) that would be typical of hindered settling. Seaward of the Hau River mouth, SSC varies by order of magnitude between the rainy southwest monsoon and windy northeast monsoon [48]. The total suspended sediment discharge entering the delta is about 145 × 106 t year−1, and the average sediment concentration in the river is about 0.06 g L−1; maximum values can reach 0.5 g L−1 in the wet season [45].
According to Nowacki et al. [49], during high flow, instantaneous water discharge could reach a maximum of more than 20,000 m3 s−1 on the ebb tide and about −18,000 m3 s−1 on the flood tide, whereas during low flow, the maximum discharge was about 20,000 m3 s−1 on the ebb tide and about −25,000 m3 s−1 on the flood tide. Put into the context of previous studies, Dinh An low-flow discharge was less than 1200 m3 s−1 [30] during their low-flow study in April 1996 but was similar to 650 m3 s−1 [50] for a period in April 2005. The agreement with Nguyen et al. [51] for low-flow Dinh An discharge did not extend to the full Hau River.
At Can Tho, typical SSC ranges from 10 to 60 mg L−1, whereas at the Dinh An mouth, greater variations in SSC occur in estuarine waters of 0.05–0.25 g L−1 [34]. However, near the salinity intrusion limit, SSC also fluctuates vertically and in time [30]. The peak near-bottom SSC value was 1.4 g L−1, which is still in the range of enhanced settling. In the freshwater region, SSC values were measured in the 0.1–0.2 g L−1 range. Thus, the freshwater region was less turbid than the saline region of the estuary. Suspended sediment, possibly deposited offshore during previous high-flow periods, was posited to be transported landward by coastal waters [32]. Sediment is also reimported into the river [49].
2.2. Data
2.2.1. Measured Data
SSC, salinity, and current in the water column were measured on two cruises during the dry season (9–12 April 2009) and flood season (22–24 August 2009) in the framework of the project of Waterway for Heavy-Tonnage Ships to Enter the Hau River at 9 in-situ stations (S0, S10, S11, S12, D1, D2, D3, D4, and D5; see Figure 2). The water samples for SSC were filtered on the ship and analyzed at the laboratory. The water samples were collected using a Niskin bottle (1 L) at each station in depths of 0.2, 0.4, 0.6, and 0.8 H and above the bottom (H is water depth at each station). All data at a station were measured at the same time.
Six cross-sections were set up to measure flow velocity and water discharge, namely, section ADCP1 in the Dinh An channel, sections ADCP2 and ADCP3 at the outer Dinh An channel, section ADCP4 in the Dinh An River mouth, and sections ADCP5 and ADCP6 at the Cung Hau River mouth. At each section, the acoustic doppler current profiler (ADCP) operated continuously for about 72 h (one-hour intervals), with the length being 2400 m. Six vessels repeatedly traversed each cross-section and completed a one-way pass in 15 min and at the same time for two seasons. In addition, two wave stations were measured at W1 and W2 sites. Three water level stations were measured at LV1, LV2, and LV3 sites (Figure 2).
Two surveys were performed on the subaqueous delta slope in the framework of the program Cooperation in Science and Technology between Vietnam and the United States at 3 in-situ stations (lasting 12 h for each station) in September 2014 (flood season) and April 2015 (dry season) [44]. Specifically, the location of the T1 station was on the top-set at a depth of 8 m, the T2 station was on the fore-set at a depth of 15 m, and the T3 station was on the bottom-set at a depth of 22 m, with a distance between the each station of about 2 km. At each station, velocity profiles were measured by a 600-kHz ADCP configured for a 0.3-m bin size; depth profiles of water temperature, salinity, and turbidity were measured by a Compact-CTD [44].
2.2.2. Data Used to Set up the Model
Bathymetry and coastline in the study area were taken from topography maps on the scale of 1:50,000 for the coastal zone and 1:25,000 for the estuary regions. The maps were published by the Department of Survey and Mapping in 2004. Bathymetry offshore was extracted from GEBCO-1/8, with 30 arc-second interval grids [52].
The bathymetry was supplemented with survey data supplied by Portcoast on 12 June 2009 for Hau River, Dinh An mouth, and Tran De mouth, with scales of 1:500 and 1:10,000, and combined with earlier data from elsewhere and C-map offshore data.
This study used the freshwater discharge and SSC measured during the period 2007–2015 by the Vietnam Center of Hydrometeorological Data at My Thuan (Tien River) and Can Tho (upstream Hau River), Nha Be, for setting the upriver boundary condition of the model. At Thi Vai River boundary, due to the lack of a gauging station, we used the seasonally averaged river discharges and SSC from a previous project [53] to set up the river boundary conditions in these rivers.
Sea level elevations measured at Tran De, My Thanh, Binh Dai, An Thuan, and Ben Trai stations (Figure 1) supplied by the Vietnam Center of Hydrometeorological Data were used for model calibration and validation.
Water temperature and salinity in the World Ocean Atlas [54], with 0.25 degree-grid resolution, was used for the open-sea boundary transport condition. The meteorological data (wind and air pressure at 10 m above sea surface at 00:00, 06:00, 12:00, and 18:00 every day) were taken from Oceanweather (http://www.oceanweather.com/).
2.2.3. Data Processing
Sample volumes were measured and then samples were filtered through predried and predesiccated 0.45-μm nitrocellulose membrane filters. Filters were then redried and reweighed to determine the change in mass. An ionizer was used during weighing to reduce errors related to static effects. Mass concentrations were determined by dividing the change in filter mass by the total volume filtered. Weights were adjusted according to the apparent concentrations of filtered and distilled water calibration samples.
In which, .
2.3. Model
2.3.1. Model Used
The MIKE 21/3 coupled model FM was used to simulate hydrodynamics and suspended sediment transport in this study. This model was developed by DHI (the Danish Hydraulic Institute), which includes both 2D and 3D modeling and coupled hydrodynamics, spectral wave, mud transport module, and morphology with flexible mesh, combined by both triangle elements and quadrilateral elements. The hydrodynamic module and the spectral wave module were used [55]. The hydrodynamic module can be used to solve both three-dimensional and two-dimensional problems. In 3D, the model is based on the numerical solution of the three-dimensional incompressible Reynolds-averaged Navier–Stokes equations, invoking the assumptions of Boussinesq and hydrostatic pressure. Thus, the model consists of continuity, momentum, temperature, salinity, and density equations and is closed by a turbulent closure scheme. In 2D, the model is based on shallow-water equations and the depth-integrated incompressible Reynolds-averaged Navier–Stokes equation [56].
2.3.2. Model Setup
The parent grid (overall grid) and child grid are created by the Mesh Generator tool in the Mike model. The model grid is a flexible mesh combined with both triangle elements and quadrilateral elements, with 15,000 elements (triangle and quadrilateral) and 15,000 nodes. The model frame covers the region from coastal Vung Tau in the northeast part to near the Ganh Hao coastal area in the southwest part (Figure 2), along circa 300 km in the northeast–southwest direction and 115 km in the northwest–southeast direction. In the deep-water area, the horizontal grid size changes from 2000 to 3000 m. In the shallow water area, namely, the coastal zones, the horizontal grid size changes from 50 to 100 m and the long grid size changes from 200 to 3000 m. The child grid covers river mouths and main river branches created by triangle and quadrilateral elements, with a high-resolution grid (triangle and/or quadrilateral) and grid-size changes from 6 to 50 m.
The land boundary is the shoreline. The open ocean boundaries consist of North, East, and South. The boundary water level database at the ocean boundaries of North, East, and South, which measured sea level near the coast, was analyzed to determine the harmonic constants of eight tidal constituents (M2, S2, K2, N2, O1, K1, P1, Q1). The tidal harmonic constants imposed offshore were extracted from FES2014 [57,58]. The wave module was set up by coupling with hydrodynamics and mud transport. At the open sea boundaries (North, East, and South boundaries), the boundary conditions were specified for the boundary name, which was specified in the domain. The boundary wave database at the open sea boundaries of North, East, and South was generated by the Global Wave model [59,60]. The values of water temperature and salinity were set to T = 28 °C and S = 34 psu.
The river boundaries consist of (1) the Mekong River at My Thuan Bridge, (2) the Bassac River at Can Tho, (3) the Nha Be Port, and (4) the Thi Vai. Input data at Can Tho and My Thuan boundaries include measured water discharge (Q), averaged SSC values through the cross-section at the My Thuan bridge, and the cross-section at Can Tho bridge. Input data at Nha Be and Thi Vai were measured Z at Nha Be station (Ho Chi Minh City) and averaged SSC values range from 0.04–0.14 g L−1. The averaged water temperature and salinity were imposed at the river boundaries: in Can Tho and My Thuan, T = 27.5 °C and S = 0; in Nha Be, Thi Vai, and My Thanh, salinity was measured every hour, varying in time and constant along the boundary, with values, respectively, of T = 28 °C, S range 0–7 psu, T = 28 °C, S range 10–24 psu, and T = 29 °C, S range 6–22 psu.
The spatial distribution of roughness height coefficients, with values in the range 20–53 mm, was used to set the bed resistance in this study and bed roughness with values in the range of 0.001–0.002 m [61,62]. The horizontal eddy viscosity considered the Smagorinsky formulation with a constant value of 0.5. The vertical eddy viscosity specified k-ε formulation, where the eddy viscosity is determined as a function of the turbulent kinetic energy (TKE), k, and the dissipation of TKE, ε. The two additional transport equations must be solved for TKE and the dissipation of TKE [63]. The solution of these equations is automatically invoked.
In the MRD, suspended sediment is fine sand/silt or cohesive, flocculating material. Koehnken et al. [64] reported that 98% of the total suspended sediment load in Can Tho is silt and clay. Grain sizes are coarser upstream and finer downstream [65]. The median grain sizes d50 are 15 μm (upstream, near Can Tho) and 3.9 μm in the downstream estuary [32,66]. In the dry season, measured floc size was 30–40 μm, with about 20–40% of clay content in volume [30]. In the flood season, the floc size was 40–125 μm, with 20–30% clay content in volume [32]. Measured grain sizes of noncohesive particles in the MRD coastal area range from 29 to 252 μm (mean of 113 μm) in the flood season (9/2013) and from 15 to 262 μm (mean of 103 μm) in the dry season (4/2014) [67]. Recently, a study of sediment grain size in the Hau River [68] showed that median grain sizes range from 5 to 20 μm. Therefore, the sediment grain size d50 was specified by spatial distribution, with values in the range of 15–63 μm used in our modeling.
The settling velocity of fine sediment plays an important role in sediment transport. It is enhanced by high organic matter [69]. Flocculation of suspended sediment is dependent on organic matter content and saline [70]. The variation of settling velocity with salinity, modeled by multiplying the settling velocity with a factor, is C1 and C2, where C1 and C2 are calibration parameters and are, by default, set to C1 = 0.5 and C2 = −0.33 [70].
The expression of Burt [71] is used for the variation of the settling velocity of flocs () with saline water (>5 ppt), expressed by for c ≤ 10 kg/m3.
Flocculation is when the concentration of sediment is high enough for the sediment flocs to influence each other’s settling velocity [56].
where is settling velocity of flocs (m/s); C is the volume concentration; is the concentration at which flocculation begins; is the total concentration of sediment; is the concentration at which hindered settling begins; w0 is settling velocity coefficients; is the power constant (1 to 2); is the density of the grain material. The relation of c ≤ 10 kg m−3 describes the flocculation of particles based on particle collision. The higher concentration, the higher possibility of the particles flocculating.
For the cohesive sediments, a model for flow and sediment interaction is applied in the Mud transport module in the approach of Krone [72]. In the Mud transport module, erosion can be described in two ways depending upon whether the bed is dense and consolidated, following Partheniades’ formulation [73], or soft and partly consolidated, following Parchure and Mehtas’ formulation [74]. In this study, the erosion description is “soft mud” for Layer 1 and “hard mud” for Layer 2. For each layer, the parameters required to simulate the cohesive sediment transport include critical bed shear stresses for erosion (which is specified by spatial distribution, varying in the domain; τce ranged from 0.1 to 0.3 Nm−2 for two layers), deposition (τcd ranged from 0.06 to 0.08 Nm−2 for Layer 1 and 0.1 to 0.15 Nm−2 for Layer 2), and the particle settling velocity (ws) [75]. In addition, the density of the bed layer, specified for each layer, is 180 kg m−3 for Layer 1 and 400 kg m−3 for Layer 2.
Fine sand fraction transport was included in the model and used Van Rijn’s formulation [76,77]. The sand transport formulations can be activated in the mud transport module in case a certain percentage of the bed material is in the fine sand fraction between 63 and 125 μm that may be transported both in suspension and as bed load. The bottom-boundary layer calculation accounts for the interaction of wave and current over a moveable bed [78,79,80,81,82,83].
The model was set up and run for two different periods: the dry season (9–12 April 2009) and the flood season (20–28 August 2009). The time step was set to 12 s.
2.3.3. Model Validation and Calibration
To calibrate and validate the model, the Nash–Sutcliffe efficiency coefficient E [84] number was calculated for scenario simulation:
where and are simulated and measured, respectively; i is the hourly time step; N is the number of simulations.
The model MIKE 21/3 Couple FM, calibrated with the stability of the numerical scheme, should be secure if the CFL (Courant–Friedrich–Levy) number is less than 1 for all modules. For the Hydrodynamic module, the Courant–Friedrich–Levy (CFL) number for each grid element is defined as (see [55,56])
where h is the total water depth; u, v, and w are the velocity components in the x, y, and z directions, respectively; g is the gravitational acceleration; Δx, Δy, and Δz are the characteristic length scales in the x-, y-, and z-directions, respectively, for an element and Δt is the time step interval. The characteristic length scale, Δx and Δy, is approximated by the minimum edge length for each grid element, and the water depth and velocity component are evaluated at the element center. Δz is the thickness between sigma layers.
For the transport equations (Salinity, SSC), the CFL number for each grid element is defined as (see [56])
For the wave module, the CFL number for each grid element is defined as
where , , , and is the propagation velocity of a wave group in the four-dimensional phase space x, y, and ; Δx and Δy are the characteristic length scale in the x- and y-directions for an element; and are discrete intervals in the direction and frequency spaces; Δt is the time step interval.
To validate model calculation, water samples and water levels at hydrometeorological stations of Hau, Co Chien, Ham Luong, and Cua Dai Rivers’ mouths were observed. The calibration and validation of the model are illustrated in the supplementary material (Figures S1–S6). After calibration (a suitable value of Δt was selected to keep CFC less than 1), comparisons showed good agreement between the model results and the measurements, with a Nash–Sutcliffe efficiency coefficient E between 0.8 and 0.9. Current velocity measured at the S11 station in the dry season (Figure S4a) and the flood season (Figure S4b) were analyzed to provide U and V components, which were compared with model simulations. The comparison showed an acceptable agreement between the model and the measurements, with a Nash-Sutcliffe efficiency coefficient E of more than 0.7. For suspended sediment and salinity calibration, simulated results were temporally and spatially compared to observed data. To temporally calibrate SSC and salinity, the simulated results were compared to data collected at S11 (Figure S3) and D4 (Figure S5) stations in the dry and flood seasons in front of the mouth of the Hau River, also resulting in an acceptable E coefficient of 0.7. Spatially, we focused on a qualitative comparison between the vertical distributions of observed and modeled sediment concentration throughout the tidal cycle. In the Mekong River delta, the maximum tidal water level and tidal amplitude are increasing, while the tidal phase at the coast is decreasing. In addition, the maximum water levels are rising faster than the sea level rise because the tides themselves are modified by the sea level rise. This effect is particularly pronounced for semidiurnal tides and less so for diurnal tides [50].
3. Results
3.1. Temporal Distribution of Salinity, Velocity, and SSC
3.1.1. Station S0
In the dry season, there were salinity changes of 2–6 psu in the flood tide and high and ebb tides. At low tide, salinity was approximately zero (Figure 3a). The velocity in flood and ebb tides could reach a maximum at the surface and middle layers (120 cm s−1) and gradually decreased towards the bottom layer (40 cm s−1). The direction of the current is southeastward at the ebb tide, and this was upheld for about 8 h. Otherwise, the direction of the current is toward the northeast in the flood tide for about 5 h (Figure 3c). SSC varied by 0.2–0.3 g L−1 in ebb and flood tides and by about 0.1–0.2 g L−1 in other tidal stages (Figure 3e).
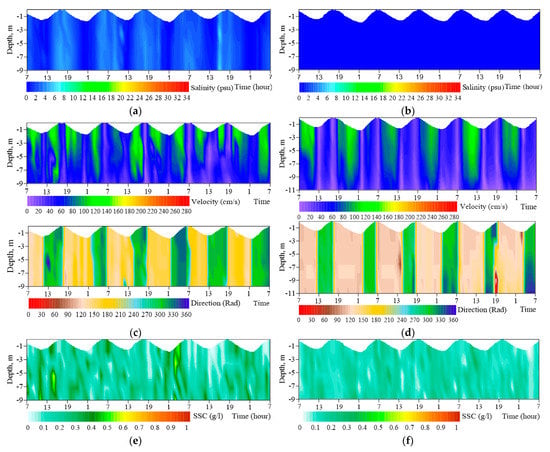
Figure 3.
Time series plot of the distribution of salinity, currents (velocity, direction), and SSC at Station S0 in the dry season (9–12 April 2009) and flood season (22–25 August 2009): (a) salinity in the dry season; (b) salinity in the flood season; (c) current in the dry season; (d) current in the flood season; (e) SSC in the dry season; (f) SSC in the flood season.
In the flood season, very low salinity (<0.2 psu) was identified (Figure 3b). During the ebb tide, the flow moved from northwest to southeast in about 8 h, with velocity changing from 80 to 100 cm s−1, and gradually decreased from the surface to the near-bottom (60 cm s−1; Figure 3d); SSC was fairly homogeneously varied by 0.2–0.35 g L−1 (Figure 3f). In the flood tide, the flow moved inland, with a direction from southeast to northwest, in about 5 h, the velocity changed from 40 to 60 cm s−1 (sometimes reaching 70 cm s−1). At the near-bottom, velocities changed around 20 cm s−1 (Figure 3d). At high tide, velocities were small (less than 20 cm s−1) and SSC was small as well (less than 0.1 g L−1) (Figure 3f).
3.1.2. Station D2
During the dry season, instantaneous water discharge reached a maximum of range of 14,000 to 20,000 m3 s−1 on the ebb tide and about −20,000 to −25,000 m3 s−1 on the flood tide, whereas during flood season, the maximum discharge was about 25,000 m3 s−1 on the ebb tide and about −14,000 to −25,000 m3 s−1 on the flood tide (Figure 4).

Figure 4.
Variation of 74 h water discharge measured at ADCP1, ADCP2, and ADCP3 stations during the dry season (9–12 April 2009) (a) and the flood season (22–25 August 2009) (b).
In the dry season, SSC varied by 0.5–0.7 g L−1 (near-bottom) and 0.2–0.4 g L−1 (in the above layers) (Figure 5e). Salinity changed by 4–16 psu and could sometimes reach 18 psu (Figure 5a), a big variation of salinity by tidal oscillation. Salinity changed by 12–16 psu during the first half of the flood tide, high tide, and the end half of the ebb tide, whereas in other tidal phase stages, salinity changed by 4–12 psu.
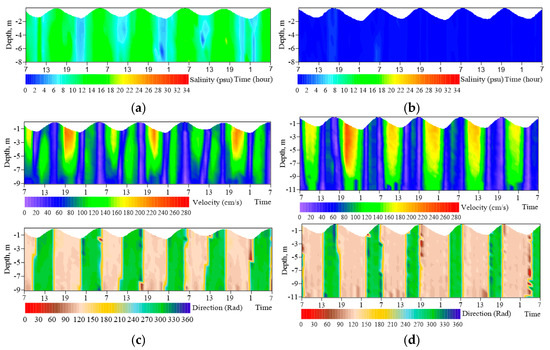

Figure 5.
Time series plot of the distribution of salinity, currents (velocity, direction), and SSC at Station D2 in the dry season (9–12 April 2009) and the flood season (22–25 August 2009): (a) salinity in the dry season; (b) salinity in the flood season; (c) current in the dry season; (d) current in the flood season; (e) SSC in the dry season; (f) SSC in the flood season.
The velocities changed in tidal phases (Figure 5c). In the ebb tide, they varied by 120–240 cm s−1 in the above layers and 180–120 cm s−1 at the near-bottom. Same as the S0 station, the direction of flow during the ebb tide was also southeastward (in about 8 h) and showed a stratification of flow direction. During the flood tide, they were northwestward and showed a stratification between the above layers and near-bottom layers. They were also higher in the middle layers (100–140 cm s−1), whereas at the near-surface and bottom, they changed by 100–140 cm s−1. At high and low tides, they varied by 20–60 cm s−1.
In the flood season, with a big river discharge (25,000 m3 s−1), velocities in the ebb tide were quite significant in the above layer (180–280 cm s−1) and the near-bottom layers (about 110–150 cm s−1), and the flow direction was southeastward and occurred in about 8 h. In contrast, in the flood tide, the flow direction was northwestward and almost uniform in the water column, and the velocities were mostly changing from 60 to 80 cm s−1 (middle of tidal stage phases) and 40 to 60 cm s−1 (in other tidal phases; Figure 5d).
The salt in the flood season in the survey metric series measured less than 3 psu. SSC’s time in the flood season was evenly distributed during a tidal cycle (Figure 5f). In the phase of the tide and the first three periods of the survey, SSC fluctuated between 0.2–0.3 g L−1, and in other periods, was smaller and only ranged from 0.1–0.2 g L−1. At a footing position, SSC reached the value of 0.3–0.4 g L−1.
3.1.3. Station S11
In the dry season, water river discharges reached 14,000 to 21,000 m3 s−1 in the ebb tide, whereas in the flood tide, they were from −18,000 to −20,000 m3 s−1 due to seawater moving inside the river. During the flood season, the maximum discharge was about 30,000 m3 s−1 on the ebb tide and about −14,000 to −20,000 m3 s−1 on the flood tide (Figure 4).
Flow velocities were weak in stratification and almost uniformed within the water column in the dry season. They increased from the first flood tide part (20–40 cm s−1) to the last flood tide part (60–80 cm s−1), with flow direction towards the northwest. During the ebb tide, they were higher, with prevalent southeastward direction, reaching 120–200 cm s−1 (above layers) and 20–40 cm s−1 at the near-bottom layer (Figure 6c). In other tidal stages like the high tide or around low tide, flow velocities varied by 1–30 cm s−1, with mostly no stratification. Salinity was quite high (12–20 psu) in the dry season due to reduced river discharge. Salinity varied by 16–20 psu at high tide and flood tide, whereas in other tidal phases, it was about 12–16psu (Figure 6a). SSC changed by 0.3–0.4 g L−1 (above layers) and 0.4–0.7 g L−1 (near-bottom layers) (Figure 6e). Those values were higher than the value inside the river and the flood season as well. The higher SSC is explained by the erosion process that is caused by high flow velocity.


Figure 6.
Time series plot of the distribution of salinity, currents (velocity, direction), and SSC at Station S11 in the dry season (9–12 April 2009) and the flood season (22–25 August 2009): (a) salinity in the dry season; (b) salinity in the flood season; (c) current in the dry season; (d) current in the flood season; (e) SSC in the dry season; (f) SSC in the flood season.
In the flood season, the flow velocities changed by 80–100 cm s−1 (sometimes reaching 120 cm s−1) at the above layers and 20–40 cm s−1 (near-bottom layers), with flow directions mostly towards the northwest in the flood tide, whereas in the ebb tide, they increased from the first part of the tidal phase (120–160 cm s−1) to last tidal phase (180–280 cm s−1) in the above layers and reached the maximum values of 120–160 cm s−1 at the near-bottom. During the ebb tide, they were mostly in the southeast. In other tidal stages (high tide, low tide), they were small and had a gap of direction between the above and lower layers (Figure 6d).
Salinity fluctuations in the flood season (Figure 6b) mainly ranged from 0–10 psu. In the edd tide, the salinity reached 14 psu, whereas it fluctuated by 0–2 psu most of the flood tide. During ebb tide, salinity was 3–6 psu for only 3 h. SSC (Figure 6f) tends to correlate with the tides. In the flood tide, SSC reached 0.2–0.3 g L−1 and it reached 0.4 g L−1 a few times. At the hight tide, SSC was below 0.2 g L−1. At the base, SSC was the strongest and fluctuated between 0.5 and 0.8 g L−1.
3.1.4. Station S12
In the dry season, instantaneous water discharge reached a maximum of about 5000 m3 s−1 on the ebb tide and about −10,000 m3 s−1 on the flood tide (Figure 4). In the flood tide, the biggest flow velocity (about 120 cm s−1) occurred a few times during the ebb tide but only existed in the surface layer. In the ebb tide, the flow velocities were mostly valued at the range of 40–70 cm s−1 at the surface layer and 20–40 cm s−1 at the near-bottom. At the high and low tides, the stratification of velocity was small; they were uniform in the water column with their fluctuation of 1–20 cm s−1. In the flood tide, they ranged from 80 to 120 cm s−1 in the water layer of 0–5 m (Figure 7c).
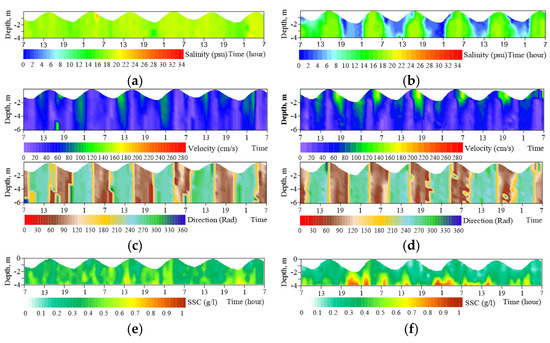
Figure 7.
Time series plot of the distribution of salinity, currents (velocity, direction), and SSC at Station S12 in the dry season (9–12 April 2009) and the flood season (22–25 August 2009): (a) salinity in the dry season; (b) salinity in the flood season; (c) current in the dry season; (d) current in the flood season; (e) SSC in the dry season; (f) SSC in the flood season.
Salinity ranged from 18 to 22 psu in the whole water column in the ebb tide phase, the peak, and the half-phase of the flood tide, in which it varied by 16–18 psu only at the time between the high tide and the tidal leg. In general, during the 74 h measurement period, salinity always existed at 16–22 psu in the water layer of 0–4 m (Figure 7a). The SSC was not regulated (Figure 7e), with a value of 0.4–0.7 g L−1 but only 0.2–0.4 g L−1 on the surface layer. A few times during the tide, SSC reached a peak at the bottom layer when the flow velocities were 80–120 cm s−1 in the whole water column. As a result, sedimentation and erosion occurred.
During the flood season, the maximum discharge was about 10,000 m3 s−1 on both the ebb and flood tides. The rate of water discharge in both tidal phases was equal in the water layer of 0–3 m, but the flow rate during the flood phase was double the rate in the ebb phase, with the highest rate up to 180 cm s−1, descending until 100 cm s−1. At the bottom layer, the flow velocities were quite uniform with values of 20–40 cm s−1; at the beginning of the tide, the flow could reach 80 cm s−1 and descended from 40–60 cm s−1 to 20–40 cm s−1 on the bottom floor (Figure 6d). The flow had northwestern (rising) and southwestern (withdrawal) orientations. At some point, it was possible to see the flow from the opposite side going towards the opposite direction, showing the flow when the tide had not transferred the state to the tide (Figure 7d).
SSC tends to correlate with the flow velocity. During the flood tide, at the bottom, SSC reached 0.5–0.8 g L−1. It might have caused a suspension through the influence of the large velocity flows. In the ebb tide, SSC only ranged 0.3–0.5 g L−1 (Figure 7f). However, overall, SSC had the measured value rank of 0.3–0.8 g L−1.
3.2. Tidal Variation of Salinity and SSC in a Long Channel
3.2.1. At High Tide
In the dry season, seawater penetrates deep into the river. At the station S0, salinity measured 0.1–4 psu. At station D2, the measured salinity was 16 psu, and the regions between S0 and D2 had a water block of 5–15 psu during the peak. In contrast, there was a water mass of salt from 16 to 20 psu in the regions between staions D2 to S10; the seawater that carries sediment from the sea had expanded onto the shore and it repelled the freshwater masses from the river, causing the disturbance, and provided energy to the stronger active salt wedge that was caused by the processes of erosion and deposition. The region with a high amount of sediment was extended from station T1 to near the station S0 (S0, 5 km) and the peak value was found from station D2 to S11, with the salt wedge most active in both the tide cycles.
During the hight tide, the salt wedge appeared in the regions between the stations S0 and D2 but was unstable, and it continued to move down to the station D2 during the reign and survived the sustainable salt wedge (Figure 8a, top panels). The modeled salt in the region between stations D2 and S12 was larger than the observed one (Figure 8a, bottom panels). However, the trend and position of the salt wedges were quite similar to each other. Thus, the affected variation of salt and the salt stratification in the dry season were quite large, followed by the process of erosion and the deposition of stronger operations. Sediments originating from the sea have the opportunity to penetrate deep into the estuary, causing disturbance, erosion, and deposition here. In the surface layer, SSC ranged from 0.1 to 0.2 g L−1, with the middle floor from 0.2 to 0.4 g L−1; the area exists in the largest turbidity in the dry season episodes, from stations D3 to S12, with the value of 0.4–0.6 g L−1 at the surface and 0.6–1 g L−1 on the bottom floor (Figure 9c, top panels). The modeled results were also similar to the observed ones (Figure 9c, bottom panels). At stations T1 to T3, SSC was less than 0.02 g L−1.
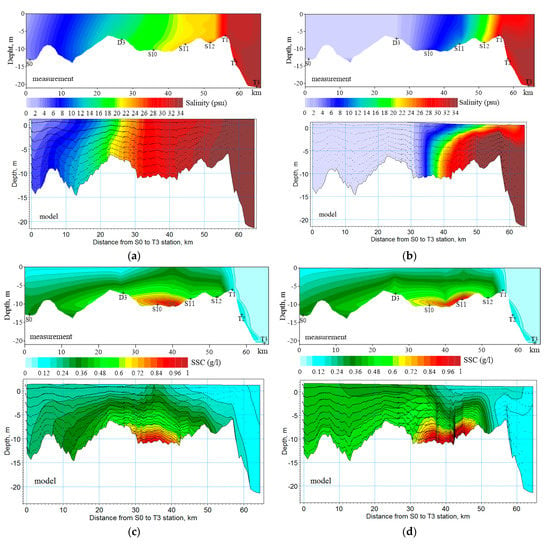
Figure 8.
Along-channel salinity and SSC distribution at high tide: (a) salinity in the dry season; (b) salinity in the flood season; (c) SSC in the dry season; (d) SSC in the flood season.


Figure 9.
Along-channel salinity and SSC distribution at low tide: (a) salinity in the dry season; (b) salinity in the flood season; (c) SSC in the dry season; (d) SSC in the flood season.
During the flood season, large freshwater flows cornered the bottom of the river between stations D2 and S10. The changing tide limited the flow of penetrating traffic; at the same time, the below-water mass, with a salinity of 18 psu, entered the shore. In contrast, on the surface, the freshwater layer persisted and, slowly moving, formed a salt wedge with a width of about 10 km, existing for about 5 h until the peak of flow was reached. The salt at the wedge fluctuated between 4 to 8 psu (under a salt wedge, 10–18 psu; on the salt wedge, 0–8 psu; see Figure 8b). At the time of the peak, SSC existed in a chiseled area with high floating sediment, with a value of 0.4–0.8 g L−1; the highest SSC on the bottom floor was between stations D2 and S12. At stations T1–T3, SSC was less than 0.02 g L−1 (Figure 8d).
According to Wolanski et al. [32], SSC in the regions of stations S0–D2 varied by 0.15–0.3 g L−1. SSC was deposited by the tide, moving the state, and suspended when the flow rate was more than 0.5 m s−1. There is no large perforated zone in the freshwater area from Can Tho to station D2 in rainy season conditions. In addition, according to Nowacki et al. [49], at three cross-sections of the Hau River area (the two sections in the regions of stations S0–D2 and the other section off station S0, about 10 km towards Can Tho), when the salt was at zero, SSC varied by 0.1–0.2 g L−1 and reached 0.4 g L−1 at the bottom. Thus, at the time of the peak during the flood season, a salt wedge with a length of about 20 km was formed; above the wedge, the salinity salts ranged 0–8 psu, and, below the wedge, the salinity was 10–18 psu; SSC of the salt wedge was 0.4–0.8 g L−1. The suspended sediment was deposited by the tide, strengthening the withdrawal state, and resuspended when the flow rate during the withdrawal period increased.
3.2.2. At Low Tide
In the dry season, the saltwater mass of 15–20 psu persists in the regions of stations D2–S12 during the whole tidal cycle. The regions of salt changes and the forming salt wedge were located at stations S0 to S10, with a distance of 35 km. The salinity ranged from 1 to 8 psu at stations S0–D2 and 9 to 14 psu at stations D2–S10 (Figure 9a, top and bottom panels). As such, the impacts of salinity variation and stratification are much more significant than in the flood season. The observed SSC varied by 0.1–0.3 g L−1 at the surface layer and 0.4–0.8 g L−1 in the lower layers (Figure 9c, bottom panels).
During the flood season, the high river discharge and ebb tide flow, transporting freshwater to the coastal area (the freshwater over station S12 was about 2 km in length), causes the start of river–sea interactions. At stations S0–S11, salinity was almost zero. A salinity of 2–25 psu was distributed around stations S11 (bottom layer)–T2 (surface layers), which formed a salty wedge of 20 km (Figure 9c, top and bottom panels).
In the river, SSC was derived from the coastal zone (station T1), both in the observed and modeled results. The largest SSC was contributed by the bottom of stations S11 and S12. SSC was 0.4–0.8 g L−1 at the bottom, 0.3–0.4 g L−1 in the middle, and 0.1–0.2 g L−1 in the other layers.
3.3. Tidal Variation of Salinity and SSC
The spatial distribution of salt and SSC times at high and low tides in the dry and flood seasons is calculated based on the 3D model. The model has been calibrated and validated based on the survey data. The distribution results of the salt and SSC on the surface and bottom layers, over two seasons, are shown in Figure 10 and Figure 11.
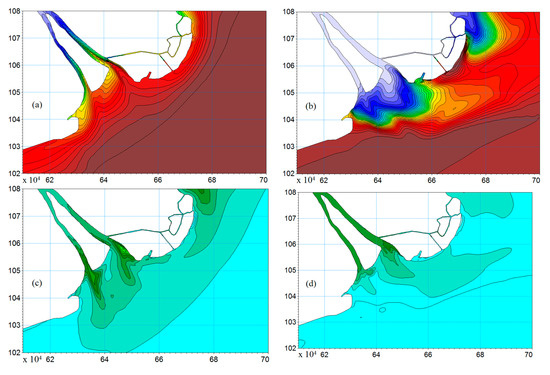
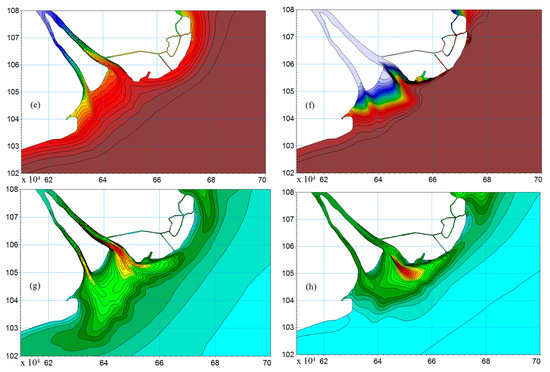
Figure 10.
Spatial distribution of salinity (psu) and SSC (g L−1) at high tide; (a,b) salinity in the dry and flood seasons in the surface layer; (c,d) SSC in the dry and flood seasons in the surface layer; (e,f) salinity in the dry and flood seasons in the bottom layer; (g,h) SSC in the dry and flood seasons in the bottom layer. Color scale is the same as in Figure 8.
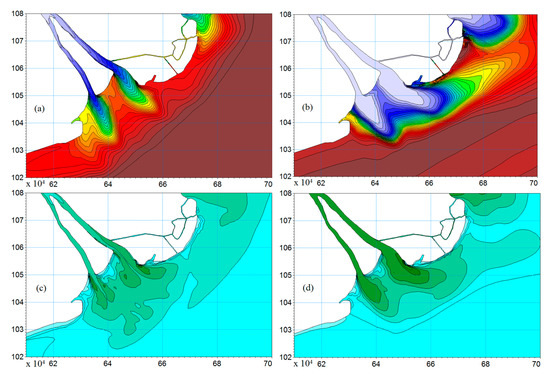
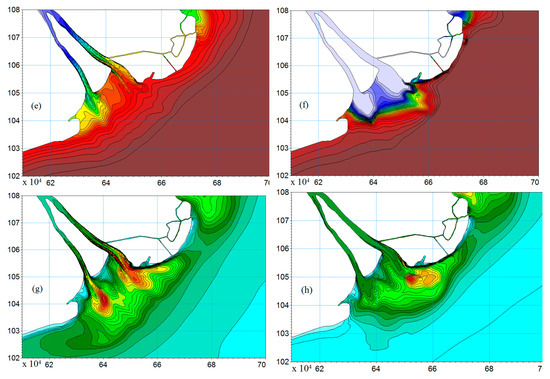
Figure 11.
Spatial distribution of salinity (psu) and SSC (g L−1) at low tide; (a,b) salinity in the dry and flood seasons in the surface layer; (c,d) SSC in the dry and flood seasons in the surface layer; (e,f) salinity in the dry and flood seasons in the bottom layer; (g,h) SSC in the dry and flood seasons in the bottom layer. Color scale is the same as in Figure 8.
3.3.1. High Tide
At the surface layer, seawater in the flood season can run to D2 station with a salinity of 4–19 psu. Meanwhile, salinity was higher outside station S12 (20–29 psu). The high salinity zones have been compressed due to the strong freshwater from the river (Figure 10b). Otherwise, in the dry season, salinity reached 20–29 psu at the surface and occurred over station D2. Seawater with a salinity of 4–19 psu appeared at station S0 (Figure 10a). With a small SSC in the dry season and seawater invading the river mouth, this formats the salt wedge and ETMs with a length of 50 km from station S0 (Figure 10c). Compared to the observed data, the modeled results were more valuable; the peak of salinity could be 20–29 psu at the surface (and over station D2 as well). The lower salinity (2–19 psu) zone invaded station D2 and about 50 km inside the river (Figure 10a). An ETM of about 50 km, with SSC varying 0.2–0.4 g L−1, existed in the regions; the largest in the positions between stations D2–S12 (approx. 5 km) had the modeled SSC of 0.1–0.2 g L−1 (Figure 10c).
At the bottom layer, seawater penetrated for longer into the river, with a salinity of 20–29 psu at station S10, whereas the water with a salinity of 4–19 psu penetrated about 5 km, very close to station D2 (Figure 10f). This phenomenon caused strong stratified salt; the seawater of the middle layers invaded for longer inside the river than at the surface, forming the salt wedge and facilitating the SSC aggregation and deposition. This trend was also evident in the middle layers during the dry season: seawater with a salinity of 8–20 psu penetrated over station S0 and seawater of 29 psu appeared at the estuary, close to station D2 (Figure 10e). During the flood season, SSC was varied from 0.6 to 0.8 g L−1 at station S11 and was about 5 km from station D2 (Figure 10h). In the dry season, SSC (0.5–0.7 g L−1) was widely distributed between stations S0–D2 and station S12 (Figure 10g). The SSC distribution outside the continent tends to go inland, whereas the flood season tends to be the opposite. For the middle layer, SSC in the flood season was higher than in the dry season in the area of stations S11–S12 but was less than in the dry season in the regions of stations S0–D2. SSC was 0.3–0.6 g L−1 in the estuary and less than 0.02 g L−1 outside the river mouth [44].
3.3.2. Low Tide
At the surface layer, the highest SSC during the flood season reached 0.5 g L−1 and was gathered in the estuaries area. The high-value SSC range was concentrated at depths of 5 m towards the mouth of the river. Otherwise, SSC rarely exceeded 0.02 g L−1 (Figure 11d) [44]. SSC varied strongly depending on the tidal oscillation. The large tidal amplitude and high river water flow causes a relatively strong tidal velocity at the time of the tide and strongly impacts the transport of SSC offshore. In addition, the seawater was pushed out outside station S10 and the regions with a salinity of 2–20 psu were distributed around 15 km toward the shore. The water layer with a salinity of 8–27 psu was pushed far beyond the ridge (Figure 11b). In the dry season, the small river discharge (less than 1/3 in the flood season) and maximum tidal amplitude (over 4.2 m) facilitates the seawater penetration of the estuary (Figure 11a). The limitation of river discharge caused a significant decline in SSC in the dry season compared to the flood season. The modeled SSC was 0.2–0.3 g L−1, and the largest was 0.4 g L−1 (Figure 11c).
The salt stratigraphy and the invading seawater show in the bottom layer. This forms the salt wedge during this tidal phase. The water with a salinity of 8–22 psu had penetrated the estuary at station S10, about 10 km off (Figure 11f). Meanwhile, in the dry season, seawater with a salinity of 22 psu penetrated the estuary to station D2 (Figure 11e). In the river, the seawater (5–15 psu) predominated and penetrated station S0. The simulation results of SSC in the bottom layer were much higher than in the middle and surface layers. The value was up to 0.8 g L−1 and located in the estuary. The causes of the high SSC at the bottom layer were (1) sea–river interaction, as forming the salt wedge facilitates the aggregating and settling down process [49], (2) the process of motivation in areas eroded the bottom to promote the resuspension of the sedimentary bottom, which contribute to the formation of large areas of perforated water [30,44]. During the dry season, when the tide descends, the salt wedge persisted in regions 50 km long, resulting in an advantage for sediment and deposition in stratification conditions. In addition, the influence of hydrodynamic processes such as wave actions on the tidal current in the bottom layer causes erosion and bottom sedimentary. This phenomenon increases SSC (0.4–0.8 g L−1), although it would be lower than in the flood season (Figure 11g,h).
4. Discussion
4.1. Time Series of the Distribution of Salinity and SSC at Stations Over the Year
The 3D numerical models with a combination of hydrodynamics (wave and suspended sediment transport) were applied to simulate the seasonal present-day interannual variation of water and suspended sediment transport processes (flood and dry seasons over the year in 2009) in the Mekong Delta. Comparisons with limited observations showed that the three-dimensional coupled model captured the spatial patterns and temporal variability of water elevation, current components, salinity, and SSC reasonably well.
The temporal distribution of SSC in the months of 2009 was analyzed at stations S0, D2, S11, S12, and T1 (Figure 12). At station S0, no salinity or salt wedge was present during the measurement and simulation processes (one year, Figure 13). The SSC value at the surface and middle layers was 0.2–0.3 g L−1 and reached 0.35 g L−1 near the bed in the dry season (from January to July; Figure 12), which was somewhat lower than the estimation of Wolanski et al. [30,32] and Nowacki et al. [49]. During the flood season (from July to November), SSC at the surface and middle layers were the greatest, with 0.5 g L−1, and ranged 0.5–0.6 g L−1 near the bed, which was somewhat similar to the estimate from the data collection of Wolanski et al. [32] and Nowacki et al. [49].
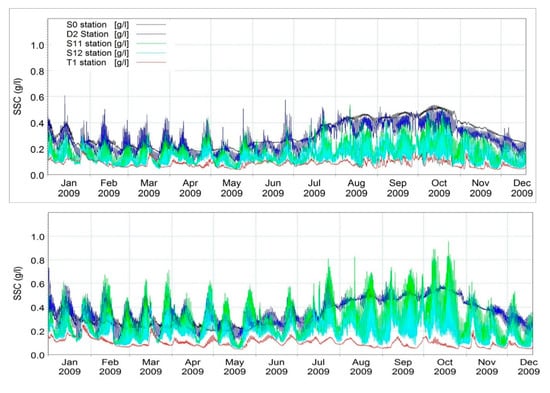
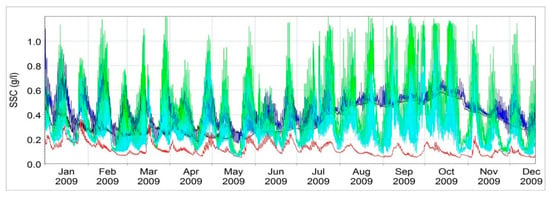
Figure 12.
Time series of the distribution of SSC (g L−1) at stations S0, D2, S11, S12, and T1. Surface layer (top panels); middle layer (middle panels); bottom layer (bottom panels).

Figure 13.
Time series of the distribution of salinity (psu) at station S0.
In contrast to station S0, the salty wedge was present during the dry season (November to June) at station D2. The flow velocity was greater than at station S0. Salinity ranged between 4 and 12 psu (Figure 14), and SSC was 0.2–0.4 g L−1 in the surface layer and 0.3–0.6 g L−1 in the middle layer and near the bed (Figure 12). During the flood season (July to November), no salinity was present at this station (Figure 14). Flow velocity was strongest, and SSC was 0.3–0.5 g L−1 at the surface and middle layers and near the bed; SSC reached 0.6 g L−1 during the strongest flow (Figure 12). SSC outside the salt wedge, correlated with flow velocity, was higher on ebb tides [49]. Monthly surface SSCs from satellite data were higher in July to March (sometimes exceeding 0.1 g L−1); this was related to the sources from the inland during the flood season and resuspension during the northeast monsoon [40]. The greatest SSC was measured at the areas located in between the shoreline and the seaward limit of the subaqueous delta, with greater values occurring near-bed [85].

Figure 14.
Time series of the distribution of salinity (psu) at station D2.
At stations S11, S12, and T1, the distribution of salinity (Figure 15, Figure 16 and Figure 17) indicates the minimum SSC in the surface layer over the year was 0.1–0.2 g L−1 (Figure 12, top panels), which is somewhat similar the estimation of Loisel et al. [40]. The SSC magnitudes and patterns provide valuable insight into sediment delivery pathways. During the high-discharge season, plume SSC was less than those measured in the river (at Can Tho) and Dinh An mouth [34]; SSC reached 1 g L−1 near the bed at station S12 and the largest SSC (>1 g L−1) was at station S11 during the strongest bed shear velocity, whereas SSC at station T1 (near the fore-set) was less than 0.3 g L−1 (Figure 12, bottom panels). All these stations are on the shallow clinoform; the Mekong clinoform is distinguished among large river deltas in that the transition between the broad, flat top-set and the steeper fore-set lies at a depth of only 4–6 m [44]. In high runoff, sediment settles from the flume and the ebb current helps deliver it to the fore-set, whereas return flow under the plume might limit subsequent seaward dispersal. In low runoff, flood current and dominant landward current limit cross-shelf dispersal, and sediment is resuspended by waves and currents [44]. The shallow depth (<5 m) of the subaqueous delta top-set [86] suggests that even moderate waves could resuspend sediment there. Thus, on the shallow clinoform, sediment is not only stored on the top-set during the high discharge season but also generally retained on the top-set during low discharge season. This effect was observed in the Dinh An river in April, the low-discharge season [30,34,49].
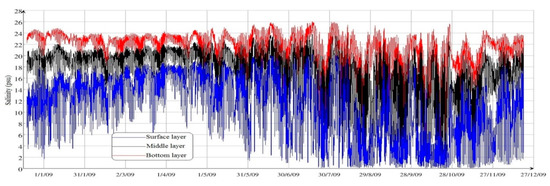
Figure 15.
Time series of the distribution of salinity (psu) at station S11.

Figure 16.
Time series of the distribution of salinity (psu) at station S12.

Figure 17.
Time series of the distribution of salinity (psu) at station T1.
4.2. General Patterns of ETMs at Hau River Mouth
Based on the measured data, Wolanski et al. [30,32] proposed a conceptual model of the seasonal variation of pathways of fine sediment in the Mekong River delta. Sediment is discharged during the previous flood season, deposited on the shelf, and is transported back into the river mouth during the next dry season. The net sediment flux in the flood season causes most of the sediment deposits in the shallow coastal water (<20 km off the coast), approximately the seaward boundary in the region of freshwater influence [33]. Otherwise, in the dry season, under the influences of stronger wind and waves, sediment would be transported back to the estuary and deposited inside of the river mouth. The maximum turbidity zones were established inside the estuary in the dry season [32]. In the Mekong River delta, SSCs were mainly expected to be transported as wash load within the river flow. SSC from the river exceeds 0.2 g L−1; the free settling regime and low settling velocity, arrival into the river mouths, the combined effects of the saline gradient, and the tidal mixing of fluvial and oceanic waters enhance flocculation and induce water stratification [29].
In this study, the regions were identified and the results were analyzed from the 74 h of continuous data (measuring 5 floors at the same time) at the time of the peak and tidal footing during the dry season (9–12 April 2009) and the flood season (22–25 August 2009) at stations S0, D2, S11, S12, and T1. One cross-section of stations S0–T3, passing through D2, S11, S12, T1, and T2, was reflected upon. The modeled and observed SSCs in this cross-section were analyzed monthly in the surface and bottom layers (Figure 18 and Figure 19). Two main origins were proposed to explain the mechanism of forming estuarine turbidity maximum in the Hau River mouth.


Figure 18.
Spatial distribution of monthly mean SSC in the surface layer. Color scale is the same as in Figure 8.
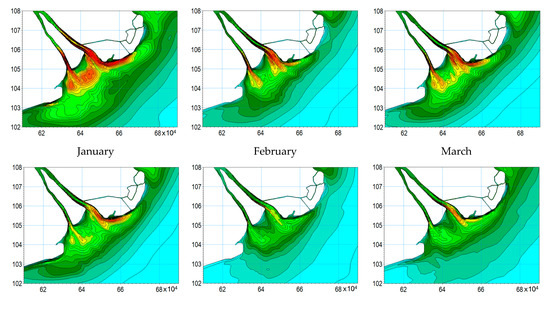
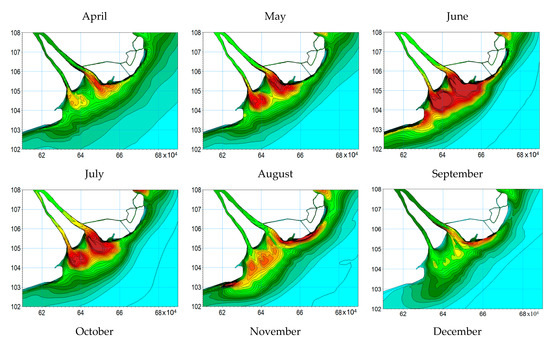
Figure 19.
Spatial distribution of monthly mean SSC in the bottom layer. Color scale is the same as in Figure 8.
The first mechanism involves the process of suspended sediment from the river when interacting with seawater, speeding up the flocculation. When combined with the asymmetry of the tidal current, this could create the region with ETM moving in/out with the tidal current going up and down, and when surface flow velocity goes towards the sea, the bottom baroclinic flow has a decisive role in deposition/erosion, causing the maximum SSC. During the flood season, the salt wedge near the river mouth, at the peak of the tide, would be pushing towards the direction of sea when the tides ebb, with a scope of 20 km (Figure 20, bottom panels). In the dry season, there is estuary disturbance as well, with a salt wedge forming, but this is relatively weak or does not exist, depending on the time of the tide (Figure 20, top panels).
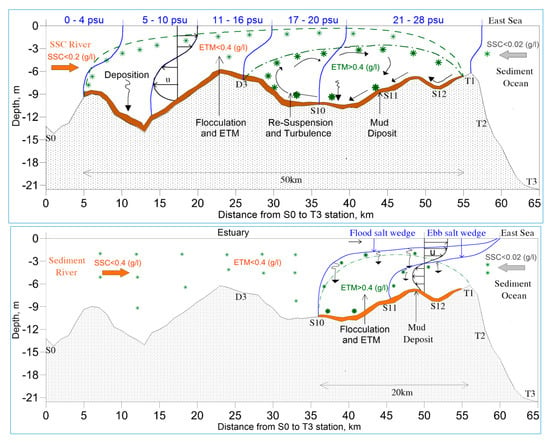
Figure 20.
Conceptual model of the estuarine turbidity maximum in the Hau river mouth: dry season (top panels) and flood season (bottom panels).
The second mechanism is related to the dynamic controls on shallow clinoform in the Mekong Delta; SSC fluctuates under the influence of flow velocities and tides. When the tidal currents are high in the river mouth and subaqueous delta, SSC increases and then decreases from the near-bottom to the surface. This transporting trend is the deposition process of the tide due to the shift from ebb to flood phases or conversely, and then being resuspended when the flow velocity increases during the tidal phase. The trend of tidal currents from the ebb tidal phase to the rising tidal phase occurs very fast, whereas the change between the two tidal phases takes 3 h. It leads to an asymmetry of the tidal ellipses and causes sediment transport from the subaqueous delta platform (top-set) into the Hau River mouth. In the flood season, sediment from the river is transported to the sea (30 km from the mouth of the river) and is limited by the flood tidal flow that goes subsequently seaward and deposition on the subaqueous delta, transported northward. During the dry season, sediment beds in the subaqueous delta (top-set) are resuspended and transported landward to dominant estuaries [44].
5. Conclusions
By applying MIKE 21/3 coupled model FM to simulate the tidal, seasonal, and interannual variations of the water and suspended sediment transport processes in the Mekong River delta, the results demonstrate that the salt wedges in the Hau River mouth exist year-round, but their position and length vary depending on the hydrographic season, tidal phase, and the strong change in space and time. In the flood season, their length is short, about 15 to 25 km, and the longest is in the ebb-tidal phase, and the shortest is in the flood-tide distributed from the estuary to the subaqueous delta. In contrast, in the dry season, their length is about 50 km in the ebb-tidal phase, and it reduces in the flood tide. In addition, ETM in the mouth of the Hau River exists year-round and is maintained due to the barocline effect of salinity and the sedimentation in the brackish water. The ETM position is almost the same as salt wedges in both spatial and temporal terms. Due to the impacts of waves and tidal currents, SSCs in the dry season are higher than in the rainy season, and forming ETMs in the dry season is on a large scale than in the flood season.
The interaction of river dynamics and the fluctuations of water levels form deposition areas at estuaries, and the hydrodynamic conditions in the subaqueous delta are affected by sediment transport, which rules erosion–deposition. The accumulation of sediment in the subaqueous delta, submerged in the flood season, is only temporary when there is a large supply of sediment from the continental [32,33]. In the dry season, under the influence of dynamic processes in the condition of sediment deficiency, sediment redistribution takes place, forming the characteristics of the bottom variation [30,44].
Supplementary Materials
The following are available online at https://www.mdpi.com/2073-4441/12/9/2547/s1. Figure S1: Comparison between simulations and measurements of the water elevation in flood season (15–30 September 2009). (a) Tran De (Hau river mouth); (b) Ben Trai (Co Chien river mouth); (c) An Thuan (Ham Luong river mouth); (d) Binh Dai (Cua Dai river mouth). Figure S2: Comparison between simulations and measurements of the discharge in flood season (16–28 September 2009) at Dinh An, Co Chien, Ham Luong and Cua Dai river mouths. Figure S3: Comparison between simulations and measurements of the SSC at S12 station in the surface, middle and bottom layers. (a) dry season (9–12 April 2009); (b) flood season (22–25 August 2009). Figure S4: Comparison between simulations and measurements of the current components at S11 station in flood season (20–28 August 2009). (a) surface layer; (b) bottom layer. Figure S5: Comparison between simulations and measurements of the salinity at D4 station in the surface and bottom layers. (a) dry season (9–12 April 2009); (b) flood season (22–25 August 2009). Figure S6. Comparison between simulations and measurements of the current components at S12 station in dry season (9–12 April 2009). (a) surface layer; (b) bottom layer.
Author Contributions
N.N.T., D.V.U., and D.H.C. conceived the study; N.X.T., N.N.T., and P.D.H. organized the field trip; N.N.T. and L.D.M. analyzed the data; N.N.T. and D.V.U. wrote the paper. All authors have read and agreed to the published version of the manuscript.
Funding
This research was funded by the Vietnam Academy of Science and Technology projects, grant number VAST05.06/18-19; VAST05.05/19-20 and KHCBTĐ.01/20-22; KHCBTĐ.02/18-20; national projects ĐTĐL.CN-28/17 and KC09.20/16-20.
Acknowledgments
We thank Tran Tan Phuc, the Chairman and CEO of PortCoast, for the provided data, and Nguyen Huu Nhan for his comments. The authors would also like to thank the anonymous reviewers and the editor for providing valuable comments which helped improve this manuscript.
Conflicts of Interest
The authors declare no conflict of interest.
References
- Jay, D.A.; Talke, S.A.; Hudson, A.; Twardowski, M. Chapter 2 - Estuarine turbidity maxima revisited: Instrumental approaches, remote sensing, modeling studies, and new directions. In Developments in Sedimentology; Ashworth, P.J., Best, J.L., Parsons, D.R., Eds.; Elsevier: Amsterdam, The Netherlands, 2015; Volume 68, pp. 49–109. [Google Scholar]
- Simenstad, C.A.; Jay, D.A.; Sherwood, C.R. Impacts of Watershed Management on Land-Margin Ecosystems: The Columbia River Estuary. In Watershed Management: Balancing Sustainability and Environmental Change; Naiman, R.J., Ed.; Springer: New York, NY, USA, 1992; pp. 266–306. [Google Scholar] [CrossRef]
- Fettweis, M.; Sas, M.; Monbaliu, J. Seasonal, Neap-spring and Tidal Variation of Cohesive Sediment Concentration in the Scheldt Estuary, Belgium. Estuar. Coast. Shelf Sci. 1998, 47, 21–36. [Google Scholar] [CrossRef]
- Mitchell, S.B.; Uncles, R.J. Estuarine sediments in macrotidal estuaries: Future research requirements and management challenges. Ocean Coast. Manag. 2013, 79, 97–100. [Google Scholar] [CrossRef]
- Li, Y.; Jia, J.; Zhu, Q.; Cheng, P.; Gao, S.; Wang, Y.P. Differentiating the effects of advection and resuspension on suspended sediment concentrations in a turbid estuary. Mar. Geol. 2018, 403, 179–190. [Google Scholar] [CrossRef]
- Grasso, F.; Verney, R.; Le Hir, P.; Thouvenin, B.; Schulz, E.; Kervella, Y.; Khojasteh Pour Fard, I.; Lemoine, J.-P.; Dumas, F.; Garnier, V. Suspended Sediment Dynamics in the Macrotidal Seine Estuary (France): 1. Numerical Modeling of Turbidity Maximum Dynamics. J. Geophys. Res. Ocean. 2018, 123, 558–577. [Google Scholar] [CrossRef]
- Hesse, R.F.; Zorndt, A.; Fröhle, P. Modelling dynamics of the estuarine turbidity maximum and local net deposition. Ocean Dyn. 2019, 69, 489–507. [Google Scholar] [CrossRef]
- Yang, Y.; Li, Y.; Sun, Z.; Fan, Y. Suspended sediment load in the turbidity maximum zone at the Yangtze River Estuary: The trends and causes. J. Geogr. Sci. 2014, 24, 129–142. [Google Scholar] [CrossRef]
- Bowden, K.F. Turbulence and mixing in estuaries. In The Estuary as a FilterThe Estuary as a Filter; Kennedy, V.S., Ed.; Academic Press: Orlando, FL, USA, 1984; pp. 15–26. [Google Scholar]
- Postma, H. Sediment transport and sedimentation in the estuarine environment. In Estuaries; Lauff, G.H., Ed.; American Association Advanced Scientific Publication: Washington, DC, USA, 1967; pp. 158–179. [Google Scholar]
- Toublanc, F.; Brenon, I.; Coulombier, T. Formation and structure of the turbidity maximum in the macrotidal Charente estuary (France): Influence of fluvial and tidal forcing. Estuar. Coast. Shelf Sci. 2016, 169, 1–14. [Google Scholar] [CrossRef]
- Van Rijn, L.; Grasmeijer, B. Effect of channel deepening on tidal flow and sediment transport—Part II: Muddy channels. Ocean Dyn. 2018, 68, 1481–1501. [Google Scholar] [CrossRef]
- Jalón-Rojas, I.; Schmidt, S.; Sottolichio, A.; Bertier, C. Tracking the turbidity maximum zone in the Loire Estuary (France) based on a long-term, high-resolution and high-frequency monitoring network. Cont. Shelf Res. 2016, 117, 1–11. [Google Scholar] [CrossRef]
- Brenon, I.; Le Hir, P. Modelling the Turbidity Maximum in the Seine Estuary (France): Identification of Formation Processes. Estuar. Coast. Shelf Sci. 1999, 49, 525–544. [Google Scholar] [CrossRef]
- Schubel, J.R. Turbidity Maximum of the Northern Chesapeake Bay. Science 1968, 161, 1013–1015. [Google Scholar] [CrossRef] [PubMed]
- Allen, G.P.; Salomon, J.C.; Bassoullet, P.; Du Penhoat, Y.; de Grandpré, C. Effects of tides on mixing and suspended sediment transport in macrotidal estuaries. Sediment. Geol. 1980, 26, 69–90. [Google Scholar] [CrossRef]
- Abril, G.; Riou, S.A.; Etcheber, H.; Frankignoulle, M.; de Wit, R.; Middelburg, J.J. Transient, Tidal Time-scale, Nitrogen Transformations in an Estuarine Turbidity Maximum—Fluid Mud System (The Gironde, South-west France). Estuar. Coast. Shelf Sci. 2000, 50, 703–715. [Google Scholar] [CrossRef]
- Sottolichio, A.; Hir, P.L.; Castaing, P. Modeling mechanisms for the stability of the turbidity maximum in the Gironde estuary, France. In Proceedings in Marine Science; McAnally, W.H., Mehta, A.J., Eds.; Elsevier: Amsterdam, The Netherlands, 2000; Volume 3, pp. 373–386. [Google Scholar]
- Grasso, F.; Le Hir, P. Influence of morphological changes on suspended sediment dynamics in a macrotidal estuary: Diachronic analysis in the Seine Estuary (France) from 1960 to 2010. Ocean Dyn. 2019, 69, 83–100. [Google Scholar] [CrossRef]
- Coleman, J.M.; Wright, L.D. Sedimentation in an Arid Macrotidal Alluvial River System: Ord River, Western Australia. J. Geol. 1978, 86, 621–642. [Google Scholar] [CrossRef]
- Allen, G.P.; Castaing, P. Suspended sediment transport from the Gironde estuary (France) onto the adjacent continental shelf. Mar. Geol. 1973, 14, 47–53. [Google Scholar] [CrossRef]
- Geyer, W.R.; Woodruff, J.D.; Traykovski, P. Sediment transport and trapping in the Hudson River estuary. Estuaries Coasts 2001, 24, 670–679. [Google Scholar] [CrossRef]
- Sanford, L.P.; Suttles, S.E.; Halka, J.P. Reconsidering the physics of the Chesapeake Bay estuarine turbidity maximum. Estuaries 2001, 24, 655–669. [Google Scholar] [CrossRef]
- Uncles, R.J.; Stephens, J.A. Nature of the Turbidity Maximum in the Tamar Estuary, U.K. Estuar. Coast. Shelf Sci. 1993, 36, 413–431. [Google Scholar] [CrossRef]
- Diaz, M.; Grasso, F.; Le Hir, P.; Sottolichio, A.; Caillaud, M.; Thouvenin, B. Modeling Mud and Sand Transfers Between a Macrotidal Estuary and the Continental Shelf: Influence of the Sediment Transport Parameterization. J. Geophys. Res. Ocean. 2020, 125, e2019JC015643. [Google Scholar] [CrossRef]
- Gao, J.-H.; Li, J.; Wang, H.; Bai, F.-L.; Cheng, Y.; Wang, Y.-P. Rapid changes of sediment dynamic processes in Yalu River Estuary under anthropogenic impacts. Int. J. Sediment Res. 2012, 27, 37–49. [Google Scholar] [CrossRef]
- Wan, Y.; Roelvink, D.; Li, W.; Qi, D.; Gu, F. Observation and modeling of the storm-induced fluid mud dynamics in a muddy-estuarine navigational channel. Geomorphology 2014, 217, 23–36. [Google Scholar] [CrossRef]
- Wolanski, E.; Nhan, N.H. Oceanography of the Mekong River estuary. In Mega-deltas of Asia Geological Evolution and Human Impact; Chen, Z., Saito, Y., Goodbred, J., Steven, L., Eds.; China Ocean Press: Beijing, China, 2005; pp. 113–115. [Google Scholar]
- Gratiot, N.; Bildstein, A.; Anh, T.T.; Thoss, H.; Denis, H.; Michallet, H.; Apel, H. Sediment flocculation in the Mekong River estuary, Vietnam, an important driver of geomorphological changes. C. R. Geosci. 2017, 349, 260–268. [Google Scholar] [CrossRef]
- Wolanski, E.; Nguyen Huu, N.; Simon, S. Sediment Dynamics during Low Flow Conditions in the Mekong River Estuary, Vietnam. J. Coast. Res. 1998, 14, 472–482. [Google Scholar]
- Thi Ha, D.; Ouillon, S.; Van Vinh, G. Water and Suspended Sediment Budgets in the Lower Mekong from High-Frequency Measurements (2009–2016). Water 2018, 10, 846. [Google Scholar] [CrossRef]
- Wolanski, E.; Ngoc Huan, N.; Trong Dao, L.; Huu Nhan, N.; Ngoc Thuy, N. Fine-sediment Dynamics in the Mekong River Estuary, Vietnam. Estuar. Coast. Shelf Sci. 1996, 43, 565–582. [Google Scholar] [CrossRef]
- Hein, H.; Hein, B.; Pohlmann, T. Recent sediment dynamics in the region of Mekong water influence. Glob. Planet. Chang. 2013, 110, 183–194. [Google Scholar] [CrossRef]
- McLachlan, R.L.; Ogston, A.S.; Allison, M.A. Implications of tidally-varying bed stress and intermittent estuarine stratification on fine-sediment dynamics through the Mekong’s tidal river to estuarine reach. Cont. Shelf Res. 2017, 147, 27–37. [Google Scholar] [CrossRef]
- Lap Nguyen, V.; Ta, T.K.O.; Tateishi, M. Late Holocene depositional environments and coastal evolution of the Mekong River Delta, Southern Vietnam. J. Asian Earth Sci. 2000, 18, 427–439. [Google Scholar] [CrossRef]
- Xue, Z.; Liu, J.P.; DeMaster, D.; Van Nguyen, L.; Ta, T.K.O. Late Holocene Evolution of the Mekong Subaqueous Delta, Southern Vietnam. Mar. Geol. 2010, 269, 46–60. [Google Scholar] [CrossRef]
- Stattegger, K.; Tjallingii, R.; Saito, Y.; Michelli, M.; Trung Thanh, N.; Wetzel, A. Mid to late Holocene sea-level reconstruction of Southeast Vietnam using beachrock and beach-ridge deposits. Glob. Planet. Chang. 2013, 110, 214–222. [Google Scholar] [CrossRef]
- Dung, B.V.; Stattegger, K.; Unverricht, D.; Phach, P.V.; Thanh, N.T. Late Pleistocene–Holocene seismic stratigraphy of the Southeast Vietnam Shelf. Glob. Planet. Chang. 2013, 110, 156–169. [Google Scholar] [CrossRef]
- Ta, T.K.O.; Nguyen, V.L.; Tateishi, M.; Kobayashi, I.; Tanabe, S.; Saito, Y. Holocene delta evolution and sediment discharge of the Mekong River, southern Vietnam. Quat. Sci. Rev. 2002, 21, 1807–1819. [Google Scholar] [CrossRef]
- Loisel, H.; Mangin, A.; Vantrepotte, V.; Dessailly, D.; Ngoc Dinh, D.; Garnesson, P.; Ouillon, S.; Lefebvre, J.-P.; Mériaux, X.; Minh Phan, T. Variability of suspended particulate matter concentration in coastal waters under the Mekong’s influence from ocean color (MERIS) remote sensing over the last decade. Remote Sens. Environ. 2014, 150, 218–230. [Google Scholar] [CrossRef]
- Nguyen, C.T. Processes and Factors Controlling and Affecting the Retreat of Mangrove Shorelines in South Vietnam. Ph.D. Thesis, Kiel University, Kiel, Germany, 2012. [Google Scholar]
- Le, T.V.H.; Nguyen, H.N.; Wolanski, E.; Tran, T.C.; Haruyama, S. The combined impact on the flooding in Vietnam’s Mekong River delta of local man-made structures, sea level rise, and dams upstream in the river catchment. Estuar. Coast. Shelf Sci. 2007, 71, 110–116. [Google Scholar] [CrossRef]
- Tri, V.K. Hydrology and Hydraulic Infrastructure Systems in the Mekong Delta, Vietnam. In The Mekong Delta System: Interdisciplinary Analyses of a River Delta; Renaud, F.G., Kuenzer, C., Eds.; Springer: Dordrecht, The Netherlands, 2012; pp. 49–81. [Google Scholar]
- Eidam, E.F.; Nittrouer, C.A.; Ogston, A.S.; DeMaster, D.J.; Liu, J.P.; Nguyen, T.T.; Nguyen, T.N. Dynamic controls on shallow clinoform geometry: Mekong Delta, Vietnam. Cont. Shelf Res. 2017, 147, 165–181. [Google Scholar] [CrossRef]
- Lu, X.X.; Siew, R.Y. Water discharge and sediment flux changes over the past decades in the Lower Mekong River: Possible impacts of the Chinese dams. Hydrol. Earth Syst. Sci. 2006, 10, 181–195. [Google Scholar] [CrossRef]
- Fujii, H.; Garsdal, H.; Ward, P.; Ishii, M.; Morishita, K.; Boivin, T. Hydrological roles of the Cambodian floodplain of the Mekong River. Int. J. River Basin Manag. 2003, 1, 253–266. [Google Scholar] [CrossRef]
- Nguyen, T.V.; Tanaka, H. Study on the effect of morphology change on salinity distribution in the Dinh an estuary, lower mekong river of Vietnam. J. Coast. Res. 2007, Issue 50, 268–272. [Google Scholar]
- Anikiyev, V.V.; Zaytsev, O.V.; Hieu, T.T.; Savil’yeva, I.I.; Stardodubtsev, Y.G.; Shumilin, Y.N. Variation in the space-time distribution of suspended matter in the coastal zone of the Mekong River. Oceanology 1986, 26, 725–729. [Google Scholar]
- Nowacki, D.J.; Ogston, A.S.; Nittrouer, C.A.; Fricke, A.T.; Van, P.D.T. Sediment dynamics in the lower Mekong River: Transition from tidal river to estuary. J. Geophys. Res. Ocean. 2015, 120, 6363–6383. [Google Scholar] [CrossRef]
- Nhan, N.H. Tidal regime deformation by sea level rise along the coast of the Mekong Delta. Estuar. Coast. Shelf Sci. 2016, 183, 382–391. [Google Scholar] [CrossRef]
- Nguyen, A.D.; Savenije, H.H.G.; Pham, D.N.; Tang, D.T. Using salt intrusion measurements to determine the freshwater discharge distribution over the branches of a multi-channel estuary: The Mekong Delta case. Estuar. Coast. Shelf Sci. 2008, 77, 433–445. [Google Scholar] [CrossRef]
- Weatherall, P.; Marks, K.M.; Jakobsson, M.; Schmitt, T.; Tani, S.; Arndt, J.E.; Rovere, M.; Chayes, D.; Ferrini, V.; Wigley, R. A new digital bathymetric model of the world’s oceans. Earth Space Sci. 2015, 2, 331–345. [Google Scholar] [CrossRef]
- Lanh, D.T. Integrated Water Resources Management and Sustainable Use for the Dong Nai River System; The Southern Institute of Water Resources Research: Ho Chi Minh City, Vietnam, 2010. (In Vietnamese) [Google Scholar]
- WOA. World Ocean Atlas 2013 Version 2 (WOA13 V2). Available online: https://www.nodc.noaa.gov/OC5/woa13/ (accessed on 20 August 2016).
- DHI. MIKE 21/3 Coupled Model FM: User Guide; DHI: Delft, The Netherlands, 2017. [Google Scholar]
- DHI. MIKE 21 & MIKE 3 Flow Model FM. Hydrodynamic and Mud Transport Module; DHI: Delft, The Netherlands, 2017. [Google Scholar]
- Lefèvre, F.; Lyard, F.H.; Le Provost, C.; Schrama, E.J.O. FES99: A Global Tide Finite Element Solution Assimilating Tide Gauge and Altimetric Information. J. Atmos. Ocean. Technol. 2002, 19, 1345–1356. [Google Scholar] [CrossRef]
- Lyard, F.; Lefevre, F.; Letellier, T.; Francis, O. Modelling the global ocean tides: Modern insights from FES2004. Ocean Dyn. 2006, 56, 394–415. [Google Scholar] [CrossRef]
- Young, I.R.; Sanina, E.; Babanin, A.V. Calibration and Cross Validation of a Global Wind and Wave Database of Altimeter, Radiometer, and Scatterometer Measurements. J. Atmos. Ocean. Technol. 2017, 34, 1285–1306. [Google Scholar] [CrossRef]
- Groenewoud, P. Overview of the Service and Validation of the Database. Available online: http://waveclimate.com/clams/redesign/help/docs/service_overview_and_validation.pdf (accessed on 1 September 2020).
- Arcement, G.J.; Schneider, V.R. Guide for selecting Manning’s Roughness Coefficients for Natural Channels and Flood Plains; U.S. Government Publishing Office: Washington, DC, USA, 1989.
- Simons, D.B.; Şentürk, F. Sediment Transport Technology: Water and Sediment Dynamics; Water Resources Publications: Detroit, MI, USA, 1992. [Google Scholar]
- Rodi, W. Turbulence Models and Their Application in Hydraulics: A State of the Art Review. Available online: https://ci.nii.ac.jp/naid/10013462544/ (accessed on 8 September 2020).
- Koehnken, L. Discharge Sediment Monitoring Project (DSMP) 2009—2013: Summary & Analysis of Results: Final Report; Mekong River Commission Secretariat: Office of the Secretariat in Vietnam: Vientiane, Laos, 2014. [Google Scholar]
- Gugliotta, M.; Saito, Y.; Nguyen, V.L.; Ta, T.K.O.; Nakashima, R.; Tamura, T.; Uehara, K.; Katsuki, K.; Yamamoto, S. Process regime, salinity, morphological, and sedimentary trends along the fluvial to marine transition zone of the mixed-energy Mekong River delta, Vietnam. Cont. Shelf Res. 2017, 147, 7–26. [Google Scholar] [CrossRef]
- Hung, N.N.; Delgado, J.M.; Güntner, A.; Merz, B.; Bárdossy, A.; Apel, H. Sedimentation in the floodplains of the Mekong Delta, Vietnam Part II: Deposition and erosion. Hydrol. Process. 2014, 28, 3145–3160. [Google Scholar] [CrossRef]
- Duy Vinh, V.; Ouillon, S.; Van Thao, N.; Ngoc Tien, N. Numerical Simulations of Suspended Sediment Dynamics Due to Seasonal Forcing in the Mekong Coastal Area. Water 2016, 8, 255. [Google Scholar] [CrossRef]
- Stephens, J.D.; Allison, M.A.; Di Leonardo, D.R.; Weathers, H.D.; Ogston, A.S.; McLachlan, R.L.; Xing, F.; Meselhe, E.A. Sand dynamics in the Mekong River channel and export to the coastal ocean. Cont. Shelf Res. 2017, 147, 38–50. [Google Scholar] [CrossRef]
- Eisma, D. Suspended Matter in the Aquatic Environment; Springer: Berlin/Heidelberg, Germany, 1993. [Google Scholar]
- Van Leussen, W. Aggregation of Particles, Settling Velocity of Mud Flocs A Review. In Physical Processes in Estuaries; Dronkers, J., van Leussen, W., Eds.; Springer: Berlin/Heidelberg, Germany, 1988; pp. 347–403. [Google Scholar]
- Burt, T.N. Field Settling Velocities of Estuary Muds. In Proceedings of the Estuarine Cohesive Sediment Dynamics, Tampa, FL, USA, 12–14 November 1984; Springer: New York, NY, USA, 1986; pp. 126–150. [Google Scholar]
- Krone, R.B. Flume Studies of the Transport of Sediment in Estuarial Shoaling Processes: Final Report; Hydraulic Engineering Laboratory and Sanitary Engineering Research Laboratory, University of California: Oakland, CA, USA, 1962. [Google Scholar]
- Partheniades, E. Chapter 6—Erosion of Cohesive Soils. In Cohesive Sediments in Open Channels; Partheniades, E., Ed.; Butterworth-Heinemann: Boston, MA, USA, 2009; pp. 173–201. [Google Scholar] [CrossRef]
- Parchure, T.M.; Mehta, A.J. Erosion of Soft Cohesive Sediment Deposits. J. Hydraul. Eng. 1985, 111, 1308–1326. [Google Scholar] [CrossRef]
- Douillet, P.; Ouillon, S.; Cordier, E. A numerical model for fine suspended sediment transport in the southwest lagoon of New Caledonia. Coral Reefs 2001, 20, 361–372. [Google Scholar] [CrossRef]
- Rijn, L.C.V. Sediment Transport, Part I: Bed Load Transport. J. Hydraul. Eng. 1984, 110, 1431–1456. [Google Scholar] [CrossRef]
- Rijn, L.C.V. Sediment Transport, Part II: Suspended Load Transport. J. Hydraul. Eng. 1984, 110, 1613–1641. [Google Scholar] [CrossRef]
- Van Rijn, L.C. Handbook Sediment Transport by Currents and Waves; Delft Hydraulics: Delft, The Netherlands, 1989. [Google Scholar]
- Van Rijn, L.C. Principles of Sediment Transport in Rivers, Estuaries and Coastal Seas; Aqua Publications: Blokzijl, The Netherlands, 1993. [Google Scholar]
- Fredsøe, J. Turbulent Boundary Layer in Wave-current Motion. J. Hydraul. Eng. 1984, 110, 1103–1120. [Google Scholar] [CrossRef]
- Madsen, O.S. Spectral Wave-Current Bottom Boundary Layer Flows. In Proceedings of the 24th International Conference on Coastal Engineering, Kobe, Japan, 23–28 October 1994; pp. 384–398. [Google Scholar] [CrossRef]
- Walstra, D.J.R.; Roelvink, J.A.; Groeneweg, J. Calculation of Wave-Driven Currents in a 3D Mean Flow Model. In Proceedings of the 27th International Conference on Coastal Engineering (ICCE), Sydney, Australia, 16–21 July 2000; pp. 1050–1063. [Google Scholar] [CrossRef]
- Rijn, L.C.V. Unified View of Sediment Transport by Currents and Waves. II: Suspended Transport. J. Hydraul. Eng. 2007, 133, 668–689. [Google Scholar] [CrossRef]
- Nash, J.E.; Sutcliffe, J.V. River flow forecasting through conceptual models part I—A discussion of principles. J. Hydrol. 1970, 10, 282–290. [Google Scholar] [CrossRef]
- Unverricht, D.; Nguyen, T.C.; Heinrich, C.; Szczuciński, W.; Lahajnar, N.; Stattegger, K. Suspended sediment dynamics during the inter-monsoon season in the subaqueous Mekong Delta and adjacent shelf, Southern Vietnam. J. Asian Earth Sci. 2014, 79, 509–519. [Google Scholar] [CrossRef]
- Unverricht, D.; Szczuciński, W.; Stattegger, K.; Jagodziński, R.; Le, X.T.; Kwong, L.L.W. Modern sedimentation and morphology of the subaqueous Mekong Delta, Southern Vietnam. Glob. Planet. Chang. 2013, 110, 223–235. [Google Scholar] [CrossRef]
© 2020 by the authors. Licensee MDPI, Basel, Switzerland. This article is an open access article distributed under the terms and conditions of the Creative Commons Attribution (CC BY) license (http://creativecommons.org/licenses/by/4.0/).