Article

Influence of Rectifier Nozzles on the Flow Distribution Characteristics of Parallel Pipes

1
State Key Laboratory of Eco-Hydraulics in Northwest Arid Region of China, Institute of Water Resources and Hydro-Electric Engineering, Xi’an University of Technology, Xi’an 710048, China
2
Upper and Middle Yellow River Bureau, YRCC, Xi’an 710021, China
*
Author to whom correspondence should be addressed.
Water 2020, 12(9), 2558; https://doi.org/10.3390/w12092558
Submission received: 6 July 2020 / Revised: 2 September 2020 / Accepted: 11 September 2020 / Published: 13 September 2020
(This article belongs to the Section Hydraulics and Hydrodynamics)

Abstract

:
The inhomogeneous distribution of parallel pipe flow leads to difficulty in the efficient and reliable operation of fluid power equipment. In view of this, a new type of rectifier nozzle has been proposed in parallel pipelines. Numerical simulation and experimental studies were used to reveal the influence of the rectification nozzle on the flow distribution characteristics. The hydraulic characteristics of the parallel pipelines with and without rectifier nozzles were compared and analyzed. The effects of the temperature and inlet flow on the flow uniformity were studied. The results showed that the initial temperature had little effect on the flow distribution of parallel pipelines, and the flow rates of the branches were not much different. The inlet flow had great influence on the distribution characteristics of the parallel pipelines, but the rectifier nozzles changed the local resistance structure and pressure distribution at the shunt, thereby improving the non-uniformity of the flow distribution of the parallel pipelines, and the maximum difference between the two pipes was optimized from 28.89 t/h (20.3%) to 2.2 t/h (1.5%). The rectifying nozzle could distort the flow field of each branch during the split, making the distribution of flow rate and flow state more uniform and stable. At high inlet fluid temperatures, cavitation could occur under the pressure drop of the nozzle, and partial cavitation had little effect on the flow distribution.

1. Introduction

Parallel pipelines are widely used as an inevitable flow form for water delivery systems. Although there are already rich theoretical and empirical results, the flow distribution of parallel pipes is affected by factors such as resistance along the path and local resistance. It is difficult to maintain the fluid power equipment after the branch pipe efficiently and reliably if the flow uniformity of the branch pipe is poor. Therefore, it is important to study the flow distribution characteristics of the parallel pipeline.
In recent years, many domestic and foreign scholars have carried out a large number of numerical calculations and experimental studies on flow characteristics in parallel pipeline systems. Keller et al. [1] discussed comprehensively and systematically the flow distribution problem of multi-branch parallel pipelines. They proposed that the main parameters affecting the uniformity of the flow distribution in parallel pipelines are inertial force and frictional resistance. Steve, Sooyoun, and Heehaw [2,3,4] calculated numerically the important factors affecting the distribution of the coolant flow, and proposed a method to obtain a better distribution uniformity of flow. Kikas [5] studied the flow distribution and pressure drop under fully developed conditions of laminar flow by solving algebraic equations, and analyzed the effects of fluid with isothermal and non-isothermal conditions. Wang [6] proposed a method to solve the flow distribution and pressure drop of Z-type fuel cells, and studied the effects of five main characteristic parameters on flow distribution uniformity and pressure variation. Tong [7] established a two-dimensional model of the Z-shaped arrangement of parallel pipelines, and discovered the variation characteristics of the dominant parameters for improving the uniformity of the flow distribution. Jones [8] used a discrete fluid dynamics calculation model to compare and analyze the various factors affecting flow distribution. Volker [9] studied experimentally the flow distribution problem in solar energy systems under laminar flow conditions. Lu [10] predicted the flow distribution in the parallel flow of a heat exchanger system by solving the discrete model, and compared the simulation with the experimental data. Cheng [11] studied the problem of the uniformity of the flow distribution in three-dimensional Z-type parallel pipelines.
The problem of the flow distribution characteristics of parallel pipelines is complicated in mathematical solutions and experimental research. The aforementioned results and conclusions have been of significance for ensuring the uniformity of the flow distribution in parallel pipelines, especially in parallel distribution in laminar flow.
Miao [12] established dimensionless equations based on practical engineering problems, and obtained the flow characteristics of single-phase fluids in parallel pipelines by solving the equations. Zhao [13] derived a comprehensive dimensionless parameter of the distribution performance, through which the flow distribution law of the header and the total system pressure drop can be quickly obtained. Pu [14] proposed a method of setting a different damping at the junction of the header and the parallel branch to solve the uneven distribution of the flow.
Zhong [15] conducted experimental research and numerical simulation on the flow distribution of multi-branch parallel pipelines under large flow and analyzed the main factors affecting the flow distribution of parallel pipeline systems. It was proposed that flow distribution is affected by the momentum distribution coefficient. Wei [16] studied experimentally the flow characteristics of Z-type and U-type parallel pipeline systems, obtained the flow distribution deviation of each parallel branch pipe, and compared them with the theoretical calculation results. He also verified the rationality of the flow distribution theory of parallel branch pipes proposed in his previous work. Facao [17] measured the flow distribution in an existing solar collector used a new experimental low-intrusive technique. An experimental methodology has been applied to analyze the flow distribution in solar collectors. He [18] studied the distribution characteristics of Z-type parallel tube sets with a three-dimensional numerical model. The results show that the pressure difference between the inlet and outlet has little effect on the flow distribution; flow distribution can be more uniform by reducing the diameter of the header along the flow direction. Duan [19] studied the influence of the header diameter, branch diameter, inlet flow rate, and branch pipe spacing on the flow uniformity. A partition shunt method was proposed in order to improve the parallel tubes of the uniformity of the flow distribution. Wang [20] obtained analytical solutions for evaluation of influence of operating conditions and structures and dimensions of distributor and ports on flow distributions. He found that the orifices, slope, and tube protrusion are useful for improvement of the flow distributions. The rectifier nozzles can be equivalent to a special multi-hole orifice. Zhu [21] numerically simulated the flow characteristics of parallel tube sets and compared the simulation with the test results using Computational Fluid Dynamics (CFD) software (Fluent). Zhang [22] analyzed the flow distribution method that meets the actual needs of this project. Yang [23] used a sensitivity analysis method to analyze the relationship between the non-uniform coefficient of the flow distribution and branch pipe diameter. Qu [24] found that obtaining a matching header could enhance the flow distribution uniformity. The optimal cross section area ratio of the header (OARH) was obtained on the basis of the pressure change within the headers. Wang [25] proposed a theoretical model which provides easy-to-use design guidance to investigate the interactions among structures, operating conditions, and manufacturing tolerance under a wide variety of combination of flow conditions and geometries through three general characteristic parameters. To achieve the minimum energy dissipation possible inside a dividing manifold system, Mincha [26] proposed a design strategy to make the fluid in the branch even flow. This is a very important and promising job, but it is also difficult for a wide variety of combination of geometries.
In conclusion, there are many research results on the distribution characteristics of parallel pipelines, and the influence of parallel tubes and distributed orifices on flow distribution has a clear trend. There are also relatively consistent opinions that the uniformity of flow distribution would improve by increasing the diameter of the parallel pipe and reducing the diameter of the main pipe or the total flow rate. For the large flow and multi-branch, improving the pipe diameter of the main pipe and branch pipe cannot effectively achieve a uniform distribution of flow, but by adjusting the cross-section size of each branch pipe by adding baffles and orifice plates at the inlet of the branch pipe, the flow can be evenly and efficiently distributed. The uniformity of the flow distributions can be improved about 10–60% by fitting orifice rings or tube protrusions with a range of the minor loss coefficients: 0.5–3 [20]. The inlet of the branch pipe with a nozzle has been applied in industrial equipment which can make flow uniform, as well as prevent foreign bodies from entering the branch pipe, but there is not sufficient research on the flow distribution characteristics of parallel pipes with a perforated nozzle. A perforated nozzle was designed for feed water distribution of nuclear reactor systems. Numerical simulations of the flow distribution characteristics with or without an inlet nozzle are carried out in this paper. The numerical simulation results were verified by the experiment test. The influence of the nozzle on the flow distribution is investigated, and the effect of its structure on improving the uneven flow distribution is analyzed.

2. Materials and Methods

2.1. Experiment System

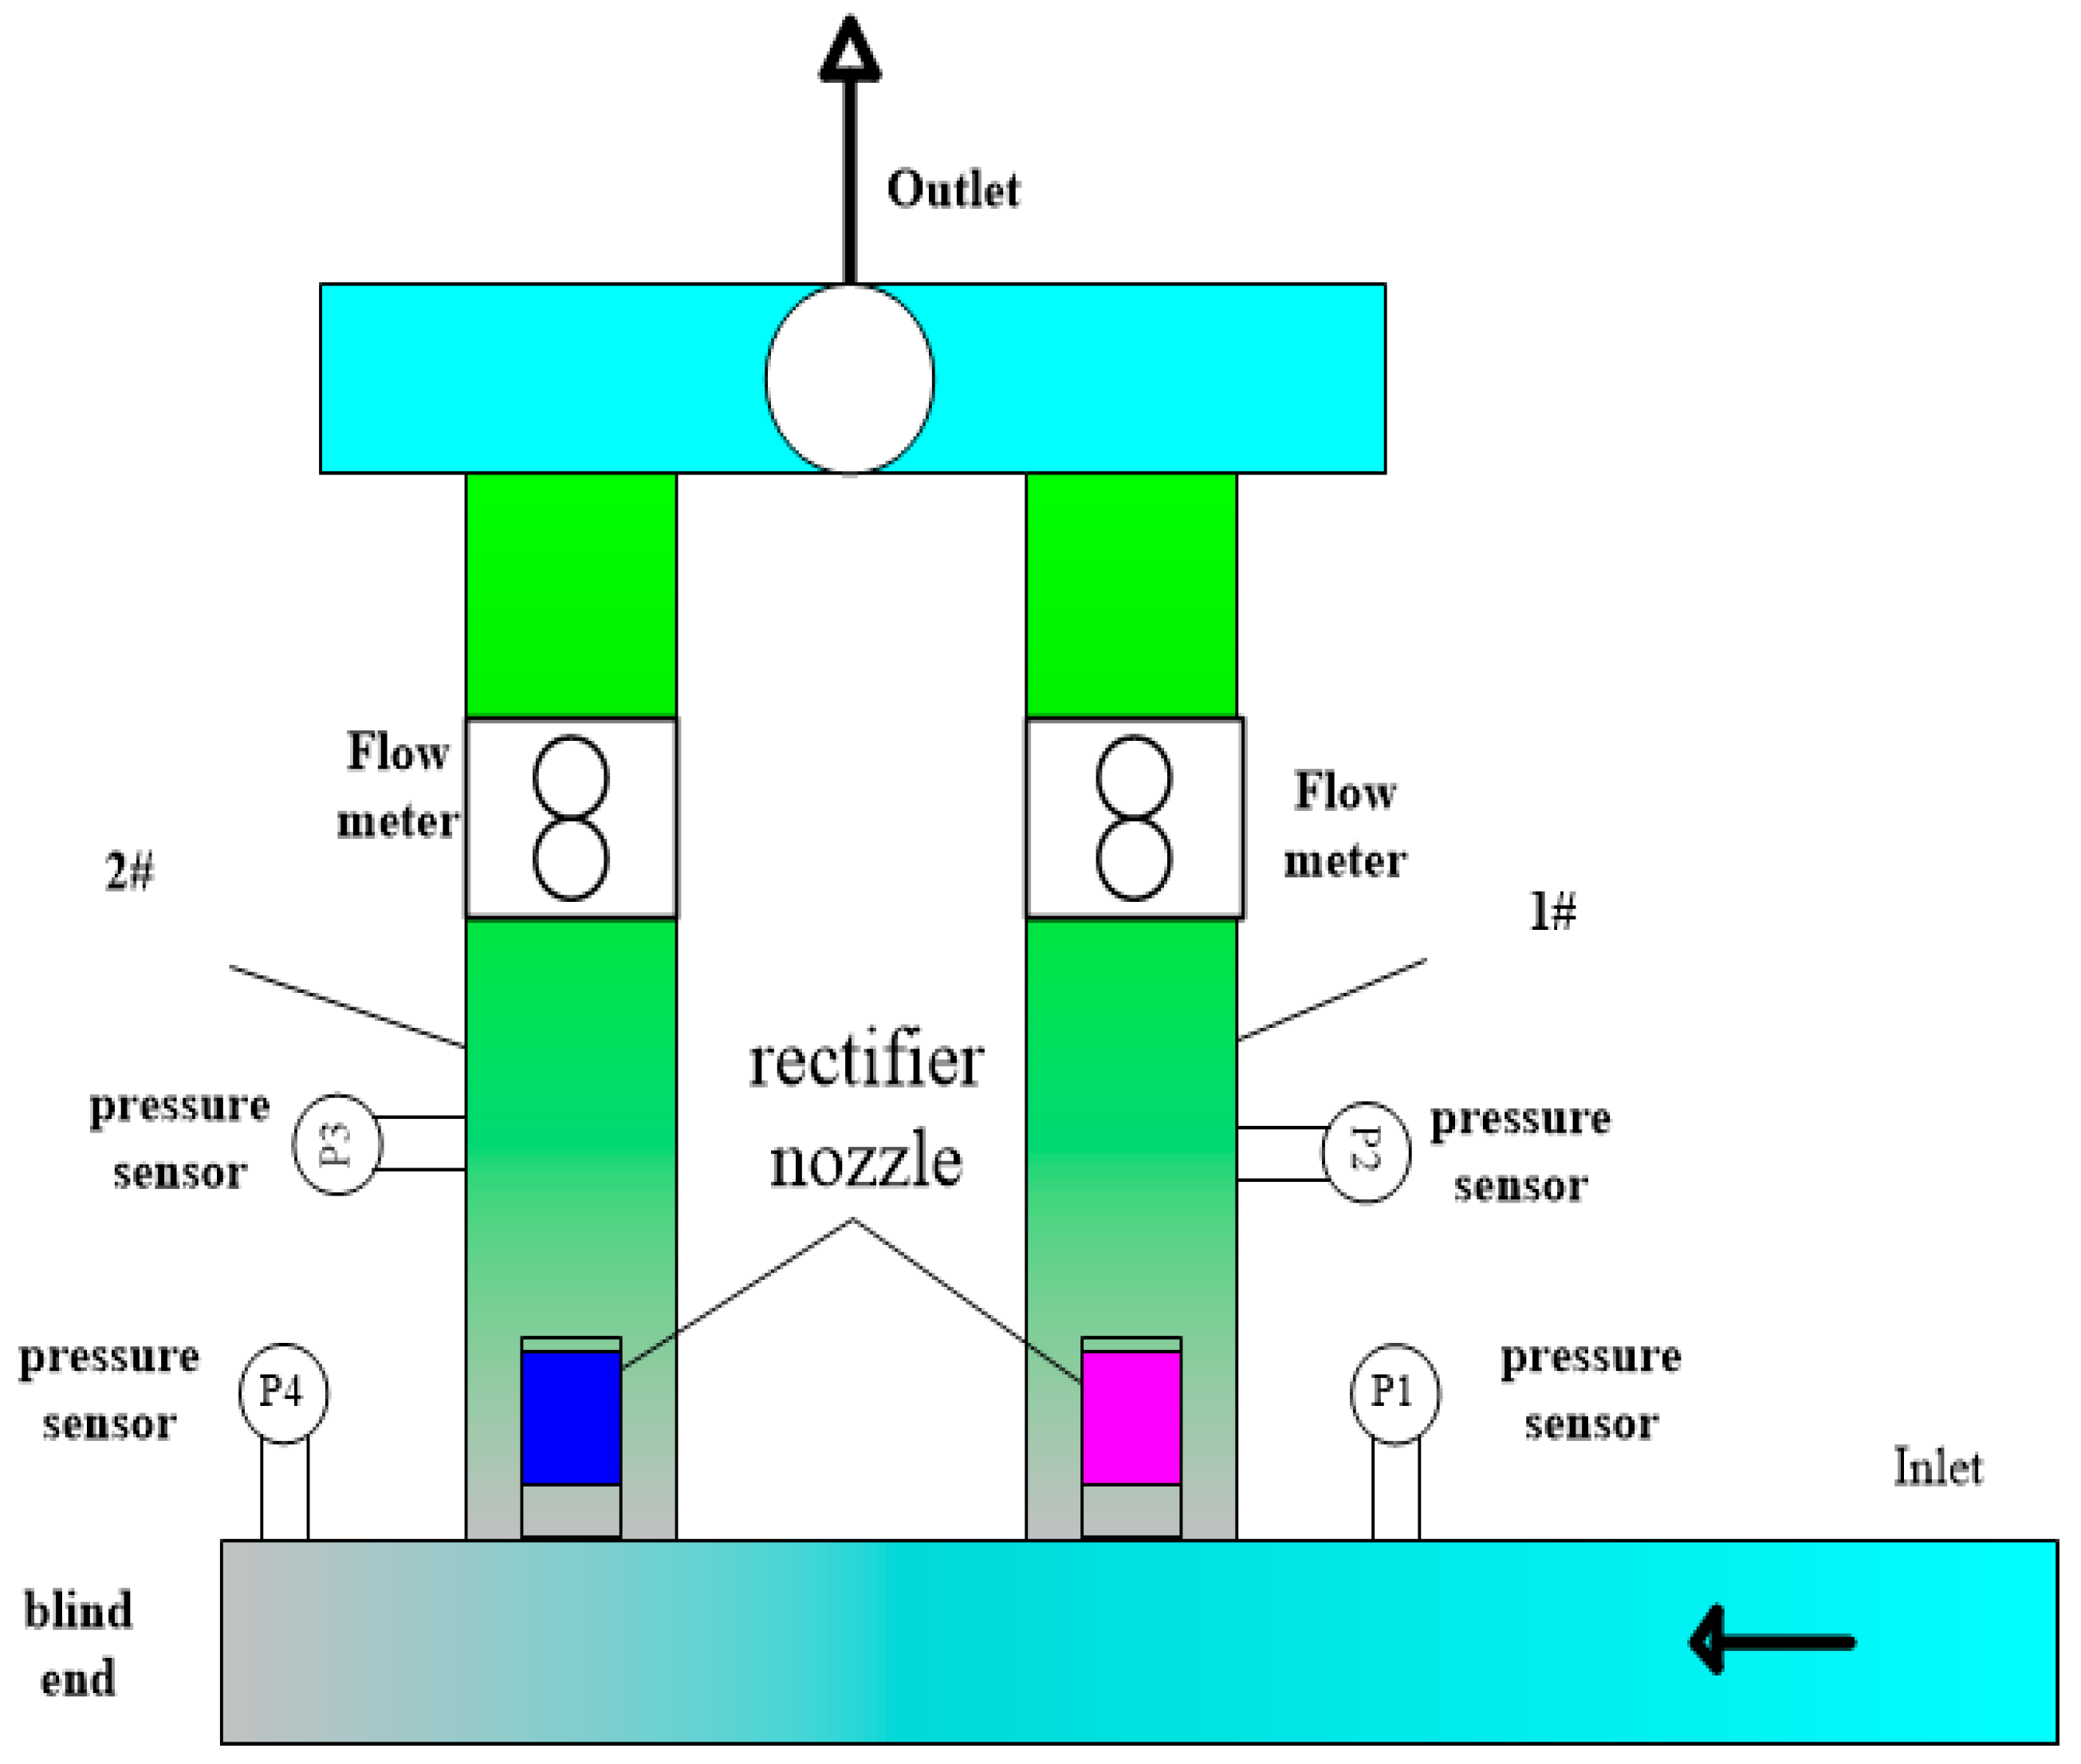
A parallel pipeline flow distribution test system was designed and built to verify the numerical simulation results, as shown in Figure 1.
Distilled and deionized feed water from the water tank was driven through a filter by a centrifugal pump. The pressure and the mass flux were controlled by adjusting the main valves and frequency converter, respectively. Then, the feed water flowed into parallel pipelines. The inlet bulk temperature was adjusted by increasing the heating power of the preheater step by step.
The entire test system was made of a 1Cr18Ni9Ti stainless steel pipe, and the test section could be flexibly changed according to the requirements. All of the equipment and pipelines in the test system were connected by flanges or loose knots for easy disassembly and modification. The structural dimensions of the test section are shown in Figure 2 and Figure 3. (unit: cm).
The main measurement parameters in the test were as follows: flow, pressure, and temperature. The measurement range and accuracy of each measuring device are shown in Table 1.

2.2. Mathematical Model

2.2.1. Governing Equation

The governing equations of the water flow in the pipeline were only continuous equations and momentum equations.
ρ t + ( ρ u i ) x i = 0
( ρ u i ) t + ( ρ u i u j ) x j = ρ x i + x j [ γ u i x i ρ u i u j ¯ ] + ρ g i
The standard κε turbulence model, as one of the most widely used two-equation turbulence simulation models, was applied to the simulation of the problem.
( ρ u j k ) x j = x j [ ( μ + μ t σ k ) k x j ] + μ t ( u i x j + u j x i ) u i x j ρ ε
( ρ u j ε ) x j = x j [ ( μ + μ t σ ε ) ε x j ] + ρ ( c 1 ε π ε c 2 ε ) ε 2 k
μ t = ρ C μ k 2 ε
Here, ui and uj are the speed in the i and j directions, ui and uj are the Reynolds stress tensor in the i and j directions, ρ is the density, μ is the dynamic viscosity, and μt is the turbulent viscosity; κ is the turbulent kinetic energy. The model constants c 1 ε = 1.44 , c 2 ε = 1.92 , c μ = 0.09 , σ k = 1.0 , σ ε = 1.3 .

2.2.2. Numerical Method and Boundary Conditions

In this paper, the finite volume method was used to discretize the governing equations. The convection terms in each governing equation were first-order upwind, and the Semi-Implicit Method for Pressure Linked Equations (SIMPLE) algorithm was used to solve each variable. The working medium was water, ignoring heat exchange and loss. The boundary conditions of the inlet were set as the speed inlet, the outlet was set as the pressure outlet, and the outlet pressure was atmospheric pressure. All of the fixed wall boundaries were considered to be slip-free, and they were processed using standard wall function methods. The density and dynamic viscosity coefficient are the values at the corresponding temperature under 0.1 MPa, such as presented in Table 2.

2.2.3. Meshing

The geometric model of parallel pipelines with nozzles was established by using the CAD 3D modeling function; the mesh was divided by GAMBIT and then solved by FLUENT fluid calculation software. Because of the complicated structure of the nozzle, the mesh was unstructured in nozzles and structured in the remainder domain. The number of grid cells was about 1.6 million. The nozzle used mesh refinement to ensure the calculation was more accurate and reasonable. The local grid refinement of the nozzle is shown in Figure 4.

2.3. Model Validation

Three cases with different grid intervals were computed while observing the global pressure loss and velocity of out1 and out2, such as presented in Table 3. It can be seen from Table 3 that the change of average velocity at the outlet under different grid numbers is not significant. The change of pressure drop is less than 0.4% under different grid numbers. Therefore, the model mesh used in simulations was one with 1.6 million.
The validity of the mathematical model was verified by comparing the numerical calculation results and the experimental data. The results are shown in Figure 5. The flow difference between the parallel tubes was measured in the experiment, so the flow difference between the parallel pipes was used as a comparison basis. Figure 5 shows that not only was the trend of the numerical calculation results consistent with the experimental data, but also that the calculation results were basically consistent with the measured values. This verified the feasibility of the computing models and methods.

3. Results

From the third part, we know that the single-phase flow process could be simulated by CFD. The simulation software could clearly describe the flow details of each part, obtain the flow field results in the nozzle, and analyze the flow distribution characteristics in the parallel pipelines. The characteristics of the parallel pipe flow distribution were introduced in the following part, in accordance with the flow velocity distribution of each branch pipe, the distribution of branch pipe pressure, the influence of temperature, and the influence of inlet flow.

3.1. Velocity Distribution of Each Branch

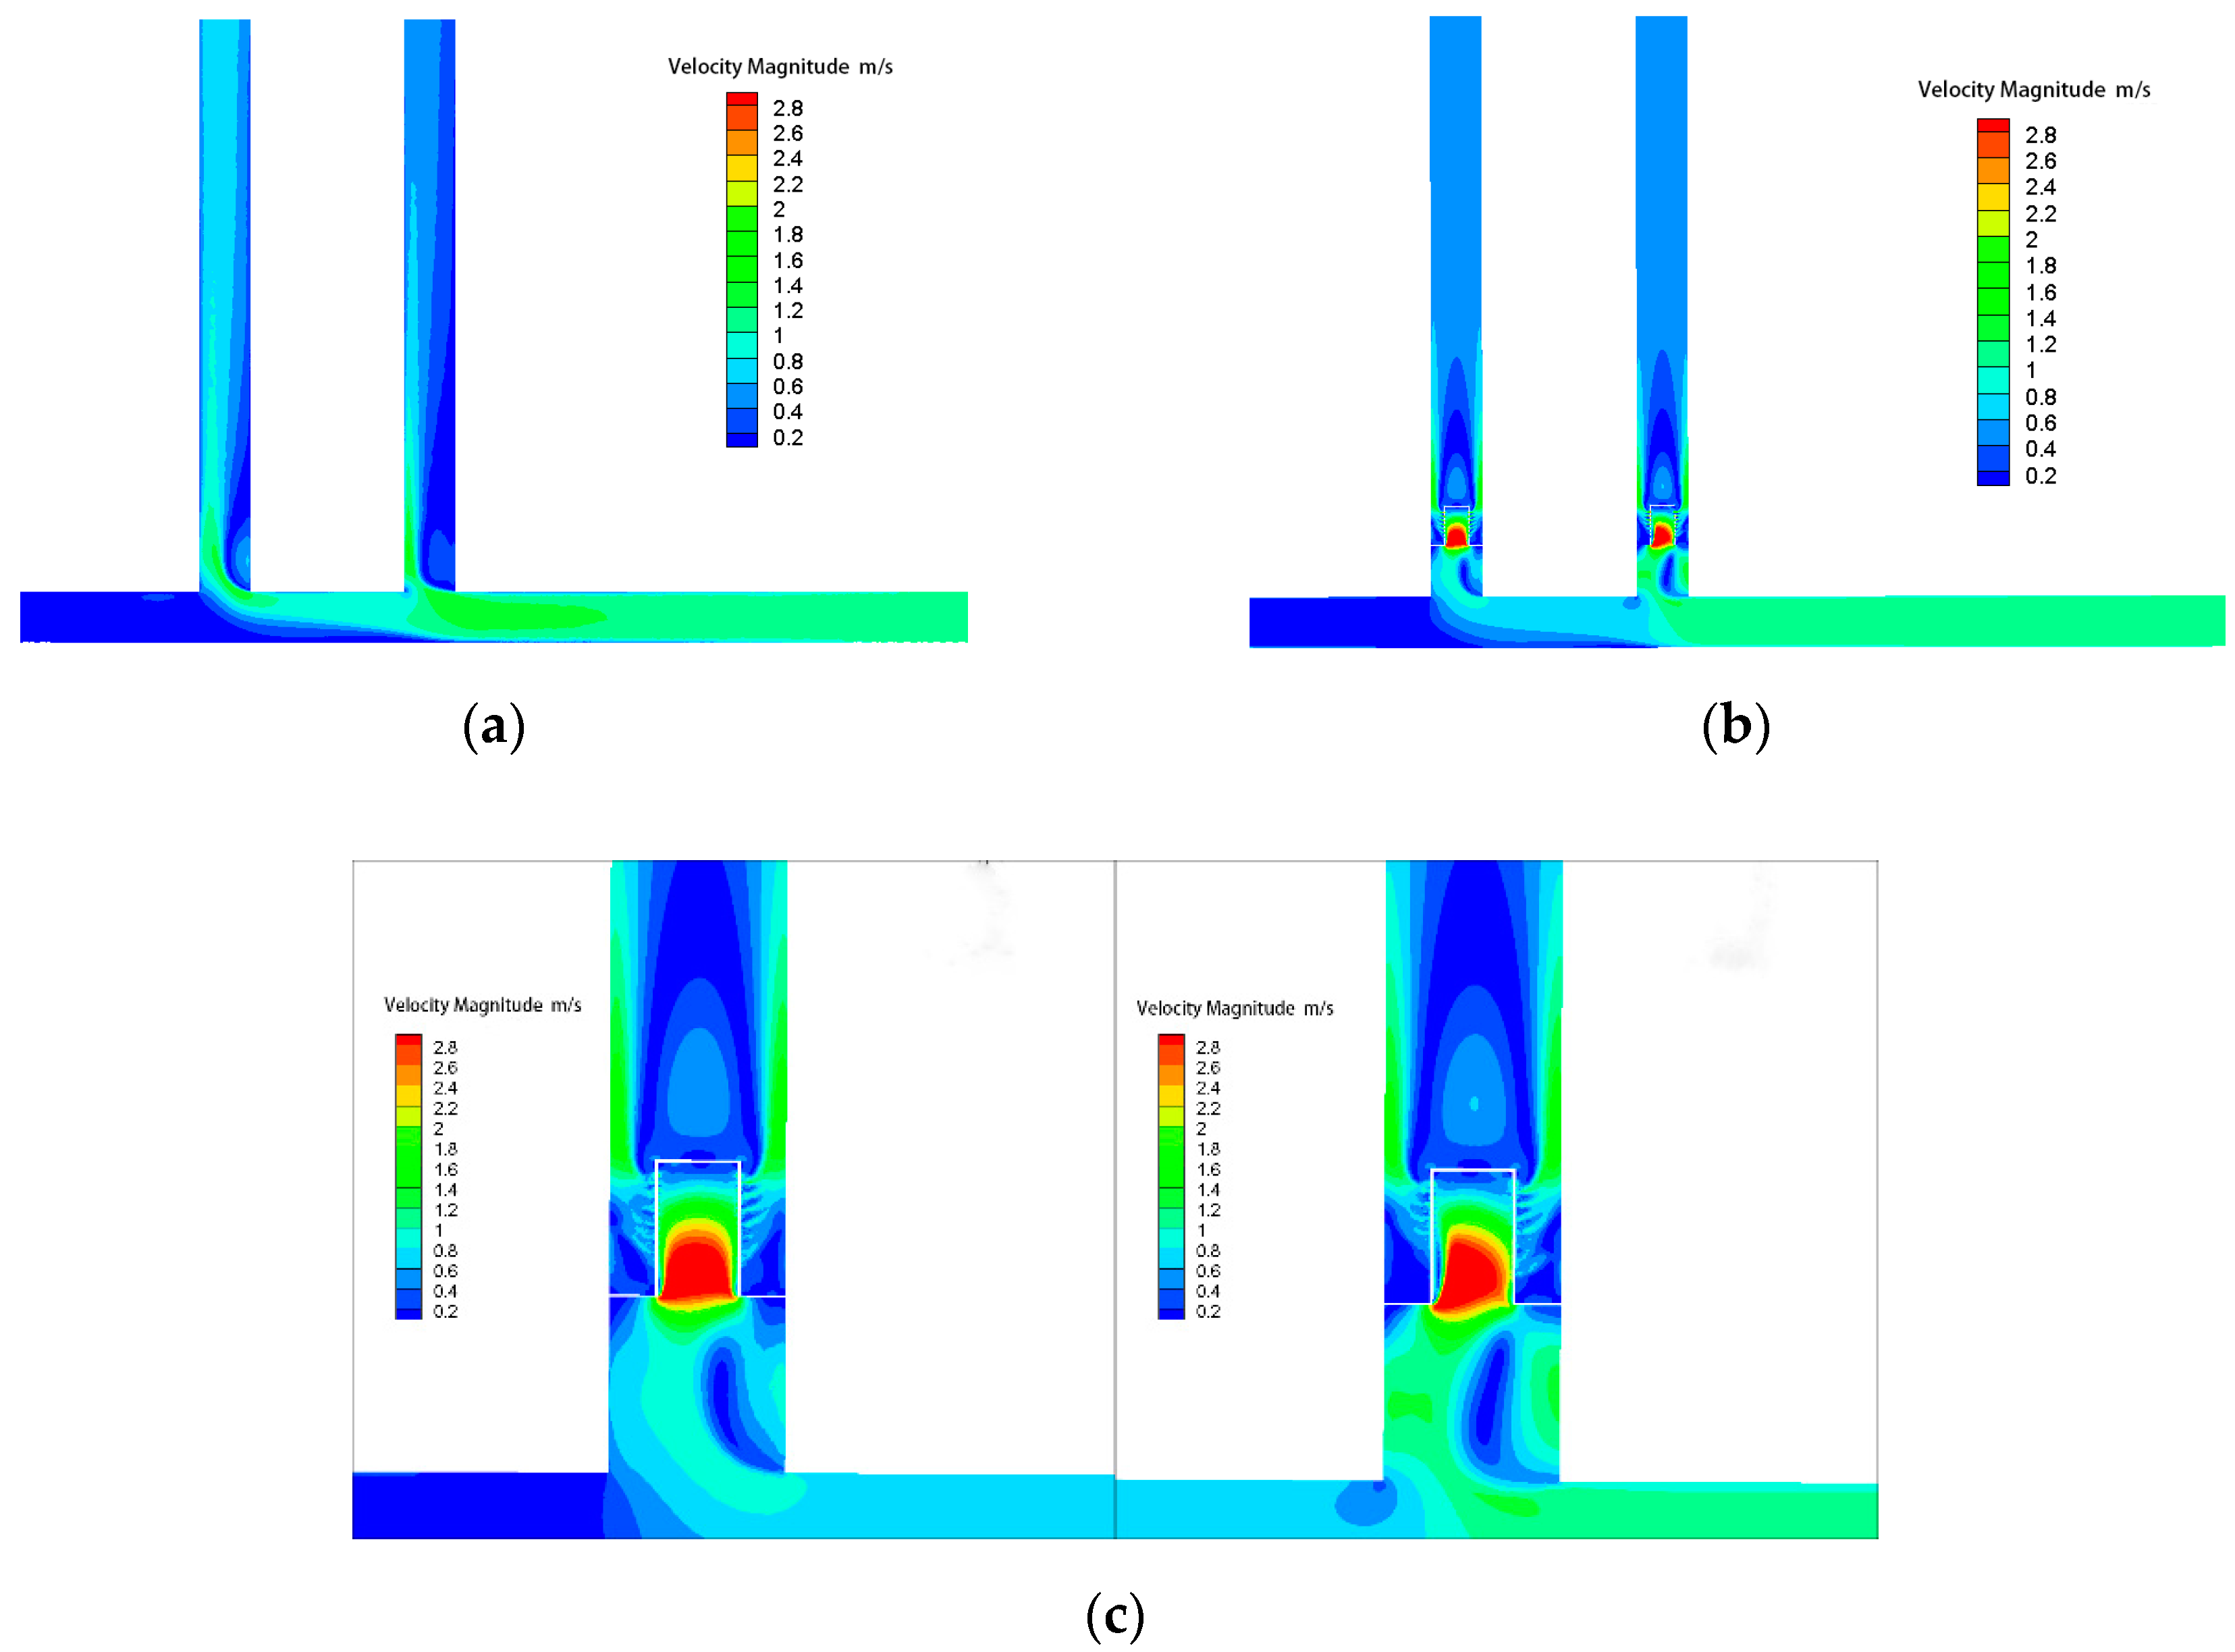
It can be seen from Figure 6 that the two branch pipes of the parallel pipe with and without nozzles had vortex regions of different sizes at the branch. The branch vortex of the first branch pipe (near the inlet) was significantly larger due to the influence of the inlet water flow, and the water flow state was more uneven.
During the flow process, after the water flowed through the first branch pipe, the axial velocity decreased, which further reduced the dynamic pressure and increased the static pressure when the water reached the second pipe (near the blind end). Therefore, there were differences in the hydraulic characteristics of the two branch pipes during the flow distribution process. From Figure 6c, it can be seen that the velocity and flow distribution were more uniform and stable.

3.2. Pressure Distribution of Each Branch

Figure 7 is a cloud diagram of the pressure distribution of each branch pipe of a parallel pipeline with and without nozzles at a certain inlet flow. It can be seen that the pressure distribution at the two branch pipes during the flow without the rectifier nozzle was inconsistent. This is because the two branch pipes had an “L-shaped” outlet and a “T-shaped” outlet and the different forms of outlets resulted in different local resistance losses of the branch pipes, so the pressure distribution was obviously different in each branch pipe in the process of shunting. When water flowed through the rectifier nozzle, its pressure changed sharply, and the pressure drop between the two pipes became significantly smaller. The rectifier nozzle improved the non-uniformity of flow distribution in the parallel pipes.

3.3. Discharge Coefficients of Rectifier Nozzles with 7.3 mm

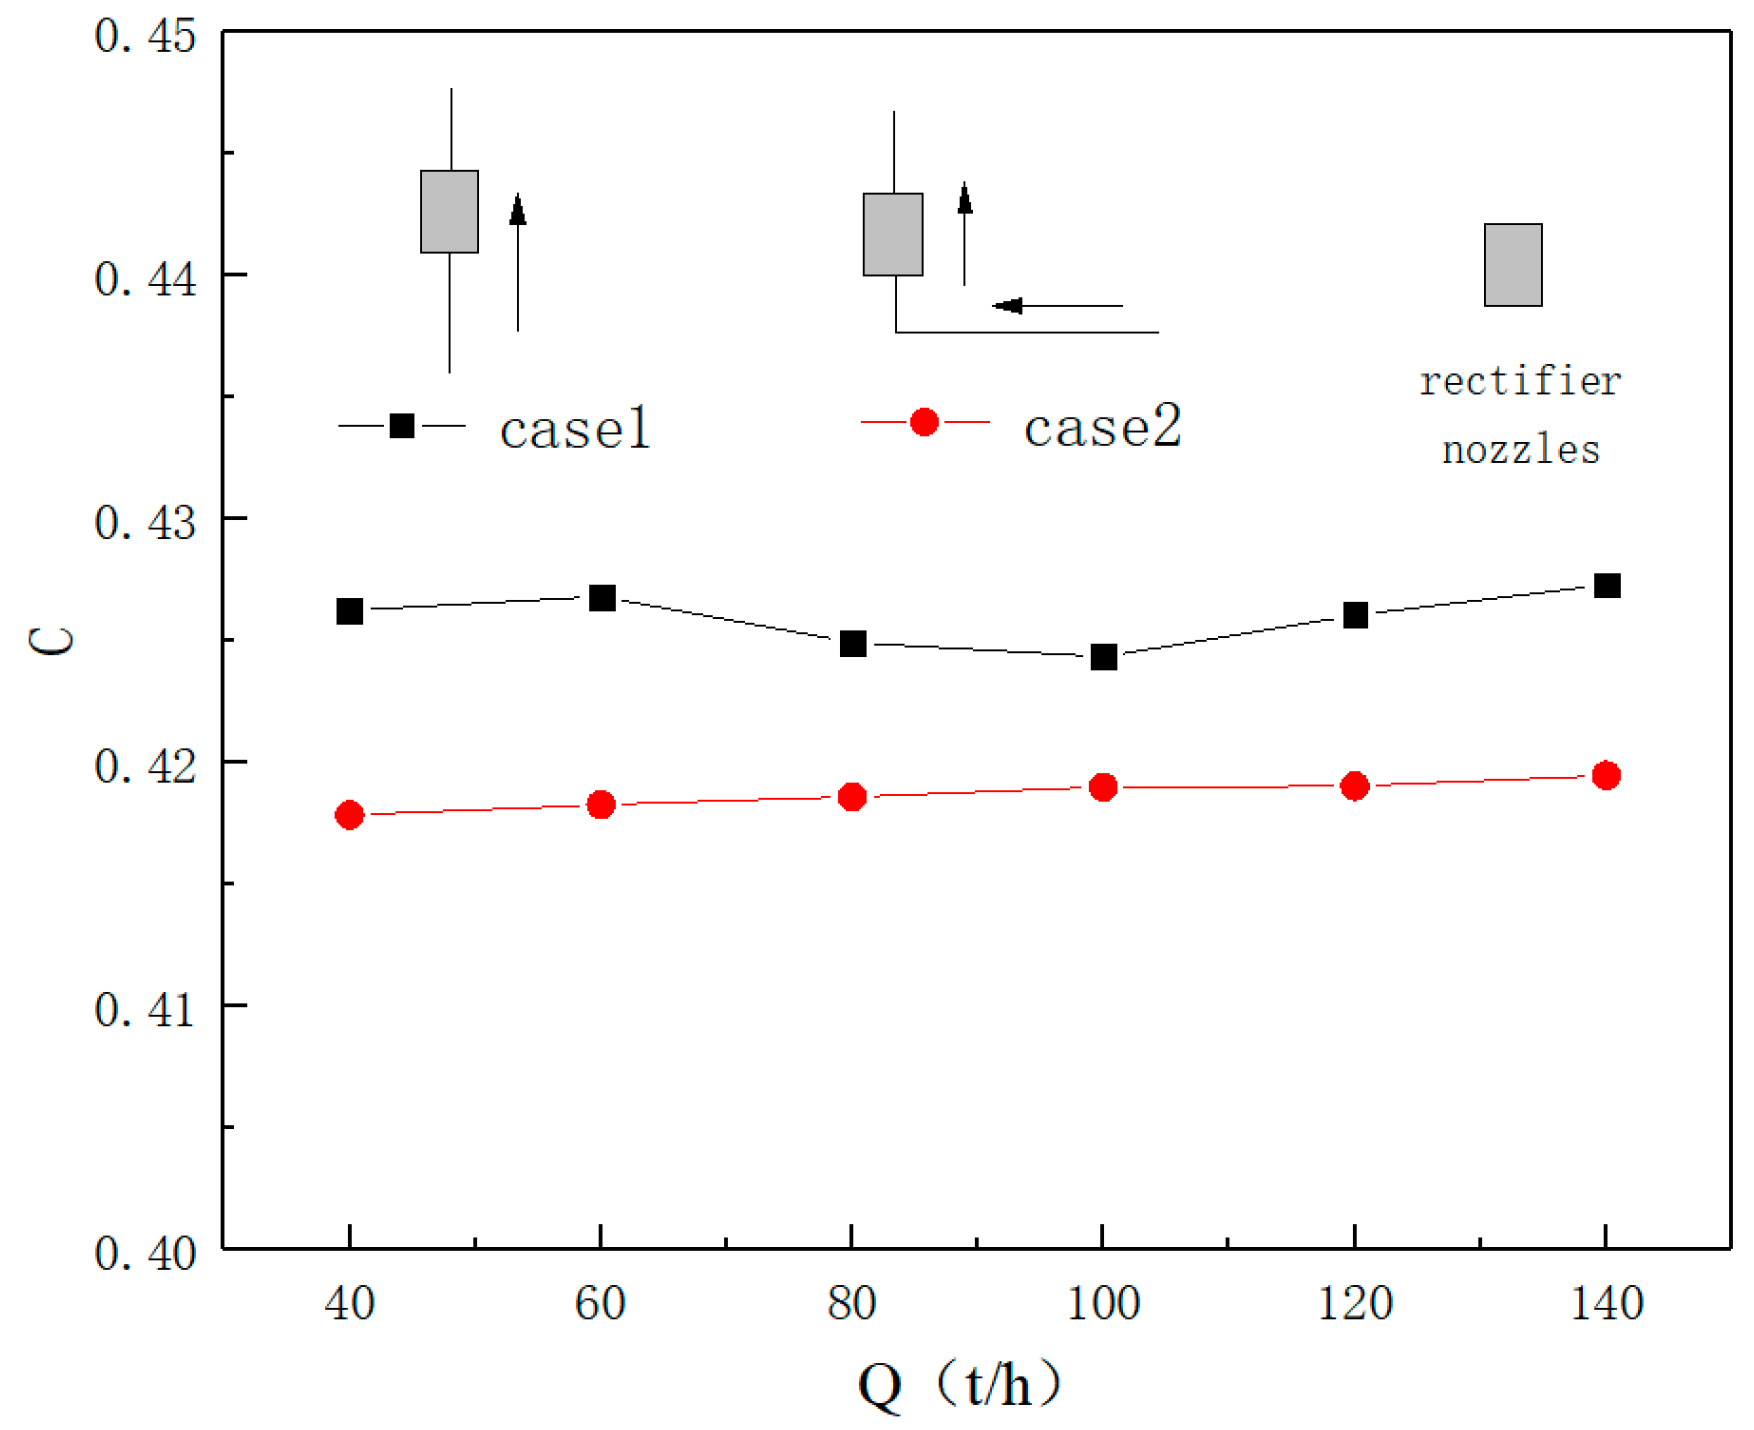
There is a significant influence of the axial velocity profile, flow distribution, and pressure drop. The structure parameter ζ represents the resistance of outflow through ports. The parameter ζ can be adjusted locally by using throttle rings [25]. The rectifier nozzle proposed in this paper is a special throttle ring. As mentioned above, the relative resistance of the throttle ring affects the uniformity of flow distribution. This discharge coefficient of the nozzle was calculated under different conditions. Discharge coefficients of rectifier nozzles of the two cases are shown in Figure 8. Compared to case 1, case 2 involves corner loss. The inlet flow mass rate of the two cases is set from 40 t/h to 140 t/h. The calculation of the discharge coefficient C uses the following formulas (6)–(7):
C = Q 1 - β 4 A 0 2 Δ P ρ
β = A 0 A
C is the discharge coefficient; Q is the volume flow of the fluid, m 3 / s ; β is the equivalent aperture ratio; A 0 is the sum of the flow area of the nozzle holes, m 2 ; A is the side area of the nozzle cylinder, m 2 ; Δ P is the pressure drop between the front and rear of the rectifier nozzle, Pa ; ρ is fluid density, kg / m 3 .
It can be seen that the discharge coefficient of the straight pipe is slightly higher than that of case 2. The difference between the two cases is about 1.7%.

4. Discussion

4.1. Effect of Temperature on Flow Distribution

Figure 6 shows the effect of different temperatures on the parallel pipe flow distribution at the same flow rate. It can be seen from the calculation results that regardless of the presence or absence of a rectifier nozzle, the change trend of the flow difference between the two branch pipes at different temperatures was consistent, but the flow rates were slightly different. Figure 9a,b shows that the initial temperature had a small effect on the flow distribution of the parallel pipe, but the flow with a rectifier nozzle seemed to be more affected by the temperature than the flow without a nozzle.

4.2. Effect of Inlet Flow on Flow Distribution

Figure 10 shows the difference in the flow distribution of each branch pipe with or without a rectifier nozzle at different inlet flow rates. The horizontal axis is the total flow rate, Q, and the vertical axis is the flow rates Q1 and Q2 of the branch pipe 1 and the branch pipe 2. It can be seen from Figure 10 that the hydraulic distribution of the two branch pipes was uneven because of the “header effect.” The header effect increased with the increase of the inlet flow. This is because the pressure distribution in the branch pipe depends on the mutual conversion between the kinetic and static pressure energy of the fluid in the pipe and the loss of resistance along the flow of the fluid. The flow velocity of the fluid along the main pipeline axis got smaller and smaller, and the flow rate also got smaller and smaller, so that the kinetic energy of the fluid was reduced and the static pressure energy was increased. As can be seen from the figure, the flow distribution difference between parallel pipes without rectifier nozzles is obvious, and the maximum difference reached 28.74 t/h (20.37%). The maximum flow difference of each branch pipe of parallel pipes with rectifier nozzles at the same flow was 2.20 t/h (1.57%); the difference of flow distribution without a rectifier nozzle was much larger than that of the parallel pipe with a rectifier nozzle, indicating that the rectifier nozzle effectively improved the unevenness of flow distribution of parallel pipes.

4.3. Effect of Cavitation on Flow Distribution

The flow distribution with near-saturated fluid is also often seen in industrial applications. When the inlet temperature was close to the saturation temperature, during the test a visualization device was added at the position of the nozzle. The image of the fluid in the parallel pipes was visualized, and the clarity of the fluid image was significantly reduced at high flow rates. As the mass flow rate increased, there was a little trending deviation, but the deviation between the simulated and the experimental value was still small. The main reason for the determination was that cavitation appeared at a relatively high flow rate during the test, resulting in bubbles, and a gas–liquid two-phase flow occurred in some positions. Cavitation occurred because the pressure at a local position decreased under the effect of the inlet throttling. The effect of cavitation on flow distribution was studied with CFD. It can be seen from Figure 11 that when the inlet temperature was high, the fluid changed phase after passing through the nozzle. As the fluid pressure was lower than the saturation pressure only at some locations, gas only appeared at the corresponding location and the gas content in the water was very low. The effect of cavitation on flow distribution was further analyzed. Calculations showed that the difference of flow distribution was much less when ignoring the cavitation effect.

4.4. Evaluation of Distribution Effect

By introducing rectifier nozzle at the inlet of parallel pipes, the flow distribution is effectively improved, but the overall flow resistance was increased, which is equivalent to sacrificing energy in exchange for a uniform flow distribution. In order to reasonably and quantitatively evaluate the effect of introducing the throttling at the inlet, the diameter of the orifices was set in four cases, which was 9 mm, 8 mm, 7.3 mm, and 6 mm. Figure 12 shows the effect of rectifier nozzles with a different orifice in improving flow distribution. ε is the ratio of the flow rate between the outlet 2 and the outlet 1. It is used to reflect the flow distribution of the parallel pipe.
As the diameter of the orifices became smaller, the throttling capacity of the nozzle became larger, and the corresponding parallel pipes were more evenly distributed. It can be seen from the figure that when the diameter of the hole is from 9 to 6 mm, the distribution unevenness coefficient is reduced from 1.09 to 1.01, and the change of the main pipe flow rate has little effect on the distribution coefficient. From the simulation results, for every 1% increase in uniformity, the pressure loss will increase by about 4%.

5. Conclusions

Numerical simulation and experimental studies were used to study the flow distribution characteristics of parallel pipelines with and without rectifier nozzles. The main conclusions are as follows:
(1)
The rectifier nozzle can prevent the flow field of each branch pipe from being distorted during the shunting process, so that the velocity and pressure distribution of the parallel pipes are more uniform and stable. Uniformity is obtained by increasing the resistance loss. For every 1% increase in uniformity, the pressure loss will increase by about 4% for rectifier nozzle.
(2)
As the inlet flow rate increases, the degree of uneven flow distribution increases. The rectifier nozzle effectively improves the unevenness of the flow distribution of the parallel pipeline.
(3)
At the same inlet flow rate, as the temperature rises, the degree of uneven flow distribution slightly decreases.
(4)
In this study, parallel pipes with rectifier nozzles were considered. Mild cavitation occurred in which the bubbles were small and scattered, and the flow distribution of the parallel pipelines was found to be relatively uniform, with only a slight difference.

Author Contributions

Collected original data, H.Z. and S.Z.; analyzed the results, Q.Z., Y.C., S.S., Z.Y., and F.W.; simulations, Y.C. and S.Z.; writing (original draft preparation), Z.Y., Q.Z., and S.Z.; all of the authors contributed to the review and editing of the manuscript. All authors have read and agreed to the published version of the manuscript.

Funding

This research was funded by the National Natural Science Foundation of China (grant no. 51906201 and no. 51706180), and the Education Scientific Research Project for the Education Department of Shaanxi Province (grant no. 16JK1542).

Conflicts of Interest

The authors declare no conflict of interest.

References

  1. Keller, J.D. The manifold problem. J. Appl. Mech. 1949, 3, 77–85. [Google Scholar]
  2. Steve, H.C.; Sehyun, S.; Young, I.C. The effects of the Reynolds number and width ratio on the flow distribution in manifolds of liquid cooling modules for electronic packaging. Int. Commun. Heat Mass Transf. 1993, 20, 607–617. [Google Scholar]
  3. Sooyoun, K.; Eunsoo, C.; Young, I.C. The effect of header shapes on the flow distribution in a manifold for electronic packaging applications. Int. Commun. Heat Mass Transf. 1995, 20, 329–341. [Google Scholar]
  4. Heehak, A.; Sunghyuk, L.; Sehyun, S. Flow distribution in manifolds for low Reynolds number flow. J. KSME Int. J. 1998, 12, 87–95. [Google Scholar]
  5. Kikas, N.P. Laminar flow distribution in solar systems. J. Sol. Energy 1995, 54, 209–217. [Google Scholar] [CrossRef]
  6. Wang, J.Y. Pressure drop and flow distribution in parallel-channel configurations of fuel cells: Z-type arrangement. Int. J. Hydrog. Energy 2010, 35, 5498–5509. [Google Scholar] [CrossRef]
  7. Tong, J.C.K.; Sparrow, E.M.; Abraham, J.P. Geometric strategies for attainment of identical outflows through all of the exit ports of a distribution manifold in a manifold system. Appl. Therm. Eng. 2009, 29, 3552–3560. [Google Scholar] [CrossRef]
  8. Jones, G.F.; Noam, L. Flow distribution in manifolded solar collectors with negligible buoyancy effects. Sol. Energy 1994, 52, 289–300. [Google Scholar] [CrossRef]
  9. Volker, W.; David, L.; Andreas, R. Flow distribution in solar collectors with laminar flow conditions. Sol. Energy 2002, 73, 433–441. [Google Scholar]
  10. Lu, F.; Luo, Y.H.; Yang, S.M. Analytical and experimental investigation of flow distribution in manifolds for heat exchangers. J. Hydrodyn. 2008, 20, 179–185. [Google Scholar] [CrossRef]
  11. Cheng, H.H.; Chun, H.W. The design of uniform tube flow rates for Z-type compact parallel flow heat exchangers. Int. Commun. Heat Mass Transf. 2013, 57, 608–622. [Google Scholar]
  12. Miao, Z.Q.; Xu, T.M. Single phase flow characteristics in the headers and connecting tube of parallel tube platen systems. Appl. Therm. Eng. 2006, 26, 396–402. [Google Scholar] [CrossRef]
  13. Zhao, Z.N. Effect of friction resistance on flow characteristics of shunt and confluence header. Petrochem. Equip. 2001, 30, 10–13. (In Chinese) [Google Scholar]
  14. Pu, J.H.; Hu, M.F.; Zhu, X.Q. Research on fluid flow distribution in parallel pipeline system. J. Kunming Univ. Sci. Technol. (Sci. Technol.) 2003, 28, 131–132. (In Chinese) [Google Scholar]
  15. Zhong, X.H.; Zhang, L.; Wu, C.B. Experiments and numerical simulation of flow distribution with larger flux in multi-branch pipe. J. Chongqing Univ. Nat. Sci. Ed. 2006, 29, 41–56. (In Chinese) [Google Scholar]
  16. Wei, X.L.; Miao, Z.Q. Experimental study of flow characteristics in parallel tube set systems with Z-type and U-type headers. Chin. J. Power Eng. 2008, 28, 514–518. (In Chinese) [Google Scholar]
  17. Facao, J. Optimization of flow distribution in flat plate solar thermal collectors with riser and header arrangements. Sol. Energy 2015, 120, 104–112. [Google Scholar] [CrossRef] [Green Version]
  18. He, J. Numerical Analysis of the Flow Distribution in Multiple Branches Parallel-Tube Configuration Lanzhou. Master Thesis, Lanzhou Jiaotong University, Lanzhou, China, 2014. (In Chinese). [Google Scholar]
  19. Duan, F.; Chen, L.C. Numerical simulation of flow distribution characteristics of manifold with mid-plate pipeline technique and equipment. Pipeline Tech. Equip. 2016, 4, 1-4+17. (In Chinese) [Google Scholar]
  20. Wang, J. Design method of flow distribution in nuclear reactor systems. Chem. Eng. Res. Des. 2013, 91, 595–602. [Google Scholar] [CrossRef]
  21. Zhu, Y.Q.; Miao, B. Numerical simulation of flow characteristics in manifolds. J. Xi’an Shiyou Univ. 2011, 26, 94–96. (In Chinese) [Google Scholar]
  22. Zhang, R.L.; Fang, Y.H. Analysis of flow uniformity of parallel pipe group model. J. Tianjin Univ. Sci. Technol. 2007, 2, 45–48. (In Chinese) [Google Scholar]
  23. Yang, C.; Niu, Y.J.; Luo, H.Y. Design of current sharing model of parallel tube group in heat exchange equipment based on fluent. Mech. Des. Manuf. 2015, 5, 150–155. (In Chinese) [Google Scholar] [CrossRef]
  24. Qu, H.X.; Sun, Z.N.; Ding, M. Study on the influence of header matching on flow distribution of U-shaped parallel tube group heat exchanger. Atom. Energy Sci. Technol. 2015, 49, 623–628. (In Chinese) [Google Scholar]
  25. Wang, J. Theory of flow distribution in manifolds. Chem. Eng. J. 2011, 168, 1331–1345. [Google Scholar] [CrossRef]
  26. Minocha, N.; Joshi, J.B. 3D CFD simulation of turbulent flow distribution and pressure drop in a dividing manifold system using openfoam. Int. J. Heat Mass Transf. 2020, 151, 119420. [Google Scholar] [CrossRef]
Figure 1. Test system of parallel pipeline flow distribution.
Water 12 02558 g001
Figure 2. Sketch map of test section.
Water 12 02558 g002
Figure 3. (a) Structural size of the test section; (b) structural size of the nozzle.
Water 12 02558 g003aWater 12 02558 g003b
Figure 4. Schematic diagram of the local grid.
Water 12 02558 g004
Figure 5. (a) Comparison of numerical calculation results and experimental data at 23 °C; (b) comparison of numerical calculation results and experimental data at 40 °C.
Water 12 02558 g005
Figure 6. The velocity distribution of the branch at the temperature of 40 °C and a flow rate of 120 t/h. (a) velocity distribution of parallel pipelines without rectifier nozzles; (b) velocity distribution of parallel pipelines with rectifier nozzles; (c) velocity distribution near the rectifier nozzle.
Water 12 02558 g006
Figure 7. The pressure distribution of the branch vs. the different inlet flow rates at a temperature of 23 °C. (a) Pressure distribution at the inlet flow at a rate of 60 t/h (left is no rectifier nozzle); (b) pressure distribution at the inlet flow at a rate of 120 t/h (left is no rectifier nozzle); (c) pressure distribution at the inlet flow at a rate of 140 t/h (left is no rectifier nozzle).
Water 12 02558 g007
Figure 8. Discharge coefficients of rectifier nozzles.
Water 12 02558 g008
Figure 9. Variation of (Q2 − Q1)/Q vs. inlet flow rate at different temperatures. (a) no rectifier nozzle; (b) with rectifier nozzle.
Water 12 02558 g009
Figure 10. The flow distribution of branch at the temperature of 40 °C.(a) Without rectifier nozzle; (b) with rectifier nozzle.
Water 12 02558 g010
Figure 11. Gas fraction near the nozzle under the high temperature inlet.
Water 12 02558 g011
Figure 12. Uniformity coefficient vs. pressure loss at different flow rate.
Water 12 02558 g012
Table 1. Uncertainties of the experimental parameters.
Parameter.UnitUncertainty (%)
Mass flow ratet/h0.5
PressureKPa0.08
Fluid temperature°C2.19
Table 2. Physical properties of water.
Temperature (°C)Density (kg/m3)Viscosity (Pa-s) × 103
23.0997.540.9321
40.0992.220.6527
60.0983.200.4660
Table 3. Influence of number of grid cells.
Number of Cell Δ P ( int out ) ( Pa ) Velocity of out1 (m/s)Velocity of out2 (m/s)
0.75 million49460.4350.453
1.6 million49650.4320.453
2.7 million49500.4320.453