Article

Effect of Current and Initial pH on Electrocoagulation in Treating the Distillery Spent Wash with Very High Pollutant Content

by
Iqbal Syaichurrozi
1,2,
Sarto Sarto
1,*,
Wahyudi Budi Sediawan
1 and
Muslikhin Hidayat
1
1
Department of Chemical Engineering, Faculty of Engineering, Universitas Gadjah Mada, Jl. Grafika No.2, Yogyakarta 55281, Indonesia
2
Department of Chemical Engineering, Faculty of Engineering, University of Sultan Ageng Tirtayasa, Jl. Jendral Soedirman Km 3, Cilegon 42435, Indonesia
*
Author to whom correspondence should be addressed.
Water 2021, 13(1), 11; https://doi.org/10.3390/w13010011
Submission received: 24 October 2020 / Revised: 13 December 2020 / Accepted: 16 December 2020 / Published: 23 December 2020
(This article belongs to the Section Wastewater Treatment and Reuse)

Abstract

:
The distillery spent wash (DSW) from bioethanol industries has a very high chemical oxygen demand (COD). Hence, the goal of this study is to investigate the effect of currents (2.5, 3 and 3.5 A) and initial pHs (4.4, 5.0 and 7.0) on electrocoagulation (EC) to decrease the COD in DSW. The results showed that the EC at the current of 3.5 A enabled a higher COD removal efficiency (74.9%) than those at the currents of 2.5 (35.4%) and 3 A (60.9%). Furthermore, the initial pH of 7.0 resulted in a higher COD removal efficiency than the initial pHs of 4.4 and 5.0. The solution pH and temperature increased throughout the process. The working volume was not constant due to the reactions of water reduction, evaporation and flotation. Scum and sludge productions were also monitored during the process. Then, the measured data (COD, sludge and scum) were used in the modeling. The simple mechanistic models were successfully built and applied to simulate the data in mass units with two different routes of process. Route 1 assumed that the COD was converted to sludge and then the latter was converted to scum. Route 2 assumed that the COD was converted to the sludge and scum at the same time. When the EC was operated at the initial pH of 4.4, the COD removal process followed route 1, but that at the initial pHs of 5.0 and 7.0, the COD removal process followed route 2. The higher the current applied in the EC, the higher the kinetic constants of k a and k b . Additionally, the higher the initial pH set, the higher the kinetic constants were. This showed that the formation rates of sludge and scum at the higher currents or initial pHs were faster than those at the lower values.

1. Introduction

Distillery spent wash (DSW), also known as vinasse, is a bottom product of distillation units in bioethanol industries. Because of its extreme characteristics (high chemical oxygen demand (COD)), DSW cannot be released into water bodies [1,2,3]. The main organic compounds that exist in DSW are carbohydrates, ethanol, glycerol, acetic acid, lactic acid and other compounds [4]. Therefore, it has to be treated before being discharged into the environment. In many countries, a biological treatment such as anaerobic digestion (AD) is applied to treat it [5]. However, this is not effective if DSW has a very high COD concentration (more than 75,000 mgL−1, approximately) because it is toxic for anaerobic bacteria [6]. Besides this, it is energy intensive [5]. In physical treatments, adsorption is one of physical methods used widely to treat wastewaters [7]. However, it is not effective for wastewaters with high COD concentrations because it will need excess chemicals [7,8]. In chemical treatments, ozone could be applied to treat DSW but it has high operating costs [7]. Furthermore, in physicochemical treatments, some authors have recommended treating DSW using an electrocoagulation (EC) method [1,2,3,9,10]. It is attractive enough in treating wastewaters because of its low operating cost, short retention time, simple equipment, rapid sedimentation and easy operation [8]. Furthermore, hydrogen gas, an alternative energy, could also be obtained during the EC process [8]. Moreover, the sludge obtained after the EC process could be utilized in making building blocks [11]. Based on this, EC is the most promising method in treating DSW.
In EC, the coagulants result with the help of electrical force. The three basic methods included in EC are electrolysis, coagulation and flotation [12]. Aluminum (Al) and iron (Fe) are common materials applied as electrodes in EC. When the electrical current flows, the anode (Al or Fe) is dissolved to form Al3+ or Fez+ ions (called an oxidation process) and the H2O is reduced to become OH ions and H2 gas (called a reduction process) [13]. Furthermore, the reaction between the Al3+ or Fez+ and the OH ions resulted in coagulants (Al(OH)3 or Fe(OH)2). The coagulants will adsorb the COD to produce the sludge [8]. In addition, the H2 gas floats the pollutants to the surface of wastewaters as the scum [8,14]. According to Darmadi et al. [15], EC with electrodes of Al-Al and Fe-Fe could result in COD removal with values of 89.9 and 95.0%, respectively. Furthermore, an Fe electrode is much cheaper than an Al electrode. Because of this, the Fe electrode was chosen in this study.
Studies on EC for treating DSW have been reported by some authors [1,2,3,9,10]. Yavuz [1] studied the effect of current density (10, 15 and 20 mA cm−2) and electrolyte addition (0.1, 0.2 and 0.3 M Na2SO4). After process for 3 h, a COD removal of 14.3% was obtained at a current density of 20 mA cm−2 and with 0.2 M Na2SO4 addition. Khandegar and Saroha [2] varied the initial pH to 4, 5, 6 and 7.5 and the current density to 35.9, 53.8 and 71.8 mA cm−2. The most effective COD removal (88%) was obtained at an initial pH of 7.5 and current density of 71.8 mA cm−2 with electrodes of Fe-Fe and electrolysis time of 2 h. To increase the capability of EC in removing COD, the EC could be combined with advanced oxidation processes such as ozonation, peroxi-electrocoagulation, photo-electrocoagulation and peroxi-photo-electrocoagulation [3,9,10]. The combinations successfully decreased the COD in the DSW, but the operating cost was more expensive. The initial COD of DSW, which is treated in these studies, is low enough. In the study of [1,2], the COD concentration in the raw DSW is 3360–4750 mgL−1. The study of [10] has reported that the raw DSW contains COD of 8500 mgL−1 but the COD is diluted to be 2000 mgL−1 before the EC treatment. Furthermore, Asaithambi et al. [3,9] have found that the raw DSW contains higher a COD concentration which is 80,000–90,000 mgL−1, but in their EC experiment, the DSW is diluted to decrease its COD to be 2500 mgL–1. Dilution prior to the EC treatment is not attractive because it will make the total volume of DSW higher.
In present study, the local DSW contains a very high COD concentration (more than 110,000 mg/L) (Table 1). It was treated by using the EC without dilution. Previously, the authors investigated the effect of the initial pH (origin pH, 5, 6) [8] and the voltage (7.5 and 12.5 V) [14] in the EC of the local DSW with an electrolysis time of 1 h. After 1 h, the COD concentration in the DSW was still high. It could be concluded that a longer time was needed to remove the COD content completely. In the previous studies, the voltage was kept constant, so the current changed during the process. Because the current is very important in the EC, it has to be kept constant. Therefore, in this study, the authors modified the Direct Current (DC) power supply so that the electrical current could be kept constant. There are many factors affecting COD removal in the EC, but the most important factors are the current and initial pH [8,14]. Hence, in this study, the electrical current was varied to become 2.5, 3 and 3.5 A and the initial pH of DSW was adjusted to become 4.4, 5.0 and 7.0 with an electrolysis time of 8 h.
To better understand the EC process in treating the DSW, the simple mechanistic models were also developed in this study. Other authors have used some empirical models (first order, second order, Langmuir, Elovic models) to analysis the EC process at various parameter conditions [16,17,18]. However, the empirical models just predict the decrease rate of COD concentration. In fact, the EC products, such as those of scum and sludge productions, were not included in the models. In previous studies [8,14], the mechanistic models were successfully developed but they are very complex. Simpler mechanistic models are needed so that they could be used widely and easily by many researchers. Therefore, the simple mechanistic models were developed to investigate the EC phenomena, including the profiles of COD, sludge and scum.
Based on the explanation above, the aims of this study are (1) to investigate the potency of EC to treat the local DSW with a very high COD concentration and (2) to develop the simple mechanistic models in the EC process in treating the DSW. The experiment of the EC was conducted with variations of the electrical current and the initial pH at room temperature under a batch system. The parameters monitored during the EC process are COD, pH, temperature, voltage, scum and sludge.

2. Materials and Methods

2.1. Distillery Spent Wash

The distillery spent wash (DSW) was collected from a bioethanol industry located in Indonesia. The chemical characteristics of the DSW are shown in Table 1. The DSW contained a very high COD concentration of 112,948.5 mgL−1. This value was much higher than that in the other studies [1,2,3,9,10]. If the DSW is released directly into the water bodies, the water biota can die due to the high COD values in the water [19]. The pH level of the DSW was very low—4.4. This correlates with its high volatile fatty acid concentration (19,291.24 mg-Acetic acid L−1). Naspolini et al. [20] reported that DSW containing 13,100 mg-Acetic acid L−1 has a pH level of 4.1. The low pH of DSW causes a remobilization of heavy metals in the soil if it is released directly into the soil [21]. Furthermore, the alkalinity of DSW in this study was assumed to be same as that in the study of Naspolini et al. [20]. Naspolini et al. [20] reported that the alkalinity of DSW (having a pH level of 4.1) was not detected. The pH level of DSW in this study (4.4) was almost the same as the study of [20] (4.1). The salinity of DSW was also very high. This could be seen through the potassium and chloride concentrations in the DSW. Because of its high salinity, the DSW cannot be used as a fertilizer because the soil structure will be poor (not fertility) [22]. The plants growing in the soil are poisoned and die due to excessive of uptake of the ions (particularly chloride). The conductivity level in the DSW is high (27,287.68 μScm−1). It showed that the DSW can potentially be treated by the EC.

2.2. Experimental Set-Up

A batch EC reactor was made from a 1000 mL glass beaker. Electrodes (iron plats), with dimensions of length, width and thickness of 20, 3 and 3 mm, were used as the anode–cathodes with initial active dimensions of 9.5, 3 and 3 mm (immersed in the DSW, the active surface was 63.6 cm2). The interelectrode distance was kept constant at 5.5 cm. This experimental set-up was the same used in the previous studies [8,14]. The electrical current was supplied by the DC power supply (Long Wei, Series of LW-K3010D, 0–30 V, 0–10 A). The agitation speed was kept constant at 500 rpm.

2.3. Experimental Design and Procedures

Before use, the electrodes were soaked in HCl 5%v/v solution for 15 min to remove contaminants; after that, they were rinsed using the distilled water and then weighted [23]. The electrical current was varied to 2.5, 3 and 3.5 A (or the current densities of 39.31, 47.17 and 55.03 mA cm−2, respectively) and the initial pH was adjusted to be 4.4, 5.0 and 7.0 through NaOH addition (technical grade). The EC was operated under a batch system for 8 h. During the process, the change of the voltage, temperature, pH and liquid level of the DSW in the reactor was recorded per 1 h. The scum produced on the surface of DSW was taken and then dried under temperature of 105–110 °C and weighted. Meanwhile, the solution sample was taken as much as 10–15 mL and then placed in reaction tubes for settling as long as 24 h. After settling, the volume of supernatant and sludge were recorded and then the former was taken for the COD analysis.

2.4. Analysis

The solution temperature and pH were measured by using a mercury temperature (range of 0–100 °C) and a digital pH meter, respectively. The analysis of COD was conducted through the open reflux and titration method of SNI 06-6989.15-2004 [14]. The COD removal efficiency was calculated using Equation (1).
C O D   r e m o v a l   e f f i c i e n c y   %   =   I n i t i a l   C O D   g     C O D   a f t e r   E C g I n i t i a l   C O D   g × 100 %
According to Syaichurrozi et al. [14], the sludge and scum are formed from flocs which result from adsorption of COD on coagulants (Fe(OH)2). The coagulant resulted from electrolysis process. Therefore, the correlation between COD, coagulant, sludge and scum could be written using Equation (2) [14].
S l u d g e   m a s s   g   +   S c u m   m a s s   g   =   r e m o v e d   C O D   m a s s   g   +   r e m o v e d   F e   m a s s   g
Because of the removed COD mass >>> removed Fe mass, for simplification, Equation (2) is rearranged to become Equations (3a,b).
S l u d g e   m a s s   g   +   S c u m   m a s s   g   =   r e m o v e d   C O D   m a s s   g
S l u d g e   m a s s   g   =   r e m o v e d   C O D   m a s s   g     S c u m   m a s s   g

3. Development of Simple Mechanistic Models

The simple mechanistic models were proposed with two different routes. Route 1: the sludge is formed by an adsorption process of pollutant on the coagulant and the scum is formed by the part of sludge which floats to the liquid surface [8]. Route 2: the sludge and scum are formed at the same time from an adsorption process of pollutant on the coagulant [14]. Therefore, the COD removal mechanism during the EC process following routes 1 and 2 is presented in Equations (4)–(7), respectively.
Route 1:
C O D k a S l u d g e
S l u d g e k b S c u m
Route 2:
C O D k a S l u d g e
C O D k b S c u m
The study of [14] reported that the working volume is not constant during the EC process. Therefore, for simplification, the unit of COD, sludge and scum in this model was mass unit (g). Furthermore, mathematical equations were arranged based on the routes.

3.1. Route 1

Based on Equation (4), the COD mass decreases while the sludge mass increases. The decrease rate of the COD mass could be written as Equation (8). Therefore, the increase rate of the sludge mass is estimated by Equation (9).
d m C O D d t = k a m C O D
d m s l u d g e d t = k a m C O D
Based on Equation (5), the sludge mass becomes the scum since the H2 gas is formed and pushes the sludge up to the liquid surface. The decrease rate of sludge mass could be estimated through Equation (10). Therefore, the increase rate of the scum could be predicted by Equation (11).
d m s l u d g e d t = k b m s l u d g e
d m s c u m d t = k b m s l u d g e
Comprehensively, the net rate of the sludge mass during the EC process based on route 1 is shown in Equation (12a,b). It is also consistent with Equation (3b).
d m s l u d g e d t = d m C O D d t d m s c u m d t
d m s l u d g e d t = k a m C O D k b m s l u d g e
Equations (8), (11) and (12b) are used in the mechanistic model based on route 1.

3.2. Route 2

Based on Equation (6), the COD decreases while the sludge increases. The decrease rate of the COD mass could be written as Equation (13). Therefore, the increase rate of the sludge is estimated by Equation (14).
d m C O D d t = k a m C O D
d m s l u d g e d t = k a m C O D
Based on Equation (7), the COD is also converted to scum through a flotation process. The decrease rate of the COD mass could be estimated through Equation (15). Therefore, the increase rate of the scum could be predicted by Equation (16).
d m C O D d t = k b m C O D
d m s c u m d t = k b m C O D
Comprehensively, the net rate of the COD mass during the EC process based on route 2 is shown in Equation (17a,b). It is also consistent with Equation (3a).
d m C O D d t = d m s l u d g e d t + d m s c u m d t
d m C O D d t = k a m C O D k b m C O D
Equations (14), (16) and (17b) are used in the mechanistic model based on route 2.
Summary of the mathematic equations used in the mechanistic models based on routes 1 and 2 is presented in Table 2. The curve fitting between the measured and predicted data is formed. The deviation of these two is represented in a Sum of Squared Error (SSE) value (Equation (18)). The values of the kinetic constants ( k a and k b ) are obtained by minimization of the SSE. Furthermore, the coefficient determination of the models is estimated through Equation (19a–d).
SSE = i = 1 n y i y ^ i y i 2
R 2 f o r   t h e   m o d e l = R 2   f o r   C O D + R 2   f o r   s l u d g e + R 2   f o r   s c u m 3
R 2 f o r   C O D = 1 i = 1 n C O D i C O D ^ i 2 i = 1 n C O D i C O D ¯ 2
R 2 f o r   s l u d g e = 1 i = 1 n s l u d g e i s l u d g e ^ i 2 i = 1 n s l u d g e i s l u d g e ¯ 2
R 2 f o r   s c u m = 1 i = 1 n s c u m i s c u m ^ i 2 i = 1 n s c u m i s c u m ¯ 2

4. Results and Discussions

4.1. Section 1: Effect of Electrical Current

4.1.1. Experiment

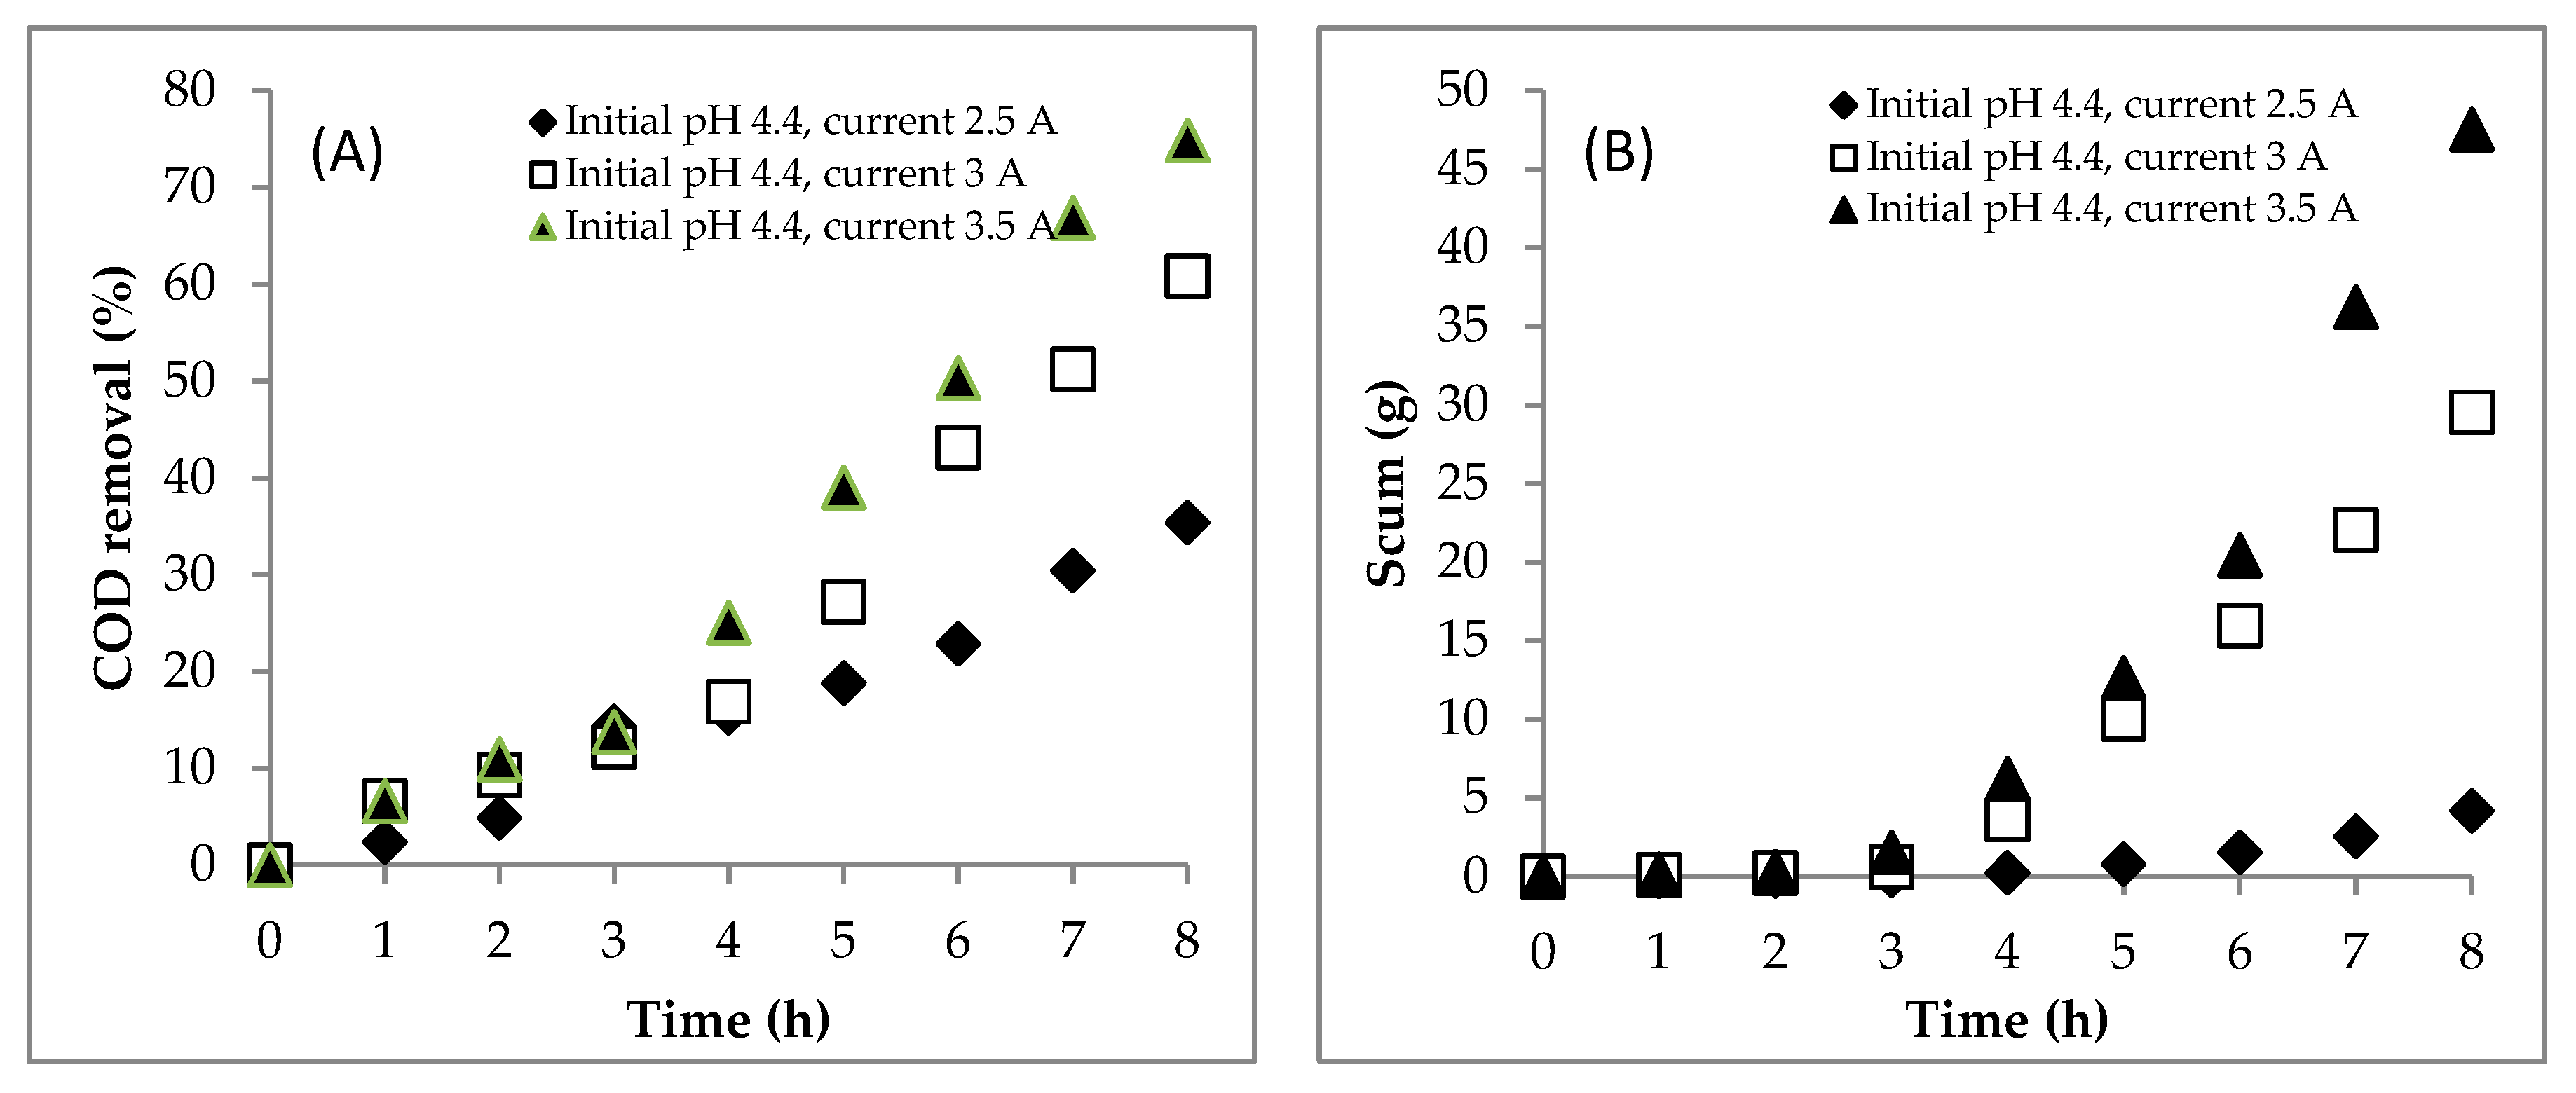
In this section, the EC was carried out at the various currents (2.5, 3.0, 3.5 A) with the origin DSW having an initial pH of 4.4. During the EC process, the current was kept constant at 2.5, 3 and 3.5 A; as a consequence, the voltage changed. The voltage profiles are shown in Figure 1A. The evolution of the voltage during the process was caused by the change of the solution conductivity [24]. The change of the solution conductivity is caused by the amount of Fez+ generated electrically and the formation of flocs. In the first four hours of electrolysis time, the voltage decreased due to the increase in the solution conductivity caused by the increase in the amount of Fez+ ions in the solution. Meanwhile, in the second four hours, the voltage increased because the solution conductivity decreased. This was because the Fez+ consumed the OH to form the coagulants and then adsorbed the pollutants to produce the flocs. The more flocs formed in solution, the higher the solution resistivity is, so the conductivity decreased. Thus, the necessary voltage for obtaining the constant current decreased. From Figure 1A, the EC at 3.5 A needed a higher voltage than the EC at the other two currents in the second four hours of processing time. This means that it resulted in a larger number of flocs than the two others, so the production of sludge and scum is higher (Figure 2B,C).
The appropriate z value is 2, resulting in Fe2+ ions at the anode through an oxidation reaction [8]. Meanwhile, the OH ions and H2 gas were formed from the reduction reaction of water at the cathode. Therefore, the OH ion accumulation could increase the solution pH [25]. Its profiles during the process are presented in Figure 1B. At the currents of 2.5, 3 and 3.5 A, the solution pH increased from 4.4 to 7.0, 7.3 and 7.3, respectively. These results were in line with some studies [26,27] where the solution pH usually increases during the EC process. Kobya et al. [26] reported that the final pH is always higher than the initial pH (3, 5, 7, 9, 11) in EC using iron electrode in treating textile wastewaters. Meanwhile, Kim et al. [27] also came to the same conclusion—they found that the solution pH increased at the end of the process with initial pHs of 3, 5, 7 and 9 in the EC when treating the groundwater.
Furthermore, the changes in solution temperature during the process are presented in Figure 1C. This was caused by the current being supplied to the solution continuously [28]. At the currents of 2.5, 3 and 3.5 A, the solution temperature increased from 27 to 47, 60.5 and 81 °C after the EC for 8 h, respectively. The high temperature allowed the formation of larger hydrogen bubbles increasing the flotation speed and reducing the adhesion of suspended particles [29]. Therefore, the scum would be produced in larger amounts (Figure 2B).
During the EC process, the working volume of DSW decreased. That can be caused by (1) the reduction process of water at the cathode side [13], (2) the evaporation process at the high temperature [30] and (3) the flotation process in which the scum goes to the liquid surface and carries the water [14]. In this study, the decrease in the working volume was determined and is presented in Figure 1(D). Based on Faraday’s law, the higher the current applied, the faster the reduction process of water will be [14]. Furthermore, based on the previous paragraph, at the current of 3.5 A, the rate of the increase in solution temperature was faster than that of the two others. At a higher temperature, the hydrogen bubble size was bigger, so the flotation rate was faster [29]. As a consequence, more water was carried away during scum formation. Therefore, the rate of the decrease in working volume at the current of 3.5 A was higher than that at the currents of 2.5 and 3 A. Many authors believe that the working volume is constant [16,17,18]. This assumption can be accepted in the case of treating the wastes containing low pollutant concentrations. In fact, in this study, in treating the DSW containing a high pollutant concentration, the working volume cannot be assumed to be constant.
The profile of the COD concentration during the EC process is shown in Figure 1E. Meanwhile, the COD mass profile during the EC is presented in Figure 1F. Furthermore, the COD mass removal efficiency value is shown in Figure 2A. The higher the electrical current supplied, the more Fe2+ generated, which becomes the coagulant of Fe(OH)2. The coagulant adsorbs the pollutants to form the flocs, and then the sludge and scum are formed. Therefore, the COD mass removal at the current of 3.5 A (74.9%) was higher than that at the currents of 2.5 (35.4%) and 3 A (60.9%).
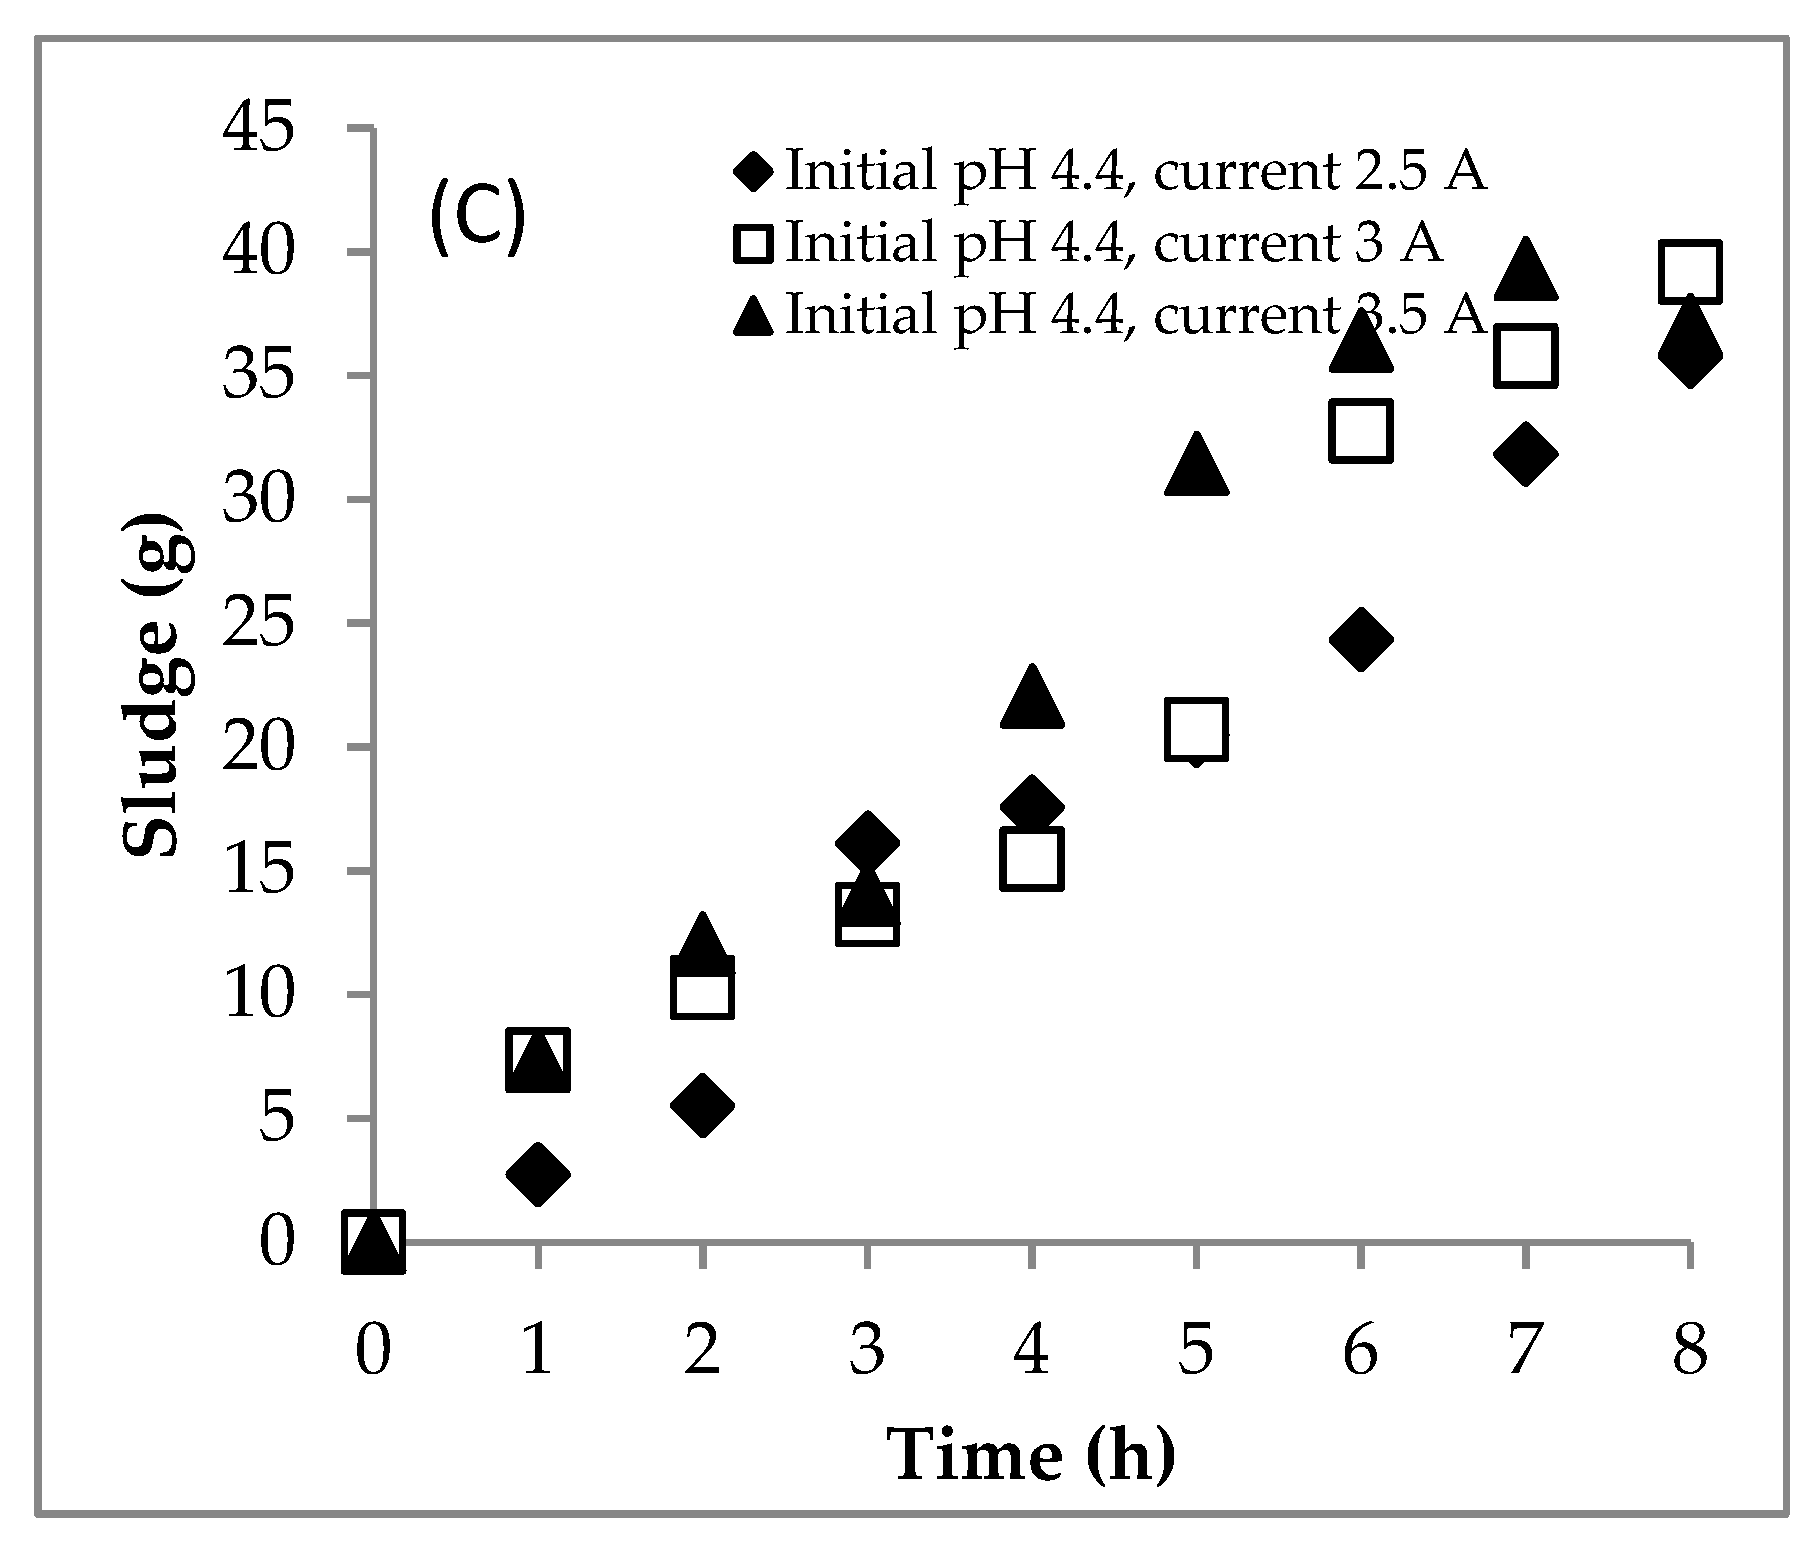
The scum formation during the process is shown in Figure 2B. The rate of scum formation at the current of 3.5 A was faster than at the currents of 2.5 and 3 A. This showed that the scum was more easily formed at the higher current. H2 gas was produced by the reduction of water at the cathode. The amount of the H2 depended on the current supplied in the system. Thus, the current of 3.5 A produced more H2 gas than the two others, so that the pollutants were more easily separated by the flotation. There was an interesting correlation between the solution pH (Figure 1B) and the scum production (Figure 2B). When the solution pH was below 6.0, the scum was produced in a small amount. However, when the solution pH was about above 6.0, the scum was produced in a large amount. The scum was generated in a large amount from hours 6, 4 and 4 at currents of 2.5, 3 and 3.5 A, respectively. At these times, the solution pHs were 6.6, 6.6 and 6.8, respectively. This means that, besides the current, the amount of scum was affected by the solution pH. Furthermore, the sludge mass was predicted using Equation (3a,b). The sludge formation is shown in Figure 2C. The currents of 3 and 3.5 A resulted in more coagulants of Fe(OH)2 than the current of 2.5 A. The coagulants had correspondence to remove pollutants to form the flocs and then the sludge and scum were formed.

4.1.2. Modeling

The two mechanistic models were successfully applied to simulate the changes of COD, sludge and scum masses with different SSE and R2 values (Table 3). A plotting between measured and predicted data is shown in Figure 3. Furthermore, the kinetic constants are presented in Table 3. Based on the values of SSE and R2, the changes of COD, sludge and scum in this section followed route 1. In route 1, the kinetic constant of k a presented the formation rate of the sludge from the reduction of COD which, at the current of 3.5 A (0.1270 h−1), was higher than those at the currents of 2.5 (0.0490 h−1) and 3 A (0.0908 h−1). It correlated with the amount of Fe2+ supplied electrically. The higher the current applied, the more Fe2+ ions supplied. Therefore, the current of 3.5 A produced more coagulants than the others. Furthermore, the kinetic constant of k b presented the formation rate of scum (flotation process). The higher the current applied, the higher the k b value would be because when the current was adjusted to the higher value, more H2 bubbles were produced. Thus, it was easier to form the scum at the higher current.

4.2. Section 2: Effect of Initial pH

4.2.1. Experiment

EC was carried out at various initial pHs (4.4, 5.0, 7.0) with a constant current of 3 A. The voltage profile during the EC process in Section 2 is presented in Figure 4A. The EC process for the initial pHs of 4.4 and 5.0 could be carried out for up to 8 h but, for the initial pH of 7.0, it could only be run for up to 7.5 h because at that time the electrical voltage value was 30 V. This study used a DC power supply with the voltage with a range of 0–30 V. A drastic increase in voltage at the end of the process was caused by a very low solution conductivity (or a very high resistance). A decrease in working volume would decrease the surface of the active electrode, thereby increasing the electrical resistance. In addition, the large number of flocs in the system could increase the electrical resistance. The solution temperature was also too high (Figure 4C). Therefore, the experiment had to be stopped.
The same as Section 1, Section 2 (effect of initial pH) shows the same phenomena for pH and temperature profiles. At the initial pHs of 4.4, 5.0 and 7.0, the solution pH increased from 4.4 to 7.3, 5.0 to 8.0 and 7.0 to 9.7, respectively (Figure 4B). This increase in pH was caused by the accumulation of OH ions resulting from the reduction process of water. Furthermore, the increase in solution temperature during the process is shown in Figure 4C. At initial pHs of 4.4, 5.0 and 7.0, the temperature increased from 26–30 to 60.5, 82 and 83 °C, respectively.
The profile of decrease in working volume is shown in Figure 4D. As explained above, this could be caused by (1) the reduction process of water, (2) the evaporation process and (3) the flotation process. The rates of decrease in volume at the initial pHs of 5.0 and 7.0 were higher than that at the initial pH of 4.4. At initial pHs of 5.0 and 7.0, the increases in solution temperature were very rapid. At high temperatures, the evaporation rate of water was high. In addition, it caused the big size of hydrogen bubbles so that the flotation process was easy conduct. Furthermore, the water was also provided by the scum after being removed during the EC process.
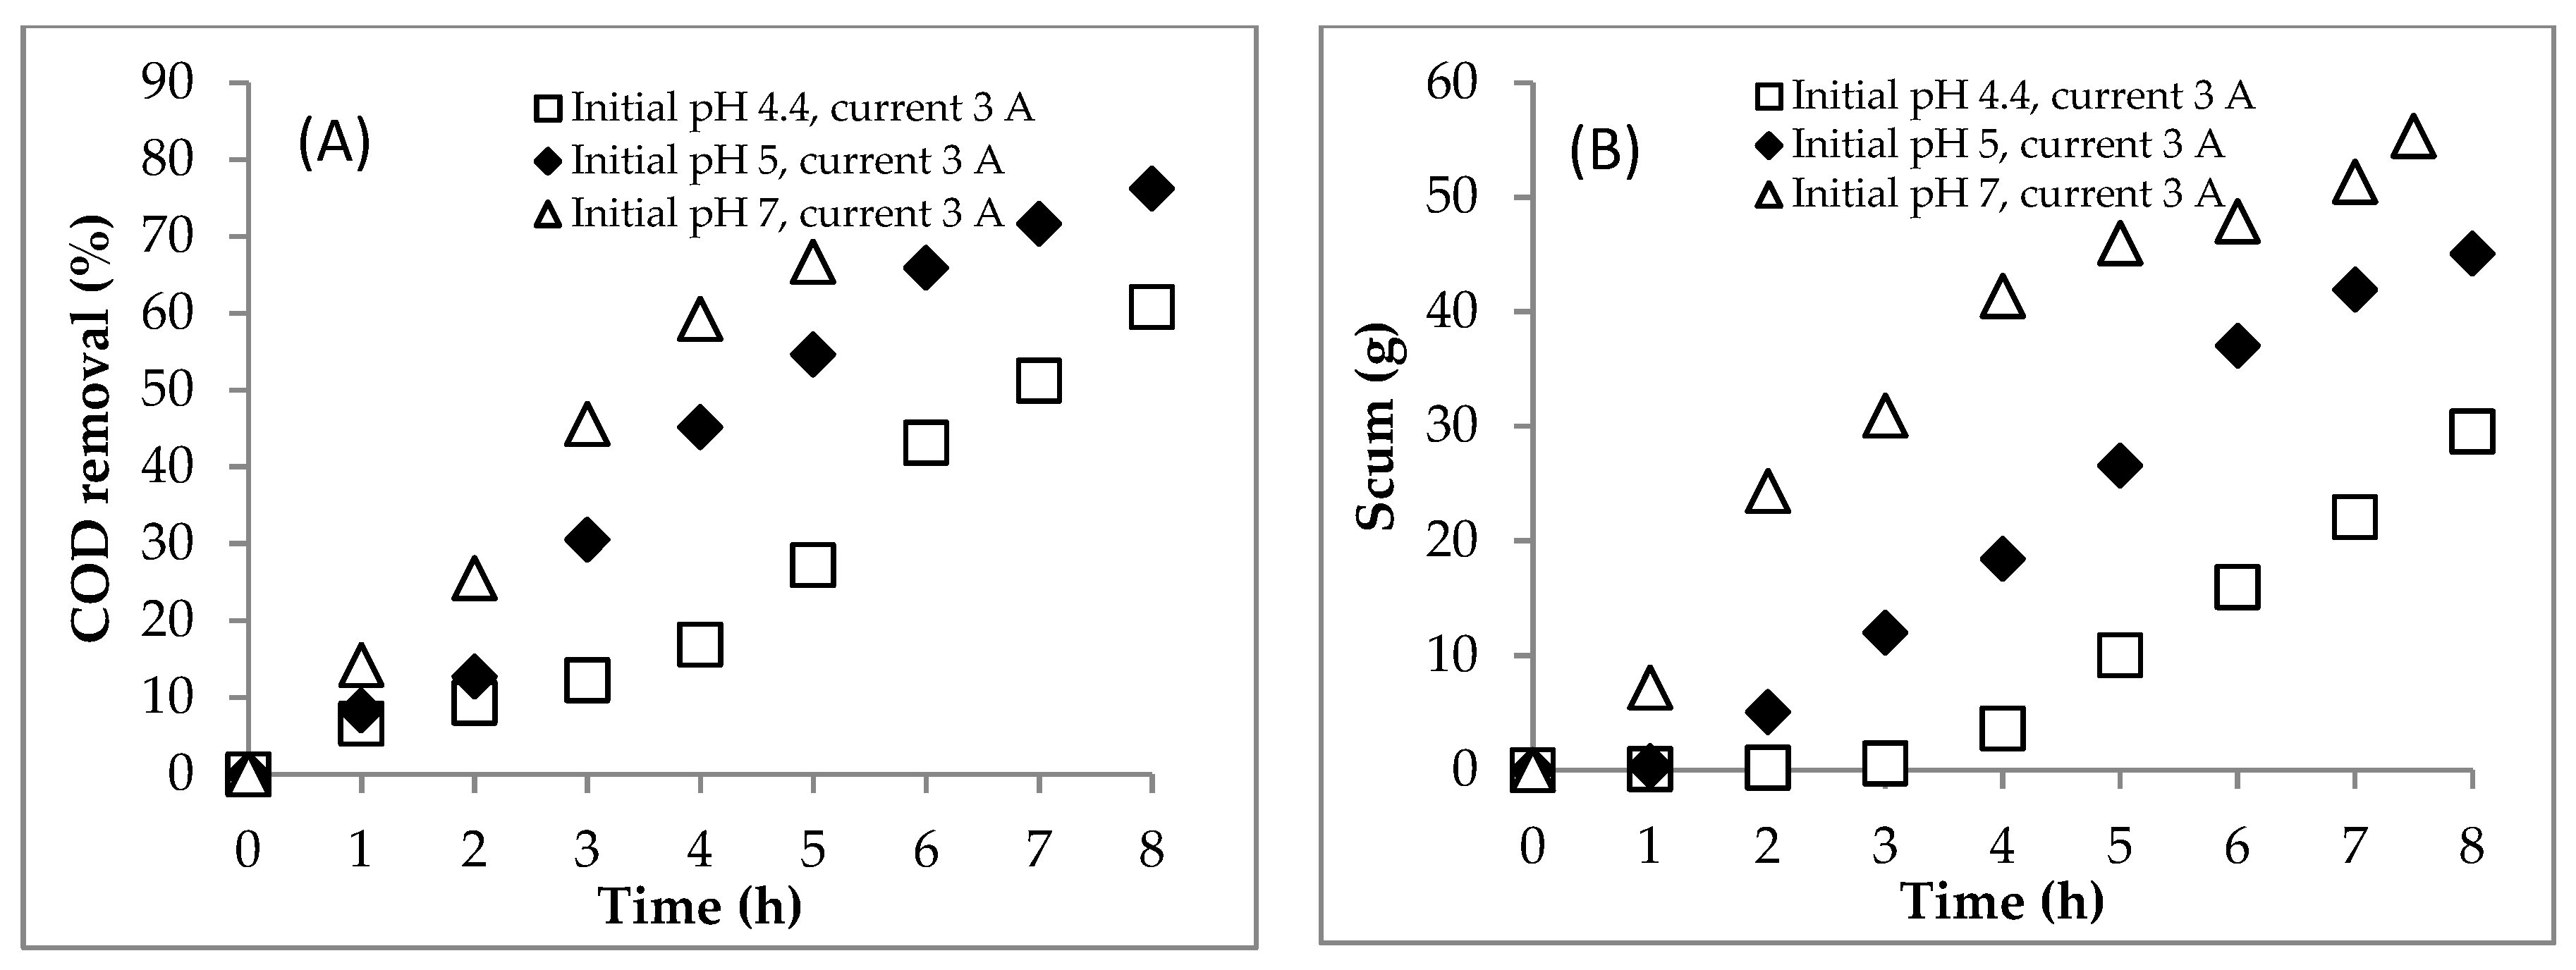
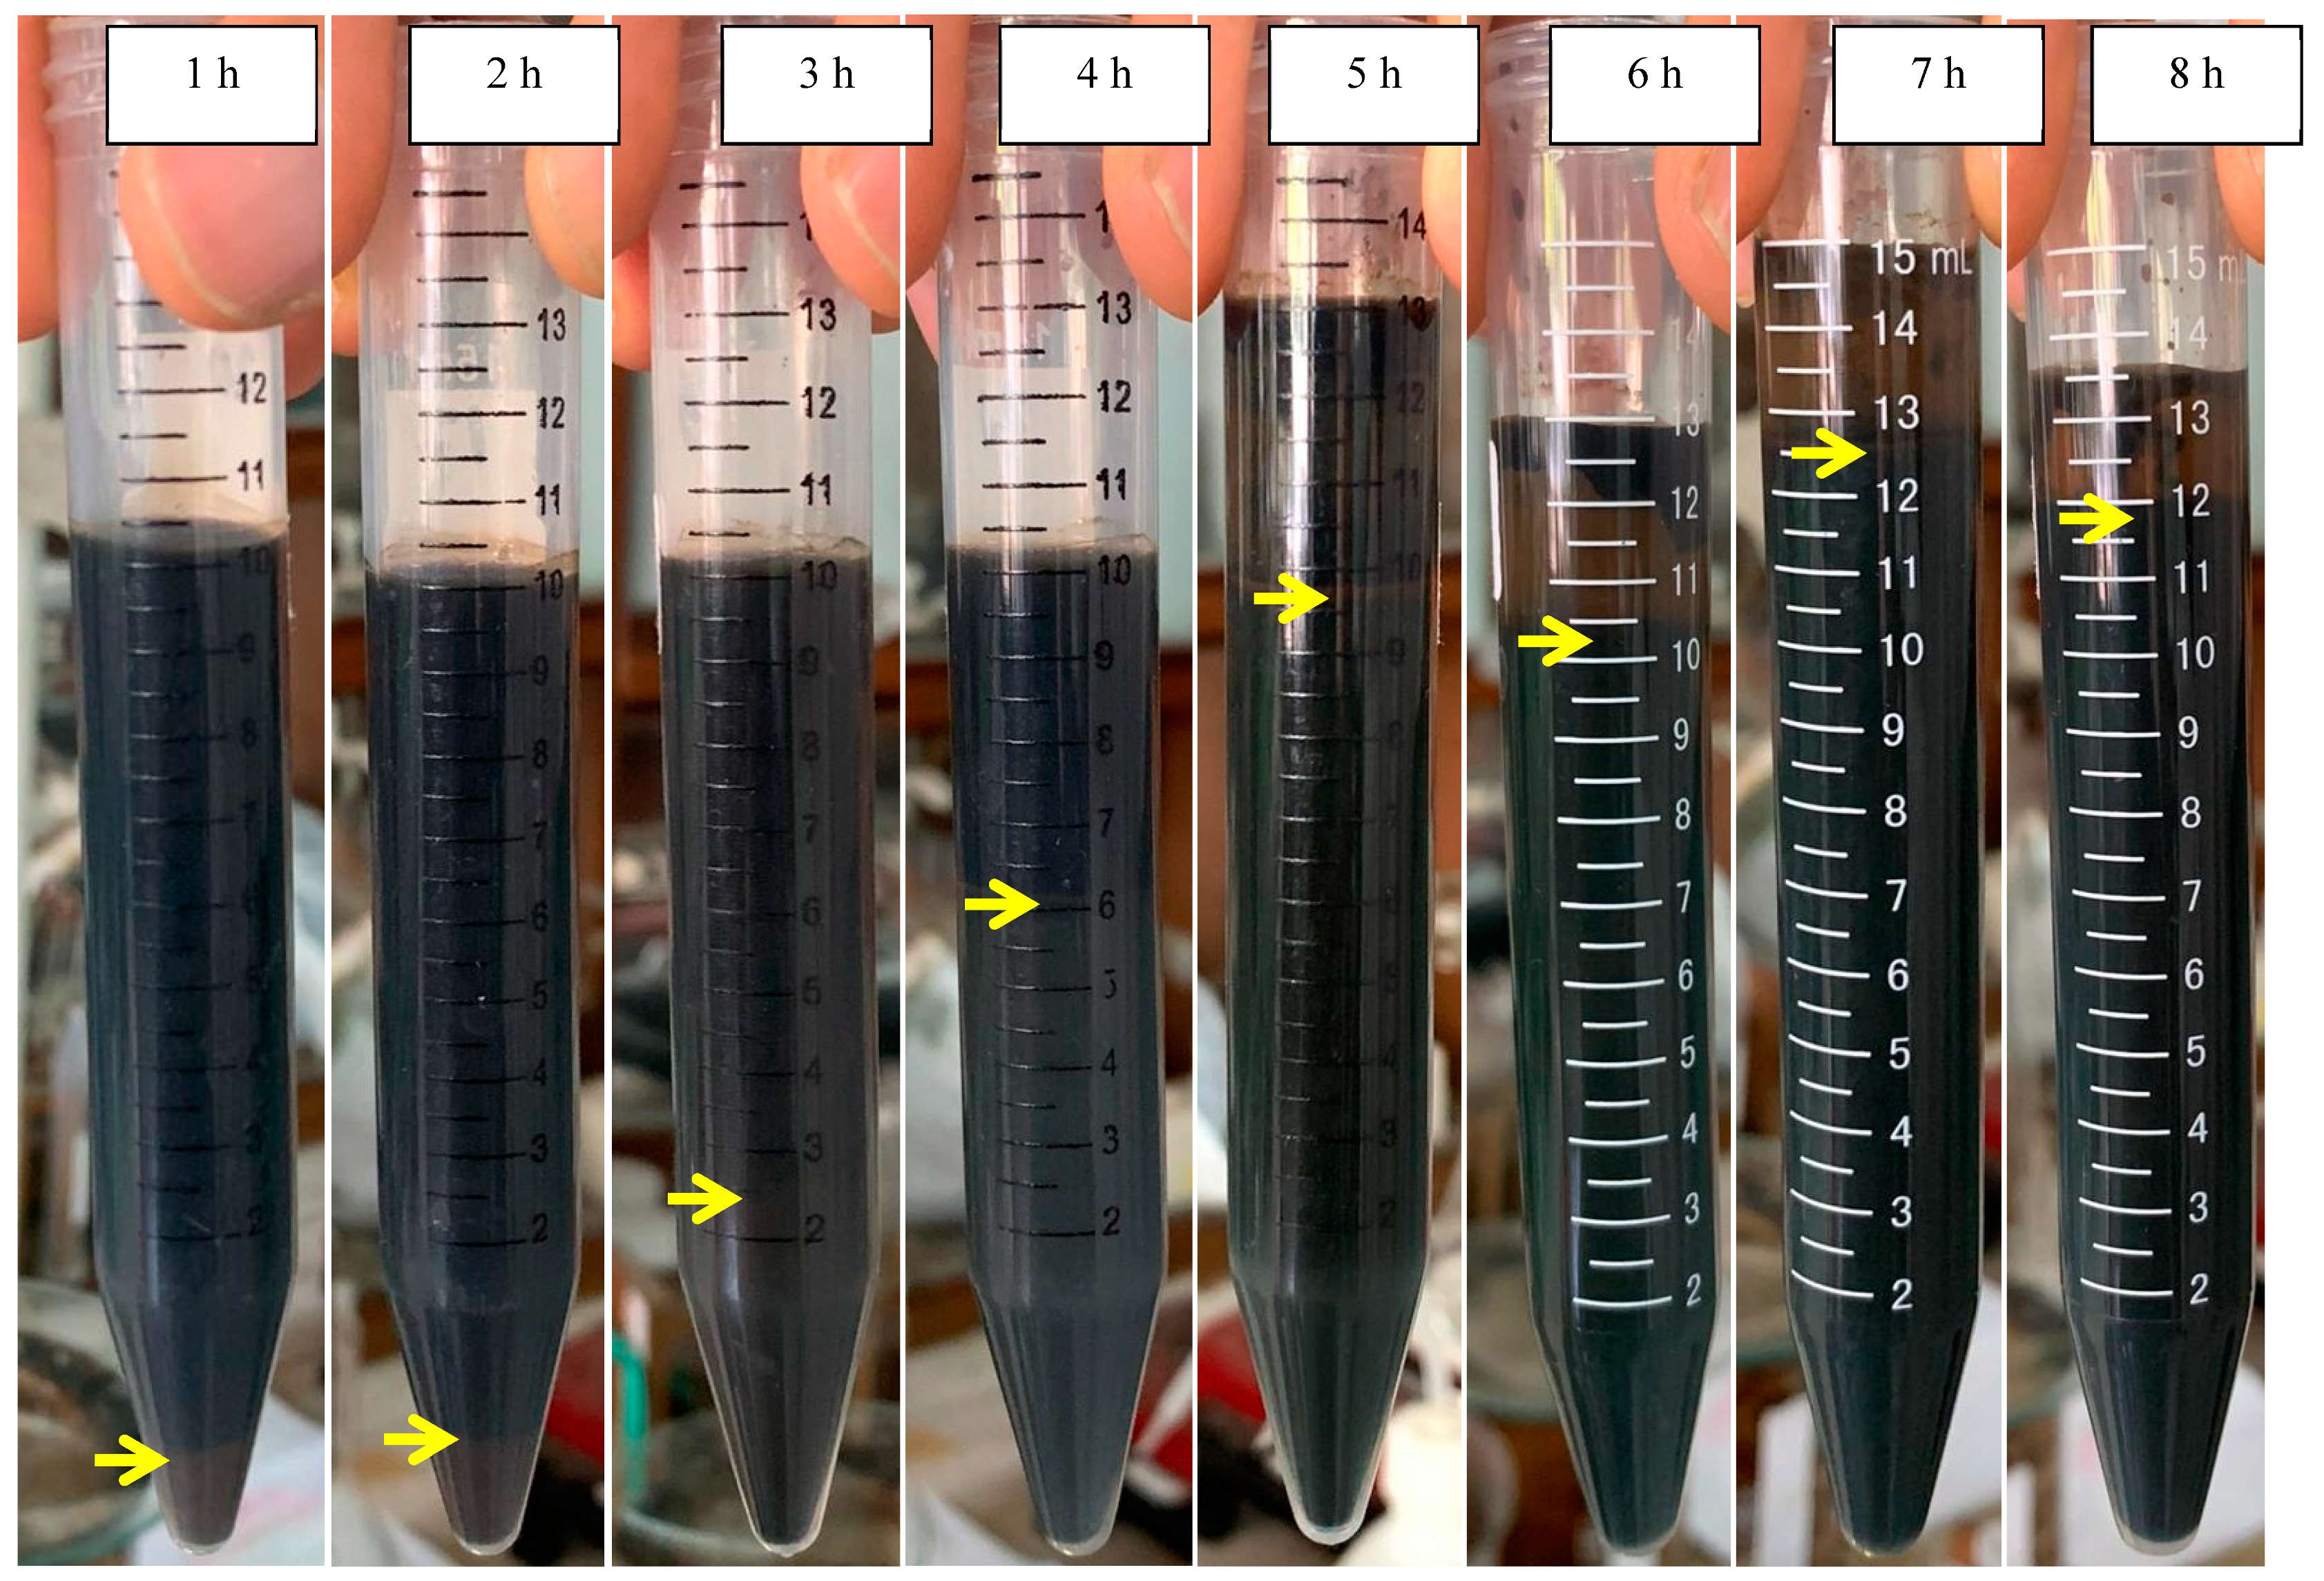
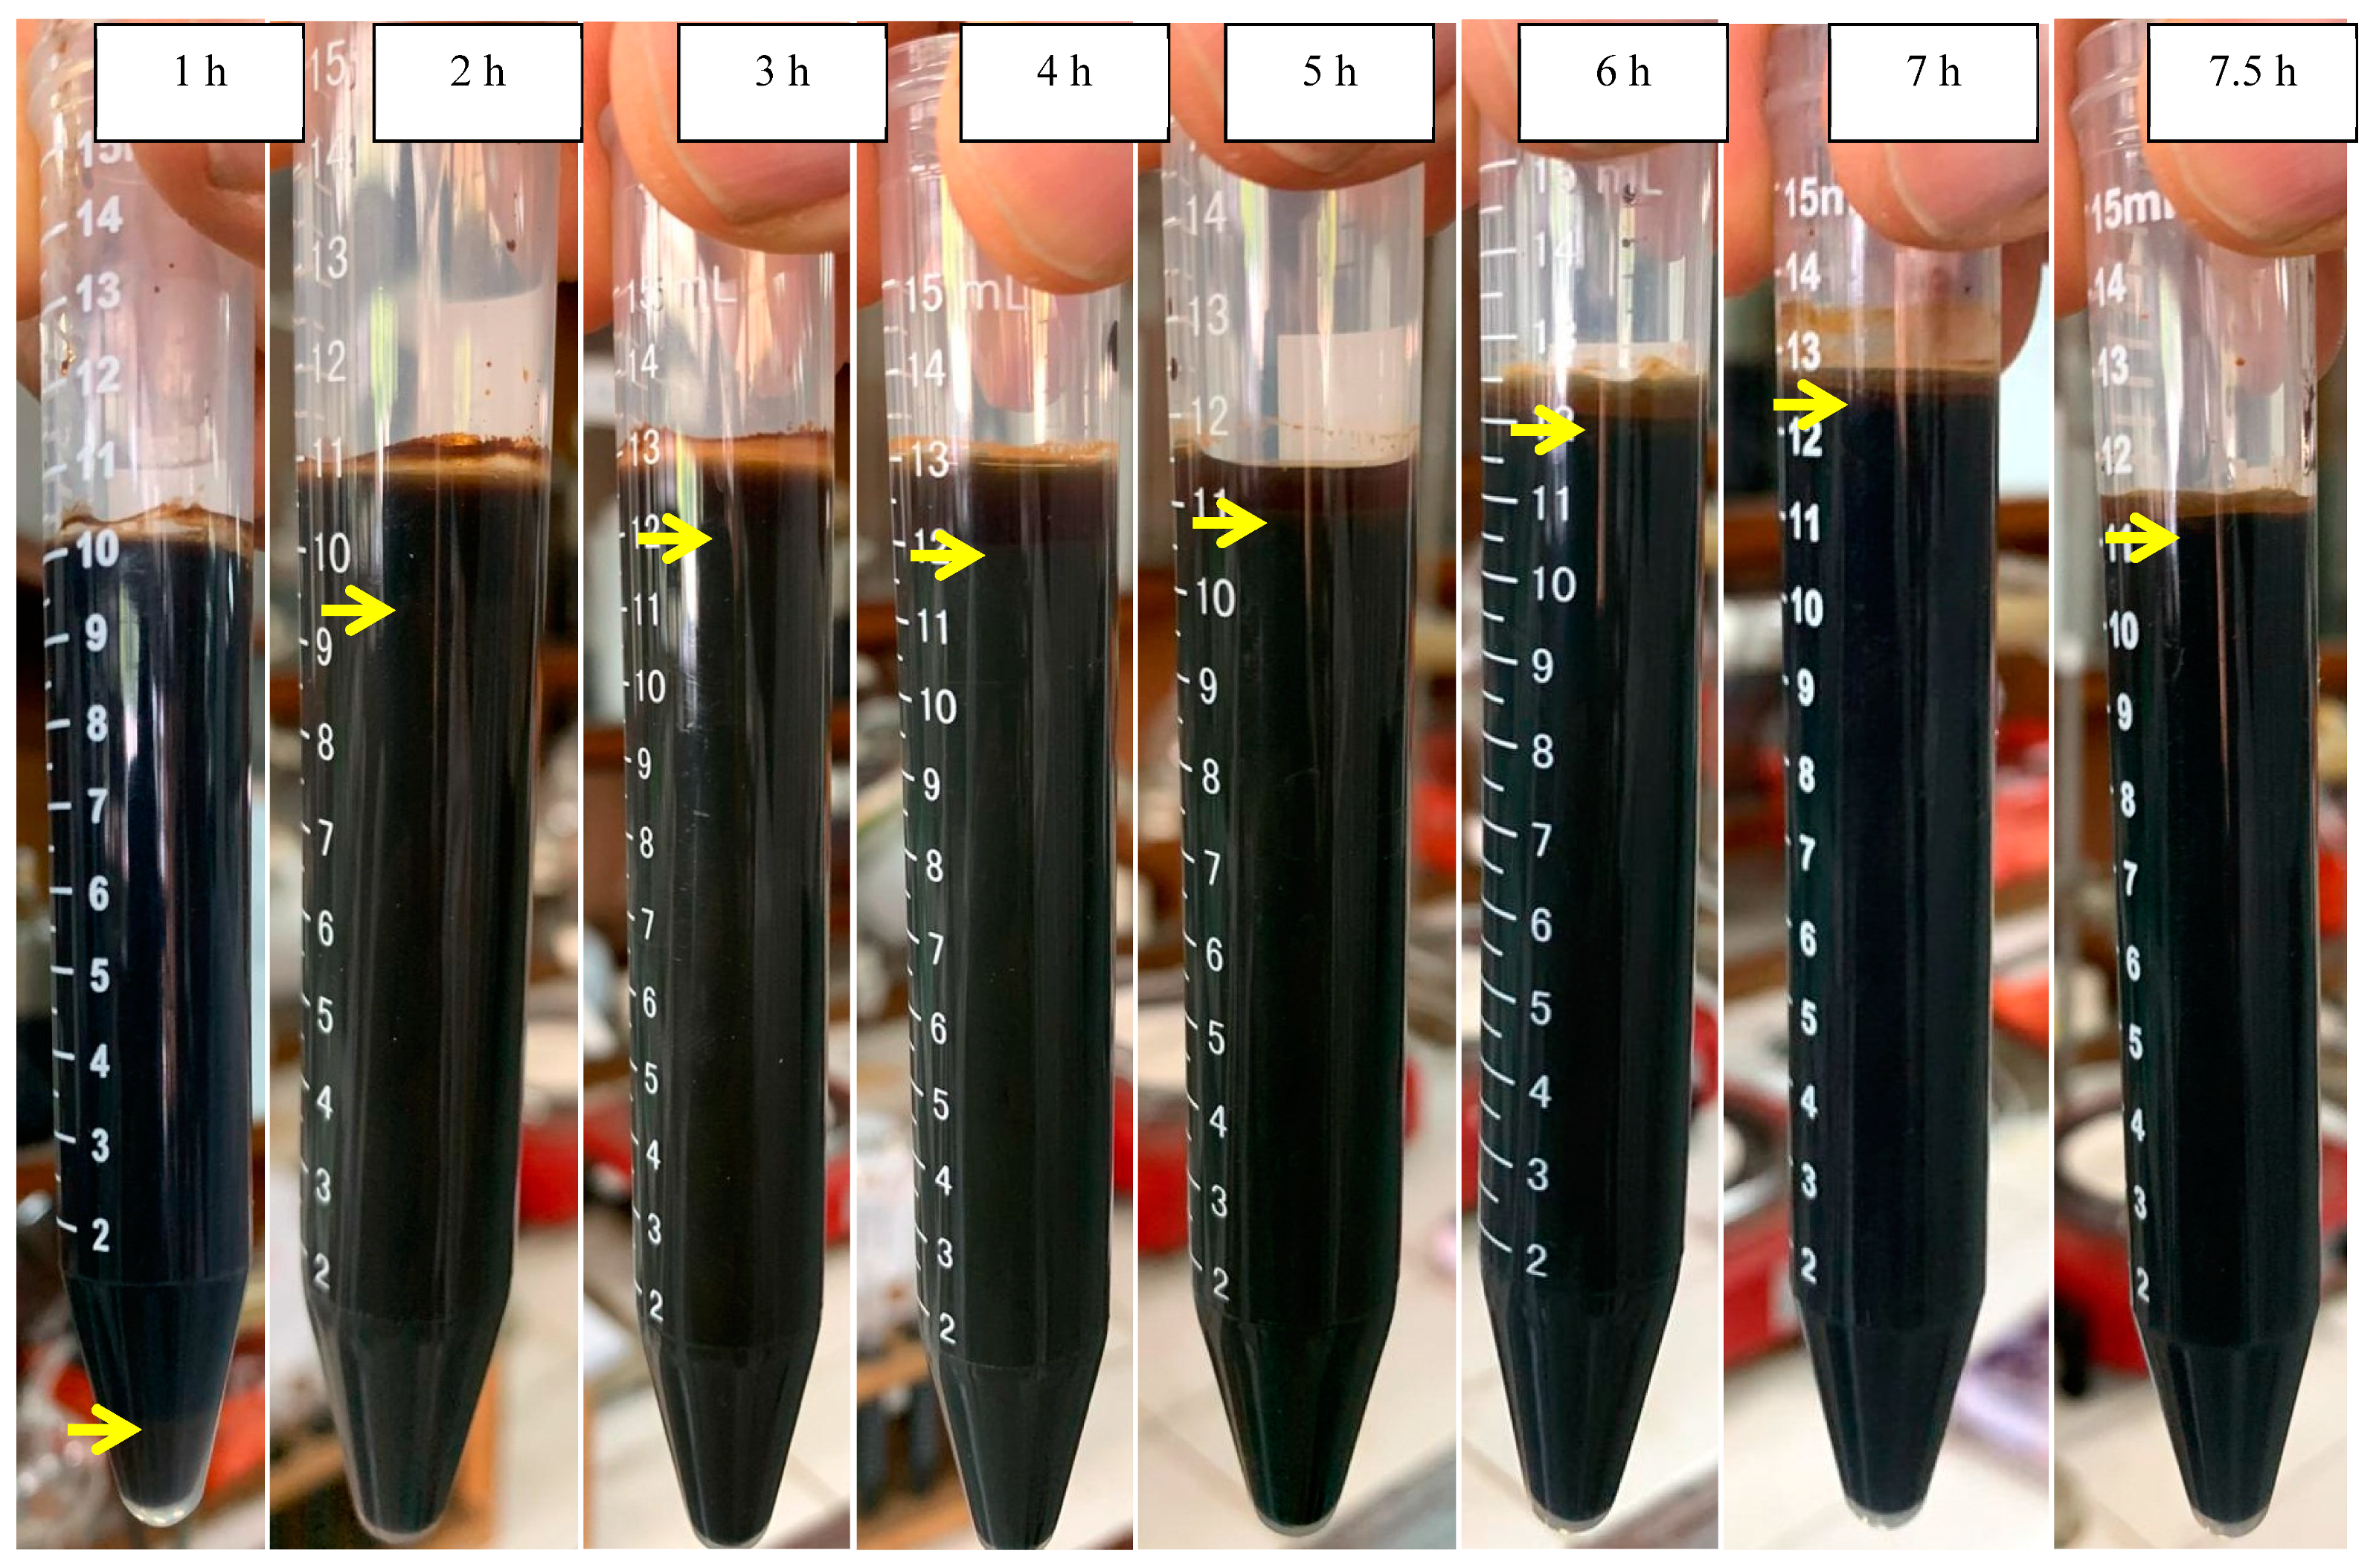
The scum formation during the process is shown in Figure 5B. The formation rate of scum at the initial pH of 7.0 was faster than those at the initial pHs of 4.4 and 5.0. This shows that the aggregate was more easily formed at neutral pH conditions. After settling for 24 h, the sludge formation is shown in Figure 6 and Figure 7. The boundary between the supernatant and the sludge is shown with a yellow arrow (Figure 6 and Figure 7). Based on Figure 6 and Figure 7, the percentage of sludge volume increased until the end of the process (Table 4). Remarkably, at the initial pH of 7.0, above hour 5, the sludge was dominant in samples (no supernatant). Due to this phenomenon (no supernatant above 5 h), the COD data were only obtained at hours 0–5 for the initial pH of 7.0. Furthermore, the mass of sludge is shown in Figure 5C.
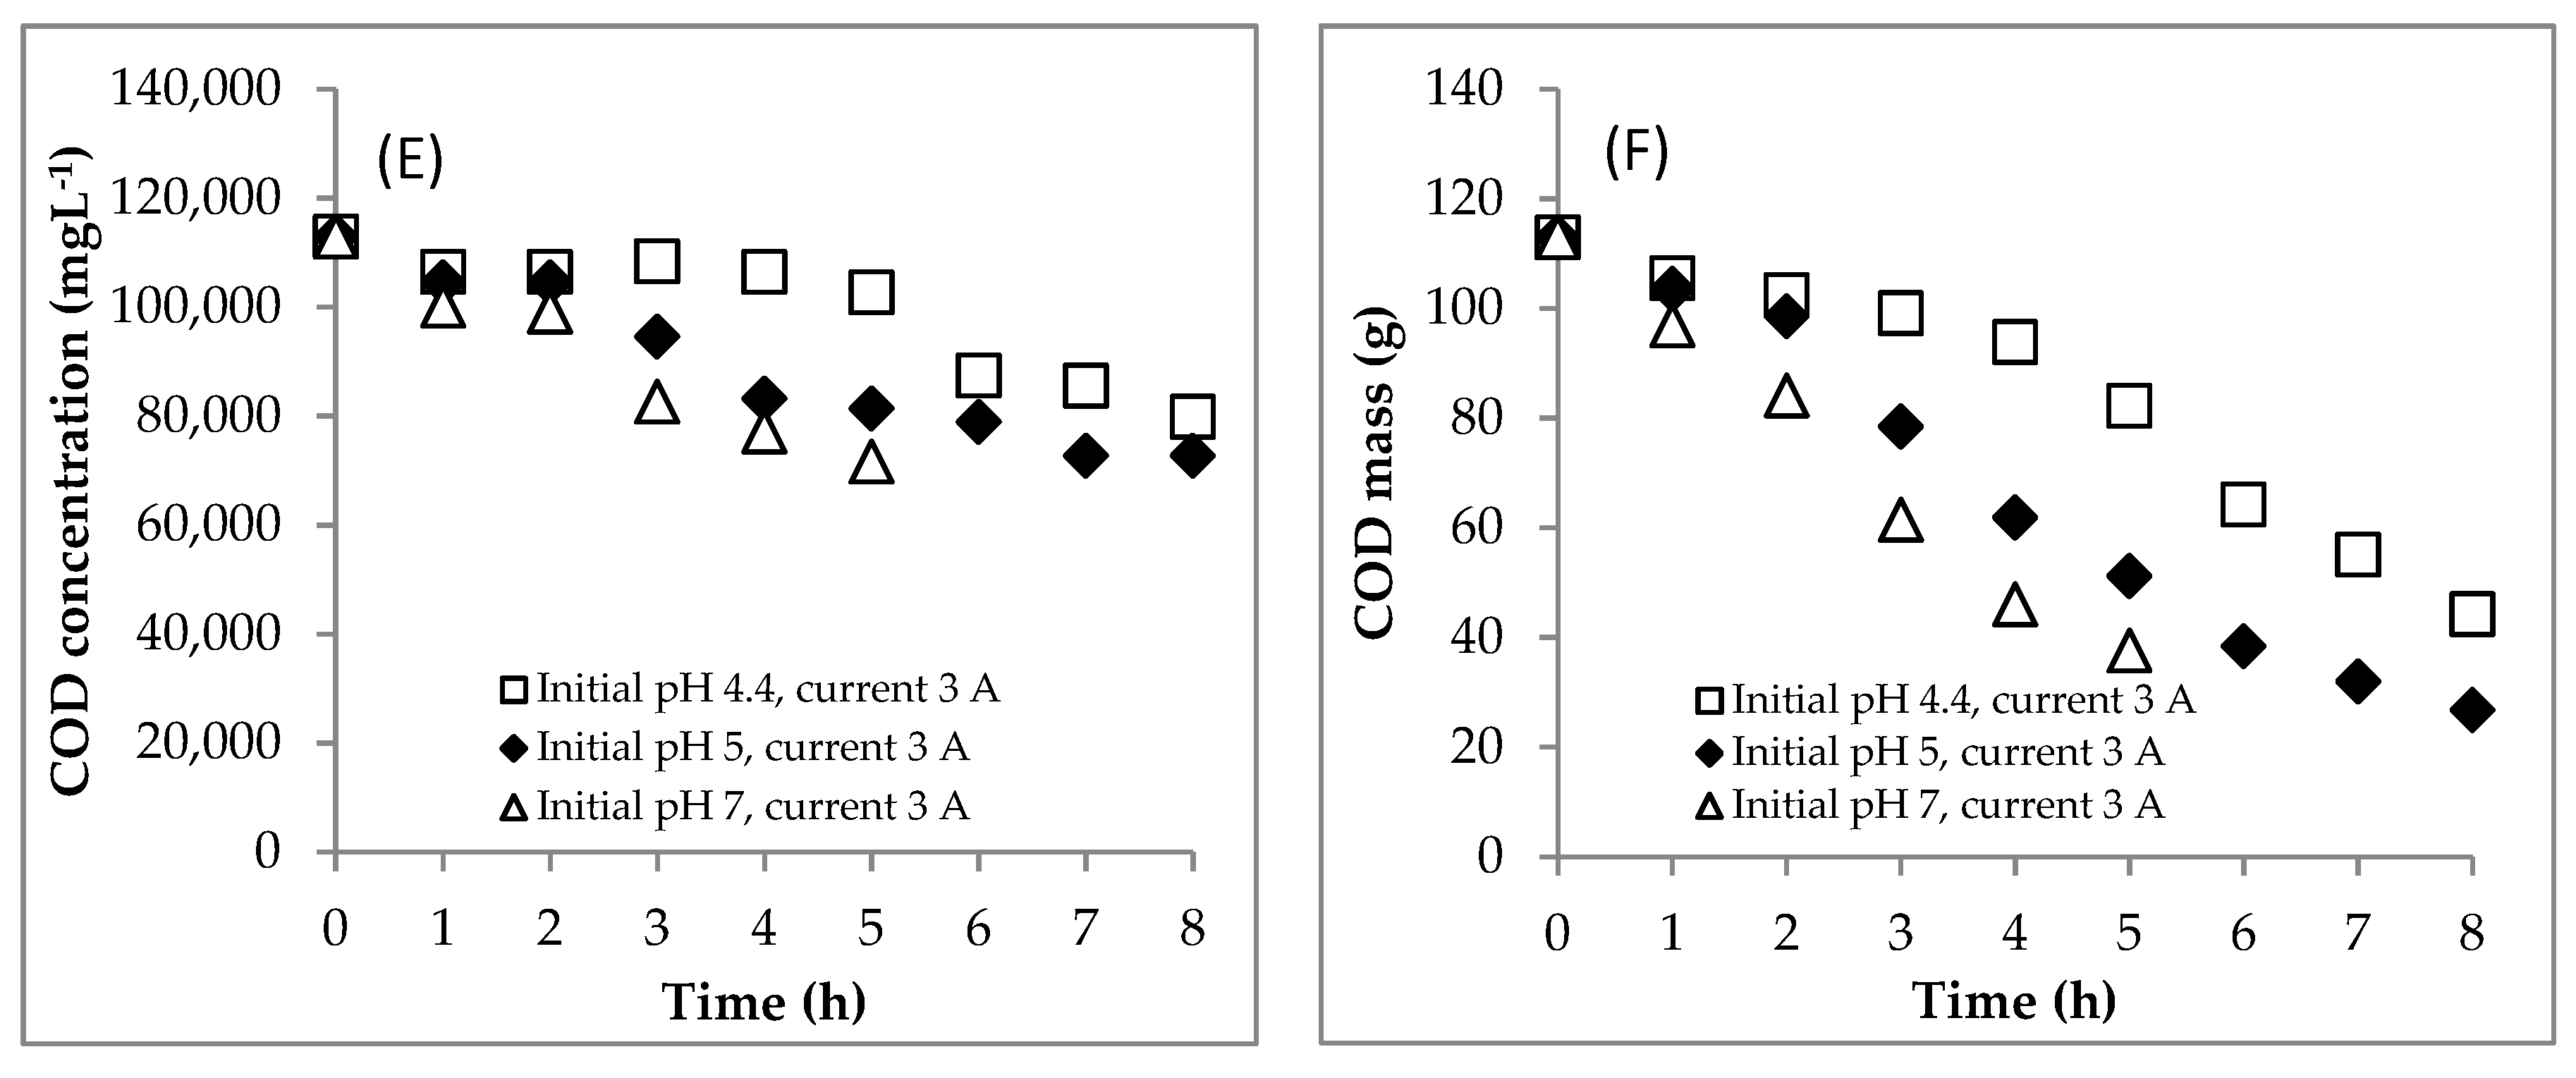
The profile of COD concentration during EC is shown in Figure 4E. Meanwhile, the COD mass profile during EC is presented in Figure 4F. Furthermore, the COD mass removal efficiency is shown in Figure 5A. The COD concentration data for the initial pH of 7.0 are only showed from hours 0 to 5 because the supernatant at hours 6–7.5 was absent (see Figure 7). In detail, the EC reduced the COD concentration from 112.95 to 72.77 gL−1 at the initial pH of 5.0 after 8 h and 71.62 gL−1 at the initial pH of 7.0 after 5 h. The rate of COD removal at the initial pH of 7.0 was faster than that at the initial pH of 5.0 (Figure 5A). At hour 5, the COD removal efficiencies at the initial pHs of 5.0 and 7.0 were 54.6 and 66.7%, respectively. As explained above, the solution pH increased from 5.0 to 8.0 and 7.0 to 9.7 in EC with initial pHs of 5.0 and 7.0, respectively. The Fe(OH)2 precipitate formed at pH > 5.5 [8]. Furthermore, Fe(OH)3 precipitate was dominant in solution at the pH range of 6.2–9.6 [8]. Therefore, the amount of coagulants of (Fe(OH)2 and Fe(OH)3) was more at the initial pH of 7.0 than at the initial pH of 5.0, so that the COD removal efficiency was higher at the initial pH of 7.0.

4.2.2. Modeling

The two mechanistic models were also successfully applied to simulate the data obtained in Section 2. Plotting between measured and predicted data is presented in Figure 8. Meanwhile, the obtained kinetic constants can be seen in Table 5. Based on the SSE and R2 values, the appropriate model for the initial pH of 4.4 was model 1 (route 1), but for the initial pHs of 5.0 and 7.0, model 2 (route 2) gave better predictions than model 1. Meanwhile, in Section 1 (variation of currents), model 1 gave better predictions than model 2 for all currents with a range of 2.5–3.5 A. This phenomenon showed that the route of changes of COD, sludge and scum depended on the initial pH as opposed to the electrical current.
In model 2, the kinetic constant of k a presented the formation rate of sludge from the reduction of COD, while k b presented the formation rate of scum from the reduction of COD too. The higher the initial pH in the EC, the higher the k a and k b values obtained. The higher the pH condition was, the more Fe2+ changed to become coagulants of Fe(OH)2 and Fe(OH)3. Therefore, the initial pH of 7.0 resulted in higher amounts of sludge and scum compared to 4.4 and 5.0.
An interesting phenomenon was that the EC process with the initial pH of 4.4 followed model 1 but the processes with initial pHs of 5.0 and 7.0 followed model 2. At the initial pH of 4.4, the scum formation was very low at hours 0–3. The solution pH at hours 0–3 was below 6.0. Furthermore, from hour 4 (solution pH of 6.6, Figure 4B), the scum was formed in the significant amount (Figure 5B). Meanwhile, the scum formed in the significant amount from hours 2 and 1 for the initial pHs of 5.0 (solution pH of 7.0) and 7.0 (solution pH of 8.1). This means that at a solution pH above 6.0, a large amount of scum was formed. On the other hand, the sludge formation was almost the same at the beginning as it was at the end of the process. The DSW contained the insoluble and soluble COD [20]. Meanwhile, the Fe species in the solution could be Fe2+ ions, precipitates of Fe(OH)2 or Fe(OH)3, which are functions of pH values. Fe(OH)2 is present in solution at pH > 5.5 [13]. Furthermore, Fe(OH)3 is dominant at pH> 6.2 [13]. According to Moreno-Casillas et al. [31], insoluble COD (such as carbohydrate) could react with Fe2+ to form insoluble flocs. On the other side, the soluble COD (such as acetic acid, lactic acid, glycerol) reacting with Fe2+ will result in the soluble compound staying in the solution. Therefore, the insoluble COD could be removed at various pH conditions. At a low solution pH (below 5.5), the removal of the insoluble COD followed Equation (20), while at pHs above 5.5, it was adsorbed by coagulants following Equation (22). Meanwhile, the soluble COD could only be removed at a pH above 5.5 and its reaction was predicted through Equation (23). Furthermore, at a pH below 5.5, the reaction between Fe2+ and soluble COD just resulted insoluble compounds. The characteristic of the insoluble flocs from coagulants and Fe2+ ions might be different. The coagulants are gelatinous. Therefore, the flocs formed by coagulants were more easily brought, by H2 gas, to the liquid surface as scum compared to those formed by Fe2+ ions. Based on the explanation above, the pollutant removal in EC with a neutral initial pH will follow route 2 (model 2). In conclusion, based on Table 3 and Table 5, except for the case of initial pH of 7.0 with model 2, all other R2 values were lower than 0.98. This shows that there was a considerable deviation in the other cases.
F e 2 + + i n s o l u b l e   C O D i n s o l u b l e   f l o c s
F e 2 + + s o l u b l e   C O D s o l u b l e   c o m p o u n d
C o a g u l a n t s   F e O H 2   o r   F e O H 2   +   i n s o l u b l e   C O D i n s o l u b l e   f l o c s
C o a g u l a n t s   F e O H 2   o r   F e O H 2   +   s o l u b l e   C O D i n s o l u b l e   f l o c s

4.3. Summary of the EC for Treating the DSW

Some other authors [2,9,10,14,32,33] have reported the effects of various conditions on EC in treating DSW. A summary of a report of the studies about EC of DSW is shown in Table 6. Charge loading is an important parameter in the EC process. It shows the charges transferred in electrochemical reactions for a given amount of wastewater treated [14]. Based on a previous study [14], it could be estimated using Equation (24). Furthermore, the ratio of COD removal efficiency to charge loading is calculated using Equation (25).
q = I t v i n i t i a l C C O D   i n i t i a l = J A e t v i n i t i a l C C O D   i n i t i a l
R a t i o   C O D   r e m o v a l   p e r   c h a r g e   l o a d i n g = C O D   r e m o v a l   % C h a r g e   l o a d i n g   C   g C O D 1
Table 6 shows the summary of experimental data from the EC of DSW from various previous studies [2,9,10,14,32,33] and this study. The correlation between the initial pH and ratio of COD removal per charge loading is depicted in Figure 9. The figure presented that the increase in initial pH from 2.0 to 6.0 could increase the ratio of COD removal per charge loading from 0.0190 to 0.3606% per C gCOD−1. Furthermore, a further increase in the initial pH from 6.0 to 10 could reduce the ratio of COD removal per charge loading from 0.3606 to 0.0699% per C gCOD−1.The coagulants (Fe(OH)2 and Fe(OH)3) are formed in the neutral pH condition [13]. At very low pH conditions, the Fe2+ ions are still dominant in the solution [13], so the EC process can just remove the insoluble COD [31]. Meanwhile, in very high pH conditions, Fe(OH)2 and Fe(OH)3 are hydrolyzed to become Fe(OH)3 and Fe(OH)4 [13]. They have poor coagulant properties. However, at the neutral pH, the coagulants present dominantly in the solution, so that the COD could be removed maximally.

5. Conclusions

The EC method to treat the local DSW with a high COD content was successfully conducted in this study. The results showed that the EC at the current of 3.5 A resulted in a higher COD mass removal efficiency (74.9%) than the currents of 2.5 (35.4%) and 3 A (60.9%). Furthermore, the EC with an initial pH of 7 could remove more COD mass than the ECs with initial pHs of 4.4 and 5.0. For all variables, the solution pH increased during the process because of the accumulation of OH ions resulting from the water reduction process at the cathode. Additionally, the solution temperature increased throughout the process because of supplying the electrical current continuously in the solution. During the EC process, the working volume was not constant since it was reduced because of the water reduction process at the cathode and the evaporation and flotation reactions. The scum was produced during the EC process and its mass increased until end of the process. When an initial pH of 7.0 was used, for the times higher than 5 h, the supernatant was not observed—only the sludge was obtained. As a consequence, the COD data obtained for the initial pH of 7.0 are only for hours 0–5. The EC could decrease the COD concentration from 112.95 to 72.77 (hour 8) and 71.62 gL−1 (hour 5) at the initial pHs of 5.0 and 7.0, respectively. Then, the measured data (COD, sludge and scum) were used in the modeling. The simple mechanistic models were successfully applied to simulate the data in mass units with the two different routes of the EC process. Route 1 assumed that the COD was converted to sludge and then the sludge was converted to scum. Route 2 assumed that the COD was converted to sludge and scum at the same time. Based on the SSE and R2 values, the EC at the initial pH of the origin DSW (4.4) followed model 1 (based on route 1) but, at the initial pHs of 5.0 and 7.0, followed model 2 (based on route 2). The kinetic constants in the models were k a and k b . k a expressed the rate of sludge production and k b expressed the rate of scum production. Increasing the current from 2.5 to 3.5 A increased the kinetic constants of k a and k b . Additionally, the higher the initial pH was, the higher the kinetic constants are.

Author Contributions

Conceptualization, I.S. and S.S.; methodology, I.S., S.S. and W.B.S.; software, I.S., W.B.S. and M.H.; formal analysis, I.S.; investigation, I.S.; resources, I.S. and S.S.; data curation, I.S. and S.S.; writing—original draft, I.S.; visualization, I.S.; funding acquisition, I.S. and S.S.; writing—review and editing, S.S., W.B.S. and M.H.; supervision, S.S., W.B.S. and M.H.; project administration, S.S.; validation, W.B.S. and M.H.All authors have read and agreed to the published version of the manuscript.

Funding

This research was funded by Lembaga Pengelola Dana Pendidikan (LPDP), Kementerian Keuangan and Republik Indonesia via Beasiswa Unggulan Dosen Indonesia-Dalam Negeri (BUDI-DN) (letter of statement—Nomor: KET-241/LPDP.3/2018).

Conflicts of Interest

The authors declare no conflict of interest.

Nomenclatures

m C O D = mass of COD (g)
m s c u m = mass of scum (g)
m s l u d g e = mass of sludge (g)
k a = the kinetic constant for sludge formation (h−1)
k b = the kinetic constant for scum formation (h−1)
y i = measured data (g)
y ^ i = predicted data (g)
y ¯ = average of measured data (g)
SSE= Sum of Squared Error
R 2 = the coefficient of determination of the model
I = current (A)
t = electrolysis time (s)
A e = active surface of electrode (cm2)
J = current density (A cm−2)
q = charge loading (C g-COD−1)
d = inter-electrode distance (cm)

References

  1. Yavuz, Y. EC and EF processes for the treatment of alcohol distillery wastewater. Sep. Purif. Technol. 2007, 53, 135–140. [Google Scholar] [CrossRef]
  2. Khandegar, V.; Saroha, A.K. Electrocoagulation of distillery spentwash for complete organic reduction. Int. J. Chem. Tech. Res. 2013, 5, 712–718. [Google Scholar]
  3. Asaithambi, P.; Sajjadi, B.; Aziz, A.; Raman, A.; Daud, W.; Bin, W.M.A. Performance evaluation of hybrid electrocoagulation process parameters for the treatment of distillery industrial effluent. Process Saf. Environ. Prot. 2016, 104, 406–412. [Google Scholar] [CrossRef]
  4. Reis, C.E.R.; Hu, B. Vinasse from Sugarcane Ethanol Production: Better Treatment or Better Utilization? Front. Energy Res. 2017, 5. [Google Scholar] [CrossRef] [Green Version]
  5. Prajapati, A.K.; Chaudhari, P.K. Physicochemical Treatment of Distillery Wastewater—A Review. Chem. Eng. Commun. 2015, 202, 1098–1117. [Google Scholar] [CrossRef]
  6. Budiyono; Syaichurrozi, I.; Sumardiono, S. Effect of total solid content to biogas production rate from vinasse. Int. J. Eng. Trans. B Appl. 2014, 27, 177–184. [Google Scholar]
  7. Kharayat, Y. Distillery wastewater: Bioremediation approaches. J. Integr. Environ. Sci. 2012, 9, 69–91. [Google Scholar] [CrossRef]
  8. Syaichurrozi, I.; Sarto, S.; Sediawan, W.B.; Hidayat, M. Mechanistic model of electrocoagulation process for treating vinasse waste: Effect of initial pH. J. Environ. Chem. Eng. 2020, 8, 103756. [Google Scholar] [CrossRef]
  9. Asaithambi, P.; Susree, M.; Saravanathamizhan, R.; Matheswaran, M. Ozone assisted electrocoagulation for the treatment of distillery effluent. Desalination. 2012, 297, 1–7. [Google Scholar] [CrossRef]
  10. Aziz, A.R.A.; Asaithambi, P.; Daud, W.M.A.B.W. Combination of electrocoagulation with advanced oxidation processes for the treatment of distillery industrial effluent. Process Saf. Environ. Prot. 2016, 99, 227–235. [Google Scholar] [CrossRef]
  11. Sharma, P.; Joshi, H. Utilization of electrocoagulation-treated spent wash sludge in making building blocks. Int. J. Environ. Sci. Technol. 2016, 13, 349–358. [Google Scholar] [CrossRef] [Green Version]
  12. Hashim, K.S.; AlKhaddar, R.; Shaw, A.; Kot, P.; Al-Jumeily, D.; Alwash, R.; Aljefery, M.H. Electrocoagulation as an eco-friendly river water treatment method. In Advances in Water Resources Engineering and Management; Springer: Singapore, 2020; pp. 219–235. [Google Scholar]
  13. Garcia-Segura, S.; Eiband, M.M.S.G.; de Melo, J.V.; Martínez-Huitle, C.A. Electrocoagulation and advanced electrocoagulation processes: A general review about the fundamentals, emerging applications and its association with other technologies. J. Electroanal. Chem. 2017, 801, 267–299. [Google Scholar] [CrossRef] [Green Version]
  14. Syaichurrozi, I.; Sarto, S.; Sediawan, W.B.; Hidayat, M. Mechanistic models of electrocoagulation kinetics of pollutant removal in vinasse waste: Effect of voltage. J. Water Process Eng. 2020, 36, 101312. [Google Scholar] [CrossRef]
  15. Darmadi, D.; Lubis, M.R.; Hizir, H.; Chairunnisak, A.; Arifin, B. Comparison of Palm Oil Mill Effluent Electrocoagulation by Using Fe-Fe and Al-Al Electrodes: Box-Behnken Design. ASEAN J. Chem. Eng. 2018, 18, 30–43. [Google Scholar]
  16. Largitte, L.; Pasquier, R. A review of the kinetics adsorption models and their application to the adsorption of lead by an activated carbon. Chem. Eng. Res. Des. 2016, 109, 495–504. [Google Scholar] [CrossRef]
  17. Ouaissa, Y.A.; Chabani, M.; Amrane, A.; Bensmaili, A. Removal of tetracycline by electrocoagulation: Kinetic and isotherm modeling through adsorption. J. Environ. Chem. Eng. 2014, 2, 177–184. [Google Scholar] [CrossRef] [Green Version]
  18. Mamelkina, M.A.; Vasilyev, F.; Tuunila, R.; Sillanpaa, M.; Hakkinen, A. Investigation of the parameters affecting the treatment of mining waters by electrocoagulation. J. Water Process. Eng. 2019, 32, 100929. [Google Scholar] [CrossRef]
  19. Sumardiono, S.; Syaichurrozi, I.; Budiyono; Sasongko, S.B. The Effect of COD/N Ratios and pH Control to Biogas Production from Vinasse. Int. J. Biochem. Res. Rev. 2013, 3, 401–413. [Google Scholar] [CrossRef]
  20. Naspolini, B.F.; Machado, A.C.D.O.; Junior, W.B.C.; Freire, D.M.G.; Cammarota, M.C. Bioconversion of Sugarcane Vinasse into High-Added Value Products and Energy. BioMed Res. Int. 2017, 2017. [Google Scholar] [CrossRef]
  21. García-García, I.; Bonilla-Venceslada, J.L.; Jimenez-Pena, P.R.; Ramos-Gomez, E. Biodegradation of phenol compounds in vinasse using aspergillus terreus and geotrichum candidum. War. Res. 1997, 31, 2005–2011. [Google Scholar] [CrossRef]
  22. Syaichurrozi, I. Review—Biogas Technology to Treat Bioethanol Vinasse. Waste Technol. 2016, 4, 16–23. [Google Scholar] [CrossRef] [Green Version]
  23. David, C.; Arivazhagan, M.; Tuvakara, F. Decolorization of distillery spent wash effluent byelectrooxidation (EC and EF) and Fenton processes: A comparative study. Ecotoxicol. Environ. Saf. 2015, 121, 142–148. [Google Scholar] [CrossRef] [PubMed]
  24. Secula, M.S.; Creţescu, I.; Petrescu, S. An experimental study of indigo carmine removal from aqueous solution by electrocoagulation. Desalination. 2011, 277, 227–235. [Google Scholar] [CrossRef]
  25. Elazzouzi, M.; Haboubi, K.; Elyoubi, M.S. Electrocoagulation flocculation as a low-costprocess for pollutants removal from urbanwastewater. Chem. Eng. Res. Des. 2017, 117, 614–626. [Google Scholar] [CrossRef]
  26. Kobya, M.; Can, O.T.; Bayramoglu, M. Treatment of textile wastewaters by electrocoagulation using iron and aluminum electrodes. J. Hazard. Mat. 2003, B100, 163–178. [Google Scholar] [CrossRef]
  27. Kim, K.-J.; Baek, K.; Ji, S.; Cheong, Y.; Yim, G.; Jang, A. Study on electrocoagulation parameters (current density, pH, and electrode distance) for removal of fluoride from groundwater. Environ. Earth Sci. 2016, 75, 45. [Google Scholar] [CrossRef]
  28. Giwa, S.O.; Polat, K.; Hapoglu, H. The Effects of Operating Parameters on Temperature and Electrode Dissolution in Electrocoagulation Treatment of Petrochemical Wastewater. Int. J. Eng. Res. Technol. 2012, 1, 1–9. [Google Scholar]
  29. Brahmi, K.; Bouguerra, W.; Hamrouni, B.; Elaloui, E.; Loungou, M.; Tlili, Z. Investigation of electrocoagulation reactor design parameters effect on the removal of cadmium from synthetic and phosphate industrial wastewater. Arab. J. Chem. 2019, 12, 1848–1859. [Google Scholar]
  30. Rezaei, H.; Narooie, M.R.; Khosravi, R.; Mohammadi, M.J.; Sharafi, H.; Biglari, H. Humic Acid Removal by Electrocoagulation Process from Natural Aqueous Environments. Int. J. Electrochem. Sci. 2018, 13, 2379–2389. [Google Scholar] [CrossRef]
  31. Moreno-Casillas, H.A.; Cocke, D.L.; Gomes, J.A.G.; Morkovsky, P.; Parga, J.R.; Peterson, E. Electrocoagulation mechanism for COD removal. Sep. Purif. Technol. 2007, 56, 204–211. [Google Scholar] [CrossRef]
  32. Khandegar, V.; Saroha, A.K. Electrochemical treatment of distillery spent wash using aluminum and iron electrodes. Chi. J. Chem. Eng. 2012, 20, 439–443. [Google Scholar] [CrossRef]
  33. Khandegar, V.; Saroh, A.K. Treatment of distillery spentwash by electrocoagulation. J. Clean Energy Technol. 2014, 2, 244–247. [Google Scholar] [CrossRef]
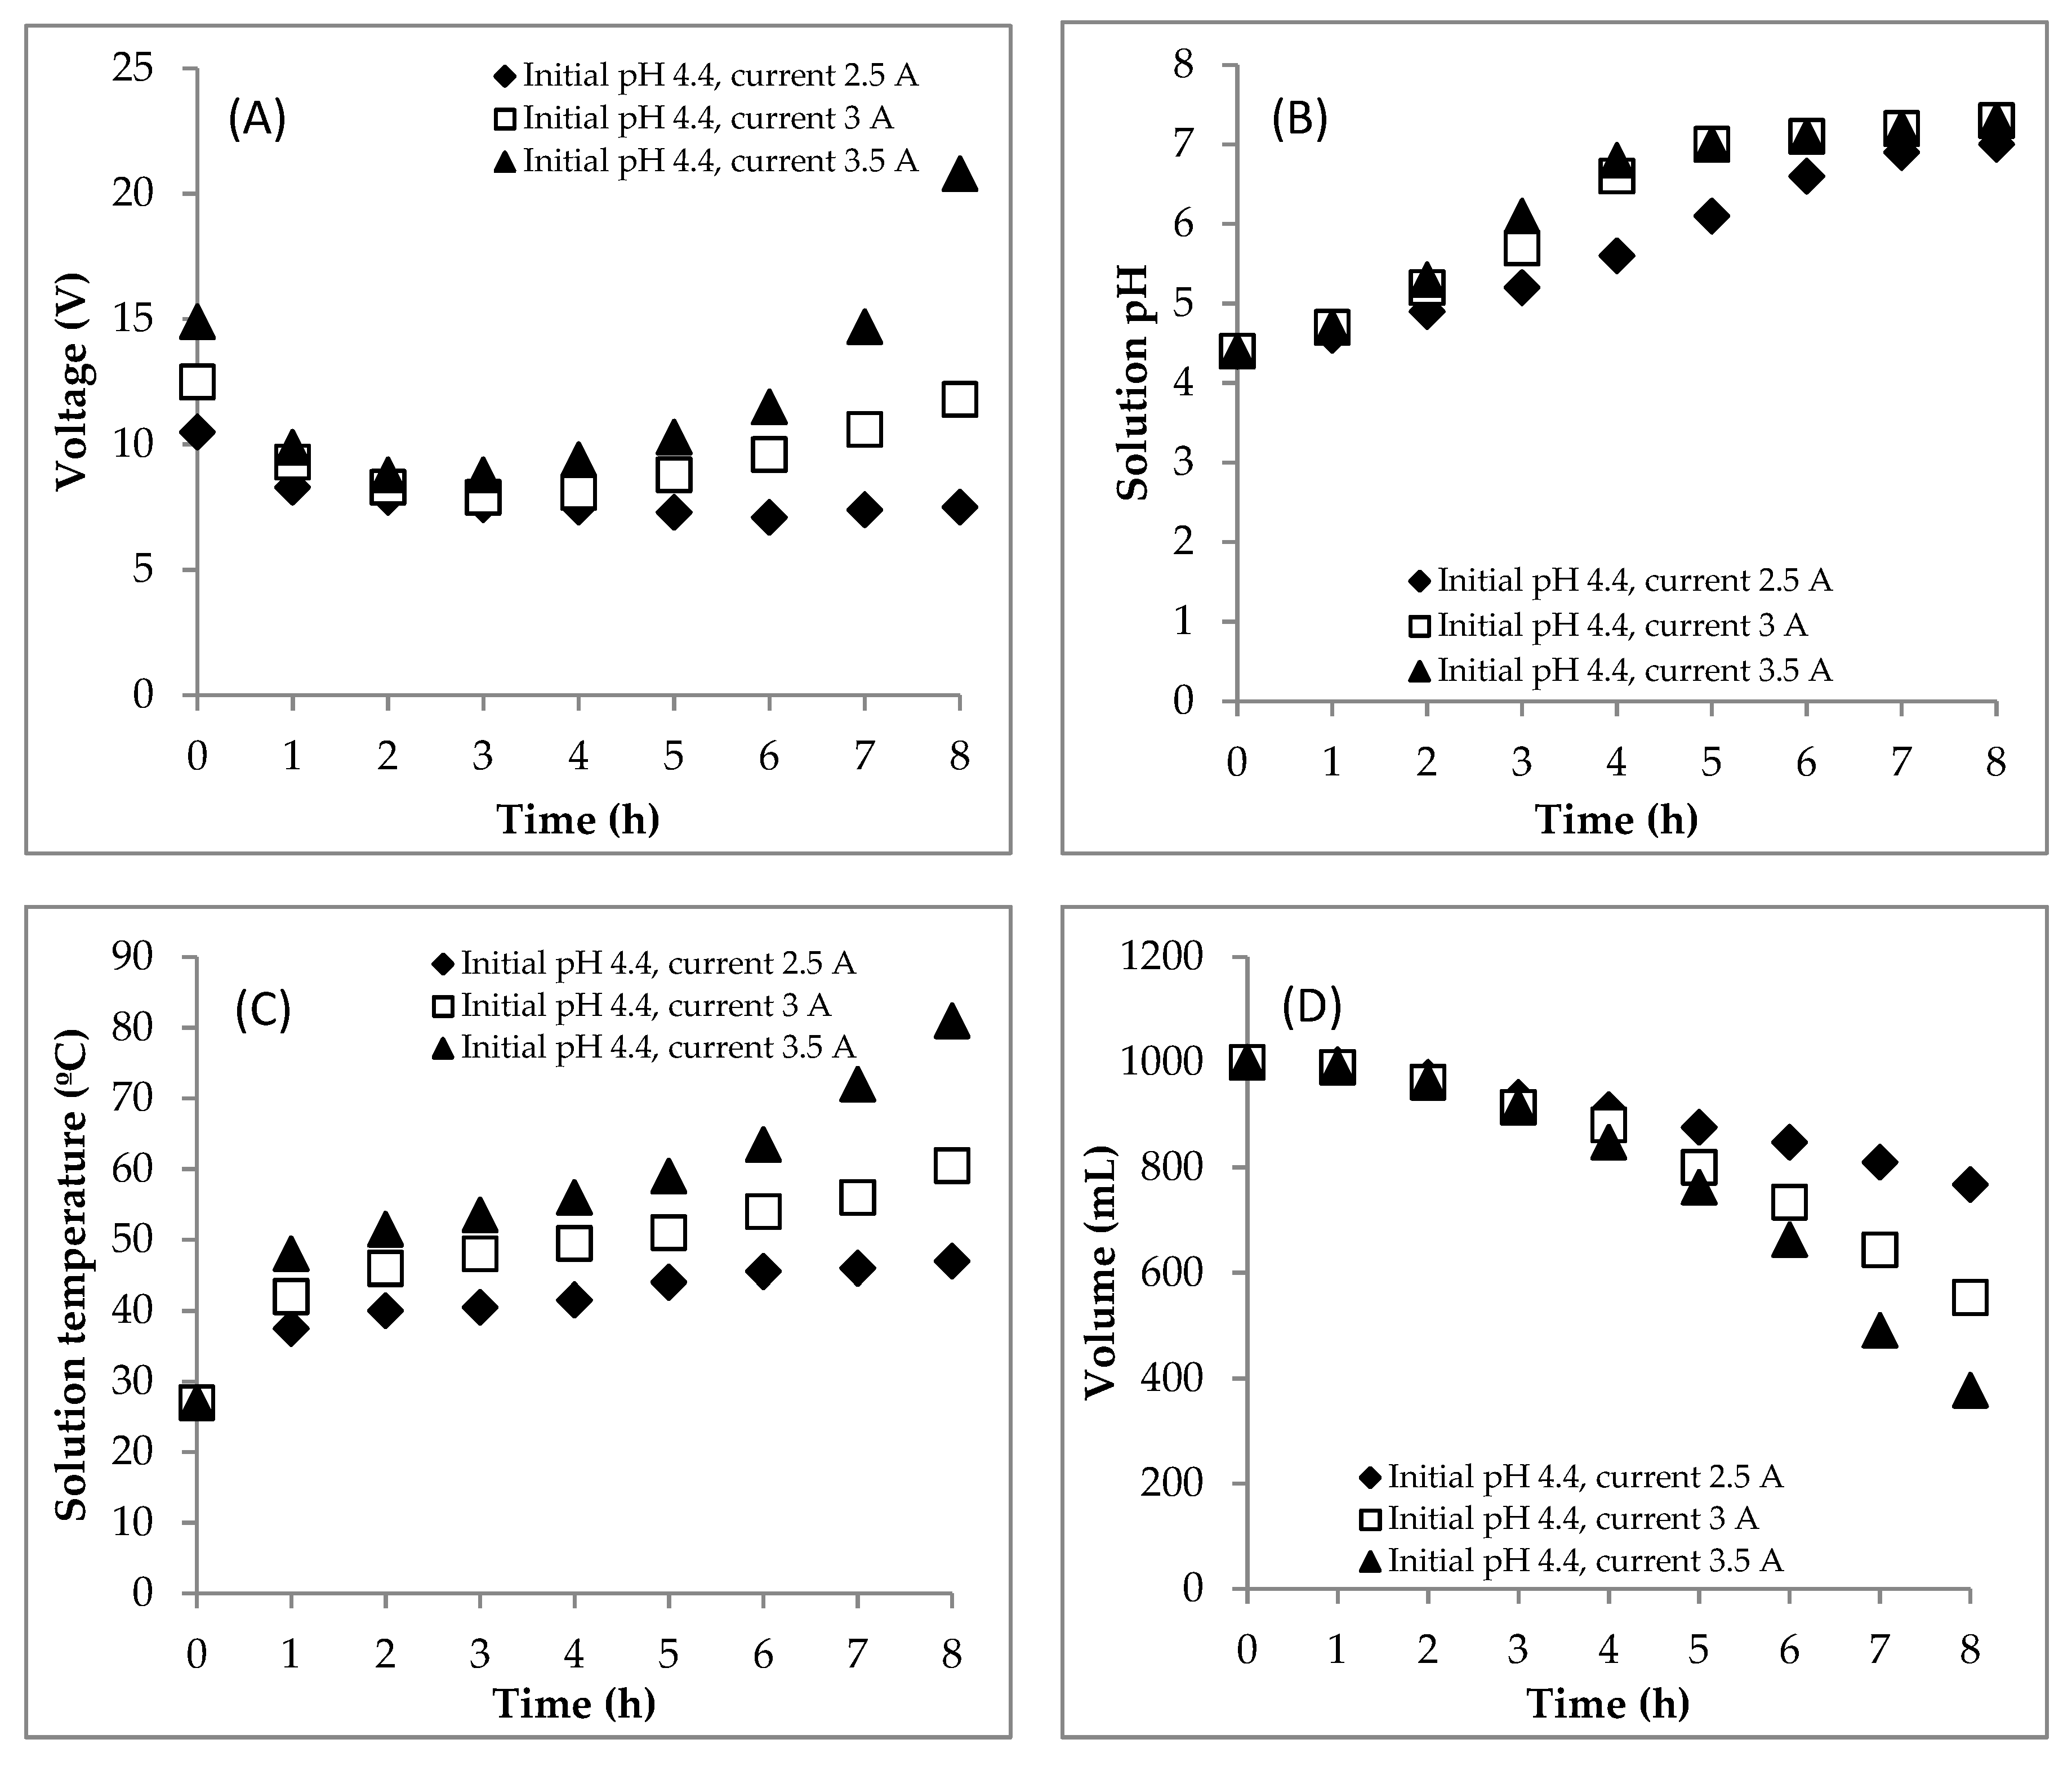
Figure 1. Effect of the current on changes of (A) voltage, (B) pH, (C) temperature, (D) volume, (E) chemical oxygen demand (COD) concentration and (F) COD mass during the electrocoagulation (EC) process. Initial COD of 112,948.5 mgL−1; initial pH of 4.4; initial temperature of 27 °C.
Water 13 00011 g001aWater 13 00011 g001b
Figure 2. Effect of the current on (A) COD removal, (B) scum production and (C) sludge production during the EC process. Initial COD of 112,948.5 mgL−1; initial pH of 4.4; initial temperature of 27 °C.
Water 13 00011 g002aWater 13 00011 g002b
Figure 3. Comparison between experimental data and predicted data obtained by the mechanistic models: (A) COD, (B) sludge and (C) scum. (◊, 2.5 A experimental data; □, 3 A experimental data; ∆, 3.5 A experimental data), (black line-square dot, 2.5 A model 1; black line-solid, 3 A model 1; black line-long dash, 3.5 A model 1) and (red line-square dot, 2.5 A model 2; red line-solid, 3 A model 2; red line-long dash, 3.5 A model 2).
Water 13 00011 g003
Figure 4. Effect of the initial pH on changes of (A) voltage, (B) pH, (C) temperature, (D) volume, (E) COD concentration and (F) COD mass during the EC process. Initial COD of 112,948.5 mgL−1; constant current of 3 A; initial temperature of 26–30 °C.
Water 13 00011 g004aWater 13 00011 g004b
Figure 5. Effect of the initial pH on (A) COD removal, (B) scum production and (C) sludge production during the EC process. Initial COD of 112,948.5 mgL−1; constant current of 3 A; initial temperature of 26–30 °C.
Water 13 00011 g005aWater 13 00011 g005b
Figure 6. Settling at the initial pH of 5.
Water 13 00011 g006
Figure 7. Settling at the initial pH of 7.
Water 13 00011 g007
Figure 8. Comparison between experimental data and predicted data obtained by the mechanistic models: (A) COD, (B) sludge and (C) scum. (◊, initial pH 4.4 experimental data; □, initial pH 5 experimental data; ∆, initial pH 7 experimental data), (black line-square dot, initial pH 4.4 model 1; black line-solid, initial pH 5 model 1; black line-long dash, initial pH 7 model 1) and (red line-square dot, initial pH 4.4 model 2; red line-solid, initial pH 5 model 2; red line-long dash, initial pH 7 model 2).
Water 13 00011 g008
Figure 9. Comparison between initial pH and COD removal per charge loading in the EC of DSW.
Water 13 00011 g009
Table 1. Chemical characteristics of the distillery spent wash (DSW).
ParametersValueUnitMethods
ColorDark brown-Organoleptic method
COD112,948.5mgL−1SNI 06-6989.15-2004
pH4.4-A digital pH meter
Volatile fatty acid19,291.24mg-Acetic acid L−1Steam distillation
Total nitrogen420mgL−1Total Kjeldahl Nitrogen
Total solid92,624.25mgL−1APHA 22nd 2012
Potassium985mgL−1SNI 06-6989.25-2005
Chloride1108.6mgL−1APHA 22nd 2012
Conductivity27,287.68μScm−1An electrical conductivity meter
Table 2. Summary of the mathematic equations used in the mechanistic models based on routes 1 and 2.
RateBased on Route 1 (Model 1)Based on Route 2 (Model 2)
d m C O D d t k a m C O D k a m C O D k b m C O D
d m s l u d g e d t k a m C O D k b m s l u d g e k a m C O D
d m s c u m d t k b m s l u d g e k b m C O D
Table 3. Kinetic constants for the EC at various currents.
2.5 A3 A3.5 A
Model 1 (based on route 1)
k a · (h−1)0.04900.09080.1270
k b · (h−1)0.02490.14970.2002
SSE2.03 × 10−43.4×10−38.8×10−3
R20.930.850.82
Model 2 (based on route 2)
k a · (h−1)0.04520.05710.0701
k b · (h−1)0.00430.03740.0660
SSE2.60×10−44.6×10−31.32×10−2
R20.800.790.76
Table 4. The sludge formation at the initial pHs of 5.0 and 7.0.
Time (h)Sludge at the Initial pH of 5.0 (%)Sludge at the Initial pH of 7.0 (%)
000
11010
21086.4
32592.3
46392.3
574.695.7
679.296
784.7100
7.5 -100
888.9-
Table 5. Kinetic constants for EC at various initial pHs.
pH 4.4pH 5.0pH 7.0
Model 1 (based on route 1)
k a · (h−1)0.09080.15750.1629
k b · (h−1)0.14970.20890.4558
SSE3.4×10−33×10−30.5869
R20.850.900.86
Model 2 (based on route 2)
k a · (h−1)0.05710.08430.0844
k b · (h−1)0.03740.07930.1292
SSE4.6×10−34.7×10−32.43×10−2
R20.790.920.98
Table 6. Summary of the results in the EC of DSW.
Initial COD
(mg L−1)
Initial Volume
(mL)
Initial pHTemperature
(°C)
Current
(A)
Agitation Speed
(rpm)
Current Density
(mA cm−2)
ElectrodesElectrode Active Surface (cm2)d
(cm)
t
(h)
Charge Loading
(C g-COD−1)
COD Removal Efficiency (%)COD Removal (%) per Charge Loading (C g-COD−1)References
112,948.510004.4273.550055.03Fe-Fe63.65.58892.4274.90.0839This study
112,948.51000730350047.17Fe-Fe63.65.55478.1066.70.1395This study
120,0003003--500187.5Fe-Fe1632600.0052.40.0873[32]
100,16010006Room2.15200-Fe-Fe63.65.5177.2819.90.2571[14]
100,16010006Room3.99200-Fe-Fe63.65.51143.4151.70.3603[14]
52,0003007.2-0.4150014.7Fe-Fe-33283.8576.90.2709[33]
52,0003007.2-0.4150017.9Fe-Fe-33283.8584.50.2977[33]
33605007.5--50035.9Fe-Fe12.8321969.37500.0254[2]
33605007.5--50071.8Fe-Fe12.8323938.74880.0223[2]
2500500630 ± 2 (constant)--30Fe-Fe451415552.00620.0040[9]
200020002Room--3Fe-Fe100241080.0020.50.0190[10]
200020006Room--3Fe-Fe100241080.0081.30.0753[10]
2000200010Room--3Fe-Fe100241080.0075.50.0699[10]
200020006Room--1Fe-Fe10024360.0025.80.0715[10]
200020006Room--5Fe-Fe100241800.0092.50.0514[10]
Publisher’s Note: MDPI stays neutral with regard to jurisdictional claims in published maps and institutional affiliations.