Article

Size Spectra of Pelagic Fish Populations in a Deep Lake—Methodological Comparison between Hydroacoustics and Midwater Trawling

Leibniz-Institute of Freshwater Ecology and Inland Fisheries, Müggelseedamm 310, 12587 Berlin, Germany
*
Author to whom correspondence should be addressed.
Water 2021, 13(11), 1559; https://doi.org/10.3390/w13111559
Submission received: 16 March 2021 / Revised: 14 May 2021 / Accepted: 27 May 2021 / Published: 31 May 2021
(This article belongs to the Special Issue Hydroacoustics in Marine, Transitional and Freshwaters)

Abstract

:
Net sampling by trawling and hydroacoustics was used to methodologically compare size spectra (SS) of the pelagic fish community in a deep lake across 12 years of sampling. Hydroacoustic SS were generated based on either single-echo detections (SEDs) or tracked-echo groups (TEGs) from 20 cross-lake transects. Trawl SS were obtained by a midwater trawl in four pelagic depth layers. All SS were derived from maximum likelihood estimations of exponent b of a continuous fish body mass distribution. The arithmetic mean exponent b was similar for all methods, and there were no significant differences of b among the three methods across years. However, visual inspection indicated that the SS differed considerably between trawling and hydroacoustics in some of the years, primarily when high densities of 0+ coregonid fishes were strongly spatially aggregated and hence caught by the trawl. Accordingly, there was no correlation between SS generated by trawling and hydroacoustics. In contrast, SS generated by SEDs and TEGs were significantly correlated, indicating reliability and reproducibility of obtaining SS by hydroacoustics. The SS estimated by TEGs revealed a positive trend of exponent b over the years since 2005, potentially reflecting the recent eutrophication of Lake Stechlin, which may lead to higher fish growth rates. We conclude that hydroacoustics may help to generate more precise SS of the pelagic fish community in our study lake than midwater trawling. However, the truthfulness of SS estimates cannot be evaluated because of the inherent difficulty in determining the true densities and sizes of fishes in lakes.

1. Introduction

In aquatic ecosystems, size-based indicators are a well-established management tool to track ecosystem status and exploitation effects [1,2]. Body size is an essential property of organisms, linked to physiological and ecological rates and processes, such as respiration, ingestion, reproduction [3,4], life span [5,6], and trophic interactions [7]. Furthermore, in aquatic communities, body size dictates the functional role of an organism throughout its lifetime due to ontogenetic shifts [8].
Community size spectra [9] have been frequently used for understanding the status and structure of aquatic communities, as this concept represents energy flow through a community regardless of species identity. Size spectra (SS) describe the relationship between the logarithm of size and the logarithm of abundance (or biomass), which is usually expressed as a linear regression [9,10,11]. The intercept of the SS reflects the overall abundance (or biomass) of the system, and the slope mirrors the relative abundances of small and large organisms [12] and therefore functions as an indicator of trophic structure [2,13]. Monitoring these spectral parameters offers the potential to reveal when ecosystems are experiencing external pressures, such as intensive fishing, eutrophication, or climate change [1,14]. Fisheries are usually size-selective and may therefore lead to a significant removal of large individuals from the system [15]. The resulting changes in size structure are imperative for understanding the effects on ecosystem structure. SS are a highly effective approach to summarize and compare the size structure of aquatic communities across years and between systems [16,17] since they signify the aspect of the system under pressure, including total biomass, specific size classes, or both [13].
Typically, aquatic net sampling methods, such as trawling and gill netting, have been used to assess the SS of fish communities, but these methods induce high mortality of fish and are labor- and cost-intensive [1,18]. Furthermore, net sampling is inherently size-selective and may therefore introduce bias in SS analyses [19,20,21]. In contrast, relevant hardware and software for scientific hydroacoustics have evolved rapidly in recent years [22], and hence, hydroacoustics provides a nondestructive and cost-effective alternative to estimate fish abundances [11]. In theory, hydroacoustic methods also offer a less size-selective method than fishing to document the SS of fish communities. This sampling method has proven useful in describing fish community SS if the majority of fish are recorded within the acoustic beam and consequently measured as single targets [23]. However, the echo sounder system used and the methods of data processing and analysis affect the results and differ between studies and monitoring programs. Therefore, more studies are needed which examine the applicability of hydroacoustics for generating size distribution of fish communities and give a baseline for a standardized method of data analysis for measuring SS [24].
The aim of this study was to methodologically compare the SS of a night pelagic fish community in a deep lake based on net sampling by midwater trawling and hydroacoustics over 12 years. Hydroacoustic SS were generated based on either single-echo detections (SEDs) or tracked-echo groups (TEGs). Trawl SS were obtained by conducting nighttime hauls in four pelagic depth layers by a midwater trawl. The lake is dominated by coregonid fishes, which are known to disperse by diel vertical migration from dense deep-water aggregations during the day to a more even spatial distribution over the entire water depth at night [25]. Therefore, coregonids are easily detectable as single echoes during hydroacoustic surveys at night and can likewise be caught by midwater trawling. In concordance with SS theory, we expected to find a consistent decline in abundance of pelagic fish with increasing body size. Furthermore, considering previous studies on the reasonably good correspondence of fish biomass estimates between net fishing and hydroacoustic [26,27], and between echo integration and tracking [24,28], we assumed that SS generated by all methods would also be reasonably well correlated. Finally, because Lake Stechlin has shown signs of accelerated eutrophication in recent years [29,30], we expected that the size distribution would become shallower, reflecting faster growth rates of coregonids in response to higher primary production (compare [31]).

2. Materials and Methods

2.1. Study Site and Sampling

This study was conducted in Lake Stechlin, located approximately 120 km north of Berlin (Germany). This mesotrophic lake covers about 4.25 km2, with mean and maximum depths of 22.3 m and 69 m, respectively (see Figure 1a, [32]). A total of 13 fish species inhabit the lake [33], but the pelagic fish community is dominated by two sympatric species of ciscoes, Coregonus albula and C. fontanae (more than 95% of fish abundance [34,35]). Furthermore, the average stock exploitation rate by the single commercial fishery is 0.08 [36], suggesting no strong effect of annual fish removal on fish abundance differences between years. We estimated counts and individual body wet mass (in g) of fish annually every June between the 6th and 29th from 2006 to 2019 using pelagic midwater trawl (n = 12 years, data for 2016 missing due to net malfunction) and hydroacoustic surveys (n = 12 years, data for 2007 missing due to malfunction of hydroacoustic equipment) simultaneously. The surveys were conducted during complete darkness starting 1 h after sunset. Pelagic midwater trawl surveys covering several depth layers could be conducted only in the deep central and northern basin (from here on central basin, CB) of Lake Stechlin. The morphometry of the lake (horizontal extension of certain depth layers per basin) is very variable (see Figure 1a), and hence, hauls with a minimum of 500 m towed distance in depths deeper than about 15 m could be realized only in one part of the lake. Therefore, to address potential spatial heterogeneity in fish distribution between the basins, we calculated hydroacoustic SS from either all transects (whole lake, WL) or only from the transects overlapping spatially with the trawl surveys (CB; see Figure 1b).

2.2. Fish Assessment—Trawling

A pelagic trawl with 28/20/10 mm mesh size, 10 mm mesh size in the cod-end, and a total length of 14.8 m (stretched on land) was used (for more details of the net construction, see Figure 2 in [26]). The net with an opening area of approximately 10 m2 (opening width 3.5 m) was towed by a boat (length 7 m, width 2 m), which was driven by a 60 hp engine over four longitudinal transects in the deepest lake basins. Trawling speed (mean ± SD) was 6.5 ± 0.6 km h−1(1.8 ± 0.2 ms−1), while towed distance, as the product of trawling speed and trawling time, ranged between 500 m and 1600 m (mean 840 m) with an average towing time (±SD) of 7.8 min (±1.9). During each survey, a total of four hauls were conducted at approximately 12 m ± 0.65 m, 15 m ± 1.09 m, 25 m ± 2.08 m, and 32 m ± 0.90 m (mean ± SD) depth, whereby the two deeper hauls had shorter trawling times and slightly slower hauling speeds. Due to the limited spatial extension of water layers with more than 35 m depth, deeper hauls could not be performed. The actual sampling depth was recorded with a diving computer attached on the trawl’s head rope. The depth variability during each tow never exceeded 3 m. At the end of each haul, the trawl was quickly lifted by hydraulic winches at speeds comparable to the trawling speeds, thus preventing escapement of fish from the net. Fish were counted and individually measured to determine total length (TL in mm) and body mass (wet mass, wm in gram). Only subsamples were measured and weighed when catches were too large. The number of fish per 1000 m3 was estimated from the towed distance and the opening area of the trawl. Due to the shorter hauled distance in the deeper layers, the overall size distribution per year calculated as the total sum of all fish caught by the four hauls would have been biased toward the size of fish in the upper water layers. Therefore, we employed a weighting factor (WF) to calculate a weighted mean abundance and size distribution across the four depth layers. The WF was calculated as the ratio between the maximum volume fished by one of the four hauls in this year and the volume fished in the respective depth layer as:
WF = Maximum   Volume   m 3   fished Individual   Volume   m 3   fished
The fish abundance from the individual hauls was weighted with the calculated WF in each year. Accordingly, the WF equals the abundance and size distribution per depth layer to identical fished volumes. Some size distribution analyses require fish numbers per size class as integers; then, the weighting factor was rounded to the nearest half integer (see Table 1).

2.3. Hydroacoustic Fish Assessment

Hydroacoustic surveys were completed as a series of transects using a SIMRAD (Kongsberg) EY60 split-beam hydroacoustic unit (120 kHz, circular transducers, beam width 7 × 7, pulse duration 128 ms, ping rate 3 pings s−1). The calibration was conducted with standard spheres provided by the manufacturer. Surveys were performed with vertical beaming along 20 transects (total distance about 12 km) across this tri-basin lake, with transect length ranging from 635 m to 1332 m (see Figure 1b). Among these 20 transects, 9 were selected which overlapped with the area of the trawling surveys for the CB estimates of hydroacoustic SS. Some transects from the north basins were missing in 2006 and 2009 due to a malfunction of the GPS. Data were stored in a computer, processed, and analyzed using the postprocessing Sonar5 Pro software (CageEye AS, Oslo, Norway).

2.4. Hydroacoustic Data Processing

The lower target strength (TS) threshold (as a measure of fish body length in dB) was set to −55 dB for the SED echogram corresponding to fish of an approximate total length of 4.2 cm and 0.42 g wm. Parameters for amplitude echograms were set 6 dB lower (−61 dB) to accept targets out of the half power edge of the sound beam. Echograms were manually cleaned of noise and nonfish echoes, while bottom detection was run automatically using the software parameter settings. A backstep margin of 2 m was used. The upper limit of the analyzed echogram area was set to 1 m below the surface, while the bottom line was set as the lower limit. Tracked-echo groups (TEGs) were generated using the automatic tracking algorithm in the software. Criteria for acceptance of SED and TEG parameters are summarized in Table 2. The TS (dB) of the targets was converted into fish total length (cm) and body wet mass (g) using the equation obtained for Coregonus spp. from Lake Stechlin by [37]:
TL   cm   =   10 (   TS + 70.9 ) 25.5 ,
wet   mass   ( g ) = 0.00507   ×   ( TL   ( cm ) 3.088 ) .

2.5. Hydroacoustic Data Analysis Methods

We compared two analytic methods of hydroacoustic data, SEDs and TEGs [38], with respect to their suitability to reflect fish SS. SEDs represent acoustic targets based on detection by one acoustic ping. Accordingly, this method may reject echoes from true fish or underestimate the true fish size if the target is not optimally positioned in the acoustic beam. In contrast, TEGs are observations of a single fish (i.e., SEDs) during subsequent echoes, combined by the tracking module if judged to belong to one individual fish. This approach reduces the potential bias of SEDs with respect to echo detection and size estimates [23]. However, if fish are not fully covered by the hydroacoustic beam, their TS and hence true length and mass can be underestimated. Therefore, we used the maximum TS per fish recorded during TEG detection to account for this potential bias.

2.6. Fish Size Distribution

To visualize the size distribution of fish based on the entire lake across all 12 sampling years, a body weight (g) frequency distribution for each survey method was calculated. Only fish within a size range of 6.5–17.7 cm were regularly caught by trawling. Thus, to facilitate proper correspondence in the size ranges between trawling and hydroacoustics, our analyses included only medium-sized fish that were recorded by both methods comparably well, whereas fish <6 cm (1 g) and >18 cm (50 g) were excluded.

2.7. Size Spectrum Fitting

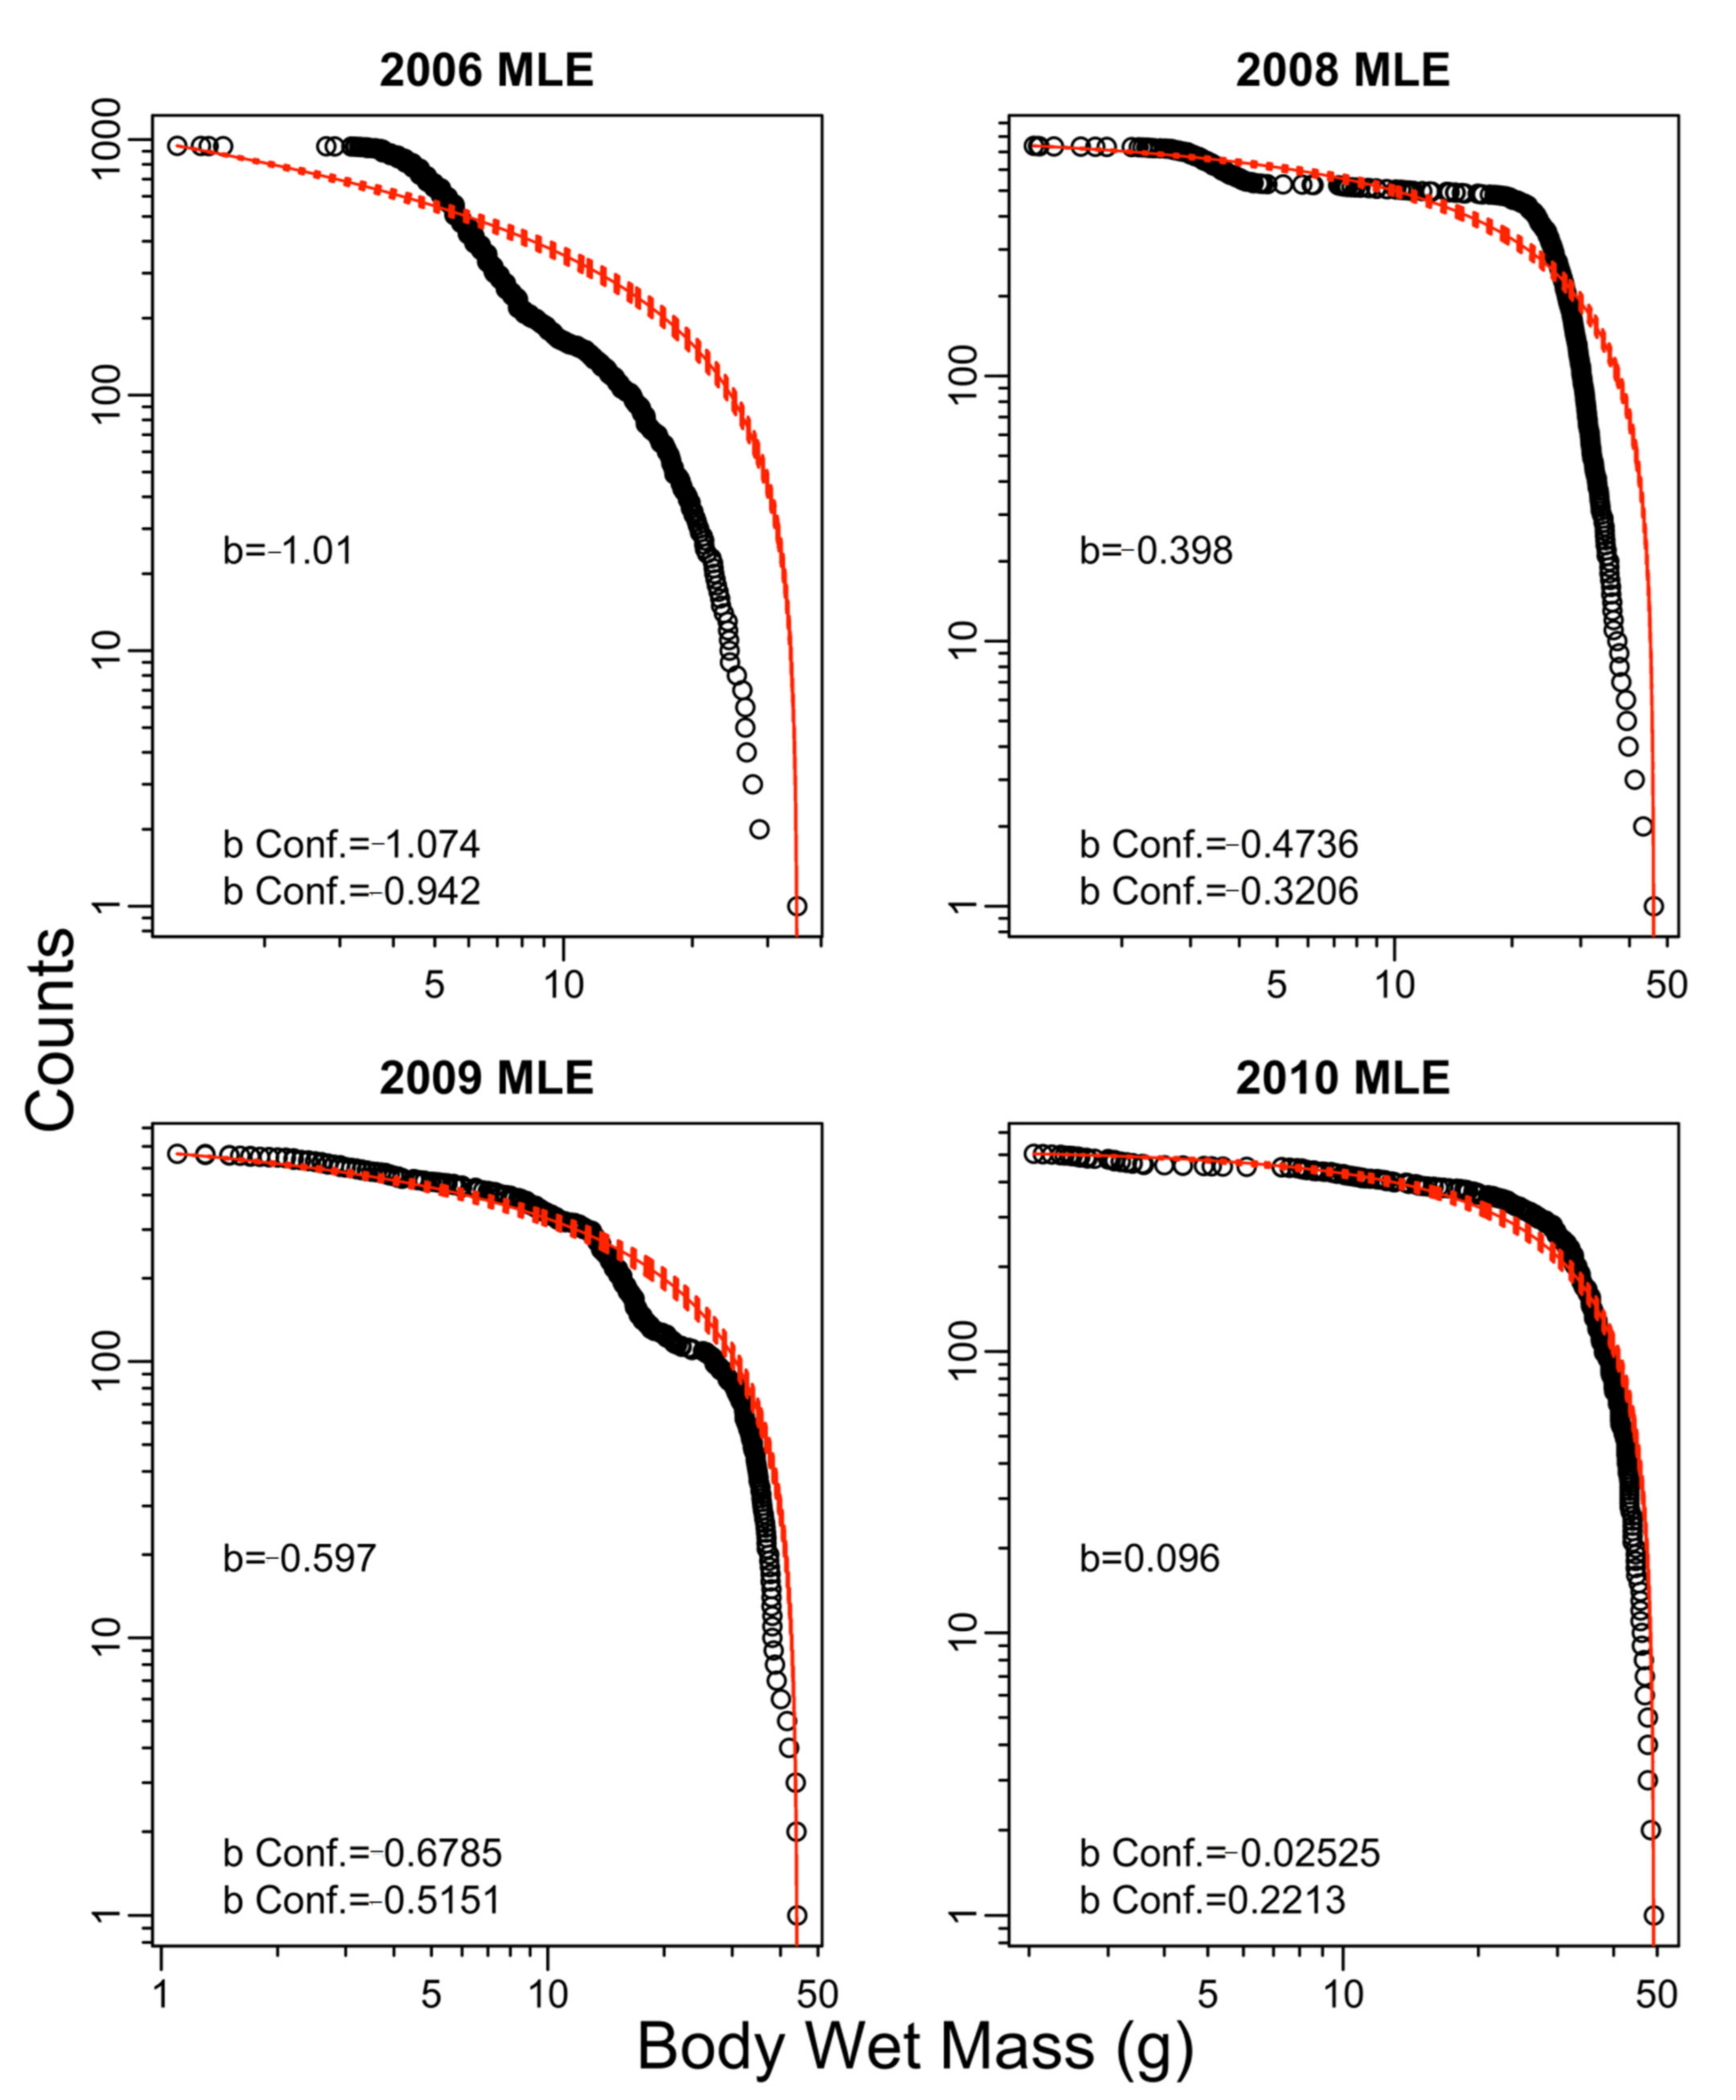
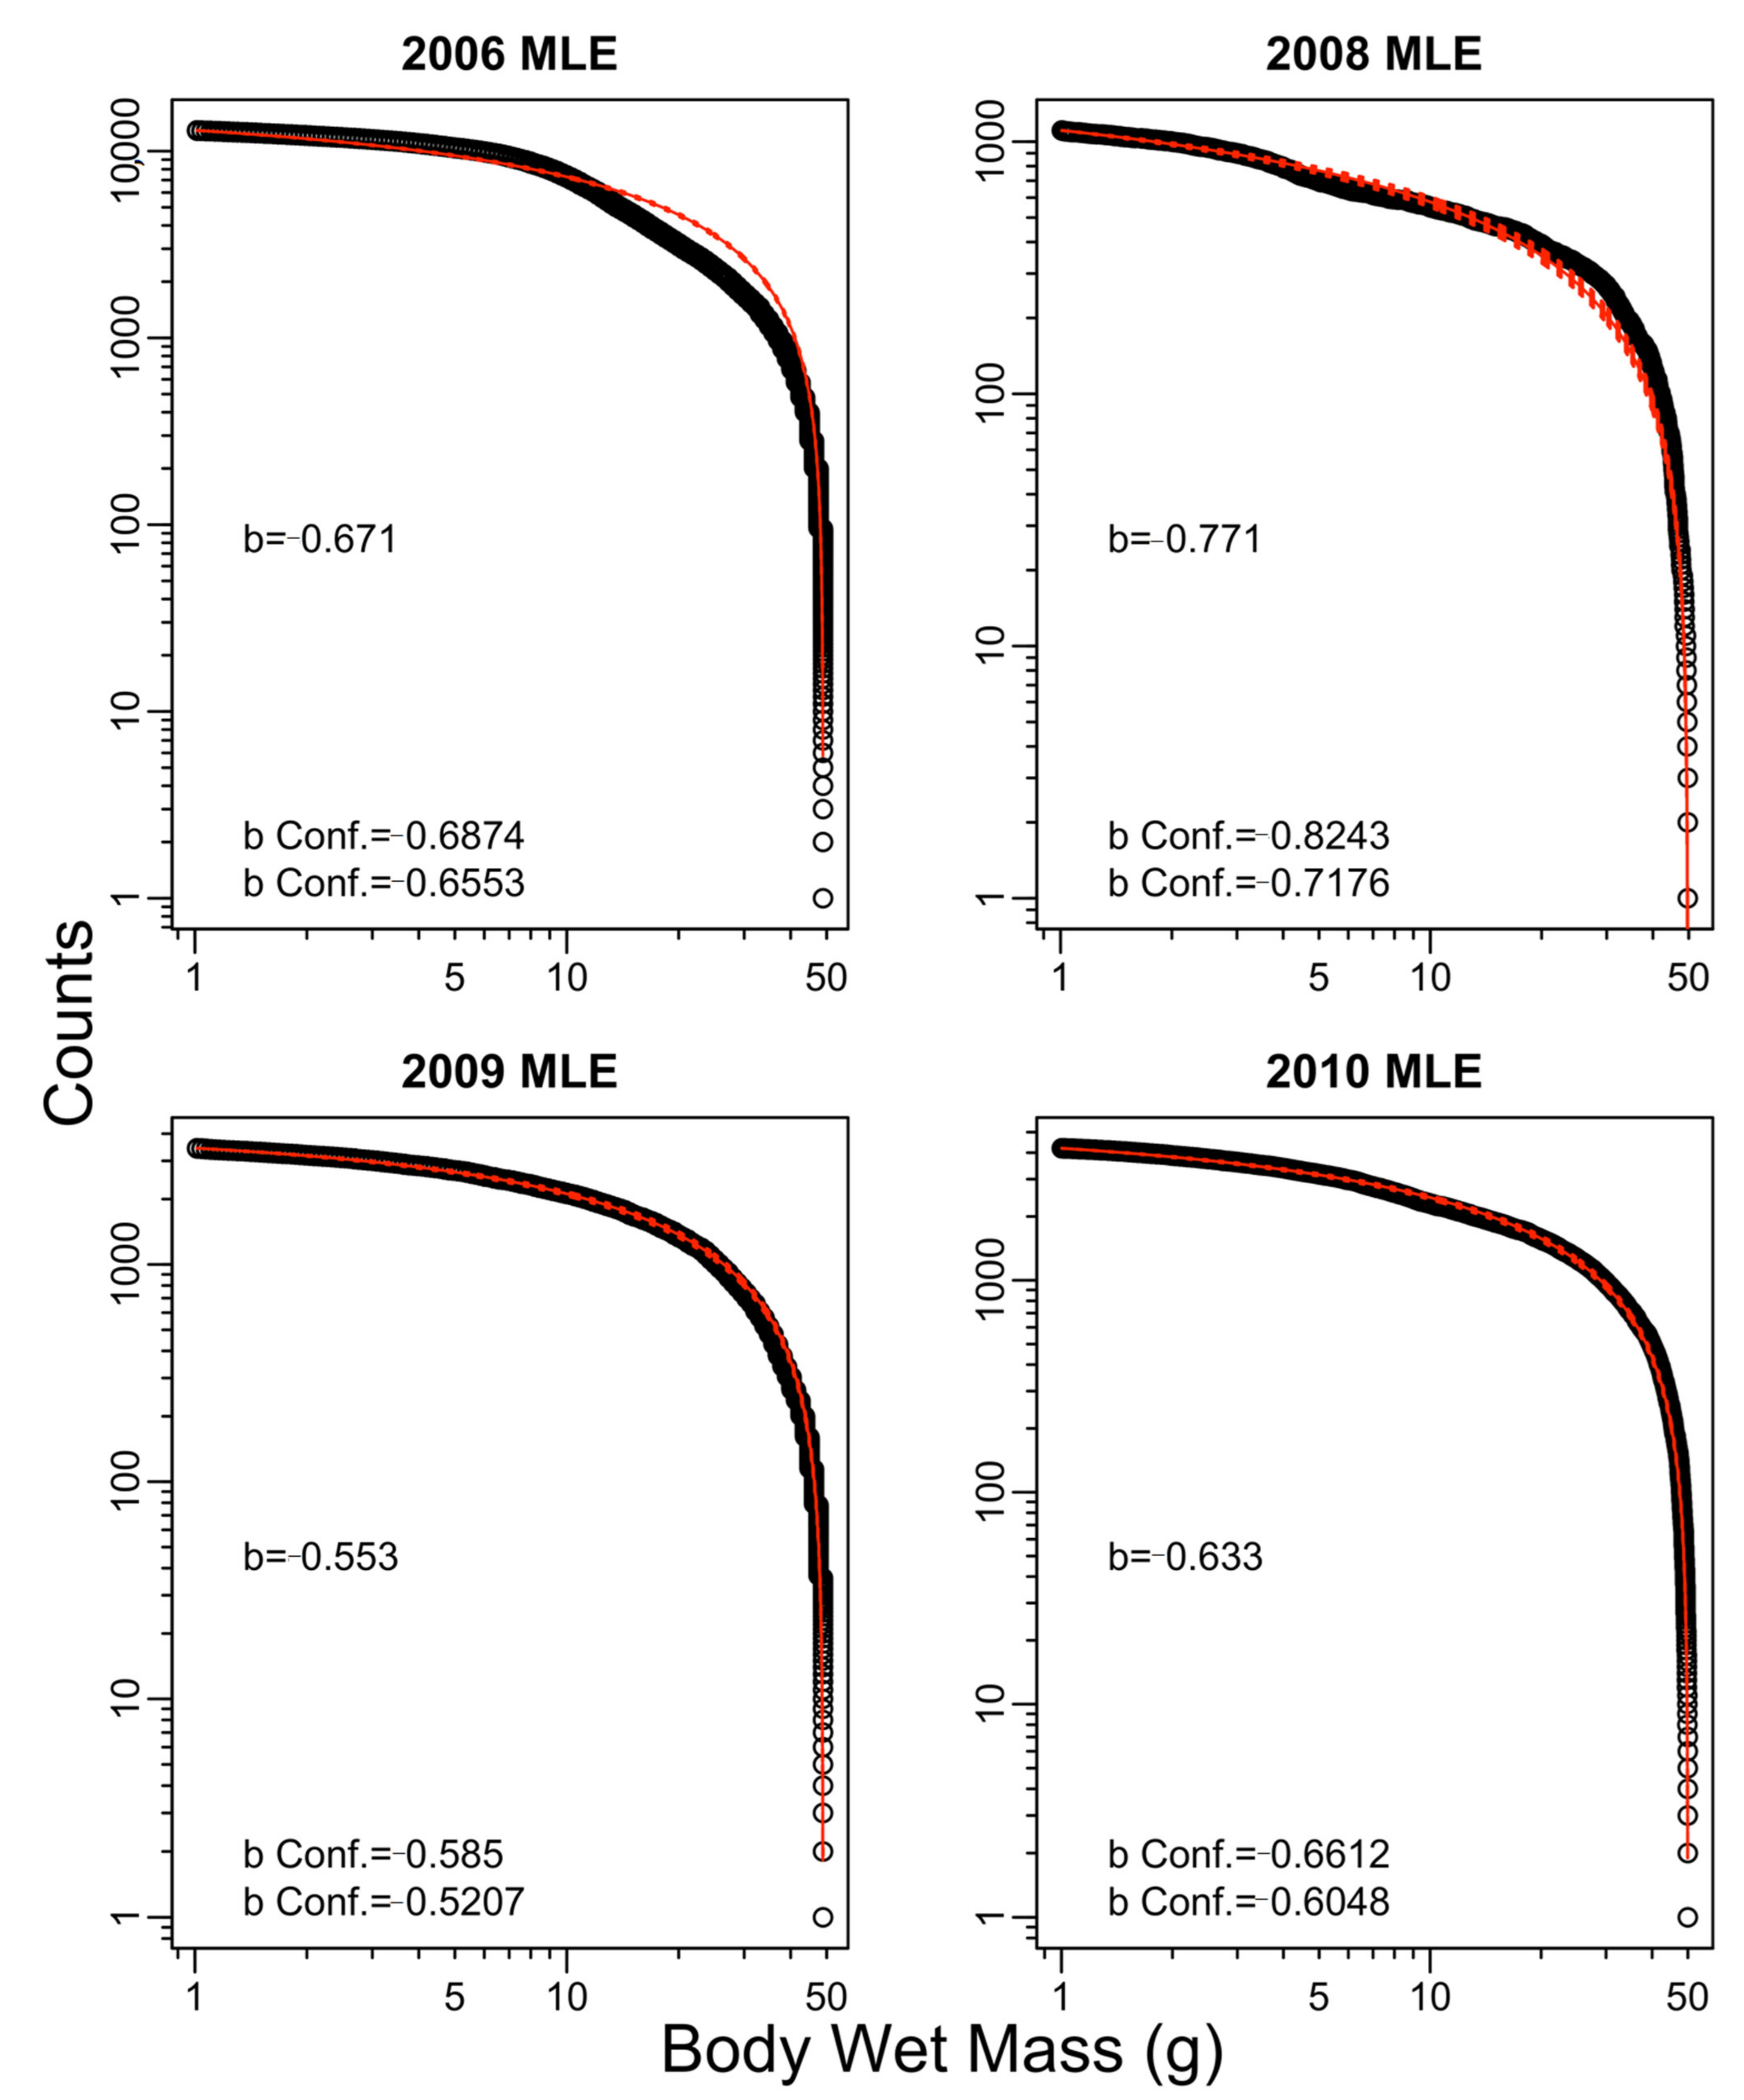
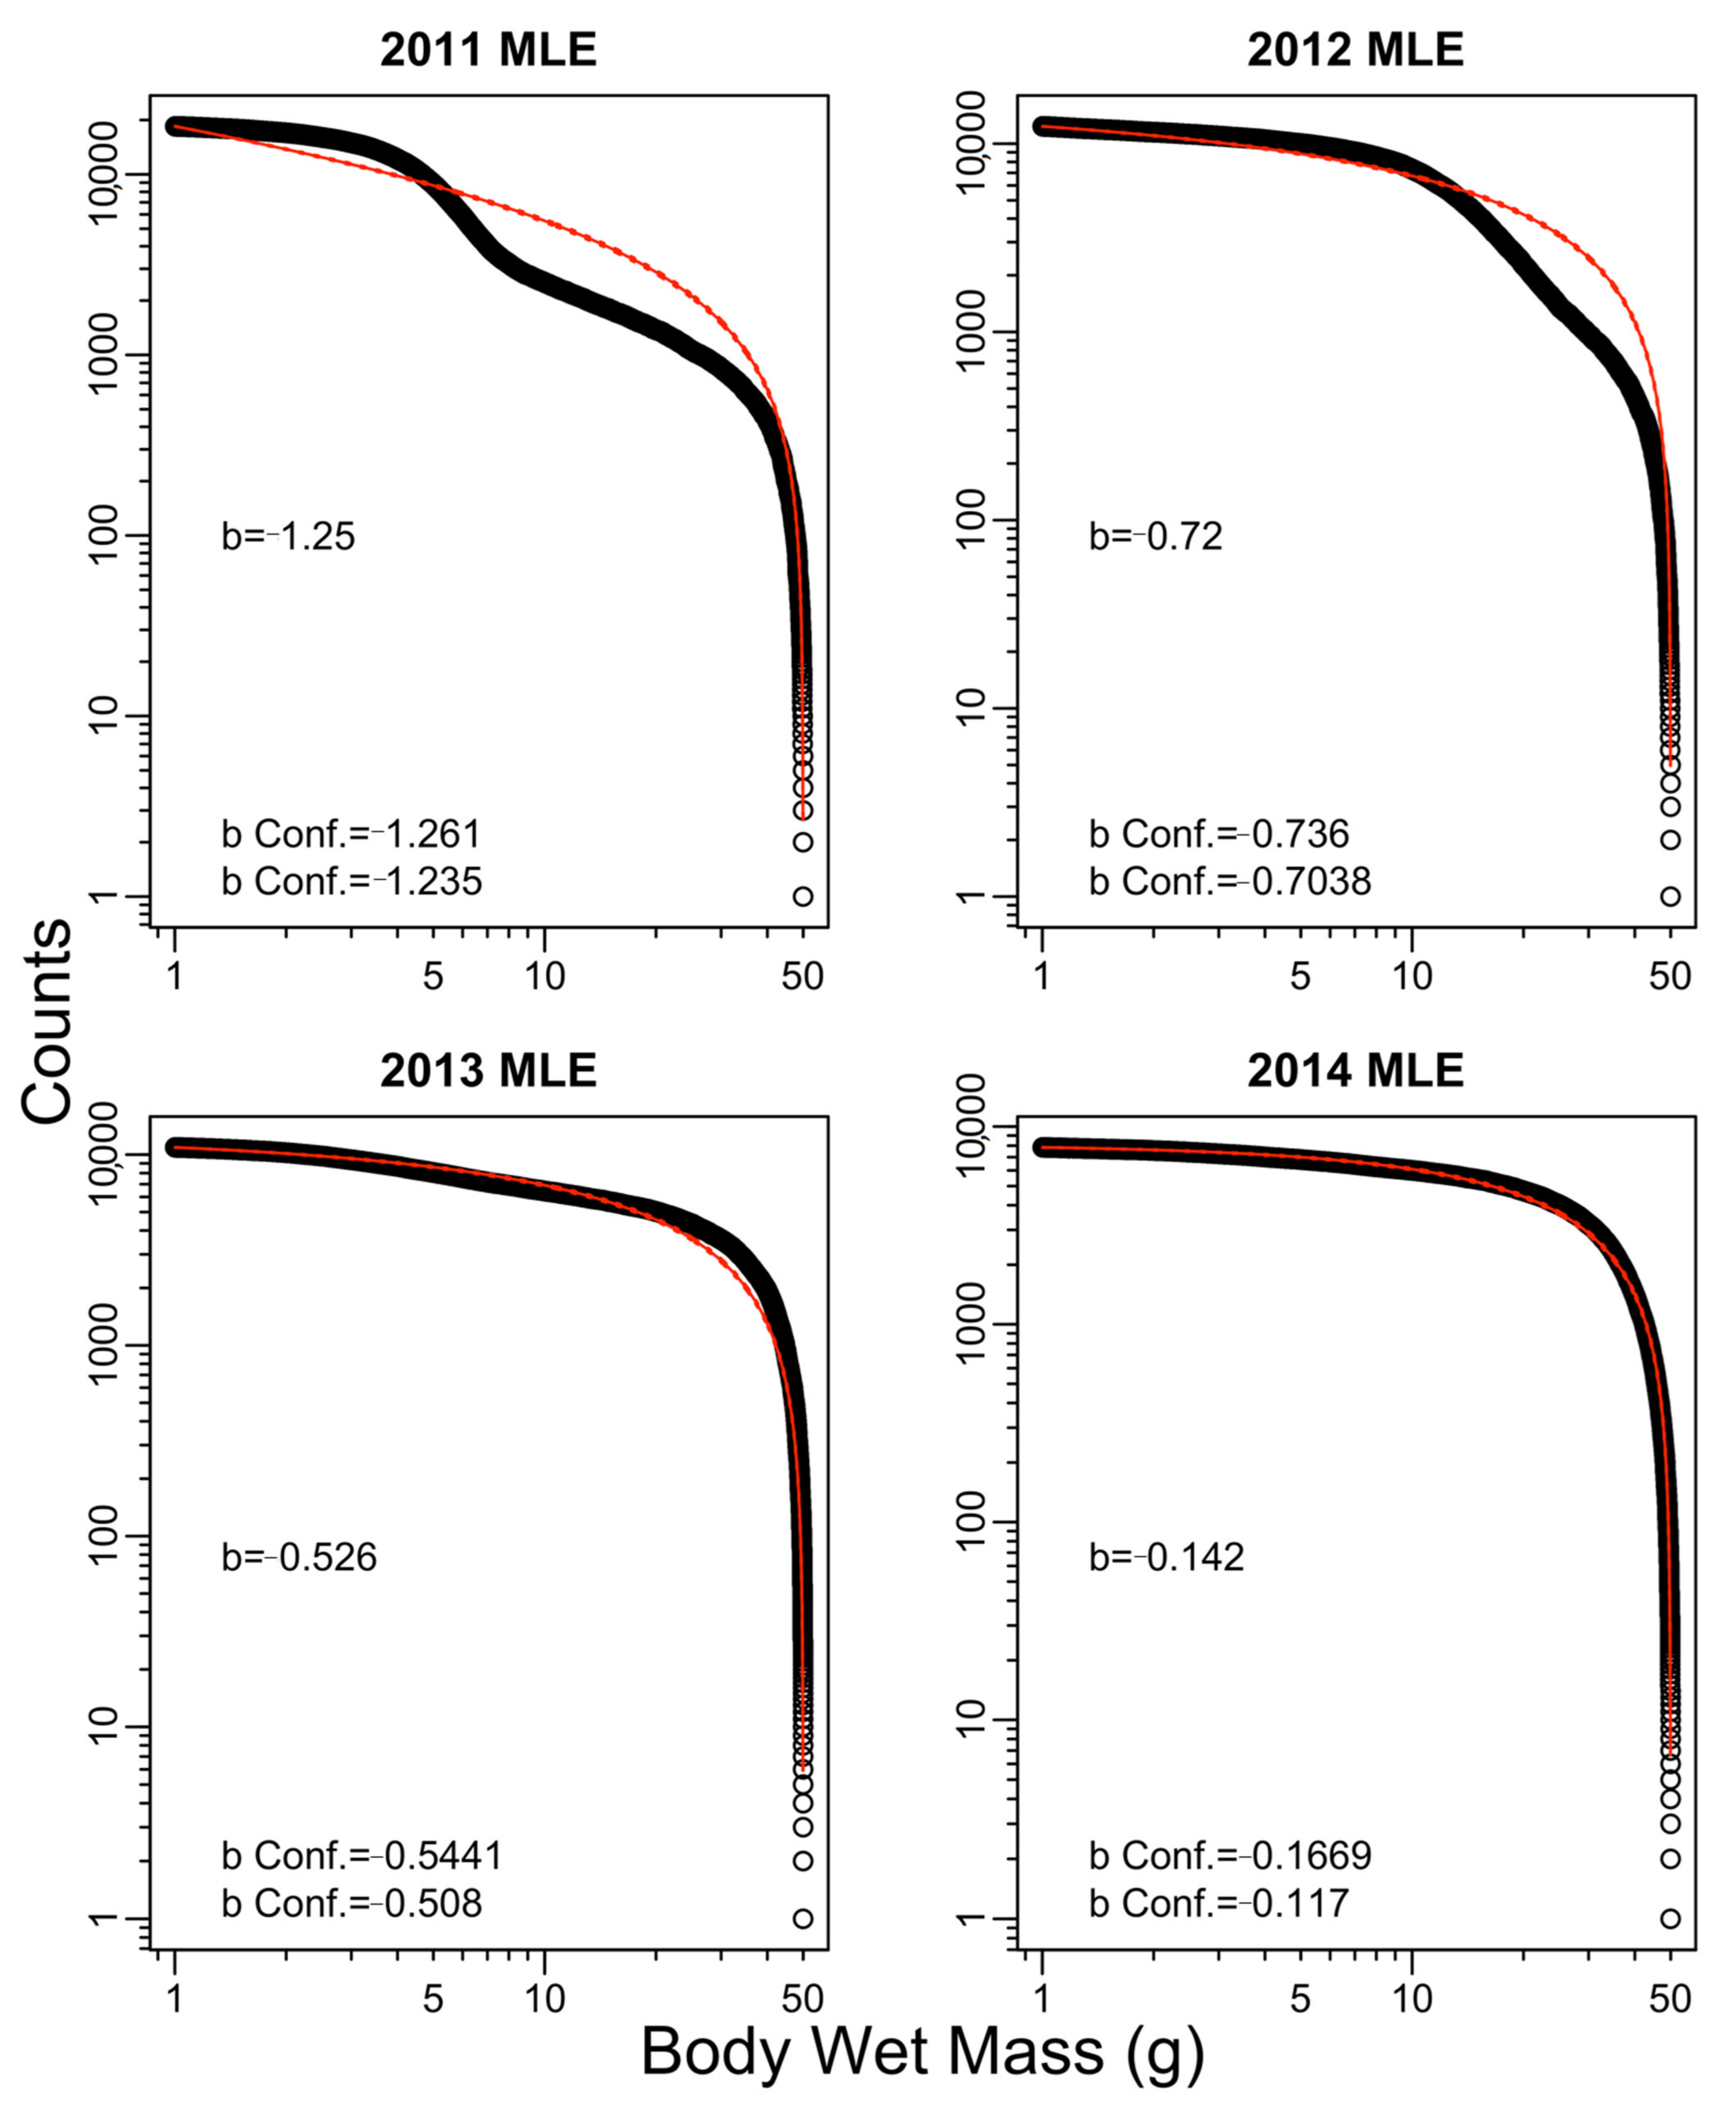
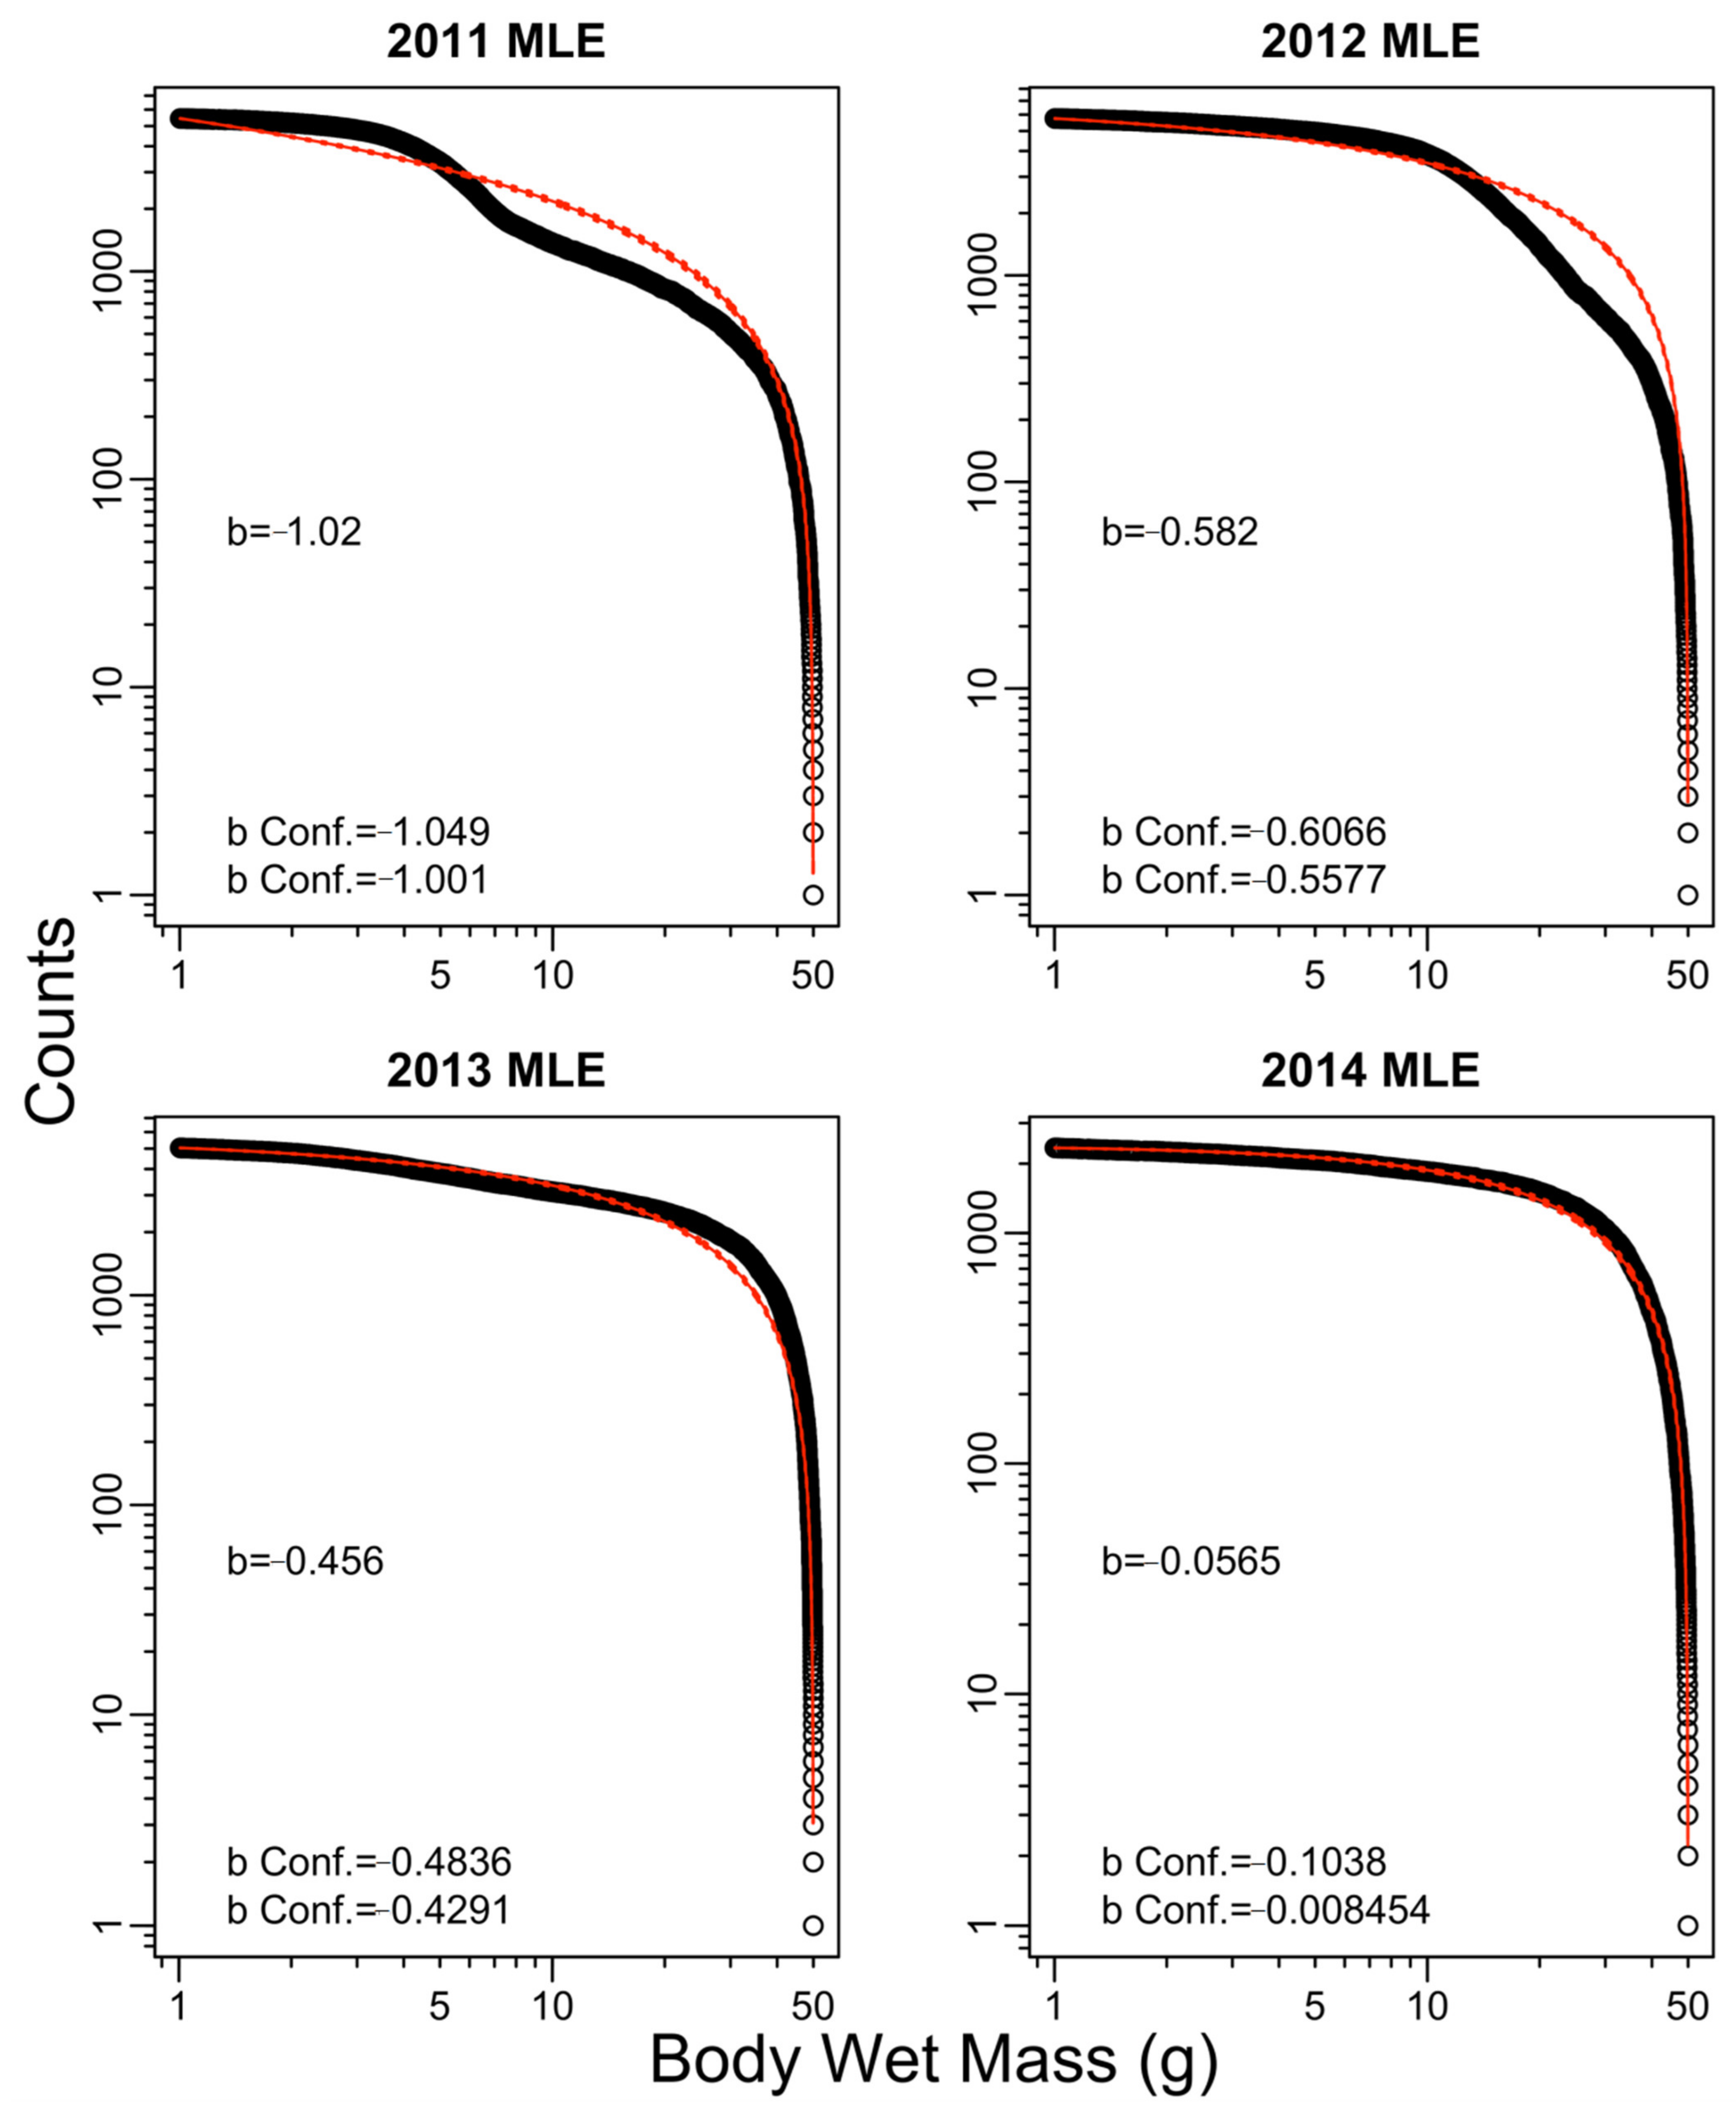
We compared the SS of the pelagic fishes in the size range of 1–50 g body wet mass among the three methods (trawl, SED, TEG) across the entire lake. To account for potential spatial heterogeneity in fish distribution, we tested whether hydroacoustic-based SS estimations differed significantly between CB and WL. The maximum likelihood estimation (MLE) method was used, which is the recommended method for fitting continuous fish size distributions [39]. The exponent of the individual fish size distribution (b) estimated by MLE coarsely corresponds to the slope of linear SS, as estimated by ordinary least squares. Maximum likelihood estimates of b require numerical maximization of the log-likelihood function [40,41], while the xmin and xmax are the minimum and maximum observed body mass values per method and survey year in the MLEs. The abundance SS per method were expressed as a bounded power law (PLB) distribution that was fit across the range of body mass values using the MLE for b. The fitted PLB model was visualized by a red curve superimposed on the continuous size distribution for each year and method individually (see Appendix A Figure A1, Figure A2, Figure A3, Figure A4, Figure A5, Figure A6, Figure A7, Figure A8 and Figure A9). The 95% confidence interval for exponent b for each method and sampling year was calculated using the profile likelihood ratio test [42]. The estimate of exponent b per year was tested for normal distribution for each method among years with a Shapiro–Wilk normality test [43]. Furthermore, we assessed whether the across-year mean estimates of b differed significantly between trawling, SEDs, and TEGs in the WL using a Kruskal–Wallis H test. Pairwise Spearman rank correlations were calculated to examine whether there was correspondence of the b values per year from the individual methods and between WL and CB. All statistical analyses and plots were conducted with the software R [44]. Specifically, MLEs were performed by the provided R code and package (sizeSpectra) from [39,45].

3. Results

Over the 12 years from which samples could be compared, we determined the size of 8170 coregonids caught by trawling (222 to 1400 per year). The numbers of targets recorded by hydroacoustics were 127,726 SEDs (1520 to 16,531 per year) and 53,922 TEGs (1626 to 7207 per year) across the WL and 89,598 SEDs (873 to 16,516 per year) and 40,338 TEGs (1432 to 6140 per year) in the CB. In contrast to fish size distributions based on hydroacoustic surveys, we found that trawl catches do not represent small and large fish very well (see Figure 2). Therefore, all further stated results are based on fish between 1 g and 50 g body weight.
The estimates of “b” were found to correlate significantly between the WL and CB based on SED (Spearman’s rs = 0.98, p < 0.0001) and TEGs (Spearman’s rs = 0.98, p < 0.0001; Figure 3, Appendix B Table A1). Therefore, spatial heterogeneity in fish distribution between the lake basins was minor, and we base all subsequent comparisons on the SS from all 20 hydroacoustic transects.
The estimated arithmetic mean of exponent b (±SD) across the 12 sampling years was lowest for SED (WL: x ¯ = −0.73 ± 0.27), followed by trawling ( x ¯ = −0.56 ± 0.72), and highest for TEGs (WL: x ¯ = −0.44 ± 0.24, see Table 3). Due to strong among-year differences, exponent b was not significantly different among the three methods in the WL across the years (χ2 (2) = 4.22, p = 0.12). However, there were substantial differences in “b” estimates between the three methods in some years, with the highest variability found for SS based on trawl catches.
Linear regression showed that there was no directional change in exponent b across survey years by trawl and SED (trawl: R2 = −0.09, F(10) = 0.03, p = 0.84; SED: R2 = 0.02, F(10) = 1.667, p = 0.27; TEGs: R2 = 0.21, F(10) = 3.93, p = 0.07; see Figure 4), but there was a weakly significant trend toward shallower b over years when plotting TEGs
Furthermore, the estimates of “b” did not correlate between trawl catches and TEGs (rs = 0.24, p = 0.44) or between trawl catches and SEDs (Spearman’s rs = 0.43, p = 0.17). In contrast, the exponents from both hydroacoustic methods, SED and TEGs, were found to correlate significantly (Spearman’s rs = 0.67, p = 0.02, see Figure 5).

4. Discussion

In our study, we aimed to determine whether the estimated SS of the night pelagic fish community in Lake Stechlin differed depending on whether net sampling by midwater trawling or hydroacoustics based on either SEDs or TEGs was used across 12 years of sampling. The arithmetic means exponent b did not show any significant differences in the fish community SS if averaged across years. However, there were considerable differences in exponent b among the three methods for some years, often coinciding with higher densities of coregonid fish juveniles. Accordingly, the SS were not correlated between trawling and both types of hydroacoustic data but correlated between SEDs and TEGs. Here, it could be argued that this may be due to the fact that the TEG data stream is a subset of the SED data stream and therefore missing statistical independence and resulting in inflated r and p-values in the Spearman rank correlation. The SS obtained by TEGs showed a positive trend over the sampling years, potentially reflecting faster growth of the coregonids in response to the recent eutrophication of Lake Stechlin.
When comparing the hydroacoustic methods, the overall number of TEGs was substantially lower than the number of recorded SEDs. This can be expected because TEGs are composed of several successive SEDs, which are considered to come from separate fish in SED-based analyses. Exponent b of the SS calculated from SEDs was always more negative than that obtained by TEG detection, indicating a steeper spectral slope, and therefore less large relative to small fishes detected by SEDs. These differences in size spectral estimates between both methods also occurred in years when the fish community was dominated by small fish, such as in 2008, 2011, 2017, and 2019. They suggest that the size distribution of SEDs may be biased toward weaker echoes, certainly because even larger fish are often not ideally positioned in the acoustic beam and hence produce echoes which are weaker than predicted by the true fish length. Using the maximum echo strength from all successive SEDs within a track partly corrects this bias. Accordingly, the average b from TEG detection was the highest among the three methods, indicating that the size distribution of maximum SEDs per track includes a higher proportion of larger fish than that obtained by the two other methods. Specifically, fish catches from trawling are known to underestimate large fishes, which is attributed to an increased swimming speed with increasing body size (e.g., [46]) relative to the operation speed of the trawl. Furthermore [26], demonstrated that the mean swimming speed of the largest vendace (e.g., 2.0 m s−1 for a 20 cm fish, [47]) in the trawl mouth is faster than the mean towing speed (1.8 m s−1) performed during trawl surveys. In principle, only hydroacoustic estimates allow for an unbiased measure of fish SS over a wide size range, while also providing insights into fish density over the entire water column, neither of which are possible with trawling. Therefore, by considering the biases of the other methods, the TEG approach can be considered to be the most reliable method with respect to fish size distributions in Lake Stechlin because it avoids both the size selectivity of net fishing with respect to larger and faster swimming fish and the size bias of SED distributions.
In a study similar to ours [24], compared pelagic fish SS obtained by netting methods with those obtained by hydroacoustics. They found substantial differences in the frequency of single size classes between net catches and hydroacoustics. These authors further compared the size distributions between echo counting and echo integration, both based on a tracking algorithm that combined single SEDs into a track for one fish. SS from echo counting were constantly shallower than those from echo integration, which was explained by the effects of target co-incidence and leads to an overestimation of the size and numbers of large and underestimation of small fish when fish co-occur in denser aggregations. In Lake Stechlin, the difference between echo counting and echo integration might be less prominent because coregonids strongly disperse spatially while ascending into the upper hypolimnion during the night [25]. Therefore, fish shoals are rare at night, and the vast majority of fish are recorded as single echoes. These two studies together suggest that hydroacoustic methods may generate reliable SS, in particular if based on TEGs to combine several successive echoes into one trace.
It is not surprising that the size distributions between net catches and hydroacoustics differed, in particular in years when the proportion of small coregonids was high. Exponent b of the SS from trawling was lowest in the year 2017 (−2.0) when we caught an unusually high number of 0+ coregonids in the mass range of 1–3 g just in one haul. We do not know the reason for the strong spatial aggregation of these young fish, but it was obvious that this aggregation was not comparably recorded by the 12 km of hydroacoustic transects from the entire lake because the exponents b of hydroacoustic methods in 2017 were also within the range observed in the other years. Therefore, exponent b differed most strongly between the methods in this year, and the correlations among the methods would have been much stronger without the 2017 data pairs. Coregonids are well known for strongly varying year-class strengths in response to annual differences in temperature successions of the lake [48,49,50,51]. Therefore, it is likely that monitoring the fish community by trawl net catches as conducted in Lake Stechlin may overestimate the densities of certain size classes if these are spatially aggregated. Due to the morphometry of the lake, trawling can be conducted only in a limited part of the lake (mainly in the central and north basins); hence, one could argue that this method is more prone to biases from local aggregations than hydroacoustics, which records the fish density and size all over the lake. However, SS based on transects from only the CB have shown that they do not differ significantly in comparison to estimates of b from the entire lake in individual years. Therefore, hydroacoustics does not reveal any systematic differences in fish size among basins of Lake Stechlin.
The arithmetic mean of exponent b across all methods was about −0.5. It is difficult to compare this value with SS estimates obtained in other lakes [10,23]. First, we calculated SS as based on fish mass, which have a systematically shallower slope or exponent than those based on fish length [13]. Second, instead of log binning, we applied continuous size distributions, by assuming that this approach fits the often-curvilinear size distributions [1,24,52] better than linear SS. However, exponent b of these continuous distributions is not an exact equivalent of the slope of log-linear size distributions [39]. Third, the pelagic fish community in Lake Stechlin is essentially composed of two sympatric coregonid species. In contrast, community SS of fish should ideally include at least both prey and predator species and may combine prey species with differing feeding modes (e.g., planktivores and benthivores). Only if predator–prey interactions are directly included into the size spectrum can theoretical assumptions about the slope of log-linear SS be applied because these are based on bioenergetics principles [5]. For example, if severe predation by numerous piscivorous fishes in Lake Stechlin reduced the proportion of small coregonids in the pelagic area of Lake Stechlin, the slope (or exponent) of the size spectrum would become shallower through the smaller number of small (prey) and the bigger number or large (predator) fishes. However, earlier studies have shown that the density of piscivorous predators in the pelagic area of Lake Stechlin is very low [53]. Therefore, there is no massive predation on the coregonids.
Although no significant trend was observed, the estimates of exponent b based on TEGs have become less negative in recent years, indicating that the size distribution of coregonids has gradually changed. This trend was not obvious in exponent b from the trawl catches, but we indeed recorded a bigger number of larger coregonids (>30 g) in trawl catches in recent years and found single individuals with more than 50 g not recorded in any of the previous years since the start of monitoring in 2005. These changes in size distribution may reflect an enhanced growth rate of coregonids, likely caused by the recently accelerated eutrophication of Lake Stechlin [29]. Furthermore, [29] revealed that hydroacoustically determined fish abundances were negatively correlated with zooplankton taxa forming the diet of the coregonids, whereas no such correlations were found for fish biomasses as obtained by trawling. This could indicate that hydroacoustics may reflect the actual state, including abundance, biomass, and size distribution, of the fish community better than trawling, allowing for more reliable insights into ecological interactions. More detailed explorations of trophic interactions and the consequences of enhanced eutrophication on Lake Stechlin food webs are necessary, but our hydroacoustic records may be a helpful tool to document the effects of environmental change on the population dynamics of the coregonids in Lake Stechlin.

5. Conclusions

In conclusion, hydroacoustic methods allow for a faster and more efficient assessment of the pelagic fish community in the deep Lake Stechlin, compared with the monitoring by trawl catches. In contrast to net sampling, hydroacoustics does not induce fish mortality, and larger and shallower areas of the lake can be sampled systematically, while not underestimating large fishes as trawling does. Effects of eutrophication of Lake Stechlin in recent years on fish growth rates were exclusively reflected by hydroacoustic methods. Reliable SS can be obtained from hydroacoustic records (see also [24]), which may complement SS as obtained from net fishing. These records may help to detect and interpret environmental changes occurring in this lake. However, we have to admit that the accuracy of pelagic community size distributions can only be improved if hydroacoustics is applied. Currently, there is no way to evaluate the truthfulness of either fishing or hydroacoustics with respect to their estimations of fish size distribution. Ground truthing of fish densities and size distributions in lakes is still one of the unresolved challenges in fish ecology and management [54].

Author Contributions

Contributions of individual authors are follows: Conceptualization, L.-M.B. and T.M.; methodology, L.-M.B. and T.M.; formal analysis, L.-M.B.; writing—original draft preparation, L.-M.B.; writing—review and editing, T.M.; visualization, L.-M.B. Both authors have read and agreed to the published version of the manuscript.

Funding

This research was financially supported by a grant from the German Research Foundation to Thomas Mehner (DFG, grant number Me 1686/7-1).

Institutional Review Board Statement

Not applicable.

Informed Consent Statement

Not applicable.

Data Availability Statement

All data are curated and stored in databases of IGB and can be made available on request to the authors. Long-term monitoring data of Lake Stechlin are available at the Leibniz-Institute of Freshwater Ecology and Inland Fisheries Freshwater Research and Environmental Database (https://fred.igb-berlin.de/; accessed on 1 February 2020).

Acknowledgments

We would like to thank Alex Türck, Jan Hallermann, Asja Vogt, Christian Helms, Kathrin Jaeschke, Jeanette Völker, and several doctoral students who supported the monitoring of Lake Stechlin fishes over the years.

Conflicts of Interest

The authors declare no conflict of interest. The funders had no role in the design of the study; in the collection, analyses, or interpretation of data; in the writing of the manuscript, or in the decision to publish the results.

Appendix A

Figure A1. Fish SS with counts and body wet mass (g) fitted using the maximum likelihood estimate of exponent b with the 95% confidence interval of b based on trawling surveys for 2006–2010.
Water 13 01559 g0a1
Figure A2. Fish SS with counts and body wet mass (g) fitted using the maximum likelihood estimate of exponent b with the 95% confidence interval of b based on trawling surveys for 2011–2014.
Water 13 01559 g0a2
Figure A3. Fish SS with counts and body wet mass (g) fitted using the maximum likelihood estimate of exponent b with the 95% confidence interval of b based on trawling surveys for 2015–2018.
Water 13 01559 g0a3
Figure A4. Fish SS with counts and body wet mass (g) fitted using the maximum likelihood estimate of exponent b with the 95% confidence interval of b based on SEDs from hydroacoustic surveys for 2006–2010.
Water 13 01559 g0a4
Figure A5. Fish SS with counts and body wet mass (g) fitted using the maximum likelihood estimate of exponent b with the 95% confidence interval of b based on SEDs from hydroacoustic surveys for 2011–2014.
Water 13 01559 g0a5
Figure A6. Fish SS with counts and body wet mass (g) fitted using the maximum likelihood estimate of exponent b with the 95% confidence interval of b based on SEDs from hydroacoustic surveys for 2015–2019.
Water 13 01559 g0a6
Figure A7. Fish SS with counts and body wet mass (g) fitted using the maximum likelihood estimate of exponent b with the 95% confidence interval of b based on track echo group (TEG) detection from hydroacoustic surveys for 2006–2010.
Water 13 01559 g0a7
Figure A8. Fish SS with counts and body wet mass (g) fitted using the maximum likelihood estimate of exponent b with the 95% confidence interval of b based on track echo group (TEG) detection from hydroacoustic surveys for 2011–2014.
Water 13 01559 g0a8
Figure A9. Fish SS with counts and body wet mass (g) fitted using the maximum likelihood estimate of exponent b with the 95% confidence interval of b based on the tracked-echo group (TEG) from hydroacoustic surveys for 2015–2019.
Water 13 01559 g0a9

Appendix B

Table A1. Exponent b from maximum likelihood estimation for each method, including hydroacoustics based on single-echo detection (SED) and tracked-echo groups (TEGs) of fish between 1–50 g body weight for 2006–2019 (excluding 2007 and 2016) from transects of the whole lake (WL) and the central basin (CB) only.
YearExponent b
TEG (WL)SED (WL)TEG (CB)SED (CB)Trawl
2006−0.56−0.67−0.61−0.71−1.01
2008−0.61−0.77−0.69−0.88−0.40
2009−0.41−0.55−0.32−0.50−0.60
2010−0.42−0.63−0.43−0.650.10
2011−1.02−1.25−1.03−1.25−0.68
2012−0.58−0.72−0.59−0.72−1.44
2013−0.46−0.53−0.45−0.54−0.76
2014−0.06−0.14−0.09−0.160.42
2015−0.43−0.67−0.45−0.670.04
2017−0.24−0.77−0.29−0.73−2.01
2018−0.15−0.24−0.15−0.22−0.79
2019−0.35−0.56−0.38−0.570.31

References

  1. Emmrich, M.; Brucet, S.; Ritterbusch, D.; Mehner, T. Size spectra of lake fish assemblages: Responses along gradients of general environmental factors and intensity of lake-use. Freshw. Biol. 2011, 56, 2316–2333. [Google Scholar] [CrossRef]
  2. Murry, B.A.; Farrell, J.M. Resistance of the size structure of the fish community to ecological perturbations in a large river ecosystem. Freshw. Biol. 2014, 59, 155–167. [Google Scholar] [CrossRef]
  3. Marquet, P.A.; Quiñones, R.A.; Abades, S.; Labra, F.; Tognelli, M.; Arim, M.; Rivadeneira, M. Scaling and power-laws in ecological systems. J. Exp. Biol. 2005, 208, 1749–1769. [Google Scholar] [CrossRef] [PubMed] [Green Version]
  4. Woodward, G.; Ebenman, B.; Emmerson, M.; Montoya, J.M.; Olesen, J.M.; Valido, A.; Warren, P.H. Body size in ecological networks. Trends Ecol. Evol. 2005, 20, 402–409. [Google Scholar] [CrossRef] [Green Version]
  5. Peters, R. The Ecological Implications of Body Size; Cambridge University Press: Cambridge, UK, 1983. [Google Scholar]
  6. Calder, W. Size, Function, and Life History; Harvard University Press: Cambridge, MA, USA, 1984. [Google Scholar]
  7. Thiebaux, M.L.; Dickie, L.M. Models of aquatic biomass size spectra and the common structure of their solutions. J. Theor. Biol. 1992, 159, 147–161. [Google Scholar] [CrossRef]
  8. Trebilco, R.; Baum, J.K.; Salomon, A.K.; Dulvy, N.K. Ecosystem ecology: Size-based constraints on the pyramids of life. Trends Ecol. Evol. 2013, 28, 423–431. [Google Scholar] [CrossRef] [PubMed]
  9. Sheldon, R.W.; Prakash, A.; Sutcliffe, W.H. The size distribution of particles in the ocean. Limnol. Oceanogr. 1972, 17, 327–340. [Google Scholar] [CrossRef] [Green Version]
  10. Kerr, S.; Dickie, L. The Biomass Spectrum: A Predator-Prey Theory of Aquatic Production; Columbia University Press: New York, NY, USA, 2001. [Google Scholar]
  11. Shin, Y.-J.; Rochet, M.-J.; Jennings, S.; Field, J.G.; Gislason, H. Using size-based indicators to evaluate the ecosystem effects of fishing. ICES J. Mar. Sci. 2005, 62, 384–396. [Google Scholar] [CrossRef] [Green Version]
  12. Ahrens, M.A.; Peters, R.H. Plankton community respiration: Relationships with size distribution and lake trophy. Hydrobiologia 1991, 224, 77–87. [Google Scholar] [CrossRef]
  13. Sprules, W.G.; Barth, L.E. Surfing the biomass size spectrum: Some remarks on history, theory, and application. Can. J. Fish. Aquat. Sci. 2016, 73, 477–495. [Google Scholar] [CrossRef]
  14. Blanchard, J.L.; Dulvy, N.K.; Jennings, S.; Ellis, J.R.; Pinnegar, J.K.; Tidd, A.; Kell, L.T. Do climate and fishing influence size-based indicators of Celtic Sea fish community structure? ICES J. Mar. Sci. 2005, 62, 405–411. [Google Scholar] [CrossRef]
  15. Bianchi, G.; Gislason, H.; Graham, K.; Hill, L.; Jin, X.; Koranteng, K.; Manickchand-Heileman, S.; Payá, I.; Sainsbury, K.; Sanchez, F.; et al. Impact of fishing on size composition and diversity of demersal fish communities. ICES J. Mar. Sci. 2000, 57, 558–571. [Google Scholar]
  16. Cottingham, K. Nutrients and zooplankton as multiple stressors of phytoplankton communities: Evidence from size structure. Limnol. Oceanogr. 1999, 44, 810–827. [Google Scholar] [CrossRef]
  17. Cózar, A.; García, C.M.; Gálvez, J.A. Analysis of plankton size spectra irregularities in two subtropical shallow lakes (Esteros del Iberá, Argentina). Can. J. Fish. Aquat. Sci. 2003, 60, 411–420. [Google Scholar] [CrossRef]
  18. Chopin, F.S.; Arimoto, T. The condition of fish escaping from fishing gears—A review. Fish. Res. 1995, 21, 315–327. [Google Scholar] [CrossRef]
  19. Olin, M.; Malinen, T.; Ruuhijärvi, J. Gillnet catch in estimating the density and structure of fish community-Comparison of gillnet and trawl samples in a eutrophic lake. Fish. Res. 2009, 88–94. [Google Scholar] [CrossRef]
  20. Bonvechio, T.F.; Pouder, W.F.; Hale, M.M. Variation between Electrofishing and Otter Trawling for Sampling Black Crappies in Two Florida Lakes. N. Am. J. Fish. Manag. 2008, 28, 188–192. [Google Scholar] [CrossRef]
  21. Prchalová, M.; Mrkvička, T.; Peterka, J.; Čech, M.; Berec, L.; Kubečka, J. A model of gillnet catch in relation to the catchable biomass, saturation, soak time and sampling period. Fish. Res. 2011, 107, 201–209. [Google Scholar] [CrossRef]
  22. Simmonds, J.; MacLennan, D.N. Fisheries Acoustics Theory and Practice, 2nd ed.; John Wiley & Sons: New York, NY, USA, 2008. [Google Scholar]
  23. Wheeland, L.J.; Rose, G.A. Acoustic measures of lake community size spectra. Can. J. Fish. Aquat. Sci. 2016, 73, 557–564. [Google Scholar] [CrossRef] [Green Version]
  24. De Kerckhove, D.T.; Shuter, B.J.; Milne, S. Acoustically derived fish size spectra within a lake and the statistical power to detect environmental change. Can. J. Fish. Aquat. Sci. 2016, 73, 565–574. [Google Scholar] [CrossRef] [Green Version]
  25. Mehner, T.; Kasprzak, P.; Hölker, F. Exploring ultimate hypotheses to predict diel vertical migrations in coregonid fish. Can. J. Fish. Aquat. Sci. 2007, 64, 874–886. [Google Scholar] [CrossRef]
  26. Emmrich, M.; Helland, I.P.; Busch, S.; Schiller, S.; Mehner, T. Hydroacoustic estimates of fish densities in comparison with stratified pelagic trawl sampling in two deep, coregonid-dominated lakes. Fish. Res. 2010, 105, 178–186. [Google Scholar] [CrossRef]
  27. Emmrich, M.; Winfield, I.J.; Guillard, J.; Rustabakken, A.; Verges, C.; Volta, P.; Jeppesen, E.; Lauridsen, T.L.; Brucet, S.; Holmgren, K.; et al. Strong correspondence between gillnet catch per unit effort and hydroacoustically derived fish biomass in stratified lakes. Freshw. Biol. 2012, 57, 2436–2448. [Google Scholar] [CrossRef] [Green Version]
  28. Draštík, V.; Godlewska, M.; Balk, H.; Clabburn, P.; Kubečka, J.; Morrissey, E.; Hateley, J.; Winfield, I.J.; Mrkvička, T.; Guillard, J. Fish hydroacoustic survey standardization: A step forward based on comparisons of methods and systems from vertical surveys of a large deep lake. Limnol. Oceanogr. Methods 2017, 15, 836–846. [Google Scholar] [CrossRef]
  29. Braun, L.-M.; Brucet, S.; Mehner, T. Top-down and bottom-up effects on zooplankton size distribution in a deep stratified lake. Aquat. Ecol. 2021, 8, 1–17. [Google Scholar] [CrossRef]
  30. Selmeczy, G.B.; Tapolczai, K.; Casper, P.; Krienitz, L.; Padisák, J. Spatial-and niche segregation of DCM-forming cyanobacteria in Lake Stechlin (Germany). Hydrobiologia 2016, 764, 229–240. [Google Scholar] [CrossRef]
  31. Bartrons, M.; Mehner, T.; Argillier, C.; Beklioglu, M.; Blabolil, P.; Hesthagen, T.; Holmgren, K.; Jeppesen, E.; Krause, T.; Podgornik, S.; et al. Energy-based top-down and bottom-up relationships between fish community energy demand or production and phytoplankton across lakes at a continental scale. Limnol. Oceanogr. 2020, 65, 892–902. [Google Scholar] [CrossRef]
  32. Koschel, R.; Adams, D. Lake Stechlin—An approach to understanding an oligotrophic lowland lake. Adv. Limnol. 2003, 58, 1–311. [Google Scholar]
  33. Anwand, K.; Valentin, M.; Mehner, T. Species composition, growth and feeding ecology of fish community in Lake Stechlin—An overview. Adv. Limnol. 2003, 58, 237–246. [Google Scholar]
  34. Mehner, T.; Schulz, M. Monthly variability of hydroacoustic fish stock estimates in a deep lake and its correlation to gillnet catches. J. Fish Biol. 2002, 61, 1109–1121. [Google Scholar] [CrossRef]
  35. Helland, I.P.; Freyhof, J.; Kasprzak, P.; Mehner, T. Temperature sensitivity of vertical distributions of zooplankton and planktivorous fish in a stratified lake. Oecologia 2007, 151, 322–330. [Google Scholar] [CrossRef]
  36. Wanke, T.; Brämick, U.; Mehner, T. High stock density impairs growth, female condition and fecundity, but not quality of early reproductive stages in vendace (Coregonus albula). Fish. Res. 2017, 186, 159–167. [Google Scholar] [CrossRef]
  37. Mehner, T. Prediction of hydroacoustic target strength of vendace (Coregonus albula) from concurrent trawl catches. Fish. Res. 2006, 79, 162–169. [Google Scholar] [CrossRef]
  38. Balk, H.; Lindem, T. Sonar-4 and Sonar-5 Post Processing System; Operator Manual Version 604; Lindem Data Acquisition: Oslo, Norway, 2017. [Google Scholar]
  39. Edwards, A.M.; Robinson, J.P.W.; Plank, M.J.; Baum, J.K.; Blanchard, J.L. Testing and recommending methods for fitting size spectra to data. Methods Ecol. Evol. 2017, 8, 57–67. [Google Scholar] [CrossRef]
  40. Page, R. Aftershocks and microaftershocks of the great Alaska earthquake of 1964. Bull. Seismol. Soc. Am. 1968, 58, 1131–1168. [Google Scholar]
  41. Edwards, A.M. Overturning conclusions of Lévy flight movement patterns by fishing boats and foraging animals. Ecology 2011, 92, 1247–1257. [Google Scholar] [CrossRef]
  42. Hilborn, R.; Mangel, M. The Ecological Detective. Confronting Models with Data; Princeton University Press: Princeton, NJ, USA, 1997; Volume 28. [Google Scholar]
  43. Shapiro, S.S.; Wilk, M.B. An analysis of variance test for normality (complete samples). Biometrika 1965, 52, 591–611. [Google Scholar] [CrossRef]
  44. Team R Core. R: A Language and Environment for Statistical Computing; R Foundation for Statistical Computing: Vienna, Austria, 2020; Available online: https://www.r-project.org/ (accessed on 8 March 2020).
  45. Edwards A Accounting for the bin structure of data removes bias when fitting size spectra. Mar. Ecol. Prog. Ser. 2020, 636, 19–33. [CrossRef]
  46. Peck, M.A.; Buckley, L.J.; Bengtson, D.A. Effects of temperature and body size on the swimming speed of larval and juvenile Atlantic cod (Gadus morhua): Implications for individual-based modelling. Environ. Biol. Fishes 2006, 75, 419–429. [Google Scholar] [CrossRef]
  47. Schmidt, M.B. Reactions of vendace (Coregonus albula, Linnaeus 1758) towards an approaching pelagic pair-trawl observed by split-beam echosounding. Fish. Res. 2009, 96, 95–101. [Google Scholar] [CrossRef]
  48. Viljanen, M.; Väisänen, P.; Turunen, T. Fluctuations in year-class strength and growth of the vendace (Coregonus albula (L.)) in the small, mesohumic, oligotrophic Suomunjärvi, a lake in eastern Finland. Ann. Zool. Fennici 2004, 41, 241–248. [Google Scholar]
  49. Helminen, H.; Sarvala, J. Population regulation of vendace (Coregonus albula) in Lake Pyhäjärvi, southwest Finland. J. Fish Biol. 1994, 45, 387–400. [Google Scholar] [CrossRef]
  50. Auvinen, H.; Karjalainen, J.; Viljanen, M. Internationale Vereinigung für theoretische und angewandte Limnologie: Verhandlungen Fluctuation of year-class strength of vendace (Coregonus albula (L.)) in Lake Onkamo, eastern Finland. Verh. Inrernat. Verein. Limnol 2000, 27, 2057–2062. [Google Scholar] [CrossRef]
  51. Mehner, T.; Emmrich, M.; Kasprzak, P. Discrete thermal windows cause opposite response of sympatric cold-water fish species to annual temperature variability. Ecosphere 2011, 2, 1–16. [Google Scholar] [CrossRef]
  52. Arranz, I.; Mehner, T.; Benejam, L.; Argillier, C.; Holmgren, K.; Jeppesen, E.; Lauridsen, T.L.; Volta, P.; Winfield, I.J.; Brucet, S. Density-dependent effects as key drivers of intraspecific size structure of six abundant fish species in lakes across Europe. Can. J. Fish. Aquat. Sci. 2016, 73, 519–534. [Google Scholar] [CrossRef] [Green Version]
  53. Mehner, T.; Busch, S.; Helland, I.P.; Emmrich, M.; Freyhof, J. Temperature-related nocturnal vertical segregation of coexisting coregonids. Ecol. Freshw. Fish 2010, 19, 408–419. [Google Scholar] [CrossRef]
  54. Kubečka, J.; Hohausová, E.; Matěna, J.; Peterka, J.; Amarasinghe, U.S.; Bonar, S.A.; Hateley, J.; Hickley, P.; Suuronen, P.; Tereschenko, V.; et al. The true picture of a lake or reservoir fish stock: A review of needs and progress. Fish. Res. 2009, 96, 1–5. [Google Scholar] [CrossRef]
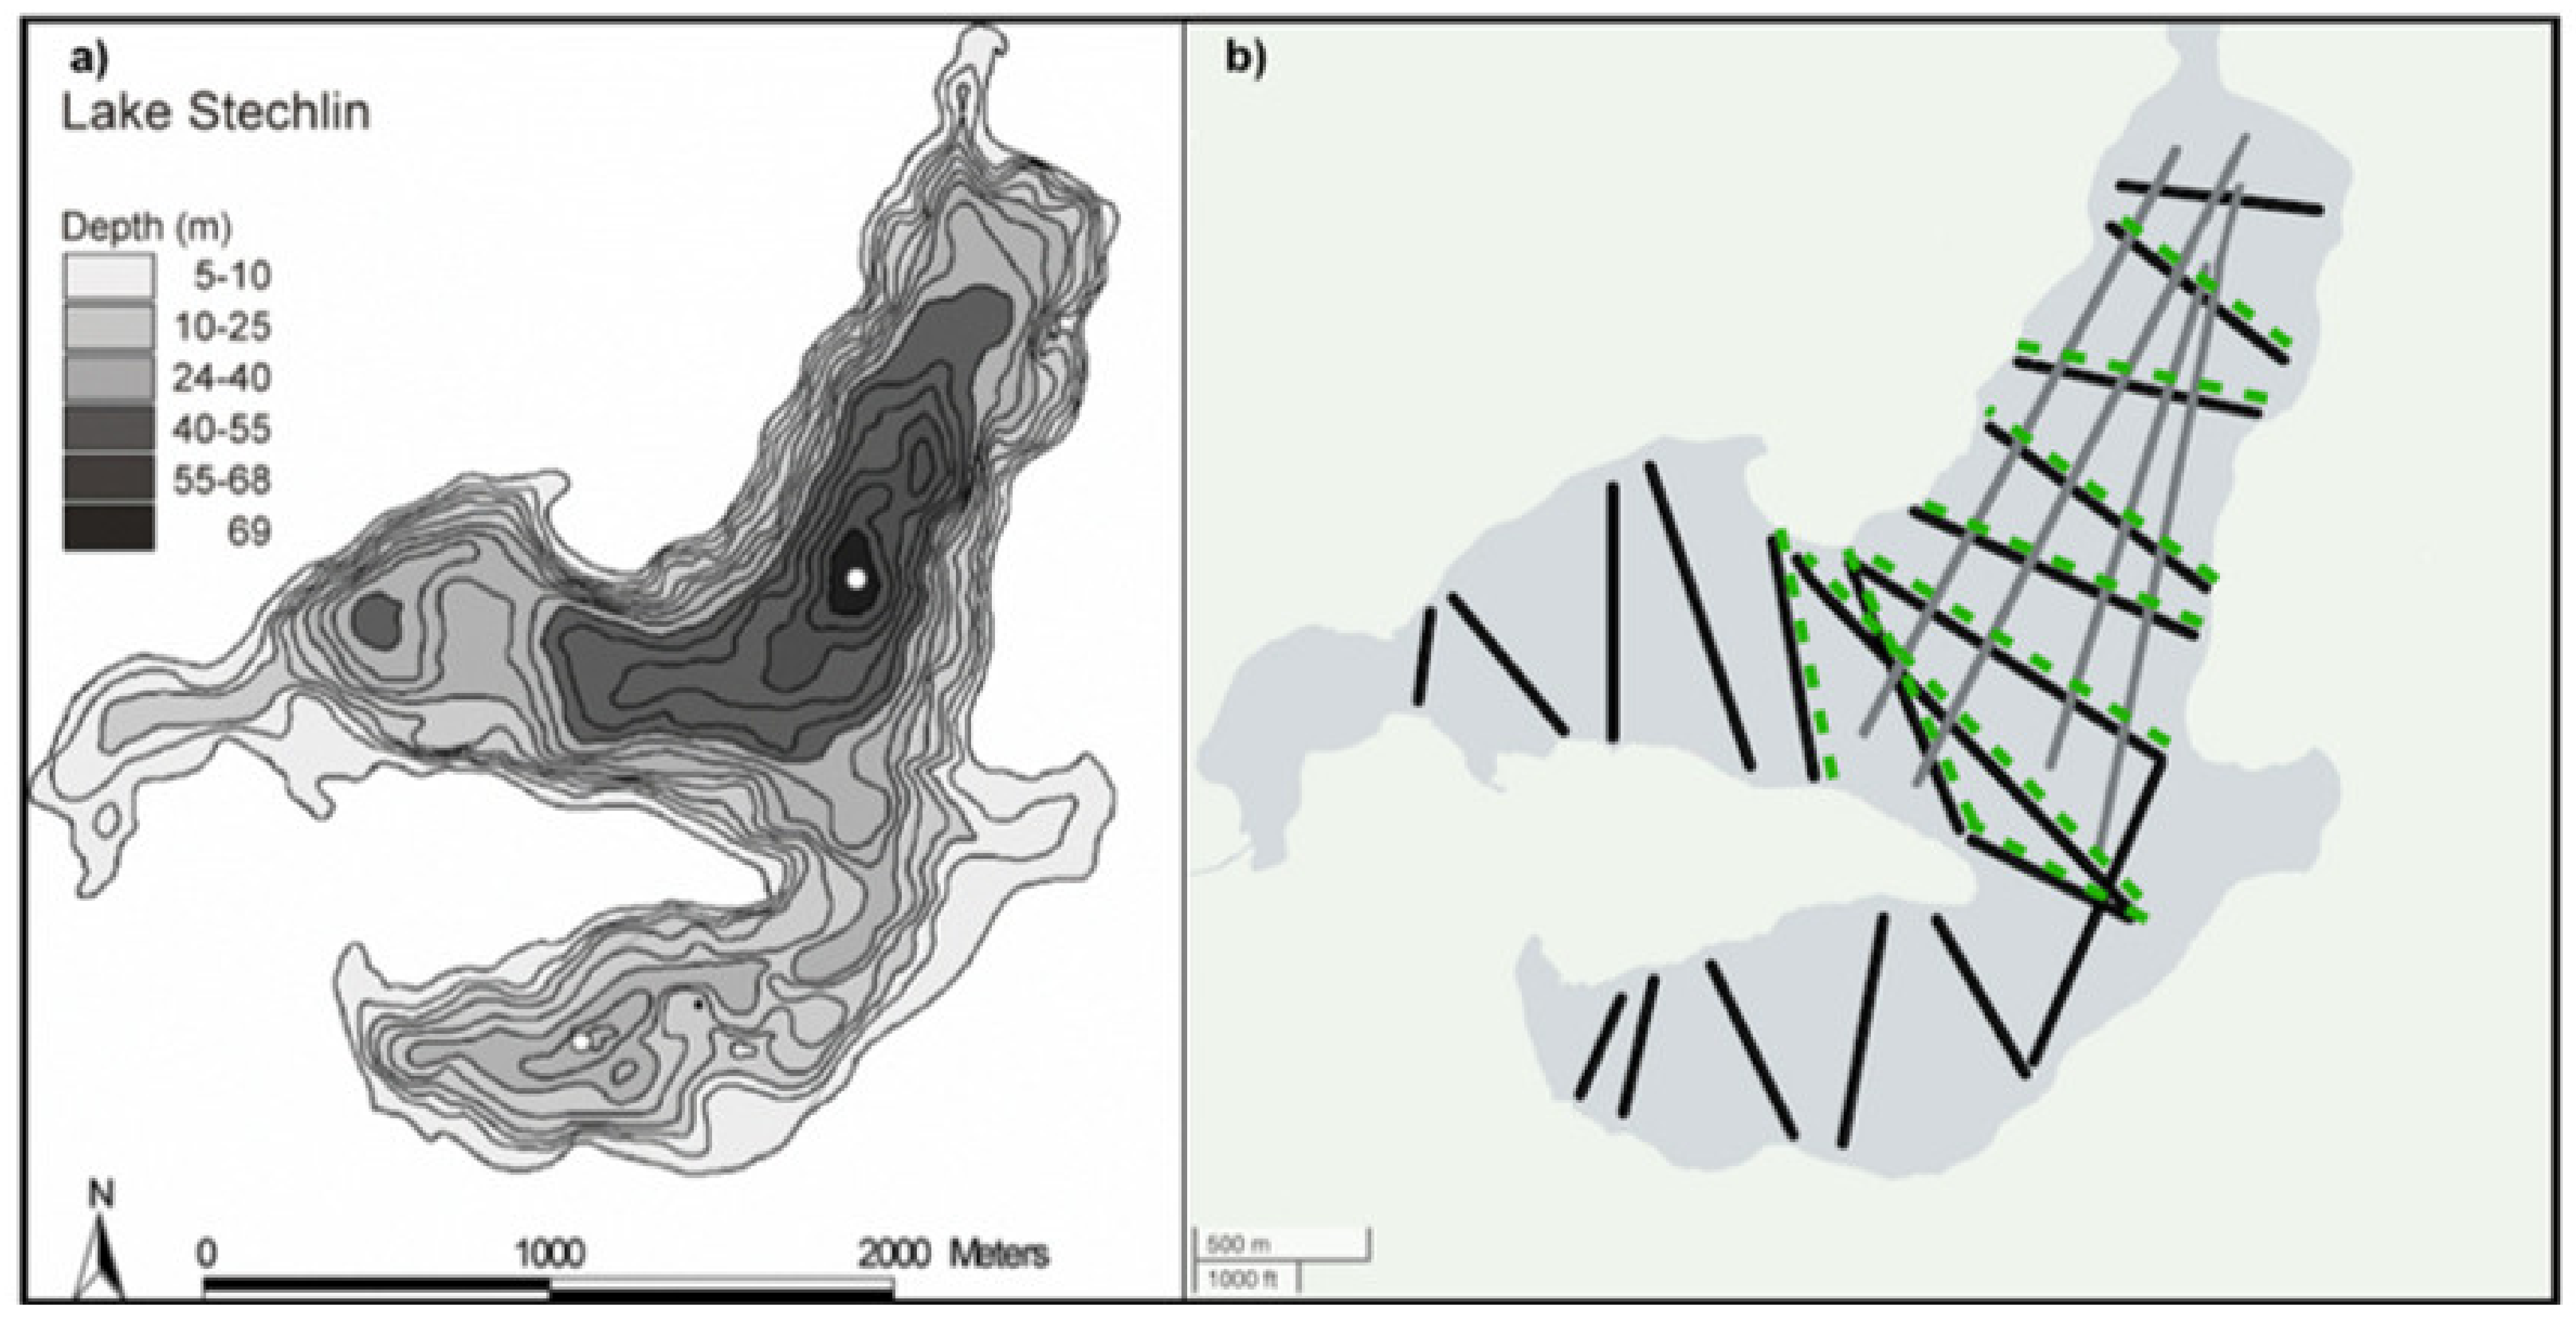
Figure 1. Bathymetric map of Lake Stechlin (a) and diagram with transects from hydroacoustic surveys of the whole lake (WL; black), midwater trawling (grey), and with transects from hydroacoustic surveys in the central and northern basin (CB) that overlap with trawling transects (green) (b).
Water 13 01559 g001
Figure 2. Frequency distributions based on absolute numbers of all sampled fish within 5 g body weight (g) size classes from hydroacoustic surveys, including single-echo detections (SEDs) (A), tracked-echo groups (TEGs) (B), and pelagic midwater trawl catches (C) for survey years between 2006 and 2019 (excluding 2007 and 2016) in Lake Stechlin based on transects of the whole lake (WL).
Water 13 01559 g002
Figure 3. Scatter plot and Spearman rank correlation between estimates of “b” from the whole lake (WL) and central basin (CB) based on single-echo detections (SEDs) (A) and tracked-echo groups (TEGs) (B).
Water 13 01559 g003
Figure 4. Size spectrum exponents b with lower and upper bounds of the 95% confidence interval of b indicated with error bars for trawling (A) and hydroacoustic single-echo detections (SED) (B) and tracked-echo groups (TEG) with a linear regression line from a weakly significant trend (C) to check for a temporal change in size distributions of fish between 1 and 50 g body weight for survey years between 2006 and 2019 (excluding 2007 and 2016).
Water 13 01559 g004
Figure 5. Scatter plot and Spearman rank correlation of exponents b between trawling and hydroacoustic tracked-echo groups (TEGs) (A), trawling and hydroacoustic single-echo detections (SEDs) (B), and between hydroacoustic SEDs and TEGs (C).
Water 13 01559 g005
Table 1. Determination of rounded weighting factors (WF) for fish abundance (e.g., for 2009) from trawling in four water depths where the calculated WF was rounded to the nearest half integer to be used for continuous size distributions. In this example year, the maximum volume (m3) fished at 14 m depth was divided by the fished volume (m3) in the other respective layers to determine the WF, which was then rounded to the nearest half integer.
YearDepth (m)Volume [m3]WFRounded (WF)
20091415,16711
20092010,5001.441
20093250003.033
20094080001.892
Table 2. Single-echo detection (SED) and tracked-echo group (TEG) parameters used in Sonar5 Pro.
ParameterValue
Single-echo detection (SED)
Target Strength threshold−55 dB
Minimum target size−80 dB
Minimum echo length0.5
Maximum echo length1.6
Maximum gain compensation3.0 dB
Maximum angle standard deviation0.80
Tracked-echo group (TEG)
Minimum number of pings in track3 pings
Maximum gap between single targets1 ping
Vertical gating range0.3 m
Table 3. Results for size spectra of fish with 1–50 g body weight fitted with maximum likelihood estimation with the mean (±SD), minimum, and maximum of exponent b for each method, including trawling and hydroacoustics based on single-echo detections (SEDs) and tracked-echo groups (TEGs) for 2006–2019 (excluding 2007 and 2016) for the whole lake (WL) and only transects from hydroacoustic surveys that overlap with trawl catches in the central lake basin (CB).
Exponent b
MethodMeanSDMinMax
Trawl−0.560.72−2.00 0.41
SEDWL−0.730.27−1.37−0.36
TEGWL−0.440.24−1.2−0.05
SEDCB−0.630.28−1.25−0.16
TEGCB−0.450.25−1.03−0.08
Publisher’s Note: MDPI stays neutral with regard to jurisdictional claims in published maps and institutional affiliations.