Article

Velocity Field and Turbulence Structure around Spur Dikes with Different Angles of Orientation under Ice Covered Flow Conditions

School of Engineering, University of Northern British Columbia, Prince George, BC V2N 4Z9, Canada
*
Author to whom correspondence should be addressed.
Water 2021, 13(13), 1844; https://doi.org/10.3390/w13131844
Submission received: 10 May 2021 / Revised: 25 June 2021 / Accepted: 27 June 2021 / Published: 1 July 2021
(This article belongs to the Special Issue Fluvial Hydraulics Affected by River Ice and Hydraulic Structures)

Abstract

:
Spur dikes are well-known structures that are widely used in rivers and coastal regions. Depending on their types, sizes, and orientation angles, spur dikes can substantially change flow characteristics. Results of previous studies indicate that the presence of an ice cover in rivers can cause complicated flow structures. The present experimental study investigates velocity fields and turbulence structures in the vicinity of spur dikes under ice cover with different roughness coefficients. The spur dikes were set up at the following three angles of orientation, 90°, 60°, and 45°. Our results show that the strongest velocity fluctuation occurs immediately above the scour hole surface and very close to the dike tip. The increase in the dike angle toward upstream, the velocity component values increase, leads to a larger scour hole. Results show that an increase in dike angle of each 10° (from 45° to 90°) increases the scour depth between 5% and 10%, depending on flow conditions. Furthermore, the increase in the cover roughness coefficient and the blockage ratio of a spur dike leads to a further increase in turbulence kinetic energy and 3D velocity components values. The findings of this study imply that the appearance of an ice cover can increase turbulence intensities up to nearly 30%.

1. Introduction

Spur dikes are extended structures where one end is at the riverbank, and the other one is projected toward the river flow [1]. These constructions have been widely used for many purposes, such as river bank protection, flood control, improvement of a navigational course, control of scour process, landscape improvement, and ecosystem restoration [2]. Regardless of the different types of spur dikes, they redirect flow from the river bank and affect the flow regime, flow velocity, sediment transportation, and consequently scour process [3].
If a spur dike allows the flow to pass through it, that is called permeable. If the dikes block and then repel the river flow, it is called impermeable. Since the channel width is reduced by impermeable spur dikes, the energy gradient becomes steeper, and flow velocity increases. Consequently, the riverbed will be eroded. The scour process will be affected by the shape and size of the spur dike, features of bed material, and flow conditions [4]. Zhang et al. [5] investigated bed morphology, sediment distribution, and flow field in a channel with a series of impermeable spur dikes on both sides of the channel. They claimed that the flow field and local scour around the most upstream pairs of spur dikes are affected the most. Teraguchi et al. [6] studied flow field and scour patterns around spur dikes based on laboratory experiments and numerical simulations. They pointed out that the scour holes on the upstream side of the impermeable spur dikes are larger and deeper than those of permeable ones. Mizutani et al. [7] investigated the impact of the spur dike height and grain size of riverbed material on the morphology and topography around an impermeable spur dike. It was found that the maximum scour depth is reduced with the increase of the median particle size of bed materials. Furthermore, field observations regarding the bed deformation around stone-lined spur dikes in the Akashi river indicate that the maximum scoured depth around the permeable spur dikes is reduced to 40% comparing to that around the impermeable ones [8]. Clearly, the local scour depth around the impermeable spur dikes is much deeper than the permeable ones.
The spur dikes in channels can be classified as submerged and non-submerged spur dikes depending on the flow conditions and water depth. Normally, the impermeable spur dikes are designed as non-submerged spur dikes because the overflow on the top of a dike can form a vertical jet just behind the spur dike. This vertical jet moves toward the downstream and causes a significant erosion of the downstream bank along with the body of the spur dike itself [9]. Moreover, in terms of the orientation angle of a spur dike which is defined as the angle between the dike axis and the river flow direction, spur dikes are divided into three groups: Attracting, deflecting, and repelling dikes. The attracting spur dike which points downstream averts the river flow toward the middle of the channel and protects the region on its downstream side. Deflecting spur dike is a well-known type that changes the river flow direction by not repelling it; this type of spur dike is normally used to locally protect the banks against erosion. They create a turbulent flow, cause more sediment transportation in the middle of the rivers and make the main channel deeper [2]. Muto et al. [10] conducted two experimental studies about the effects of the opening ratio and water depth on the velocity distributions. Their first study was based on experiments in the Yodo river in Japan using large-scale particle image velocimetry. The second one was conducted in a laboratory flume with a downscaled spur dike. They pointed out that the flow was highly unsteady inside the scour hole based on the experiment in the field. However, laboratory results did not show the same characteristics. As the authors concluded that the difference in the result of the field experiment from that of the laboratory was caused by the complex bathymetry of the natural river and lower Reynolds numbers of flows in the laboratory.
Further research shows that models developed from a steady, uniform flow cannot be applied for nonuniform flows [11,12]. Duan et al. [13] construe that dikes increase shear stress and turbulence intensities at the riverbed by converging water flow which initiates the local scour process around the dikes. A two-dimensional (2D) experimental model has been used to evaluate the effect of turbulence intensities on the entrainment of bed material (coarse sand and gravel). It appears that the instantaneous streamwise velocity has a higher rate compared to the instantaneous vertical velocity [14]. An experimental study on a three-dimensional (3D) flow illuminates that the local scour around the dike causes more complexity of the flow field [15]. Dey and Barbhuiya [16] assessed the turbulent flow field around a vertical-wall abutment and reported that the near-bed Reynolds stress played a significant role in transporting sediment and scour process.
The turbulence structure in an open channel flow has been investigated by many researchers, since it plays an important role in the flow characteristics and the local scour process around the dike. However, nearly all reported research has been conducted under the open channel flow condition. The impact of an ice cover on the local scour process around the spur dikes has not been investigated. In cold regions, such as Canada, ice covers appear on rivers’ surfaces and may last for about six months, such as the upper reach and middle reach of the Fraser River. During an ice-covered flow condition, the river hydrology will be dramatically changed comparing to that under an open flow condition. An ice cover adds an extra hydraulic boundary to the flow in a river, which leads to considerable changes in the velocity profile, flow rate, bed shear stress distribution, sediment transport, and consequently scour pattern [17].
Under an ice-covered flow condition, the location of the maximum flow velocity gets closer to the channel bed, which increases the bed shear stress [18,19,20]. In conclusion, the presence of ice on the water surface makes the flow condition much more complicated than an open flow condition. Namely, the existence of an ice cover leads to the increase in the turbulence kinetic energy at the riverbed. Thus, the Reynolds shear stress under an ice-covered flow condition is different from that under an open flow condition. This change affects the incipient motion of bed material, rate of sediment transportation, and sediment suspension loads which make evaluating (predicting) local scour more complex [18,21,22]. To our knowledge, there is no research regarding the effect of an ice cover on the local scour process around the spur dikes. Moreover, measurements of the turbulence flow fields inside scour holes around the spur dikes under an ice-covered flow condition have never been conducted.
Many factors affect the design of a spur dike, such as the river width and depth, flow velocity, channel sinuosity, grain size of bed material, sediment transport rate, bank cohesiveness, the length and shape of a spur dike, the orientation angle of the spur dike to the flow, and construction materials. Understanding the characteristics of the flow in the vicinity of a spur dike under an ice cover will help to develop formulas that can accurately estimate the scour depth and elaborate models for the design of spur dikes. Additionally, it can provide a better understanding of the turbulence structure around obstacles equivalent to spur dikes, such as boulders. The specific objectives of the present experimental study are summarized as follows:
  • The impact of an ice cover, including ice cover roughness on the turbulence intensities, 3D flow fields, shear velocity, and Reynolds stress around the spur dikes.
  • The dependence of the scour morphology and turbulence structure around spur dikes on the orientation angle of the spur dike, ice cover roughness, and hydraulic condition.

2. Materials and Methods

2.1. Site Description

The present experimental study was carried out in a large-scale outdoor flume located in the Quesnel River Research Center, BC, Canada. The flume was 38.2 m long, 2.0 m wide, and 1.3 m deep. The longitudinal slope of the flume bed was 0.2%. To have a constant discharge throughout each experimental run, a holding tank feeds water into the flume. The holding tank located upstream of the flume had a volume of 90 cubic meters, was 40 m long, 2 m wide, and 1.3 m deep. Three valves provided a wide range of flow rates for various experimental runs (Figure 1). By adjusting three valves, the following three different flow rates were generated in this experimental study, 0.055 m3/s, 0.105 m3/s, and 0.12 m3/s.
Due to the slope of the flume, water levels varied gradually from upstream to downstream. Therefore, the flow was classified as a nonuniform flow. Another important feature that influences the flow is the aspect ratio B/H (where B is the channel width and H is the flow depth), which is used to classify the channel (flume) either as a narrow (B/H < 5) or wide (B/H > 5) channel. A flow in a narrow channel is affected by the secondary currents from the banks (flume side walls) and causes the dip phenomena (the maximum velocity occurs below the flow surface). However, in the wide channel, the strength of the secondary currents reduces in the lateral direction of the flume [18]. In this experimental study, since the deepest flow depth was 35 cm and the flume width was 200 cm, all flows in this flume belong to wide channel flows (B/H > 5).
There were two sandboxes which are spaced 10.2 m from each other. These sandboxes were 2 m wide and 0.3 m deep. The upstream sandbox was 5.6 m long, and the downstream one was 5.8 m long (Figure 2). Three types of nonuniform sands with the median grain size (D50) of 0.9 mm, 0.6 mm, and 0.48 mm were used in the sandboxes. One side of the flume wall along each sandbox was made of plexiglass to have a clear view of the scour process. A staff gauge was located in the middle of each sandbox to measure the water depth during experimental runs. The impermeable model spur dike, made of marine plywood (had a dimension of 80 cm height, 5 cm width, and 50 cm length), was installed in the middle of each sandbox. The model dike was placed at the bottom of each sandbox (namely, 30 cm buried in the sand) so that 50 cm of the model dike was exposed to the flow. Of note, the model spur dike was non-submerged for all experimental runs in this study.
The tailgate at the downstream end of the flume was used to control the water depth and flow velocity in the flume (Figure 2). Since the flume was very long with a longitudinal slope of 0.2%, water depths were different in these two sandboxes for each experimental run, which creates a wide range of water depths for this experimental study.
Since the ice cover roughness was one of the main factors affecting the local scour process, two types of model ice cover (smooth and rough) were used. Styrofoam panels were used to model the smooth cover, while the rough cover was made by attaching small 2.5 cm Styrofoam cubes to the bottom of the Styrofoam panels. Sixteen panels with dimensions of 1.99 × 2.4 m were used to cover almost the entire surface of the flow. For the experiments with ice cover, before each experimental run, the sixteen Styrofoam panels were put side by side on the flume bed. By opening the valves very slowly, water feeds inside the flume gradually. The Styrofoam started to float on the surface of the water. There were some ropes at the end of the flume to keep the Styrofoam panels floating side by side on the water surface through the experiment. Li [23] proposed the equation for calculating the roughness coefficient of an ice cover. He found that Manning’s coefficient for ice-covered rivers averages from 0.013 to 0.04. By using Equation (2), the roughness coefficient of the rough ice cover was determined averagely as 0.03. The roughness coefficient for the smooth ice cover was considered 0.013, derived from Manning’s value for the smooth concrete [24].
k s = 30   y i exp [ ( 1   v i / v max ) ]
where, y i is the thickness of the ice-affected layer, v i is the averaged velocity of the ice-affected layer, v max is the maximum velocity of the velocity profile.
n i = 0.039   k s 1 / 6
where, k s is the average roughness height of the ice underside in meters.

2.2. Apparatuses for Measurements

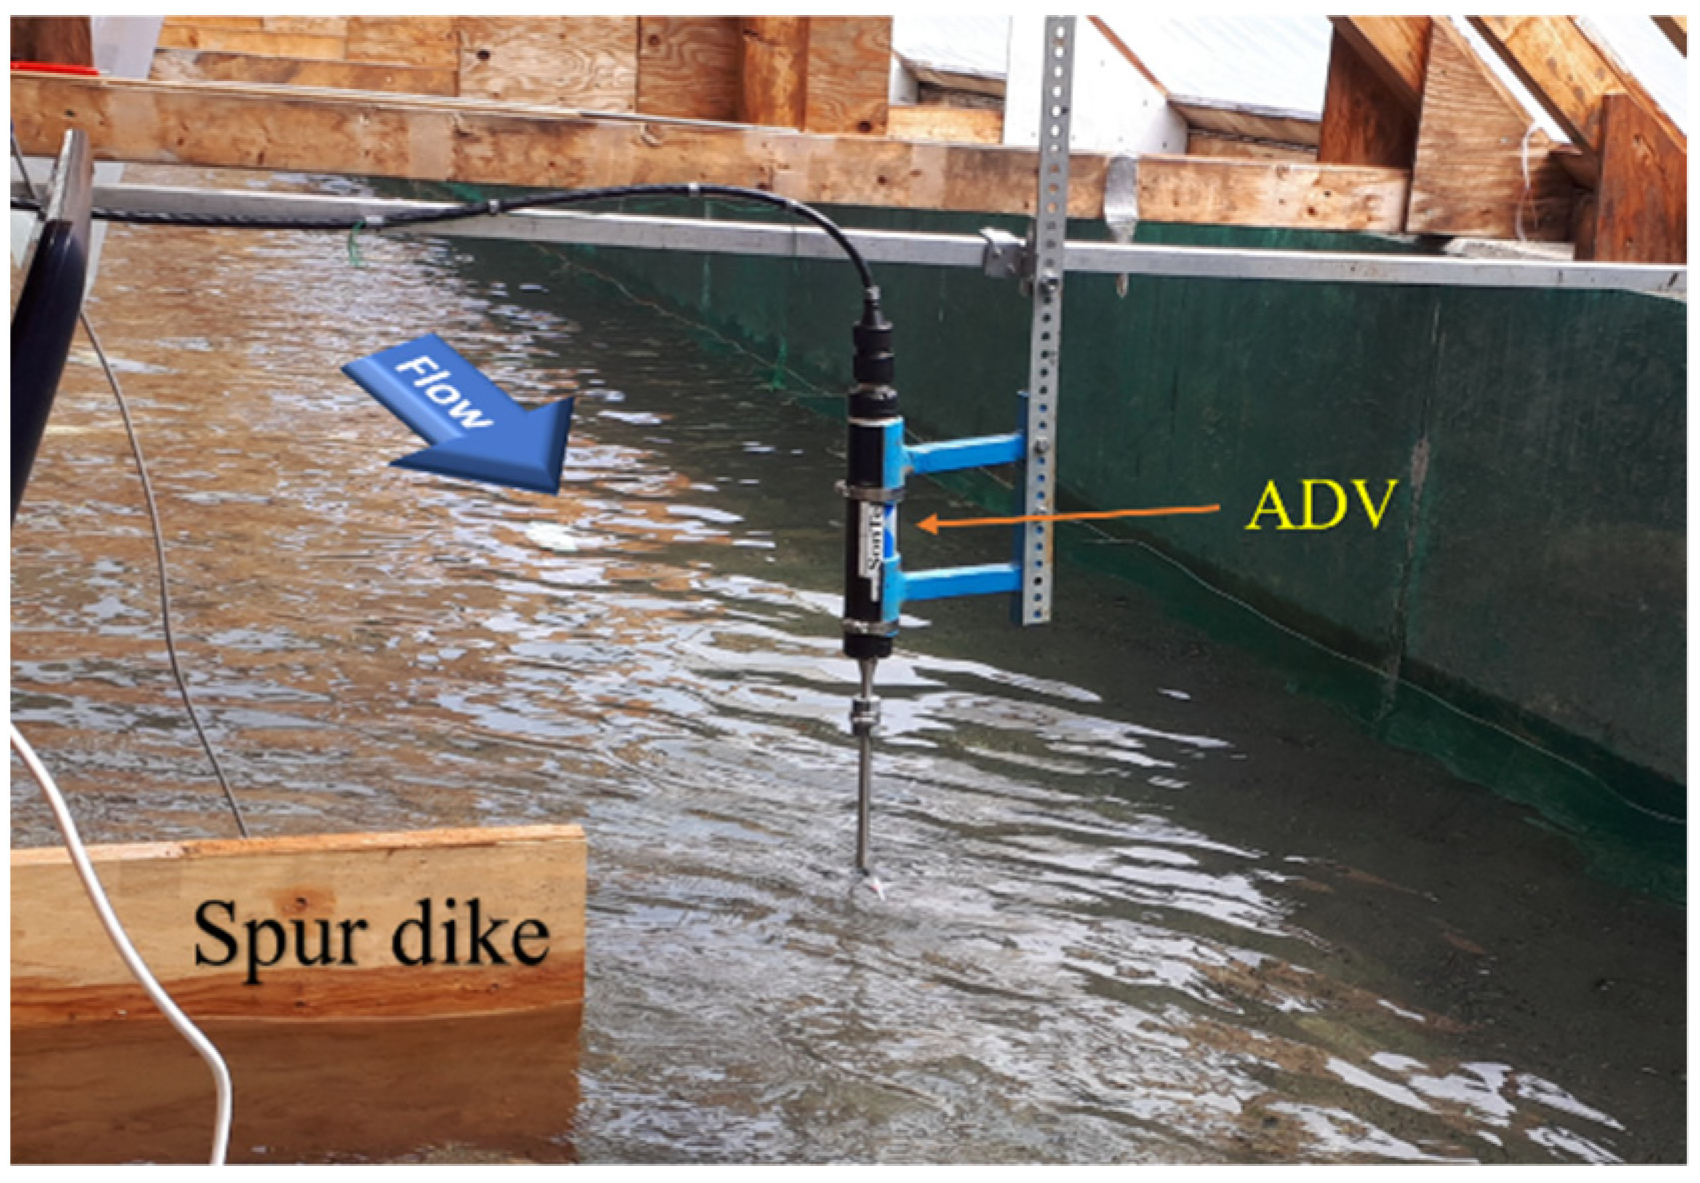
There are many different apparatuses or devices for measuring flow velocities, such as Laser Doppler velocimeter (LDV), Particle Image velocimeter (PIV), Particle Tracking velocimeter (PTV), Acoustic Doppler velocimeter (ADV), Electro Magnetic velocimeter (EMV), Pitot Static Tube (PST), etc. [25,26,27]. LDV, ADV, EMV, and PST are all point instruments. Some of them, such as the LDV and PIV, have some limitations in their working range [28]. As pointed out by researchers in the literature, the ADV is accurate for measuring the turbulence properties of flows [29,30,31]. Thus, for 3D measurements of instantaneous velocity components, a 10-MHz SonTek ADV (SonTek-A Xylem Brand, San Diego, CA, USA) was used in this research. The ADV includes one probe (transmitter) and three receivers. It acquires the instantaneous velocity components by the sampling volume positioned at the intersection of the transmitted and received acoustic beams, which is located 10 cm beneath the probe head. The sample volume was a cylinder with a diameter of 0.61 cm and a height of 0.72 cm. The ADV’s sampling volume is larger than those of the Laser-based velocimetry devices, such as the LDV and PIV [13]. The ADV cannot acquire the velocity very close to the flow surface, and the velocity profiles were not continuous to the top layer of the flow. However, this limitation does not affect the velocity analysis because the significant change of the velocity distribution occurs from the mid-water depth toward the flume bed and particularly inside of the scour hole.
The ADV measures the scattering particles’ velocities in the flow. Therefore, the accuracy of the measurements depends on the quality and quantity of particles inside the sampling volume. To acquire robust data from ADV measurements, two auxiliary parameters provided in the ADV files, the signal-to-noise ratio (SNR) and the correlation (COR), should be evaluated [31]. The SNR represents the relative density of the particulate matter in the flow. The COR, which value varies from 0 to 100, indicates the relative consistency of the particle velocity scattering within the sampling period [29]. According to the user manual for ADV and previous studies, to achieve the most accurate data in this experimental study, these two parameters were set as follows: SNR > 15, and COR > 70% [30,31]. The Water Resources Research Laboratory of the US Bureau of Reclamation developed a software program known as Win ADV for filtering the ADV data files. In this study, Win ADV was used for data filterings, such as SNR and COR. Regarding previous research, to obtain the most accurate data at each measuring location, the data sampling rate of ADV was set with the highest frequency (25 Hz) with a duration of 120 to 150 s [11,30,31]. Following the proper setting of ADV and filtering data spikes, the velocity measurements were reliable within the range of 0.25 cm/s, with an error of ±1.5% of the measurement scale [20,32].
In the present study, a SonTek-IQ Plus (SonTek-A Xylem Brand, San Diego, CA, USA) was used to measure the approaching flow rate, average velocity, and water depth. There are two types of SonTek-IQ (standard and plus); the Plus edition contains advanced post-processing functions, providing deeper insight into approaching flow and volume data, making it very precise and robust [33]. The SonTek-IQ Plus contains six measuring beams (sensors); four of these are velocity beams, which monitor the flow velocity along both the longitudinal and latitudinal axis to secure the best possible coverage and most accurate depiction of the velocity field. The remaining two measuring beams, the pressure sensor, and vertical acoustic beams work together to measure the water level precisely [33]. According to the SonTek-IQ Series User’s Manual, the data collected using the SonTek-IQ Plus is subjected to a 1% error in the range of measurement scale. The SonTek-IQ Plus was installed on the flume bed in front of each sandbox (the location of the SonTek-IQ is depicted in Figure 1). The flume shape, size, and exact location of the device were set in the SonTek-IQ software. Then based on these inputs and using the data collected by sensors, the software calculates the average flow velocity, water depth, and flow rate during each experimental run.

2.3. Data Collection

Before each experimental run, the surfaces of the sandboxes were leveled. Then the flume was filled with water slowly to avoid initial scouring around the spur dikes. After reaching the desired water levels, the valves opened completely, and the experimental run began. The initiation of the local scour process at the dike tip was observed from the very first minute of each run. A scour hole slowly develops and surrounds the upstream side of the dike to the flume wall. Then, as time goes on, the scour hole becomes deeper and wider, and extends to the downstream of the dike as well.
One of the important factors affecting the scour process is the time needed to reach the equilibrium condition. Equilibrium scour is defined as the condition when the dimensions of scour hole do not change with time. Zhang et al. [34] studied the local scour process around a spur dike and reported that 90% of the equilibrium depth happened about 2 h after the experiment started. Other researchers claimed that 80% of the maximum scour depth occurred at the first two hours of the experiment [35]. Namaee and Sui [20] conducted experimental research on local scour around side-by-side piers. They indicate that the equilibrium depth of a scour hole could be achieved within the first 6 h, although all their experimental runs lasted 24 h. In the present study, no change in scour depth was observed after about 12 h, and the scour hole reached its equilibrium condition. Therefore, each experimental run lasts for 24 h to make sure that the scour process was entirely completed. Additionally, some experiments were conducted for 48 and 72 h to investigate the time needed for achieving the equilibrium condition. Results confirm that after 24 h, there was no change in the scour hole around the spur dike comparing to those of experiments that lasted for 48 and 72 h.
After the scour process reached the equilibrium condition, velocity components in all three dimensions around the dike and inside scour hole were recorded by using a 10-MHZ ADV. Regardless of the dike layout, water surface condition, and flow depths, the velocity measurements were taken from the bottom of the scour hole to the water surface with the intervals of 1 cm for shallower flow depths and 2 cm for other flow depths (Figure 3).
Results showed that the highest turbulence intensity of the flow occurred in the center of the scour hole, where the maximum scour depth occurred. Therefore, the ADV locale for the velocity measurements of all experimental runs was at the deepest part of the scour hole, which was very close to the tip of the spur dike. For this experimental study, Ux (x-axis) is used to describe the streamwise velocity in the downstream direction, Uy (y-axis) is used to denote the lateral velocity in the transverse direction pointing to the left bank, and the vertical velocity is expressed as Uz in the z-axis (towards the water surface). Under an ice-covered flow condition, a small part of the Styrofoam panel around the spur dike was cut for placing the ADV probe in the flow for acquiring velocity data. After 24 h, all valves were closed completely, and the flume was drained gradually. Then the scour pattern was measured (Figure 4). Some of the experimental runs were repeated to validate the recorded data.

3. Results and Discussions

Throughout the scouring process, several horseshoe vortexes were detected inside of the scour hole. This vortex system has been observed in a clockwise direction. Some small bow waves on the surface of the upstream side of the dike were also observed (Figure 5). Since bow waves had opposite rotation directions to those of horseshoe vortexes, these two eddy systems were interfering with each other. Results indicate that these interferences become less noticeable with the increase in water depth. Moreover, by decreasing the dike orientation angle inclined to the downstream direction, the bow waves become smaller and less frequent. Moreover, for a dike with an orientation angle of 45° (toward downstream), these waves can hardly be observed, and their effect on the horseshoe vortex was negligible.
Because of the flow separation at the dike tip and the formation of a powerful downflow at the upstream side of the dike, the horseshoe vortexes are created. As a consequence, a scour hole around the spur dike will be developed. The wake vortex system develops behind the spur dike, which results in the extension of the scour hole downstream of the dike. As pointed out by other researchers, wake vortexes are smaller and weaker than horseshoe vortexes; and they cannot carry sediment load that eroded from the scour hole [20,37]. This fact explains the development of the deposition ridge downstream of the dike (Figure 6).
Inside the scour hole, horseshoe vortexes were created by the strong turbulence and a high level of instantaneous velocity fluctuation. Therefore, the deepest hole developed around the dike tip where the horseshoe vortex flow and downflow were stronger. By studying the 3D velocity inside a scour hole, the effects of different flow conditions and the dike setups on the local scour pattern should be assessed.
To better describe the laboratory findings which may be applicable in practical projects (rivers, spur dikes, bridge piers, etc.), the relationships between different parameters should be expressed using dimensionless variables. Furthermore, the normalization of variables (making them dimensionless) will enable us to compare results under different conditions of the experiment. Therefore, in all figures in the present study, both velocity components and water depth (h, the vertical distance at which 3D velocity data was collected) were normalized by average approaching flow velocity (U) and total water depth in the sandbox (H), respectively.

3.1. Streamwise Velocity Component (Ux)

Among all 3D velocity components, the streamwise velocity (Ux) plays a key role in developing the scour hole and the turbulence structure. Comparing to the other two velocity components (Uy, Uz), the streamwise velocity has the maximum value and highest fluctuation. Results show that regardless of the flow conditions and the orientation angle of the dike, velocity distributions inside the scour hole are less regular (or completely irregular). Moreover, the magnitudes of the streamwise velocity components inside the scour hole are smaller than those outside of the scour hole. However, in most cases, the highest level of fluctuation and the maximum velocity magnitude occur in the center of a scour hole, which is close to the dike tip.
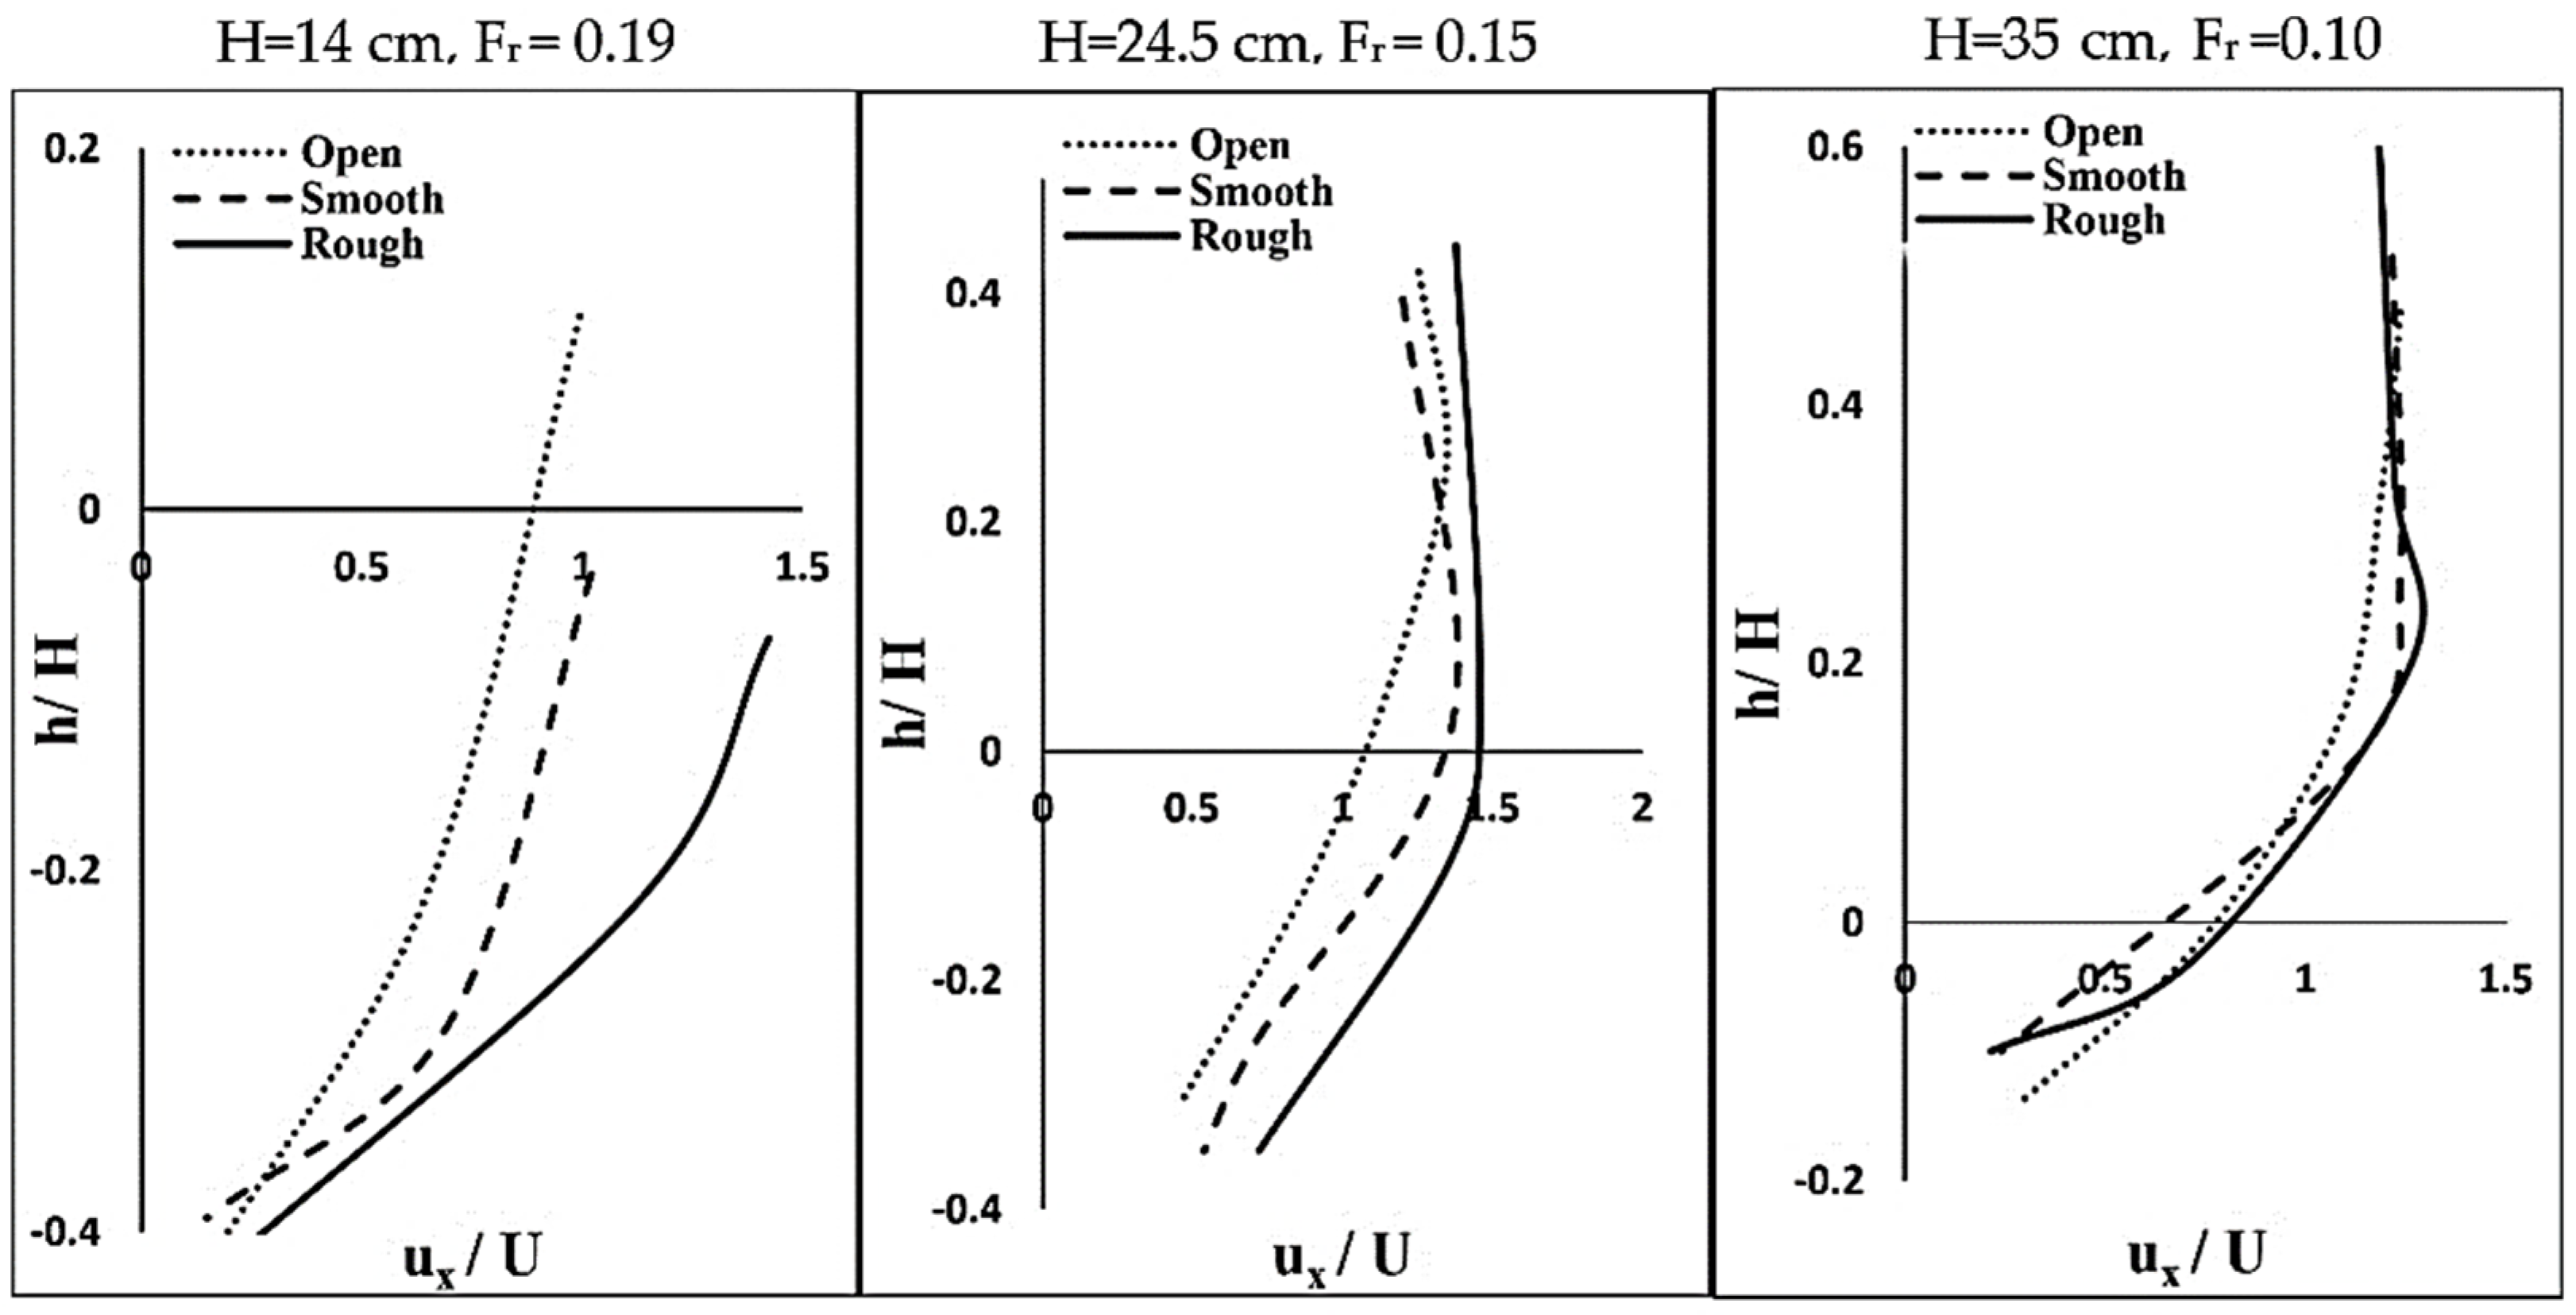
In terms of the boundary conditions for the water surface, there were three different types, namely, open flow, smooth covered condition, and rough covered condition. As indicated in Figure 7, the streamwise velocity (Ux) inside the scour hole is minimum at the bottom of the scour hole and increases with the distance from the scour hole bottom. The maximum streamwise velocity happens at the mid-water depth, and the streamwise velocity profile shows a convex shape. Of note, the ADV measuring volume is located 0.10 m from the probe head. Due to this limitation, the velocity profile cannot fully cover up to the water surface, as shown in Figure 7. Moreover, when a high level of turbulence existed at the measuring point using the ADV, the Doppler noise often appears [38]. These noises decrease with the data collection process and create data spikes. Moreover, sediment movement near the scour hole bed interferes with data collection during the ADV measurements [22]. By using the Win ADV software, these ambiguous data have been filtered. Therefore, sometimes velocity profiles cannot cover the bottom of the hole as well.
Regardless of the orientation angle of the dike and flow properties, under an ice-covered flow condition, the maximum velocity is located at the mid-depth of water. By increasing the roughness coefficient of the cover, the location of the maximum velocity is further shifted toward the channel bed. Additionally, cover conditions not only influence the location of Umax, but also affect the magnitude of the velocity as well (Figure 7). Results indicate that the rough ice cover can lead to an increase in the streamwise velocity values by nearly up to 25%. These findings are in good agreement with previous studies [17,18,20]. One can conclude that regardless of the shape and location of the barriers in an ice-covered river, the locale and magnitude of the maximum velocity depend on the features of an ice cover.
Under an ice-covered flow condition, the streamwise velocity (Ux) depends on the flow properties, such as water depth, cover roughness, and approaching velocity. In the present study, velocity profiles have been evaluated for all experiments. The flow Froud number (Fr) is one of the most important dimensionless parameters, and the effect of Fr on Ux was examined.
F r = U g H
where, U is the average approaching velocity, g is the gravitational acceleration, and H is the water depth.
The result indicates that with the decrease in the flow Froud number, the streamwise velocity distributions under different surface conditions (open channel, smooth cover, and rough cover) become closer to each other, especially for velocity distributions under both open channel and smooth covered flow conditions. In Figure 7 and Figure 8, the Froud numbers for water depths of 14 cm, 24.5 cm, and 35 cm are 0.19, 0.15, and 0.10, respectively. It appears that the effect of ice cover condition on the velocity distributions becomes intense with the increase in the flow Froud number. Moreover, as the dike orientation angle becomes smaller from 90° to 45°, this effect becomes more tangible (Figure 7 and Figure 8).
It is noted that as the dike orientation angle decreases, the magnitude of the streamwise velocity diminishes, and the scour hole becomes smaller. As indicated in Figure 9 and Figure 10, regardless of the water depth and surface cover conditions, by decreasing the dike orientation angle from 90° to 45°, the velocity profiles are shifted upward, implying a decrease in the scour hole depth. These findings are consistent with the continuity theory (Equation (4)). Since the spur dike reduces the cross-section area of the flow, the velocity should increase. As the dike orientation angle decreases, the cross-section area increases, and velocity decreases.
( ρ A U ) i n l e t   = ( ρ A U ) o u t l e t
where, ρ is the mass density of water, A is the cross-section area of the flow, and U is the average approaching velocity.
With the decrease in the dike orientation angle (from 90° to 45°), the blockage ratio of the flow cross-section decreases. Therefore, both the downflow and horseshoe vortex become weaker. This leads to the formation of a smaller scour hole. Of note, these effects are independent of the surface cover condition, water depth, and flow rate (Figure 9).

3.2. Lateral Velocity Component (Uy)

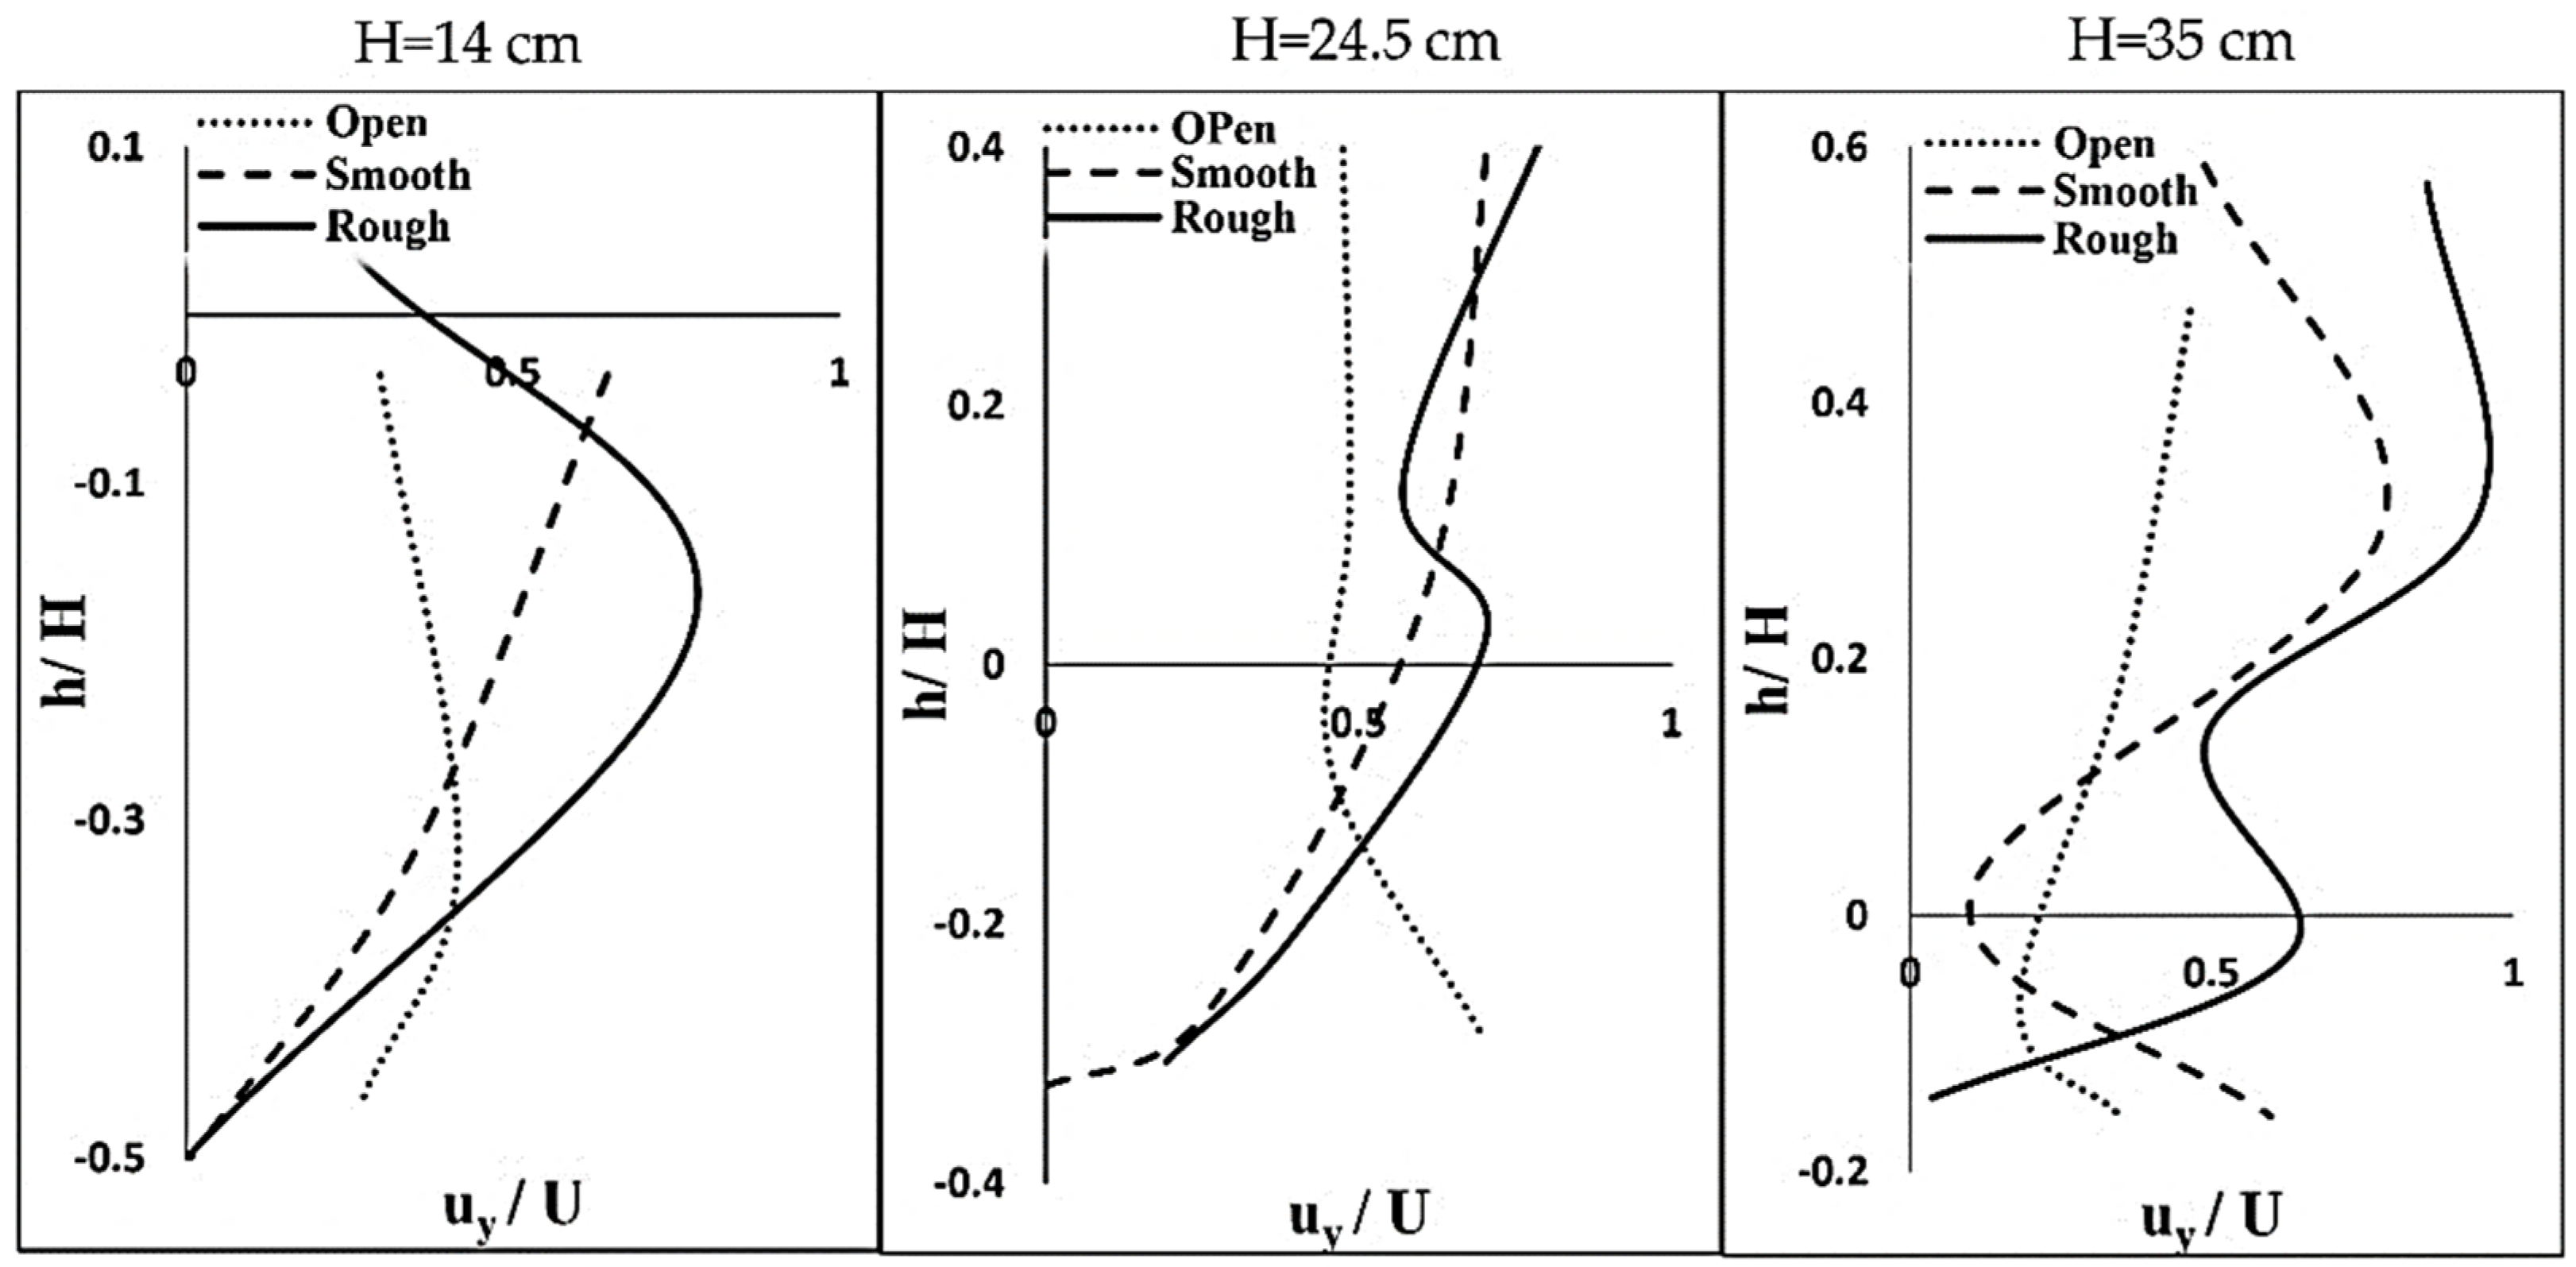
Two significant characteristics of the lateral velocity component (Uy) are their irregularity and much smaller values compared to the streamwise velocity component (Ux). After scrutinizing Uy profiles (under different conditions of surface cover, flow rate, water depth, and dike orientation angle), results reveal that the vertical distribution of the lateral velocity component was nonmonotonic. Comparing to the streamwise velocity component (Ux), the lateral velocity component (Uy) is considerably smaller and mostly positive. Some non-negligible effects have been observed in the vertical distribution profiles of the lateral velocity component (Uy).
It is noted that the presence of an ice cover leads to an increase in the magnitude of the lateral velocity regardless of the flow rate, water depth, and dike orientation angle. With the increase in the cover roughness coefficient, the value of Uy increases (Figure 10). This result indicates the ice cover plays an important role in the value of Uy.
To determine the effects of the dike orientation angle on Uy, the vertical distribution profiles of the lateral velocity component (Uy) were evaluated. As indicated in Figure 11, with the decrease in the dike orientation angle, the magnitude of Uy decreases, similar to the effect of the dike orientation angle on the streamwise velocity. Furthermore, results indicate that only for the dike orientation angle of 90°, a semi-consistent pattern has been noticed for the vertical distribution profiles of the lateral velocity component (Figure 11). For the dike orientation angles of 60° and 45°, no clear or meaningful trend was detected (despite different flow rates, surface conditions, and bed materials). Nevertheless, in all cases, the vertical distribution profiles of the lateral velocity component (Uy) were positive inside and outside of the scour holes with an equivocal pattern. Thus, the locales of the maximum lateral velocity component in the vertical distribution profiles remain unknown (Figure 10 and Figure 11).

3.3. Vertical Velocity Component (Uz)

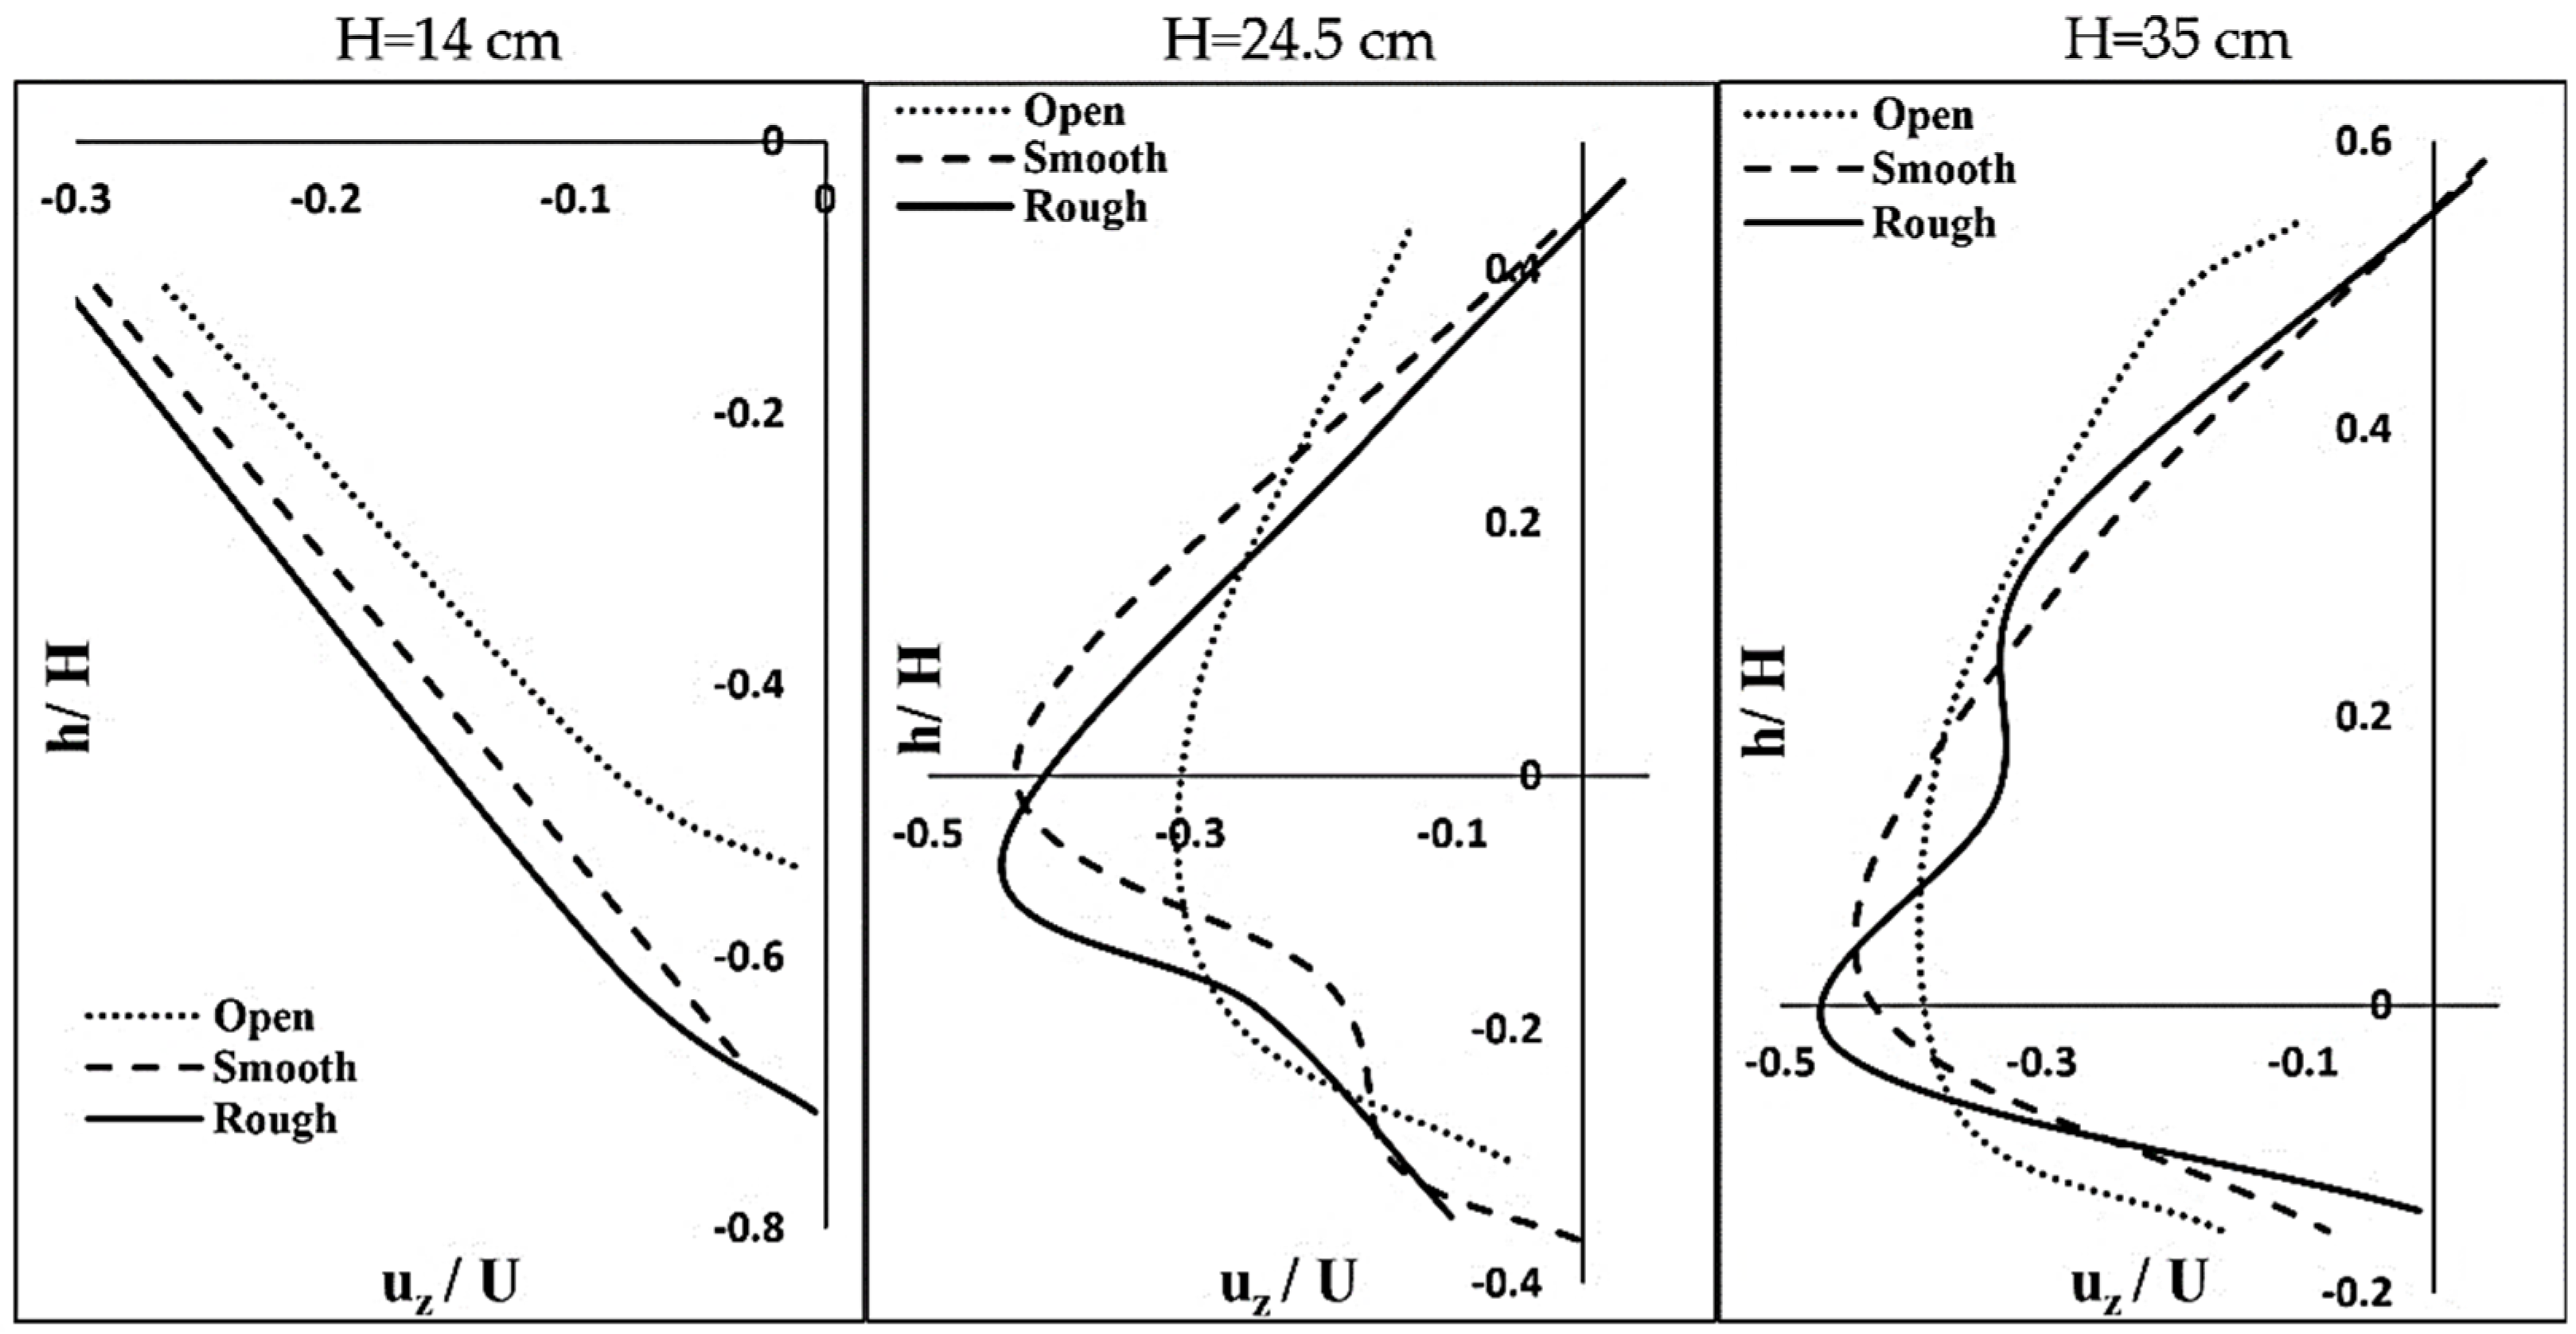
To evaluate the vertical velocity component (Uz) under different experimental conditions, its vertical distribution in the center of the scour hole (the location of the maximum scour depth) has been examined. Results show that the values of the vertical velocity component are mostly negative inside and outside of the scour holes (Figure 12). These negative values signify the existence of the powerful downflow around the dike, which is created, due to the obstruction of the flow by the spur dike. This downflow plays an essential role in the local scour process because the downward velocity increases and strengthens the horseshoe vortex system, which leads to a deeper scour hole. This fact is consistent with the local scour morphology around the spur dike. As illustrated in Figure 13, for the dike, which is perpendicular to the flume wall (with the orientation angle of 90°), the scour hole is the deepest comparing to those of dikes with other orientation angles (60° and 45°). Thus, it can be concluded that by increasing the blockage ratio of the obstacle (such as piers and spur dikes), downward velocity will increase, and create a more powerful vertical velocity component inside the scour hole.
Considering the absolute value of the vertical velocity, the Uz values reach their minimum at the bottom of the scour hole, and increase with the distance from the bottom of scour holes. The maximum value of Uz occurs around the initial level of the sand bed (before the scouring process started), then it reduces toward the flow surface. Close to the water surface, Uz becomes very small (close to zero), and in some cases, it turns positive. The distribution of the vertical velocity shows a parabolic shape (Figure 12). Results show that vertical velocity vectors change their direction near the flow surface.
As shown in Figure 12, the ice cover has a significant impact on the value of Uz. The presence of an ice cover on the surface of the flow results in obvious changes in the shape of the distribution of the vertical velocity. One can also notice, under the open flow conditions, the minimum values of Uz are always negative. However, by adding an ice cover to the flow surface, the minimum values of Uz are closer to zero and are positive in some cases. Furthermore, the absolute magnitude of the Uz increases with the increase in the roughness coefficient of the cover. Therefore, it can be concluded that under an ice-covered flow condition, the vertical velocity component (Uz) is the most important velocity component for developing scour holes comparing to other velocity components (Ux and Uy). Moreover, results indicate that the presence of an ice cover influences the locale of the maximum vertical velocity. As the ice cover becomes rougher, the location of the maximum vertical velocity moved closer toward the channel bed. However, comparing to the streamwise velocity component (Ux), this effect on the location of the maximum vertical velocity component is less noticeable (Figure 7 and Figure 12).
Results reveal that by increasing flow rate, the value of Uz increases, and velocity profiles shift toward the water surface. For the water depths of 14 cm, 24.5 cm, and 35 cm, the average approaching velocity (U) is 21, 24, and 17 cm/s, respectively. One can see that the differences in the average approaching velocity are small. However, as shown in Figure 14, the difference in the vertical velocity distribution is remarkable. Therefore, one can say that the flow rate is one important factor responsible for the change in the vertical velocity component (Uz) profile. Results also showed that under a rough covered flow condition, the maximum value of Uz is a bit higher than those under the open flow and smooth covered flow conditions.
Further studies have been conducted to assess the impact of the dike orientation angle on the Uz distributions. Results reveal that by reducing the blockage ratio of the dike (namely, by decreasing the dike orientation angle), the effect of the ice cover on the vertical velocity profile became less noticeable. The presence of an ice cover on the flow surface leads to a considerable change in the Uz profile shape. However, by reducing the dike orientation angle from 90° to 45°, the vertical velocity profiles for a flow under an open channel become more similar to that under an ice-covered flow condition. Likewise, by reducing the dike orientation angle, the absolute value of Uz decreases (Figure 15). Results indicated that when the dike orientation angle is reduced, the vertical velocity component will be significantly affected in the following two ways, (1) the effect of an ice cover will be counteracted, (2) the downward velocity vectors will be weakened. Of note, this effect is more noticeable regarding scour hole depth comparing to the surface area of the scour holes.

3.4. Turbulence Intensities and Reynolds Shear Stress

It is noted that inside the scour holes, the flow is a combination of the downflow and horseshoe vortexes which cause a complex turbulence structure. Turbulent eddies generate velocity fluctuations which are referred to as turbulence strength (urms). urms was defined as the standard deviation (root mean square (RMS)) of the instantaneous velocity fluctuations. As described in Equation (5), urms was calculated based on 3D velocity components measured by ADV. A larger urms signifies a higher level of turbulence.
u r m s = 1 N   i = 1 N ( u i ) 2
where, urms is the root-mean-square of the turbulent velocity fluctuations, ui is the instantaneous fluctuations of velocity components.
Because turbulent bursts are the main mechanism that entrains sediment and initiates the scouring process [11,18], the distribution patterns of the turbulence strength of 3D velocity components (ux´, uy´, uz´) have been examined. To accurately assess different instantaneous velocity fluctuations, the turbulence strength has been normalized by the average approach velocity (U). Results reveal that in most cases, the highest level of fluctuation occurs in the center of scour holes (very close to the dike tip) and the exit of the hole (flume bed), due to the exposure of a larger flow field. As indicated in Figure 16, generally, the streamwise turbulence intensity (ux´) is the largest, and the vertical turbulence intensity is the least, namely, ux´ > uy´ > uz´. Moreover, the streamwise and vertical turbulence intensity generally followed a distinct pattern—they are small (close to zero) at the scour hole bottom and increase with the distance from the scour hole bottom. In most cases, ux´ and uz´ become maximum slightly above the scour hole (flume bed) and decrease toward the water surface, creating the reverse C shape profiles. Nonetheless, no consistent trend has been observed for the lateral turbulence intensity (Figure 16).
In terms of the impact of an ice cover on the turbulence strength, results indicate that the presence of an ice cover increases the turbulence intensities. With the increase in the roughness coefficient of an ice cover, the maximum fluctuation amount increases (Figure 16). Additionally, the approaching velocity plays an important role in the turbulence intensity. Regardless of the surface cover condition or the dike orientation angle, the maximum level of the instantaneous velocity fluctuations happened when the approaching velocity is the highest. Experiments clearly show that with a high approaching velocity, the maximum depth of the scour hole will be reached in a shorter amount of time. Moreover, the scour hole becomes larger with a higher approaching velocity.
The local scour process starts with the increase in the shear stress resulting from the accelerating flow around the spur dike. The shear stress refers to the Reynolds stress ( τ ), which can be illuminated as the transport of the streamwise momentum through a surface normal to the z-axis. Based on instantaneous velocity fluctuations collected using the ADV, the Reynolds shear stress can be calculated (Equation (6)) [34]. The Reynolds stress plays a key role in the entrainment and movement of sediment particles.
τ = ρ u x ´ u z ´
where,   τ is the Reynolds stress, ρ is the mass density of water, u x ´ is the streamwise turbulence strength, and u z ´ is the vertical turbulence strength.
To better understand the Reynolds stress distribution inside scour holes, the Reynolds stress values were normalized by the shear velocity (friction velocity) u * 2 . The Shear velocity was calculated based on the boundary layer characteristic method (BLCM) [39], as illustrated in Equation (7).
τ τ   b = < u x ´ u z ´ > u * 2
where, τ is the Reynolds stress, u x ´ is the streamwise turbulence strength, u z ´ is the vertical turbulence strength, τ b is the bed shear stress, and u *   is the shear velocity or friction velocity.
u * = ( δ * θ )   u m a x C δ *    
where, δ * is the displacement thickness, θ is the momentum thickness which is defined by [40], C is a constant which was estimated as 4.4 for Canadian rivers [41].
As shown in Figure 17, the Reynolds stress is zero at the scour hole bottom, and gradually decreases to the least negative value, and it becomes zero again in the middle of scour holes; then it increases with the distance from the scour hole bottom, afterward it decreases toward the water surface. Inside the scour hole, the distribution of the Reynolds stress has a parabolic shape. Outside the scour hole, the value of the Reynolds stress becomes positive, and it reached its maximum slightly above the initial level of the sand bed (flume bed). Then it reduces again toward the flow surface and became negative close to the surface, creating a convex shape distribution (Figure 17).
The negative Reynolds stress inside the scour hole demonstrates an upward vertical momentum transport caused by a negative velocity gradient ( d u d z < 0 ). Similarly, the negative Reynolds stress close to the flow surface indicates the impact of the adverse pressure gradient at the upper portion of the flow, which has a negative velocity gradient as well.
Results show that the value of Reynolds stress under an ice-covered flow condition is greater than that under an open flow condition. With the increase in the roughness of an ice cover, the absolute value of the Reynolds stress rises (Figure 17). It can be concluded that under the ice-covered flow conditions, higher shear stress at the sand bed will be generated. This increase in the shear stress leads to more sediment movement around the dike and ultimately creates a larger scour hole.

4. Conclusions

The three-dimensional velocity components and turbulence structure inside and outside scour holes around the spur dikes in a large-scale flume have been investigated. The model spur dikes are impermeable and non-submerged, with orientation angles of 90°, 60°, and 45°, respectively. To have a comprehensive study on flow characteristics in the vicinity of a dike, experiments have been conducted under conditions of open channel, smooth covered, and rough covered flow condition. Based on data collected from laboratory experiments, the impacts of the spur dike on the 3D velocity distributions, Reynolds shear stress, and turbulence intensities have been investigated. Overall, the following results were obtained in this experimental study.
  • The presence of an ice cover on the water surface causes a considerable change in the bed shear stress and raises the turbulence intensities inside the scour holes which can have a significant effect on sediment transportation. To be more specific, the presence of an ice cover increases the maximum values of the 3D velocity components averagely by 10% to 25% for smooth and rough ice cover, respectively. The rough ice cover shifts the location of the maximum velocity further close to the sandbed, which leads to the increase in the Reynolds shear stress inside the scour hole and accordingly resulted in a deeper scour hole. These effects are independent of flow rates and dike orientations angle.
  • The dike with an orientation angle of 90° generates the strongest downflow around the dike comparing to those resulting from the orientations angle of 45° and 60°. Thus, the dike with an orientation angle of 90° creates high turbulence, and powerful horseshoe vortexes inside the scour holes, generate the deepest scour hole comparing to those around the dike with the smaller orientation angles. Results clearly show that by reducing the dike orientation angle from 90° to 45°, the velocity profiles are shifted upward, and scour hole depth decreases by 5–10% for each 10° angle decrease. These results imply that by changing the dike orientation angle, the blockage ratio of the cross-section area will reduce. Consequently, the vortex system in the vicinity of the spur dike will become weak. Thus, the turbulence kinetic energy inside the scour hole is reduced.
  • Generally, the 3D velocity distributions are less regular inside the scour holes. Besides, the velocity components inside the hole are smaller comparing to those outside of the scour holes. The highest level of the velocity fluctuation and turbulence intensity appears immediately above the scour holes. With the increase in the roughness coefficient of an ice cover, the maximum turbulence intensity increases. The smooth and rough ice cover raised turbulence intensity averagely by 15% and 30%, respectively. Moreover, with the increases in the approaching velocity, the instantaneous velocity fluctuation increases. The higher the flow velocity, the more powerful turbulence kinetic energy around the spur dike, and thus, the deeper the scour holes.
  • The streamwise velocity (Ux) is highest among all 3D velocity components, implying that Ux contributes more to the turbulence intensities, Reynolds shear stress, and consequently, the development of the scour holes. The lateral velocity component (Uy) has the highest level of irregularities inside and outside the scour hole. Unlike the streamwise and vertical velocity (Uz) distributions, no meaningful trend has been observed for the lateral velocity component. Moreover, the presence of an ice cover on the water surface considerably affects the lateral velocity component. With the increase in the roughness coefficient of an ice cover, the lateral velocity increased.
  • Both the streamwise velocity component and lateral velocity component are almost always positive. However, the vertical velocity component is almost negative inside and outside the scour holes. The negative vertical velocity components indicate the powerful downflow and downward velocity in the vicinity of the dike. The absolute value of Uz increases proportionately with the approaching flow velocity. The higher the approaching velocity, the more the vertical velocity component absolute value. This effect has been intensified with the increase in the roughness coefficient of an ice cover. Under an ice-covered flow condition, the distribution pattern of Uz differs completely from that under an open flow condition. Moreover, the maximum vertical velocity has been observed when the dike has an orientation angle of 90°. With an increase in dike angle of each 10° (from 45° to 90°), the absolute value of vertical velocity relatively increases by up to almost 10%, implying that the dike orientation angle is one of the important controlling factors for Uz.
  • The Reynolds shear stress is negative inside the scour holes and becomes positive toward the flow surface. It reaches its maximum slightly above the scour holes. The negative values of the Reynolds stress are caused by the upward vertical momentum transport generated by a negative velocity gradient. Additionally, with the increase in the roughness coefficient of an ice cover, the absolute value of the Reynolds stress increases. It can be concluded that the presence of an ice cover creates more powerful shear stress at the sandbed, which causes a deeper scour hole.

Author Contributions

Conceptualization, R.J. and J.S.; methodology, R.J. and J.S.; software, R.J.; validation, R.J. and J.S.; formal analysis, R.J. and J.S.; investigation, R.J. and J.S.; resources, R.J. and J.S.; data curation, R.J.; writing—original draft preparation, R.J.; writing—review and editing, R.J. and J.S.; supervision, J.S.; project administration, R.J. and J.S.; funding acquisition, J.S. All authors have read and agreed to the published version of the manuscript.

Funding

The Natural Sciences and Engineering Research Council of Canada (NSERC) under the Discovery Grant Program RGPIN-2019-04278.

Institutional Review Board Statement

Not applicable.

Informed Consent Statement

Not applicable.

Data Availability Statement

The data used in this manuscript are available by writing to the first author.

Conflicts of Interest

The authors declare no conflict of interest.

References

  1. Kuhnle, R.A.; Alonso, C.V.; Shields, F.D. Geometry of scour holes associated with 90 spur dikes. J. Hydraul. Eng. 1999, 125, 972–978. [Google Scholar] [CrossRef]
  2. Sadat, S.H. Modification of Spur-Dike with Footing or Pile-Group to Stabilize River Morphology and Reduce Local Scour. Ph.D. Thesis, Nagoya Institute of Technology, Nagoya, Japan, 2015. [Google Scholar]
  3. Giglou, A.N.; Mccorquodale, J.A.; Solari, L. Numerical study on the effect of the spur dikes on sedimentation pattern. Ain Shams Eng. J. 2018, 9, 2057–2066. [Google Scholar] [CrossRef]
  4. Pandey, M.; Ahmad, Z.; Sharma, P. Scour around impermeable spur dikes: A review. ISH J. Hydraul. Eng. 2018, 24, 25–44. [Google Scholar] [CrossRef]
  5. Zhang, H.; Nakagawa, H.; ISHIGAKI, T.; MUTO, Y. Prediction of 3D flow field and local scouring around spur dykes. Proc. Hydraul. Eng. 2005, 49, 1003–1008. [Google Scholar] [CrossRef]
  6. Teraguchi, H.; Nakagawa, H.; MUTO, Y.; BABA, Y.; ZHANG, H. Flow and sediment transport around impermeable or permeable groins. Proc. Hydraul. Eng. 2008, 52, 175–180. [Google Scholar] [CrossRef]
  7. Mizutani, H.; Nakagawa, H.; Kawaike, K.; Baba, Y.; Zhang, H. Study on local scour and variation of bed composition around non-submerged spur dyke. J. Jpn. Soc. Civ. Eng. Ser. B1 Hydraul. Eng. 2011, 67, I_829–I_834. [Google Scholar] [CrossRef] [Green Version]
  8. Kanda, K.; Samoto, Y.; Li, Z. Study on morphodynamics around stone-lined spur dikes in the Akashi river. In River, Coastal and Estuarine Morphodynamics: RCEM 2007, Two Volume Set; CRC Press: Boca Raton, FL, USA, 2019; pp. 1176–1182. [Google Scholar]
  9. Yossef, M.M.; Klaassen, G.J. Reproduction of groynes-induced river bed morphology using LES in a 2-D morphological model. River Flow 2002, 2, 1099–1108. [Google Scholar]
  10. Muto, Y.; Baba, Y.; Aya, S. Velocity measurements in open channel flow with rectangular embayments formed by spur dikes. Annu. Disaster Prev. Res. Inst. Kyoto Univ. B 2002, 45, 2. [Google Scholar]
  11. Jennifer, D.; Li, H.; Guangqian, W.; Xudong, F. Turbulent burst around experimental spur dike. Int. J. Sediment Res. 2011, 26, 471–523. [Google Scholar]
  12. Nelson, J.M.; Shreve, R.L.; McLean, S.R.; Drake, T.G. Role of near-bed turbulence structure in bed load transport and bed form mechanics. Water Resour. Res. 1995, 31, 2071–2086. [Google Scholar] [CrossRef]
  13. Duan, J.G.; He, L.; Fu, X.; Wang, Q. Mean flow and turbulence around experimental spur dike. Adv. Water Resour. 2009, 32, 1717–1725. [Google Scholar] [CrossRef]
  14. Papanicolaou, A.; Diplas, P.; Dancey, C.; Balakrishnan, M. Surface roughness effects in near-bed turbulence: Implications to sediment entrainment. J. Eng. Mech. 2001, 127, 211–218. [Google Scholar] [CrossRef]
  15. Huai, W.; Zeng, Y.; Xu, Z.; Yang, Z. Three-layer model for vertical velocity distribution in open channel flow with submerged rigid vegetation. Adv. Water Resour. 2009, 32, 487–492. [Google Scholar] [CrossRef]
  16. Dey, S.; Barbhuiya, A.K. Velocity and turbulence in a scour hole at a vertical-wall abutment. Flow Meas. Instrum. 2006, 17, 13–21. [Google Scholar] [CrossRef]
  17. Sui, J.; Wang, D.; Karney, B.W. Suspended sediment concentration and deformation of riverbed in a frazil jammed reach. Can. J. Civ. Eng. 2000, 27, 1120–1129. [Google Scholar] [CrossRef]
  18. Sui, J.; Wang, J.; He, Y.; Krol, F. Velocity profiles and incipient motion of frazil particles under ice cover. Int. J. Sediment Res. 2010, 25, 39–51. [Google Scholar] [CrossRef]
  19. Wu, P.; Hirshfield, F.; Sui, J.; Wang, J.; Chen, P.-P. Impacts of ice cover on local scour around semi-circular bridge abutment. J. Hydrodyn. 2014, 26, 10–18. [Google Scholar] [CrossRef]
  20. Namaee, M.R.; Sui, J. Velocity profiles and turbulence intensities around side-by-side bridge piers under ice-covered flow condition. J. Hydrol. Hydromech. 2020, 68, 70–82. [Google Scholar] [CrossRef] [Green Version]
  21. Ettema, R.; Kempema, E.W. River-Ice Effects on Gravel-Bed Channels. Gravel-Bed Rivers Process. Tools Environ. 2012, 523–540. [Google Scholar] [CrossRef]
  22. Muste, M.; Braileanu, F.; Ettema, R. Flow and sediment transport measurements in a simulated ice-covered channel. Water Resour. Res. 2000, 36, 2711–2720. [Google Scholar] [CrossRef]
  23. Li, S.S. Estimates of the Manning’s coefficient for ice-covered rivers. In Proceedings of the Institution of Civil Engineers-Water Management, Montreal, QC, Canada, October 2012; Thomas Telford Ltd.: London, UK, 2012; Volume 165, pp. 495–505. [Google Scholar] [CrossRef]
  24. Mays, L.W. Hydraulic Design Handbook; McGraw-Hill Education: New York, NY, USA, 1999. [Google Scholar]
  25. Weitbrecht, V.; Kühn, G.; Jirka, G. Large scale PIV-measurements at the surface of shallow water flows. Flow Meas. Instrum. 2002, 13, 237–245. [Google Scholar] [CrossRef] [Green Version]
  26. Kuhnle, R.A.; Jia, Y.; Alonso, C.V. Measured and simulated flow near a submerged spur dike. J. Hydraul. Eng. 2008, 134, 916–924. [Google Scholar] [CrossRef]
  27. Kadota, A.; Suzuki, K. Local scour and development of sand wave around T-type and L-type groynes. In Scour and Erosion, Proceedings of the International Conference on Scour and Erosion (ICSE-5), San Francisco, CA, USA, 7–10 November 2010; ASCE: Reston, VA, USA, 2010; pp. 707–714. [Google Scholar]
  28. Telionis, D.; Yang, Y.; Rediniotis, O. Recent developments in multi-hole probe (mhp) technology. In Proceedings of the 20th International Congress of Mechanical Engineering, Gramado, Brazil, 15–20 November 2009. [Google Scholar]
  29. Wahl, T.L. Analyzing ADV data using WinADV. In Building Partnerships, Proceedings of the Building Partnerships, Minneapolis, MI, USA, 30 July 30–2 August; ASCE: Reston, VA, USA, 2000; pp. 1–10. [Google Scholar]
  30. Martin, V.; Fisher, T.; Millar, R.; Quick, M. ADV data analysis for turbulent flows: Low correlation problem. In Proceedings of the Hydraulic Measurements and Experimental Methods 2002, Estes Park, CO, USA, 28 July–1 August 2002; pp. 1–10. [Google Scholar]
  31. Rehmel, M. Application of acoustic Doppler velocimeters for streamflow measurements. J. Hydraul. Eng. 2007, 133, 1433–1438. [Google Scholar] [CrossRef] [Green Version]
  32. Sontek, A.D.V. Operation Manual, Firmware Version 4.0; Sontek: San Diego, CA, USA, 1997. [Google Scholar]
  33. SonTek-IQ Series Intelligent Flow Featuring Smart Puls HD User’s Manual; Xylem Inc: San Diego, CA, USA, 2017; p. 135.
  34. Zhang, H.; Nakagawa, H.; Kawaike, K.; Yasuyuki, B. Experiment and simulation of turbulent flow in local scour around a spur dyke. Int. J. Sediment Res. 2009, 24, 33–45. [Google Scholar] [CrossRef]
  35. Vijayasree, B.; Eldho, T.; Mazumder, B.; Ahmad, N. Influence of bridge pier shape on flow field and scour geometry. Int. J. River Basin Manag. 2019, 17, 109–129. [Google Scholar] [CrossRef]
  36. Ghaderi, A.; Abbasi, S. CFD simulation of local scouring around airfoil-shaped bridge piers with and without collar. Sādhanā 2019, 44, 1–12. [Google Scholar] [CrossRef] [Green Version]
  37. Melville, B.W.; Coleman, S.; Hoe, D. Countermeasures for Scour at Spill-Trough Bridge Abutments. In Proceedings of the First International Conference on Scour of Foundations, College Station, TX, USA, 17–20 November 2002; pp. 749–763. [Google Scholar]
  38. McLelland, S.J.; Nicholas, A.P. A new method for evaluating errors in high-frequency ADV measurements. Hydrol. Process. 2000, 14, 351–366. [Google Scholar] [CrossRef]
  39. Afzalimehr, H.; Maddahi, M.R.; Naziri, D.; Sui, J. Effects of non-submerged boulder on flow characteristics—A field investigation. Int. J. Sediment Res. 2019, 34, 136–143. [Google Scholar] [CrossRef]
  40. Schlichting, H.; Gersten, K. Boundary-Layer Theory; Springer: Berlin, Germany, 2016. [Google Scholar]
  41. Afzalimehr, H.; Rennie, C. Determination of bed shear stress using boundary layer parameters in a gravel-bed river. Hydrol. Sci. J. 2009, 54, 147–159. [Google Scholar] [CrossRef] [Green Version]
Figure 1. The layout of the experimental flume: (a) Plan view; (b) vertical view.
Water 13 01844 g001aWater 13 01844 g001b
Figure 2. The view of the original site (experimental flume).
Water 13 01844 g002
Figure 3. 3D Velocity data collection using the 10-MHz SonTek ADV.
Water 13 01844 g003
Figure 4. Plan view of the scour hole.
Water 13 01844 g004
Figure 5. Development of vortex system around the spur dike (adapted from [36]).
Water 13 01844 g005
Figure 6. Deposition ridge in the downstream side of the spur dike.
Water 13 01844 g006
Figure 7. Streamwise velocity profile (ux) under different surface cover conditions for the spur dike with an orientation angle of 90° for different water depths. ADV measurements subject to +/−0.25 cm/s error.
Water 13 01844 g007
Figure 8. Streamwise velocity profile (ux) inside and outside the scour holes under different surface cover conditions for the dike orientation angle of 45° for different water depths. ADV measurements subject to +/−0.25 cm/s error.
Water 13 01844 g008
Figure 9. Streamwise velocity profile (ux) inside and outside the scour holes for different dike orientation angles (water depth: 31 cm). ADV measurements subject to +/−0.25 cm/s error.
Water 13 01844 g009
Figure 10. Lateral velocity profile (uy) inside and outside the scour holes under different surface cover conditions for the dike orientation angle of 90° for different water depths. ADV measurements subject to +/−0.25 cm/s error.
Water 13 01844 g010
Figure 11. Lateral velocity profile (uy) inside and outside the scour holes under different surface cover conditions for different dike orientations (water depth: 35 cm). ADV measurements subject to +/−0.25 cm/s error.
Water 13 01844 g011
Figure 12. Vertical velocity profile (uz) inside and outside the scour holes under the open channel, smooth covered, and rough covered flow conditions for the spur dike with an orientation angle of 90° for different water depths. ADV measurements subject to +/−0.25 cm/s error.
Water 13 01844 g012
Figure 13. Scour hole profiles around the dike with different orientation angles (water depth: 11 cm, open channel flow). Scour hole measurements subject to +/−0.03 cm error.
Water 13 01844 g013
Figure 14. Vertical velocity profile (uz) inside and outside the scour holes under conditions of different flow rates and surface cover (the dike orientation angle is 90°). ADV measurements subject to +/−0.25 cm/s error.
Water 13 01844 g014
Figure 15. Vertical velocity profile (uz) inside and outside the scour holes under conditions of different surface covers and different dike orientation angles (water depth: 21.5 cm). ADV measurements subject to +/−0.25 cm/s error.
Water 13 01844 g015
Figure 16. Turbulence intensity in three directions under different surface cover conditions with the dike orientation of 90° (water depth: 35 cm). ADV measurements subject to +/−0.25 cm/s error.
Water 13 01844 g016
Figure 17. Reynolds stress, under different surface cover conditions for the dike with an orientation angle of 90° (water depth: 31 cm). ADV measurements subject to +/−0.25 cm/s error.
Water 13 01844 g017
Publisher’s Note: MDPI stays neutral with regard to jurisdictional claims in published maps and institutional affiliations.