Article

Effects of Soil Bulk Density and Moisture Content on the Physico-Mechanical Properties of Paddy Soil in Plough Layer

1
College of Engineering, Huazhong Agricultural University, Wuhan 430070, China
2
Key Laboratory of Agricultural Equipment in Mid-Lower Yangtze River, Ministry of Agriculture and Rural Affairs, Wuhan 430070, China
*
Author to whom correspondence should be addressed.
Water 2021, 13(16), 2290; https://doi.org/10.3390/w13162290
Submission received: 17 May 2021 / Revised: 2 August 2021 / Accepted: 19 August 2021 / Published: 21 August 2021
(This article belongs to the Special Issue Soil Science and Hydrology: Water at the Crossroad of Two Disciplines)

Abstract

:
For paddy-upland rotation areas in the middle and lower reaches of the Yangtze River, the paddy soil has undesired physico-mechanical properties of tillage during the dry season. The purpose of this study is to determine the effects of soil bulk density and moisture content on the physico-mechanical properties of paddy soil in the plough layer. The bulk density and moisture content were selected as experimental factors, and the cohesion, tangential adhesion, plasticity index, and soil swelling rate were chosen as experimental indices from physico-mechanical properties of paddy soil in the plough layer. The experimental factors were quantitatively analyzed to explore the change characteristics of the physico-mechanical properties of paddy soil in the plough layer. Conclusions were obtained that show that when the bulk density increased in the range of 1 to 1.6 g·cm−3, the cohesion, tangential adhesion, plasticity index, and swelling rate of paddy soil increased in different degrees. Between 15% and 35% moisture content, the cohesion increased first and then decreased with the increase of moisture content, while the peak cohesion value occurred at the moisture content of 20%. Moisture content was positively correlated with tangential adhesion and negatively correlated with soil swelling rate. This study provides a reference for the regulation of paddy soil tillability in the middle and lower reaches of the Yangtze River Basin.

1. Introduction

Soil physico-mechanical properties, such as cohesiveness, adhesiveness, plasticity, and expansibility, are important influencing factors of agricultural machinery operation efficiency, cultivation quality, and crop growth. According to relevant research, as the moisture content increased, the adhesion between the paddy soil and the steel plate tended to increase first and then decrease, and when the moisture content was very high, the soil became a paste and would not adhere to the steel plate [1]. Tiwari et al. found that the proportion of montmorillonite, even as little as 15%, was very sensitive to increase the liquid limit as well as the plasticity index, and it reduced the fully softened shear strength of a soil mass [2]. Mouazen et al. concluded that the mechanical properties of sandy loam soils, except for the angle of internal friction, increased with the increase of bulk density in the range of 1.15 to 1.82 Mg∙m−3 and decreased with the increase of moisture content in the range of 3% to 22% [3]. Liu et al. found that the strength of silty clay presented a trend of decreasing and then increasing with the increase of coarse particle content, and the failure strain decreased [4]. Soil bulk density and moisture content had an effect on the rate of water penetration [5]. The paddy soil, with montmorillonite minerals dominating, had a great potential of swelling–shrinkage during wetting–drying conditions, and this swelling–shrinkage capacity increased along with clay content and moisture content [6]. The above findings show that the bulk density and moisture content were important parameters that affect the soil physico-mechanical properties.
Paddy soil, a special kind of artificial soil, is formed by long-term irrigation, drainage, and crop cultivation. China’s Yangtze River Basin accounts for about 5.21% of the world’s rice cultivation area and 12.3% of the world’s rice production [7]. Rice–rape and rice–wheat rotation systems are the main farming systems in the middle and lower reaches of the Yangtze River, and soil is typical paddy soil [8]. In the dry farming period, paddy soil shows undesired properties, such as heavy viscosity, easy adhesion, and strong plasticity, as well as being easy to absorb water and expand. Current studies on paddy soil bulk density and moisture content in the middle and lower reaches of Yangtze River agricultural region, such as that of Fang et al., showed that long-term rice–rape rotation systems could reduce soil bulk and increase soil porosity and water storage capacity [9]. Zhou et al. concluded that the application of inorganic and organic fertilizers increased the effective moisture content of paddy soil by 20% and decreased the bulk density by 0.2 g∙cm−3 compared to zero fertilizer application [10]. The study of Yang et al. showed that the application of green manure such as Chinese milk vetch and ryegrass could reduce paddy soil bulk density and increase the water-holding capacity of paddy soil [11]. The bulk density, shrinkage characteristics, and moisture content of paddy soil were changed with alternate flooding and drying times [12]. The tillage patterns of paddy soil could also have an effect on the bulk density. For example, in 0 to 20 cm depth paddy soil, the no tillage with residue retention (NT) had greater bulk density than conventional tillage with residue incorporation (CT), rotary tillage with residue incorporation (RT), and rotary tillage with all residue removed (RTO) [13,14]. The above studies reveal the effects on paddy soil bulk density and moisture content in terms of fertilizer application patterns, tillage patterns, and moisture. However, less research has been conducted on the effect of bulk density and moisture content on the physico-mechanical properties of paddy soil in the middle and lower reaches of Yangtze River.
The main objectives of the study were: (1) to determine the effects of bulk density and moisture content on the cohesion, tangential adhesion, plasticity index, and soil swelling rate of paddy soils, and (2) to analyze the reasons for the above effects. This study should help to provide a reference for improving the bulk density of paddy soil and regulating the moisture content of paddy soil in this region.

2. Materials and Methods

2.1. Materials

The sampling plots were rice–rape or rice–wheat crop rotation fields, and the soil was typical paddy soil. After rice harvesting, a five-point sampling method (Figure 1) was used to collect soil samples. The area with flat terrain and uniform growth in the field was selected, and the sampling frame was placed. The midpoint of the diagonal of the frame was determined as the central sampling point of the five-point sampling method, then the other four points with the same distance from the central sampling point on the diagonal were selected as the sampling points. Vaseline was applied on the inner wall of the cutting ring. The edge of the cutting ring was pressed vertically into the soil until the cutting ring was filled with soil. When the cutting ring was taken out, the excess soil at both ends of the cutting ring and the soil outside the cutting ring were cleaned.
Soil, from the 0 to 15 cm plough layer, was fully mixed, naturally air-dried, ground, and passed through a 2 mm sieve before the following tests. Soil bulk density and moisture content were measured by the cutting ring method and drying method, respectively. Soil particle size was measured by an electric vibrating screen. The basic physical properties of the soil are shown in Table 1. According to Chinese soil classification criteria, the experimental soil belonged to silty clay. The soil samples were placed in an oven and dried at 105 ± 5 °C for 12 h to obtain dry soil of constant weight. The experimental water was distilled water.

2.2. Experimental Design

2.2.1. Determination of Experimental Factors

During the planting period of rape and wheat, the water retention characteristics of paddy soil have a great impact on the cultivation quality and crop growth. According to the agronomic requirements of rape and wheat planting, the moisture content of the plough layer after rice harvesting is within 35%, which is suitable for cultivation. The soil moisture content could be controlled by drying the field or irrigating the soil [15,16]. Referring to the relevant research on the moisture content of paddy soil [17], the range of values of the moisture content was set from 15% to 35%.
The middle and lower reaches of the Yangtze River (111°~123° E, 27°~34° N) are in a typical temperate subtropical monsoon climate zone. The altitude is 5 to 100 m, and mostly below 50 m above sea level. The annual precipitation, the average annual temperature, and the frost-free period are 1000~1500 mm, 14~18 °C, and 210~270 days, respectively. The planting system included rice–rape and rice–wheat rotation systems in this region. The Chinese Soil Series, the Soil Types of Hubei Province, and the data of the National Earth System Science Data Center were consulted to determine the range of values of the bulk density in the plough layer of the dry cropping period [18,19].
As shown in Table 2, the bulk density of the paddy soil in the middle and lower reaches of the Yangtze River was in the range of 1.1 to 1.2 g·cm−3. The bulk density in the range of 1 to 1.6 g·cm−3 accounted for 95.7% of the total data. If divided by 0.15 g·cm−3, the data in the range of 1.15 ± 0.075 g·cm−3 accounted for a total of 54.1% of the data, which was significantly higher than other ranges. When the bulk density of the soil sample was less than 1 g·cm−3, experimental indicators were not easy to measure. Therefore, the range of values of the bulk density was set from 1 to 1.6 g·cm−3.

2.2.2. Preparation of Experimental Specimens

The experiment was conducted in the Key Laboratory of Agricultural Equipment in the Middle and Lower Reaches of the Yangtze River, Ministry of Agriculture and Rural Affairs, Huazhong Agricultural University, from September to December 2019. Based on the above analysis, 5 experimental levels were set for each experimental factor (Table 3), and repeated 5 times for each experimental level. The soil cohesion, tangential adhesion, plasticity index, and swelling rate were considered as experimental indexes. When determining the influence of paddy soil bulk density changes on the experimental indexes, the moisture content was set to 20%. When determining the influence of the moisture content changes on the experimental indexes, the bulk density was set to 1.15 g·cm−3.
The dried soil was ground and crushed, and then sieved for use. According to the experimental levels of moisture content, the required water mass was calculated, and dried soil was evenly sprayed with water and fully mixed to make samples. The samples were placed into a sealed box and remained stationary for 24 h. When the samples were used, they needed to be stirred again. The moisture content was measured by a water rapid measuring instrument, and the moisture content error was controlled within ±1%. The required sample mass was calculated based on the volume of the experimental container (61.8 mm inner diameter × 20 mm height of the cutting ring, 50 mm inner diameter × 40 mm height of the soil cup, 200 mm length × 120 mm width × 60 mm height of the experimental box) and the value of the bulk density level.

2.3. Methods

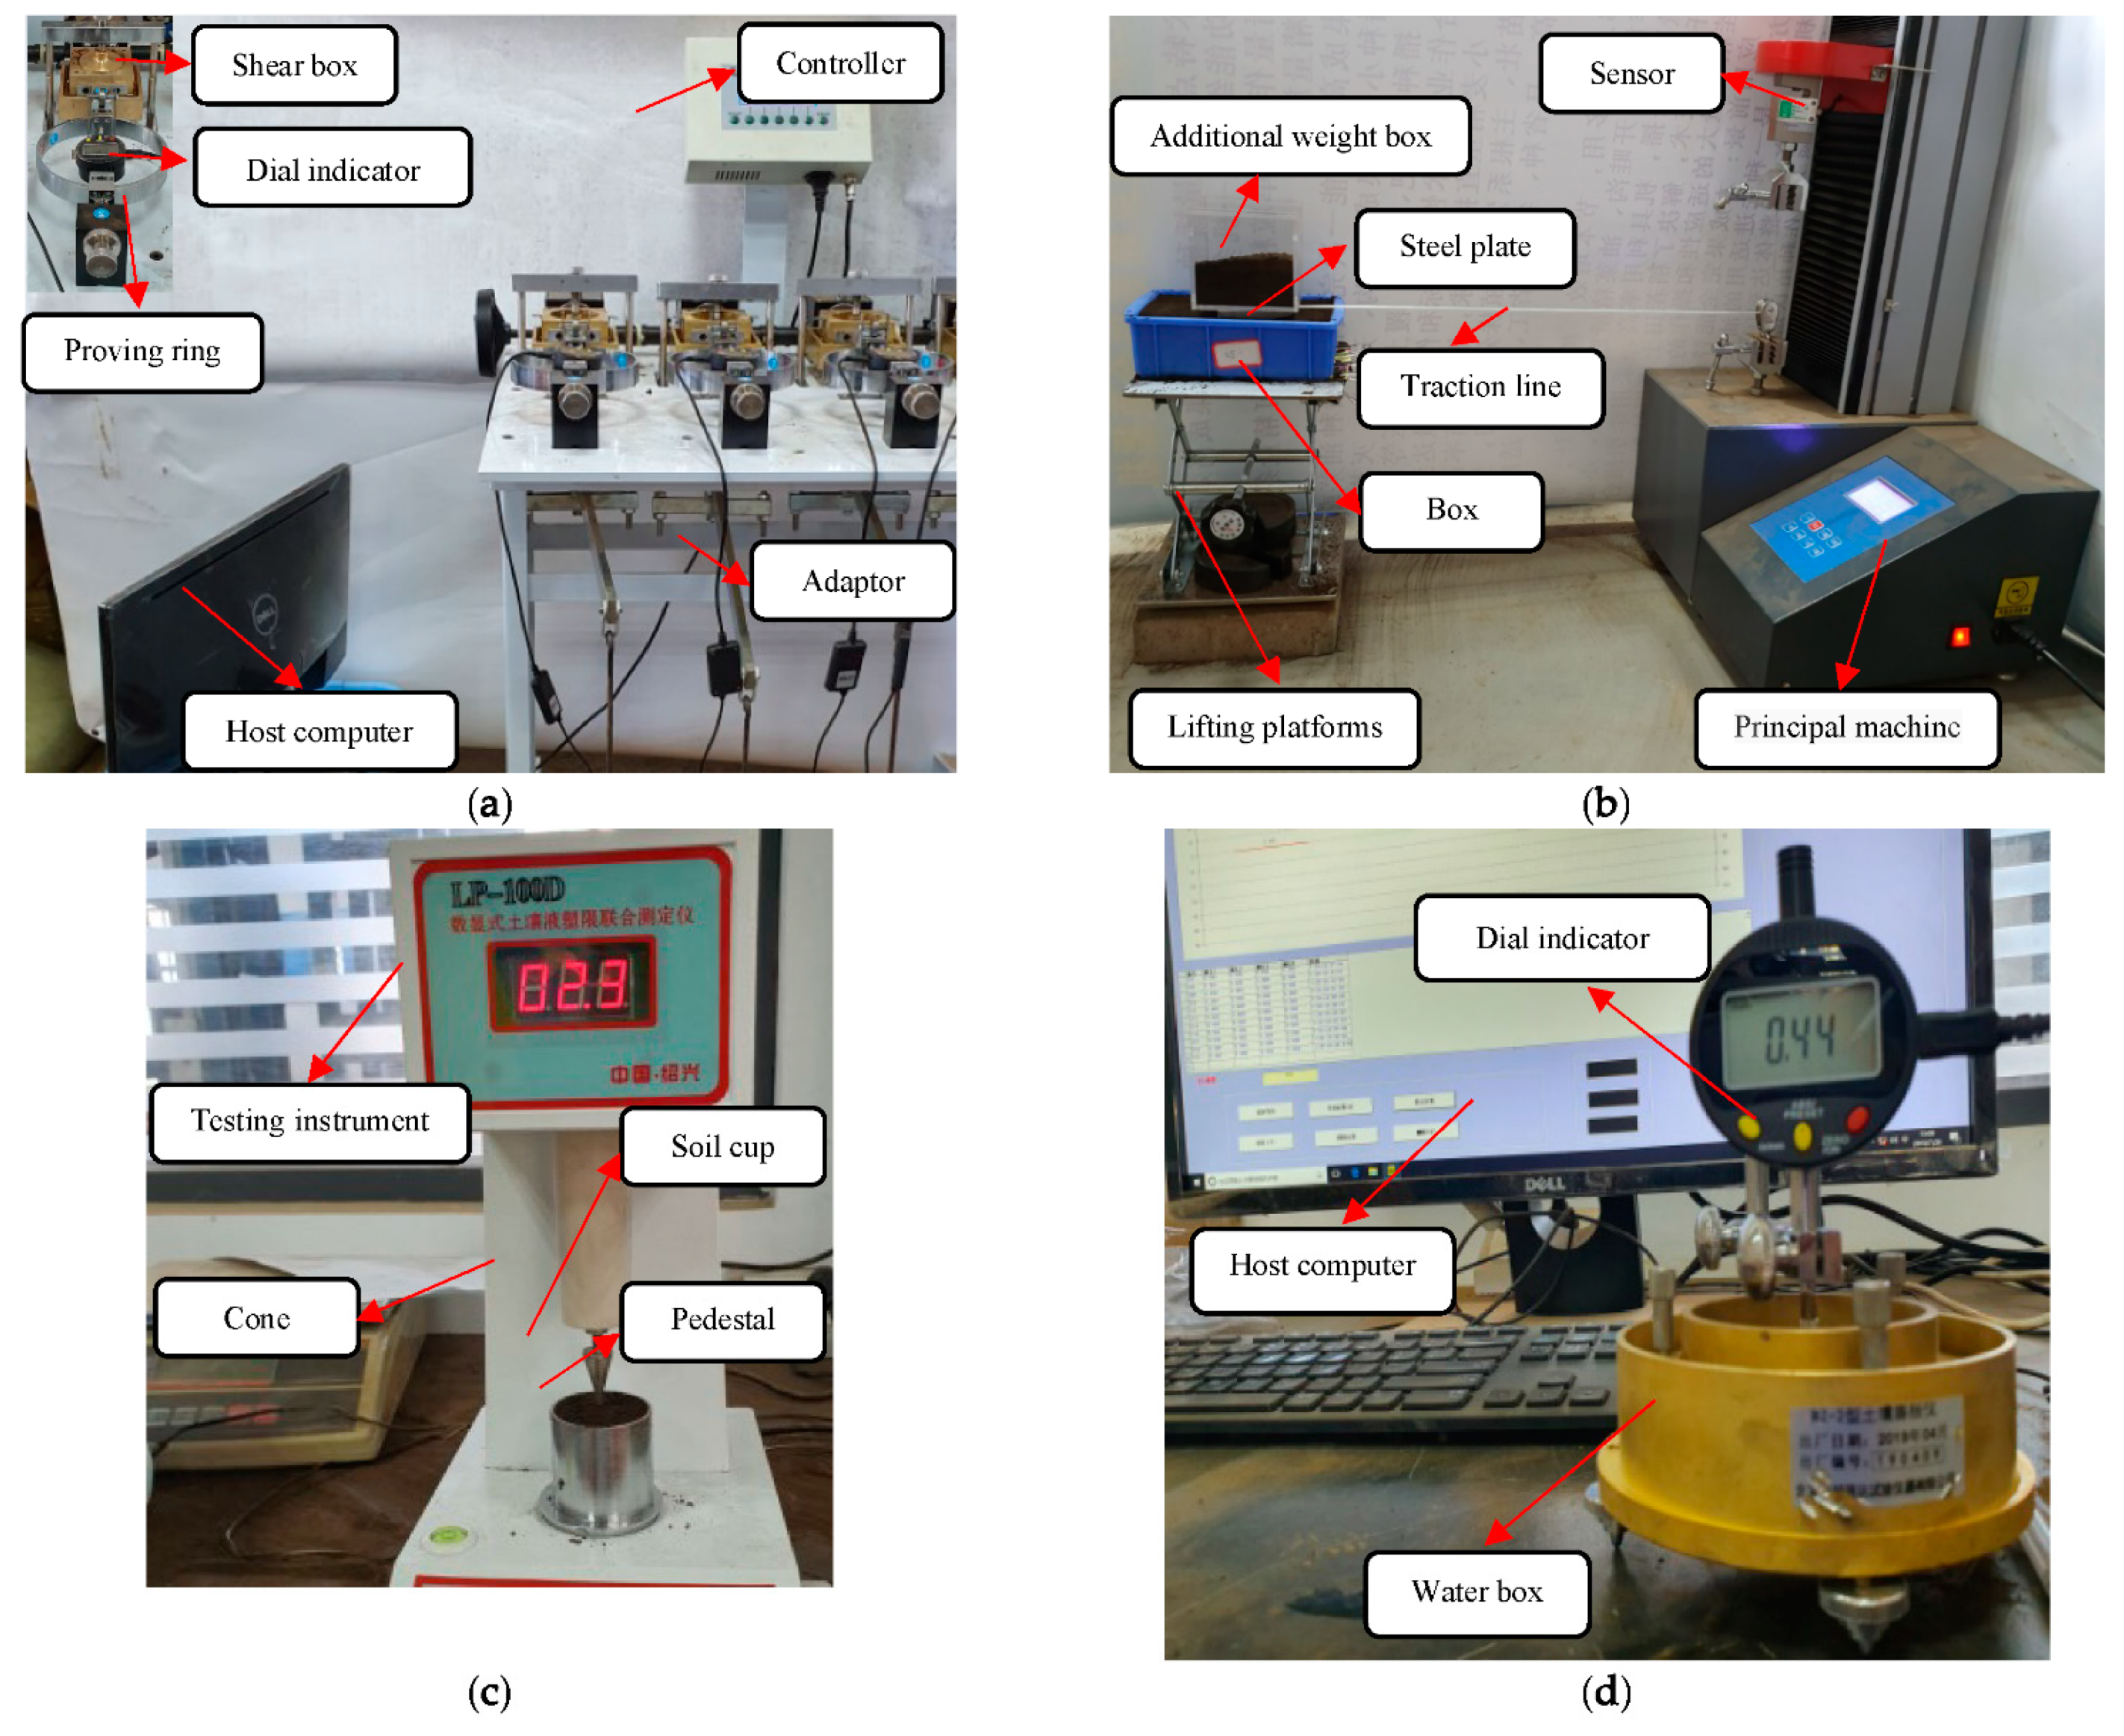
Referring to the “Geotechnical test method standard GB/T50123-2019”, the ZJ-4L strain-controlled direct shear apparatus, the LP-100D digital display soil liquid-plastic limit determinator, and the WZ-2 soil dilatometer were used to determine the paddy soil cohesion, plasticity index, and swelling rate, and the soil adhesion test bench was built to measure the tangential adhesion of paddy soil. The test apparatuses are shown in Figure 2.

2.3.1. Cohesion

Soil cohesiveness referred to the property of bonding behavior between soil particles through molecular gravity. Therefore, soil could resist damage and dispersion. The strength of soil cohesiveness was expressed by cohesion [20]. The four soil samples were placed in four shear boxes (Figure 2a), and different normal loads, σ (100, 200, 300, 400 kPa), were applied to the soil samples of the same experimental level. The temperature in the laboratory was 20 °C. The four proving rings were installed sequentially from left to right, and their calibration coefficients, C, were 1.784, 1.802, 1.887, and 1.919 kPa/0.01 mm, respectively. Due to the contact between the proving ring and the dial indicator, the sample was sheared, causing the proving ring to be squeezed, which led to the change of the reading of the dial indicator. The dial indicator (the measuring range of 10 mm, and the division value of 0.01 mm) and the data adapter were connected to the host computer to record data in real time. Through the controller, the shear speed and shear displacement were set to 0.8 mm·min−1 and 6 mm, respectively. If the reading of the dial indicator showed a peak value with the increase of shear displacement, the peak point value was selected as the value of the dial indicator, R0. If the peak value did not appear with the increase of shear displacement, the reading at a shear displacement of 6 mm was selected as the value of the dial indicator, R0. The soil cohesion force, c, and the angle of internal friction, ϕ, were calculated as follows:
{ τ f = C R 0 × 100 c = τ f σ tan ϕ
where τf is the soil shear strength, in kPa.

2.3.2. Adhesion

Soil adhesiveness was the property of soil that adhered to external objects. When the relative movement between the soil and the tool occurred along the tangential direction of the contact surface, the adhesion resistance of the soil to the tool was called the tangential adhesion force [21]. The effective touch area of the soil touching the steel plate was 50 cm2. The material, weight, and surface roughness of the steel plate were Q235 steel, 510 ± 5 g, and 0.21 μm, respectively. As shown in Figure 2b, the right side of the steel plate was connected with the tension sensor (measuring range of 100 N, relative error within ±1%) by a non-elastic traction line, and traction speed was set to 10 mm·min−1 through the host computer. The lifting platform was adjusted to make the traction line flat. The steel plate was placed on the prepared soil sample and stood still for 5 min for measurement, and the tangential adhesion value was read in real time. The weight of the additional weight box above the steel plate was changed (5, 10, 15 N) to obtain the tangential force–displacement curve of different normal positive pressures, and a set of tangential force, τmax, was obtained. The scatter diagram of tangential adhesion and positive pressure were marked in the coordinate system, and a regression line was obtained according to the scatter diagram. The tangential adhesion, ca, and angle of external friction, φ, were obtained:
{ τ max = N tan φ + c 0 c a = c 0 A
where c0 is the intercept of the line on the τ axis, N, and A is the effective contact area of the soil-touching steel plate and the soil, m2.

2.3.3. Plasticity Index

Under a certain moisture content, the shape of the soil could be changed by external force, and the shape was maintained after the external force disappeared, which was called soil plasticity. The water content when the soil started to become plastic was called the plastic limit of the soil. The water content when the soil started to flow was called the liquid limit of the soil [22]. In order to prevent the specimen overflowing from the soil cup and ensure the accuracy of the experiment, the moisture content was set to 20%, 25%, and 30%. As shown in Figure 2c, the 76 g cone with a cone angle of 30° was installed, and the soil samples of different experimental levels were placed into the soil cup. By adjusting the height of the cone, the cone point lightly touched the surface of the sample, and the penetration depth of the cone into the soil was measured. The cone point touch position was changed (the distance between the two penetration positions of the cone point was not less than 1 cm) to repeat the experiment. According to the measurement results, the relationship curve between cone penetration depth and moisture content was drawn in the double logarithmic coordinate system. When the cone penetration depth was 10 and 2 mm, the moisture content of the soil sample was at the liquid limit, LL, and plastic limit, PL, of the soil sample. The plasticity of soil was usually measured by the plasticity index, IP:
I P = L L P L

2.3.4. Swelling Rate

Soil expansibility refers to the soil volume increasing phenomenon due to water absorption [23]. As shown in Figure 2d, according to the requirement of the experimental levels, the prepared soil samples with different moisture content were placed in the cutting ring. The outer wall of the cutting ring was cleaned up, the soil sample was compacted, and bulk density was adjusted. The total mass of the cutting ring and soil sample were weighed, and its error was controlled to less than 0.1 g. The soil sample and the cutting ring were placed on the permeable stone in the water box, and distilled water was added (the water surface was kept flat with the upper-end surface of the sample). Due to the soil swelling after absorbing water, the reading of the dial indicator changed. The dial indicator connected with the host computer to record the reading of the dial indicator of 1 to 10 min, 20 to 60 min, and 2 to 24 h in real time, and the calculation formula was as follows [24]:
{ Δ V = Δ h h × 100 % Δ h = h 1 h 0
where ΔV is the soil swelling rate, %, h is the thickness of the soil sample in the cutting ring before the measurement, which is 20 mm, Δh is the difference of the reading of the dial indicator before and after the measurement, mm, h1 is the reading of the dial indicator after the measurement, mm, and h0 is the reading of dial indicator before the measurement, mm.

3. Results

3.1. Changes in the Cohesion of Paddy Soil

High cohesiveness had negative effects on soil breakage during tillage and restricted the tillage quality of soil. Figure 3 shows the variation trend of the cohesion of paddy soils under different bulk density and moisture content. It could be seen from Figure 3a that as the bulk density varied from 1 to 1.6 g·cm−3, the cohesion and angle of internal friction of paddy soil tended to increase. When the bulk density of paddy soil reached 1.45 g·cm−3 or above, the cohesion was significantly different compared with that under the bulk density of 1 and 1.15 g·cm−3 (p < 0.05). The angles of internal friction for the bulk density of 1, 1.3, and 1.6 g·cm−3 were significantly different from each other (p < 0.05), with an increasing ratio of about 12.5%.
The influence of moisture content on the cohesion of paddy soil is shown in Figure 3b. With the moisture content changed from 15% to 35%, the differences of cohesion were significant (p < 0.05), and the curve showed a trend of first increasing and then decreasing. When moisture content was 20%, cohesion reached the peak value, which was 30.81 kPa. The angle of internal friction decreased gradually with the increase of moisture content from 15% to 35%, and the differences were also significant (p < 0.05). For each 5% increase of moisture content, the angle of internal friction decreased by about 23.2%.

3.2. Changes in the Tangential Adhesion of Paddy Soil

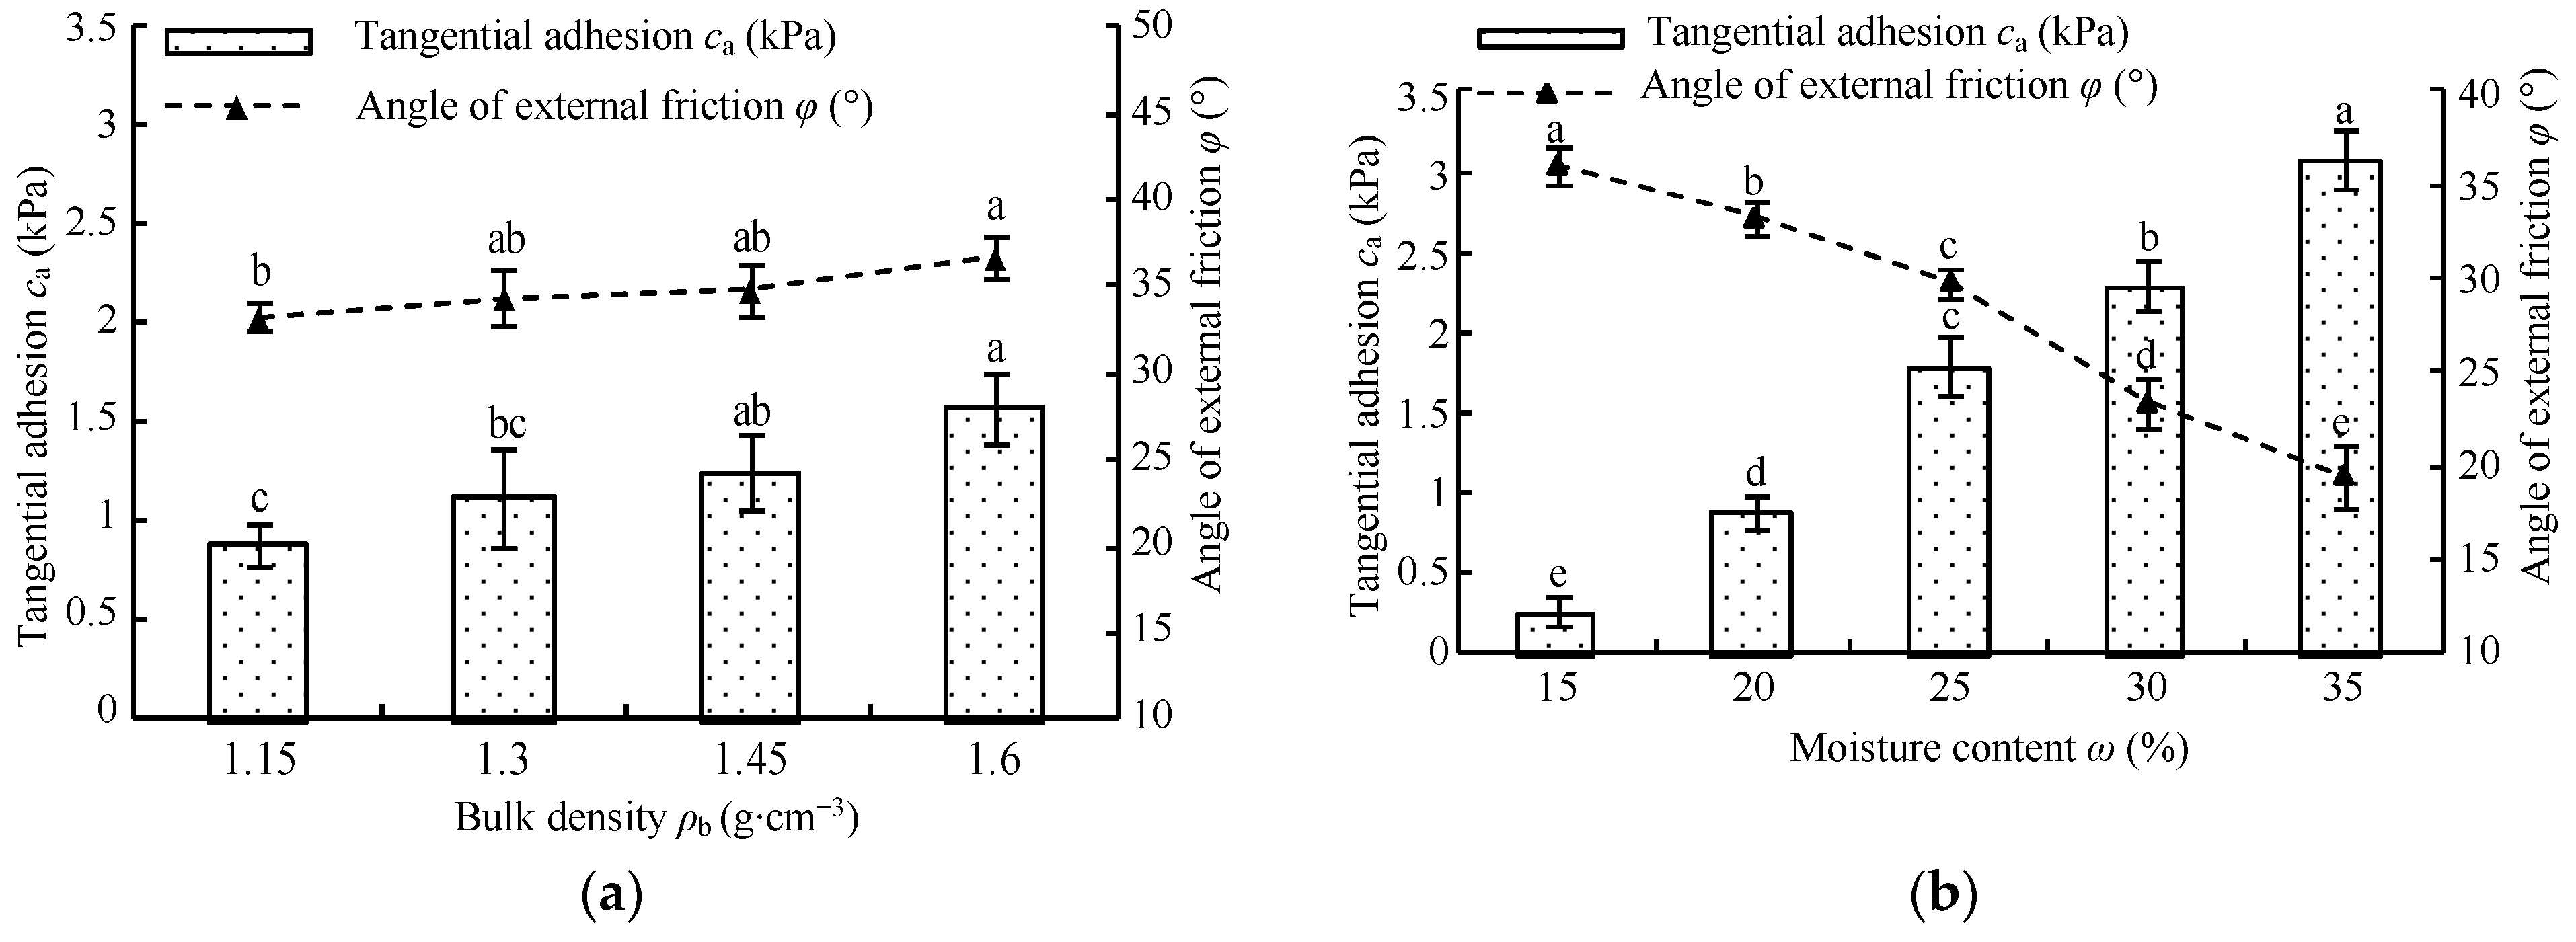
The tangential adhesion of soil affected the working resistance of the tool. Figure 4 shows the variation trend of the tangential adhesion of paddy soil with different bulk density and moisture content. With the bulk density increased from 1.15 to 1.6 g·cm−3, the tangential adhesion and angle of external friction both increased. When the normal pressure was 15 N and the bulk density was 1 g·cm−3, due to sinking of the steel plate, the measurement error was large, so it was abandoned. For tangential adhesion, there were significant differences between 1.15 and the 1.45 g·cm−3, and between 1.3 and 1.6 g·cm−3 (p < 0.05). For the angle of external friction, there were significant differences between 1.15 and 1.6 g·cm−3 (p < 0.05).
As the moisture content of paddy soil increased from 15% to 35% (Figure 4b), the tangential adhesion increased, and the angle of external friction decreased. The angle of external friction and tangential adhesion corresponding to different moisture contents showed significant differences (p < 0.05). With the increase of moisture content, the increasing degree of tangential adhesion decreased gradually, while the decreasing degree of the angle of external friction increased gradually. In conclusion, compared with bulk density (1 to 1.6 g·cm−3), the change of moisture content in the range of 15% to 35% had a greater impact on the tangential adhesion and the angle of external friction. The reduction of bulk density and moisture content can reduce the tangential adhesion to a lower level.

3.3. Changes in the Plastic Index of Paddy Soil

The greater plasticity index represented the stronger plasticity of soil. As a result, it was more difficult to break up soil in the process of cultivation. Figure 5 shows the relation curve between the cone penetration depth, h, and moisture content, ω, in the double logarithmic coordinate system under different bulk density. Under the same bulk density, the cone penetration depth increased with the increase of moisture content. The cone penetration depth of the same moisture content decreased with the increase of bulk density. Among them, bulk densities of 1 and 1.3 g·cm−3, 1.15 and 1.45 g·cm−3, and 1.3 and 1.6 g·cm−3 showed significant differences in cone penetration depth (p < 0.05, as shown in Figure 5).
According to the relation curve in Figure 5, power function h = xwd was used for fitting, where x was the subsidence coefficient and d was the subsidence exponent. The fitting results are shown in Table 4, and R2 values were not less than 0.99. It indicated that cone penetration depth and moisture content had a good power function relationship. When moisture content was constant and bulk density increased from 1 to 1.6 g·cm−3, the percentage increases of the plastic limit and liquid limit were 14.80% and 24.49%, respectively. The increase of the liquid limit was greater than that of the plastic limit, resulting in the increase of the plasticity index, with the percentage increase of 35.81%. Therefore, reducing the bulk density helped to decrease the plasticity index, which made paddy soil easier to break.

3.4. Changes in the Swelling Rate of Paddy Soil

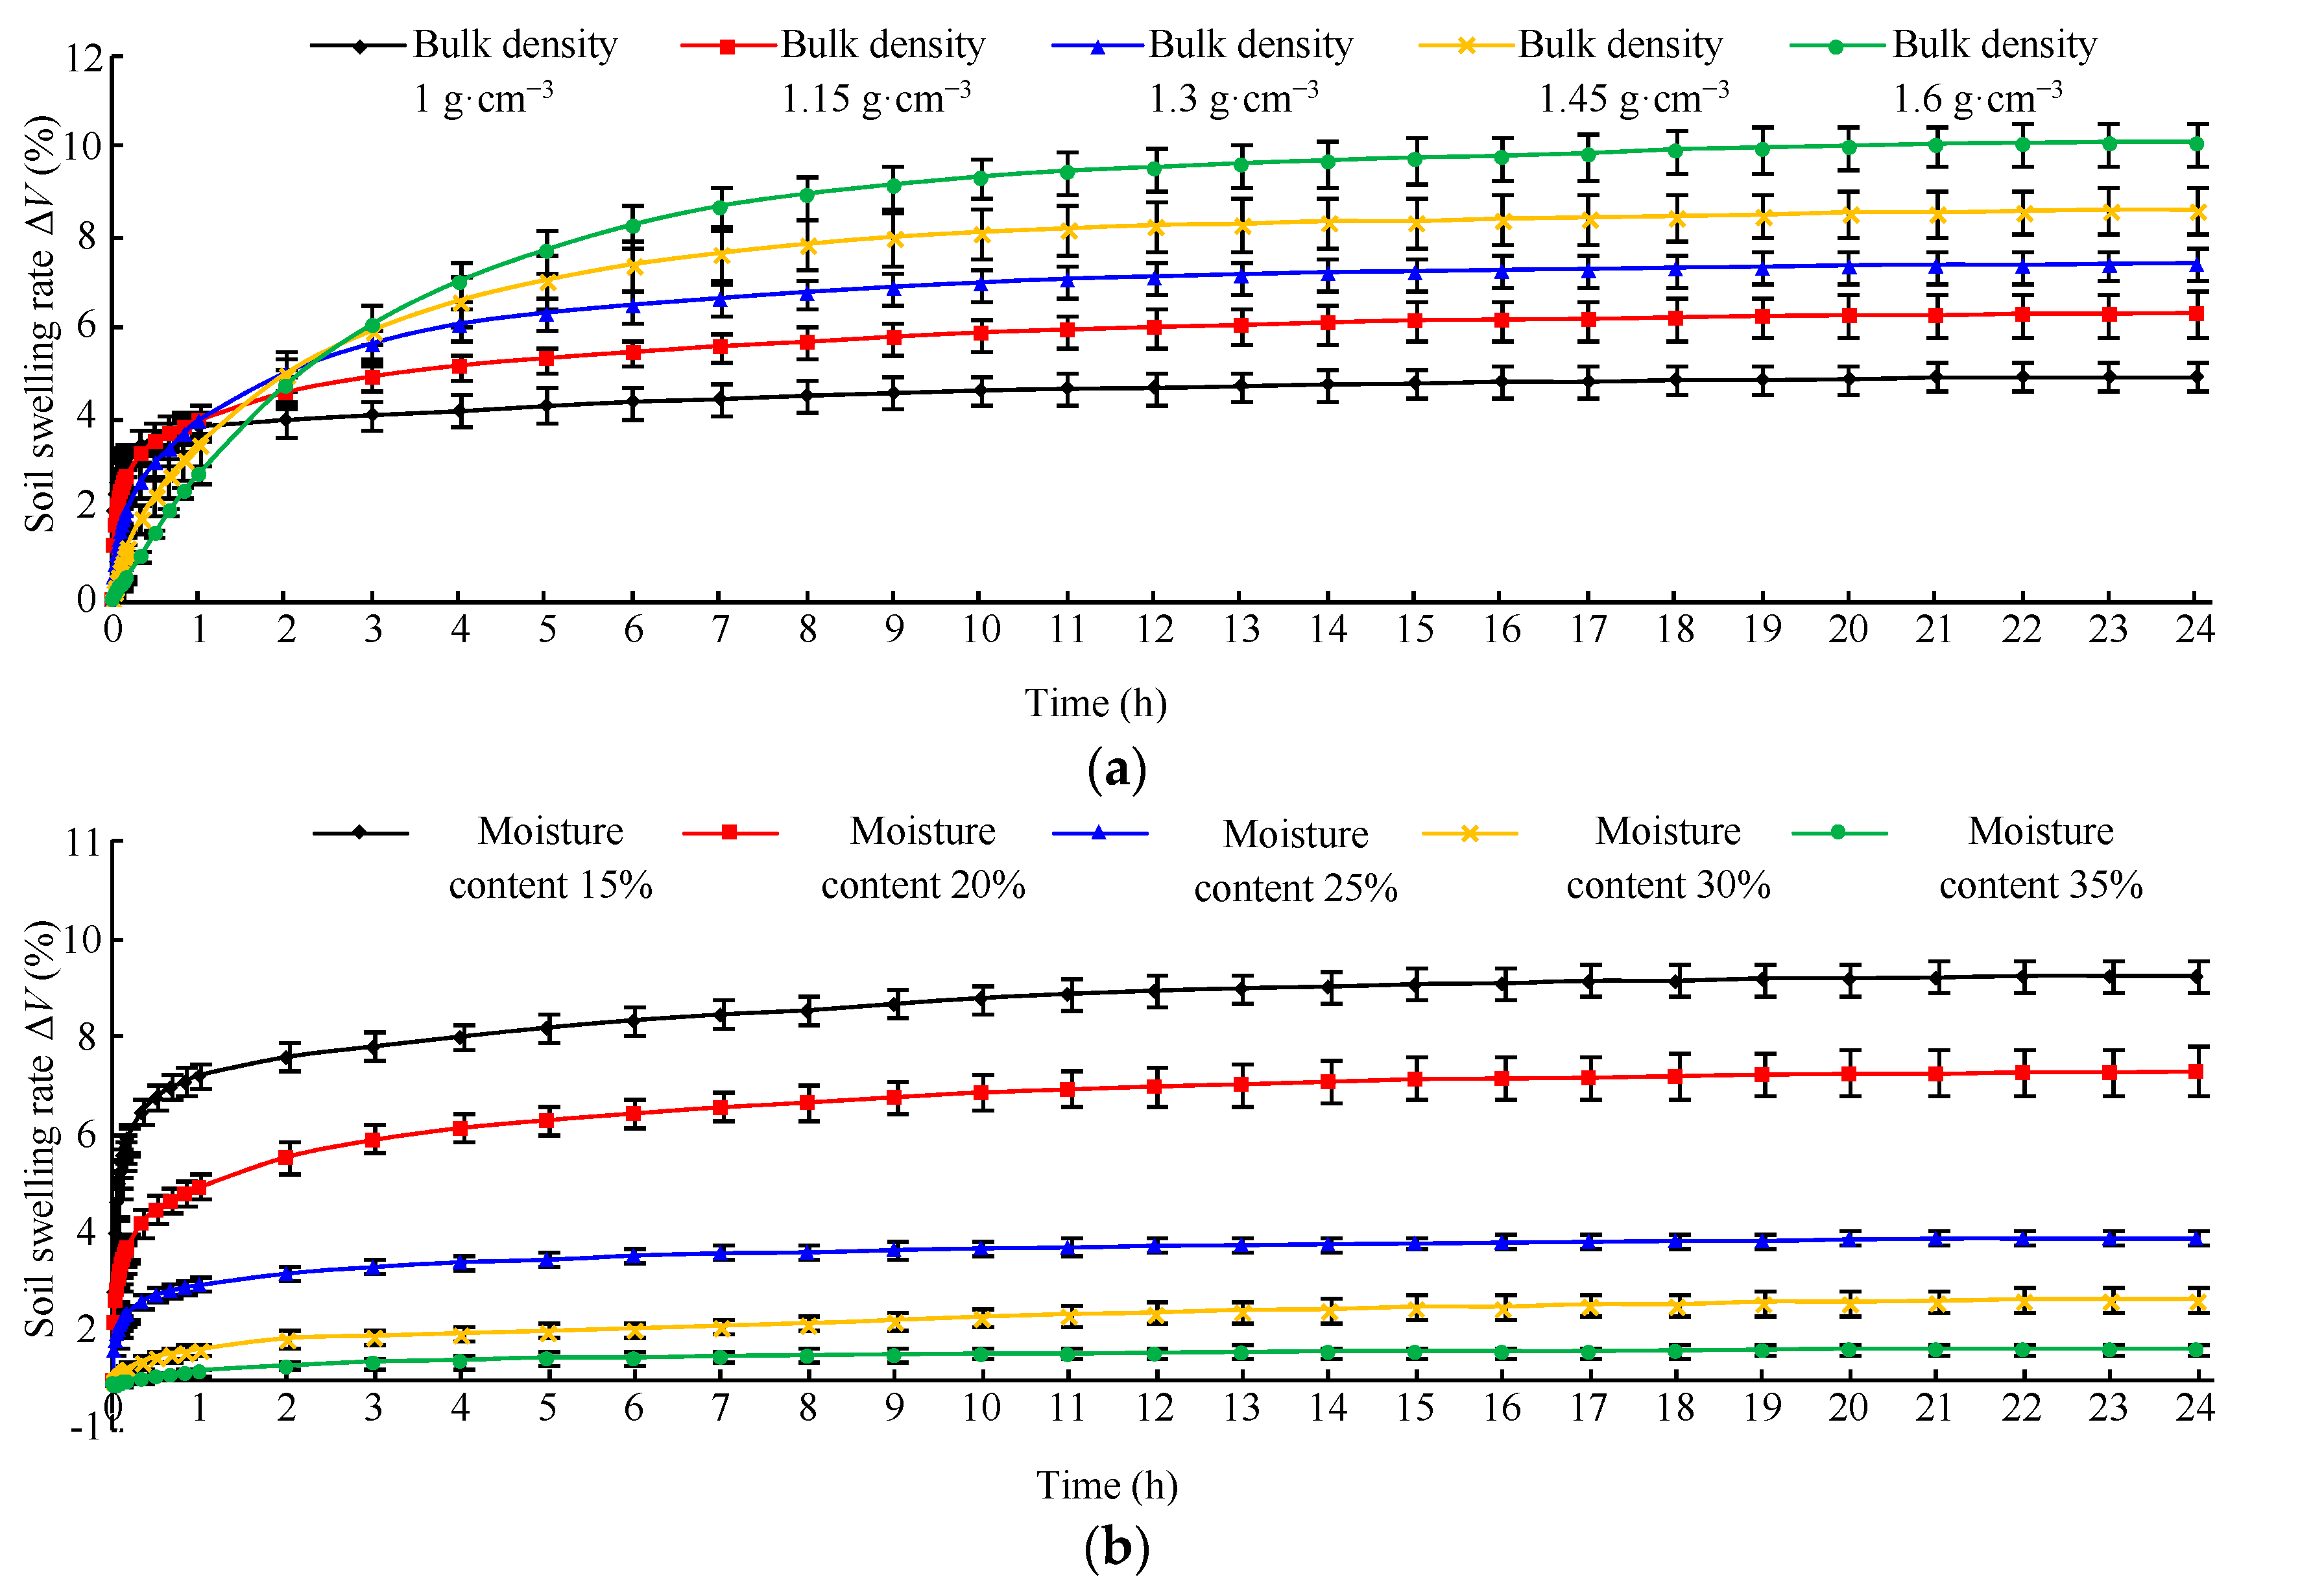
Soil with a large swelling rate had poor permeability, which will break plant roots when losing water, making it more likely to form cracks for ventilation and heat dissipation. Figure 6 shows the relation curve of soil swelling rate with time. When soil absorbed water and expanded rapidly, the swelling rate increased rapidly in the initial linear acceleration stage. Then, swelling rate entered the arc deceleration phase. In this phase, the deformation was relatively small, and the duration was relatively long. In the end, soil swelling rate increased very slowly until it became stabilized. The moisture content of soil samples reached saturation state, and the final stable value was the swelling rate of paddy soil. Figure 6a shows the influence of different bulk density with time on the swelling rate of paddy soil. The bulk density increased successively from 1 to 1.6 g·cm−3, and the stable values were 4.947%, 6.337%, 7.415%, 8.602%, and 10.073% respectively, with significant differences (p < 0.05).
As shown in Figure 6b, the stable values corresponding to the moisture content of 15%, 20%, 25%, 30%, and 35% were 8.267%, 6.337%, 2.950%, 1.683%, and 0.683%, respectively. There were significant differences in stable swelling rates (p < 0.05). When the moisture content was 35%, due to high soil moisture content and the gravity of the dial indicator, the initial swelling rate first dropped from 0% to −0.05% and then increased to the stable value.
In conclusion, the changes of bulk density and moisture content had an influence on the swelling rate of paddy soil in the plough layer. Higher bulk weight and lower water content resulted in a higher swelling rate of paddy soil in the plough layer. Therefore, it was suggested to reduce the bulk density of soil, and keep a certain amount of water, so as to improve the expansibility of paddy soil.

4. Discussion

4.1. Analysis of the Reasons for the Effect of Bulk Density on the Physico-Mechanical Properties of Paddy Soil in the Plough Layer

Soil bulk density was an important index of the looseness of agricultural soil and had a significant effect on tillage quality. Mouzaen et al. showed that under certain conditions of water content, the tillage resistance of the deep loosening shovel tended to increase when the bulk weight increased within 1.3 to 2.0 Mg/m3 [25]. Hakansson et al. concluded that increasing soil bulk density increased soil permeability resistance and compactness, but decreased porosity, which affected farming and crop growth [26]. In this study, it was found that when the bulk density increased in the range of 1 to 1.6 g∙cm−3, the cohesion, tangential adhesion, plasticity index, and swelling rate tended to increase, which further explained the internal reasons for the increase of tillage resistance and the non-breakability of paddy soil caused by the increase of bulk density. Pies et al. found that increasing soil bulk density would reduce soil porosity [27]. The study of Villar showed that as the dry density of the soil increased, the swelling and deformation capacity increased [28]. Luckham et al. concluded that soil mucilage particles had the property of colloids with strong surface adsorption capacity, and increasing the number of clay particles resulted in more significant adsorption properties of the soil [29]. Havaee et al. found a significant positive correlation between soil adhesion and clay particle content [30]. Zhang et al. similarly concluded that when the soil bulk density of clay was large, it had high adsorption capacity [31]. Combined with this study, it was shown that when the clay content of paddy soil was 42.46%, increasing bulk density increased the clay content of unit volume. The adsorption amount or adsorption area between soil and soil, steel plate, and water increased, which leaded to the increase of adhesion, cohesion, plasticity index, and swelling rate.

4.2. Analysis of the Reasons for the Effect of Moisture Content on the Physico-Mechanical Properties of Paddy Soil in the Plough Layer

It can be seen from the experiment that the paddy soil cohesion showed a trend of first increasing and then decreasing with the increase of moisture content (Figure 3b). Wei et al. concluded that when the soil moisture content was low, the electrostatic attraction between soil particles was strong. As the number of water molecules increased, the electrostatic attraction and cohesion increased. However, after the soil moisture content increased to a certain value, the soil particles were separated by water film, which resulted in the cohesion decrease [32]. Al-Shayea et al. considered that water in soil could be divided into free water and absorbed water. Absorbed water was adsorbed on the surface of clay particles to increase the cohesion between soil particles, and free water acted as a lubricant. When the water in the soil increased, the free water increased and formed a thicker water film, reducing the cohesive force [33]. The above findings revealed the reasons for the variation of paddy soil cohesion with moisture content in this study.
Moisture content of paddy soil showed a significant positive correlation with adhesion (Figure 4b). However, Zhang et al. concluded that the tangential adhesion between sandy loam and steel increased rapidly with the increase of water content and then gradually decreased to a relatively stable value, with the maximum adhesion at about 30% moisture content [34]. Neal also concluded that the adhesion of soil decreased when the moisture content increased to a certain amount, which was different from the conclusion of this study [35]. On the one hand, it showed that the paddy soil in this study could maintain a high adhesion in a wider range of moisture content. On the other hand, because of the high surface tension of the steel plate, part of the free water was absorbed, which reduced the thickness of the water film at the interface between the soil sample and the steel plate, and increased the adhesion of the paddy soil [36].
It could be concluded that the moisture content of the paddy soil was negatively correlated with the swelling rate (Figure 6b). The reasons were that when the initial moisture content of paddy soil is small (0~15%), more pores existed in the soil, the soil suction was large, the water absorption was fast, and the expansion rate increased rapidly. The swelling deformation mainly occurred within 30 min after the soil dilatometer was filled with water (Figure 6b), and the final stable values of swelling rate were larger. When the initial moisture content in the soil was large (>20%), the pores in the soil were occupied by existing water, and the growth of water absorption rate and swelling rate slowed down, which inhibited external water from entering the soil and reduced the swelling rate [37,38].

5. Conclusions

By statistically analyzing the information of paddy soil in six provinces and one city in the middle and lower reaches of Yangtze River, the range of bulk density variation was set from 1 to 1.6 g∙cm−3, and the water content was set at 20%. The index of cohesion, angle of internal friction, tangential adhesion, angle of external friction, plasticity index, and swelling rate of paddy soil showed different degrees of increase with the increase of bulk density. Decreasing the bulk density was beneficial to reduce tillage resistance.
Compared with bulk density, the variation of moisture content of paddy soil has more influence on the cohesion, angle of internal friction, tangential adhesion, and angle of external friction. When the bulk weight was set at 1.15 g∙cm−3, the angle of internal friction and angle of external friction decreased with the increase of moisture content, and the tangential adhesion increased with the increase of water content. The tangential adhesion increased and then decreased with the increase of moisture content, and the peak value appeared when moisture content was 20%.

Author Contributions

Conceptualization, J.C.; methodology, K.Z.; validation, J.C., G.L., and L.X.; investigation, G.L. and L.X.; resources, J.X.; writing—original draft preparation. K.Z.; writing—review and editing, J.C.; supervision, G.L.; project administration, J.X.; funding acquisition, K.Z. All authors have read and agreed to the published version of the manuscript.

Funding

This study was financially supported by a program of China’s National Natural Science Foundation Project (Grant No. 31901412), Natural Science Foundation Project of Hubei Province (Grant No. 2019CFB130), and Special Fund Project of Basic Scientific Research Business Cost of Central University (2662018QD033).

Institutional Review Board Statement

Not applicable.

Informed Consent Statement

Not applicable.

Data Availability Statement

Data sharing not applicable.

Conflicts of Interest

The authors declare no conflict of interest.

References

  1. Jun-Zheng, P.; Zhi-Xiong, L. Prediction of paddy soil normal adhesion to steel surfaces by fuzzy logic. J. Terramechanics 1998, 35, 103–107. [Google Scholar] [CrossRef]
  2. Tiwari, B.; Ajmera, B. A new correlation relating the shear strength of reconstituted soil to the proportions of clay minerals and plasticity characteristics. Appl. Clay Sci. 2011, 53, 48–57. [Google Scholar] [CrossRef]
  3. Mouazen, A.M.; Ramon, H.; de Baerdemaeker, J. SW—Soil and water. Biosyst. Eng. 2002, 83, 217–224. [Google Scholar] [CrossRef]
  4. Liu, X.; Liu, E.; Zhang, D.; Zhang, G.; Yin, X.; Song, B. Study on effect of coarse-grained content on the mechanical properties of frozen mixed soils. Cold Reg. Sci. Technol. 2019, 158, 237–251. [Google Scholar] [CrossRef]
  5. Smith, C.; Johnston, M.; Lorentz, S. The effect of soil compaction and soil physical properties on the mechanical resistance of South African forestry soils. Geoderma 1997, 78, 93–111. [Google Scholar] [CrossRef]
  6. Rezaee, L.; Moosavi, A.A.; Davatgar, N.; Sepaskhah, A.R. Shrinkage-swelling characteristics and plasticity indices of paddy soils: Spatial variability and their influential parameters. Arch. Agron. Soil Sci. 2020, 66, 2005–2025. [Google Scholar] [CrossRef]
  7. Chen, Z.; Li, P.; Jiang, S.; Chen, H.; Wang, J.; Cao, C. Evaluation of resource and energy utilization, environmental and economic benefits of rice water-saving irrigation technologies in a rice-wheat rotation system. Sci. Total Environ. 2021, 757, 143748. [Google Scholar] [CrossRef] [PubMed]
  8. Zhu, D.; Zhang, J.; Lu, J.; Cong, R.; Ren, T.; Li, X. Optimal potassium management strategy to enhance crop yield and soil potassium fertility under paddy-upland rotation. J. Sci. Food Agric. 2021, 101, 3404–3412. [Google Scholar] [CrossRef] [PubMed]
  9. Fang, Y.; Ren, T.; Zhang, S.; Liu, Y.; Liao, S.; Li, X.; Cong, R.; Lu, J. Rotation with oilseed rape as the winter crop enhances rice yield and improves soil indigenous nutrient supply. Soil Tillage Res. 2021, 212, 105065. [Google Scholar] [CrossRef]
  10. Zhou, H.; Fang, H.; Mooney, S.; Peng, X. Effects of long-term inorganic and organic fertilizations on the soil micro and macro structures of rice paddies. Geoderma 2016, 266, 66–74. [Google Scholar] [CrossRef] [Green Version]
  11. Yang, Z.-P.; Xu, M.-G.; Zheng, S.-X.; Nie, J.; Gao, J.-S.; Liao, Y.-L.; Xie, J. Effects of long-term winter planted green manure on physical properties of reddish paddy soil under a double-rice cropping system. J. Integr. Agric. 2012, 11, 655–664. [Google Scholar] [CrossRef]
  12. Zhang, Z.; Peng, X.; Wang, L.; Zhao, Q.; Lin, H. Temporal changes in shrinkage behavior of two paddy soils under alternative flooding and drying cycles and its consequence on percolation. Geoderma 2013, 192, 12–20. [Google Scholar] [CrossRef]
  13. Tang, H.; Xiao, X.; Li, C.; Tang, W.; Cheng, K.; Pan, X.; Wang, K.; Li, W. Effects of different soil tillage systems on soil carbon management index under double-cropping rice field in southern China. Agron. J. 2019, 111, 440–447. [Google Scholar] [CrossRef]
  14. Huang, M.; Zou, Y.; Jiang, P.; Xia, B.; Feng, Y.; Cheng, Z.; Mo, Y. Effect of tillage on soil and crop properties of wet-seeded flooded rice. Field Crop. Res. 2012, 129, 28–38. [Google Scholar] [CrossRef]
  15. Zhang, C.; Li, X.; Yan, H.; Ullah, I.; Zuo, Z.; Li, L.; Yu, J. Effects of irrigation quantity and biochar on soil physical properties, growth characteristics, yield and quality of greenhouse tomato. Agric. Water Manag. 2020, 241, 106263. [Google Scholar] [CrossRef]
  16. Bartzanas, T.; Bochtis, D.; Sørensen, C.; Sapounas, A.; Green, O. A numerical modelling approach for biomass field drying. Biosyst. Eng. 2010, 106, 458–469. [Google Scholar] [CrossRef]
  17. Jiang, Q.; Cao, M.; Wang, Y.; Wang, J.; He, Z. Quantification of the soil stiffness constants using physical properties of paddy soils in Yangtze Delta Plain, China. Biosyst. Eng. 2020, 200, 89–100. [Google Scholar] [CrossRef]
  18. Zhang, G. Chinese Soil Series, 1st ed.; Science Press: Beijing, China, 2017. [Google Scholar]
  19. Soil and Fertilizer Station of Hubei Province. Soil Survey Office of Hubei Province. Hubei Provincial Soil Species Journal; Hubei Science and Technology Press: Wuhan, China, 2015; pp. 329–569.
  20. Ucgul, M.; Fielke, J.; Saunders, C. Three-dimensional discrete element modelling (DEM) of tillage: Accounting for soil cohesion and adhesion. Biosyst. Eng. 2015, 129, 298–306. [Google Scholar] [CrossRef]
  21. Barzegar, M.; Hashemi, S.; Nazokdast, H.; Karimi, R. Evaluating the draft force and soil-tool adhesion of a UHMW-PE coated furrower. Soil Tillage Res. 2016, 163, 160–167. [Google Scholar] [CrossRef]
  22. Arthur, E.; Rehman, H.U.; Tuller, M.; Pouladi, N.; Nørgaard, T.; Moldrup, P.; de Jonge, L.W. Estimating Atterberg limits of soils from hygroscopic water content. Geoderma 2021, 381, 114698. [Google Scholar] [CrossRef]
  23. Yao, H.; She, J.; Lu, Z.; Luo, X.; Xian, S.; Fang, R.; Chen, Z. Inhibition effect of swelling characteristics of expansive soil using cohesive non-swelling soil layer under unidirectional seepage. J. Rock Mech. Geotech. Eng. 2019, 12, 188–196. [Google Scholar] [CrossRef]
  24. Zhang, S.; Leng, X.; Sheng, Q.; Li, B.; Zhou, Y. Swelling and shrinkage characteristics study of Lushi expansive rock under dry and wet circulation. Rock Soil Mech. 2019, 40, 1–11. [Google Scholar] [CrossRef]
  25. Mouazen, A.M.; Ramon, H. A numerical-statistical hybrid modelling scheme for evaluation of draught requirements of a subsoiler cutting a sandy loam soil, as affected by moisture content, bulk density and depth. Soil Tillage Res. 2002, 63, 155–165. [Google Scholar] [CrossRef]
  26. Håkansson, I.; Lipiec, J. A review of the usefulness of relative bulk density values in studies of soil structure and compaction. Soil Tillage Res. 2000, 53, 71–85. [Google Scholar] [CrossRef]
  27. Pires, L.; Cássaro, F.; Bacchi, O.; Reichardt, K. Non-destructive image analysis of soil surface porosity and bulk density dynamics. Radiat. Phys. Chem. 2011, 80, 561–566. [Google Scholar] [CrossRef] [Green Version]
  28. Villar, M.V.; Lloret, A. Influence of dry density and water content on the swelling of a compacted bentonite. Appl. Clay Sci. 2008, 39, 38–49. [Google Scholar] [CrossRef]
  29. Luckham, P.F.; Rossi, S. The colloidal and rheological properties of bentonite suspensions. Adv. Colloid Interface Sci. 1999, 82, 43–92. [Google Scholar] [CrossRef] [Green Version]
  30. Havaee, S.; Mosaddeghi, M.; Ayoubi, S. In situ surface shear strength as affected by soil characteristics and land use in calcareous soils of central Iran. Geoderma 2015, 237-238, 137–148. [Google Scholar] [CrossRef]
  31. Zhang, B.; Zhao, Q.; Horn, R.; Baumgartl, T. Shear strength of surface soil as affected by soil bulk density and soil water content. Soil Tillage Res. 2001, 59, 97–106. [Google Scholar] [CrossRef]
  32. Wei, J.; Shi, B.; Li, J.; Li, S.; He, X. Shear strength of purple soil bunds under different soil water contents and dry densities: A case study in the Three Gorges Reservoir Area, China. Catena 2018, 166, 124–133. [Google Scholar] [CrossRef]
  33. Al-Shayea, N.A. The combined effect of clay and moisture content on the behavior of remolded unsaturated soils. Eng. Geol. 2001, 62, 319–342. [Google Scholar] [CrossRef]
  34. Zhang, J.; Wang, X.; Kito, K.; Sato, K. Characteristics of tangential soil adhesion to tool material at different moisture contents. Int. Agric. Eng. J. 2013, 22, 65–71. Available online: https://www.cabdirect.org/cabdirect/abstract/20133361164 (accessed on 19 August 2021).
  35. Neal, M.S. Friction and adhesion between soil and rubber. J. Agric. Eng. Res. 1966, 11, 108–112. [Google Scholar] [CrossRef]
  36. Jia, X. Theoretical analysis of the adhesion force of soil to solid materials. Biosyst. Eng. 2004, 87, 489–493. [Google Scholar] [CrossRef]
  37. Wang, Q.; Cui, Y.-J.; Tang, A.M.; Xiang-Ling, L.; Wei-Min, Y. Time- and density-dependent microstructure features of compacted bentonite. Soils Found. 2014, 54, 657–666. [Google Scholar] [CrossRef] [Green Version]
  38. Zhang, T.; Deng, Y.; Cui, Y.; Lan, H.; Zhang, F.; Zhang, H. Porewater salinity effect on flocculation and desiccation cracking behaviour of kaolin and bentonite considering working condition. Eng. Geol. 2019, 251, 11–23. [Google Scholar] [CrossRef]
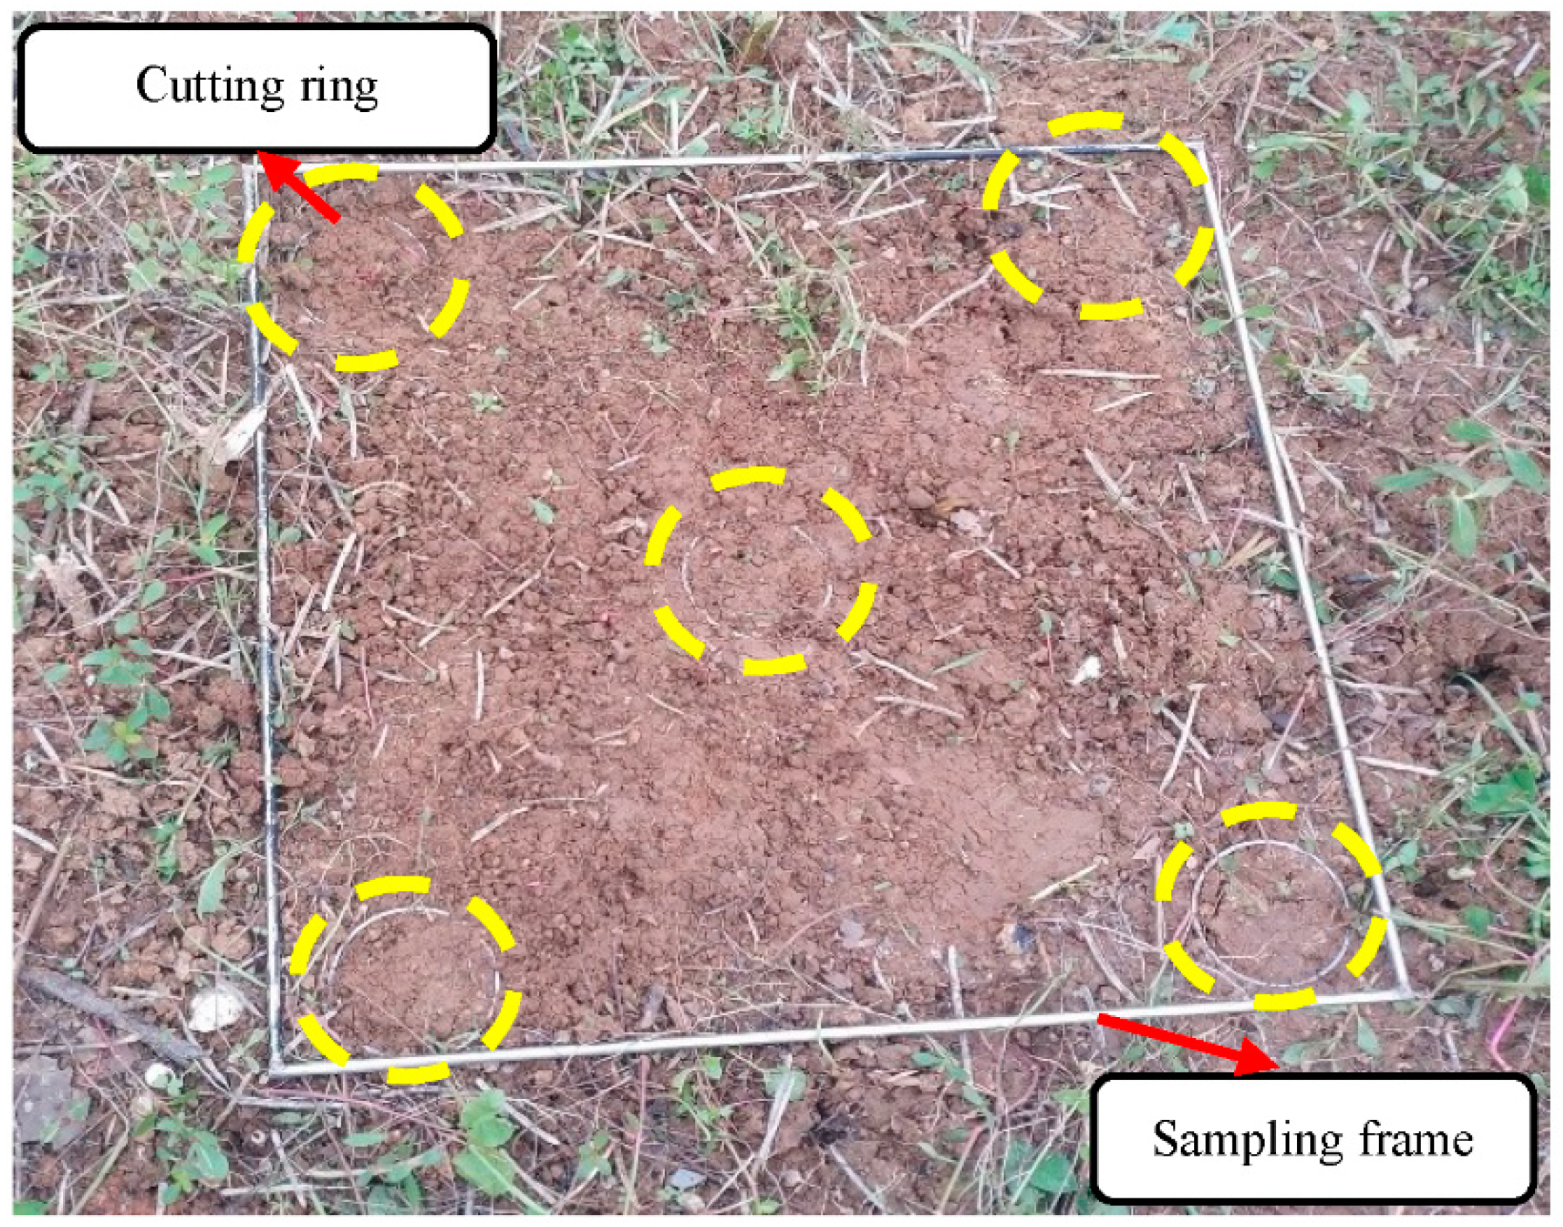
Figure 1. Five-point sampling method.
Water 13 02290 g001
Figure 2. Test instruments: (a) ZJ-4L strain-controlled direct shear apparatus, (b) soil adhesion test bench, (c) LP-100D digital display soil liquid-plastic limit determinator, and (d) WZ-2 soil dilatometer.
Water 13 02290 g002
Figure 3. Changes in paddy soil cohesiveness between treatments: (a) variation of paddy soil in bulk density, and (b) variation of paddy soil in moisture content.
Water 13 02290 g003
Figure 4. Changes in paddy soil adhesion between treatments: (a) variation of paddy soil in bulk density, and (b) variation of paddy soil in moisture content.
Water 13 02290 g004
Figure 5. Relation curves of cone penetration depth and moisture content.
Water 13 02290 g005
Figure 6. Relation curves of swelling rate of paddy soil with time: (a) variation of paddy soil in bulk density, and (b) variation of paddy soil in moisture content.
Water 13 02290 g006
Table 1. Basic physical characteristics of soil samples.
TextureBulk Density (g∙cm−3) (N1 = 10)Moisture Content (%) (N1 = 10)Particle Composition (%)
Average ValueStandard DeviationAverage ValueStandard DeviationClay
<0.002 mm
Silt
0.05~2.0 mm
Sand
0.05~2.0 mm
Silty clay1.150.1520.031.2442.4649.298.05
N1: Number of test repetitions.
Table 2. Bulk density of paddy soil in the plough layer.
Province/CityBulk Density (g∙cm−3)Measured Depth (cm)
Average ValueRange
Shanghai (N2 = 35)1.17[0.95, 1.37]15.80
Jiangsu (N2 = 89)1.18[0.82, 1.58]15.15
Zhejiang (N2 = 46)1.10[0.92, 1.34]15.69
Jiangxi (N2 = 43)1.17[1.04, 1.61]15.03
Anhui (N2 = 66)1.18[1.02, 1.43]15.38
Hubei (N2 = 91)1.20[0.95, 1.60]15.32
Hunan (N2 = 96)1.16[0.96, 1.62]15.14
N2: Number of soil bulk density samples.
Table 3. Experimental factors and levels.
LevelsExperimental Factors
Bulk Density ρb (g∙cm−3)Moisture Content ω (%)
1115
21.1520
31.325
41.4530
51.635
Table 4. Plastic limit, liquid limit, plasticity index, and fitting curve for different paddy soils.
Factors and LevelsPlastic Limit PL (%)Liquid Limit LL (%)Plasticity Index IP (%)Fitting CurveR2
Cd
Bulk density 1 g·cm−319.31335.84216.5290.00092.60280.9977
Bulk density 1.15 g·cm−319.78737.53017.7430.00112.51440.9965
Bulk density 1.3 g·cm−320.77740.41519.6380.00132.41890.9995
Bulk density 1.45 g·cm−321.38842.15720.7690.00142.37180.9959
Bulk density 1.6 g·cm−322.17144.61922.4480.00162.30120.9975
Publisher’s Note: MDPI stays neutral with regard to jurisdictional claims in published maps and institutional affiliations.