1. Introduction
The freshwater sources such as rivers, lakes, reservoirs, and groundwater are increasingly being utilized worldwide [
1,
2]. Population growth along with increased water demand by industry, intensive agriculture, and the domestic sector are leading to excessive withdrawals from the various freshwater supplies, thus increasing water stress in various regions of the globe. Moreover, contamination of water supplies has exacerbated the situation as critical water sources are now impaired [
3]. For example, in California, impaired groundwater contamination and excessive water salinity are severe in communities in agricultural regions [
4,
5]. Nearly 95% of the population in the communities in San Joaquin Valley, California, relies on groundwater for its drinking water needs. In this region, there are communities whose water supplies are contaminated by high nitrate levels, which is attributed, in part, to intensive agricultural activities [
4,
5] and impact of septic systems. In the agricultural regions, small and disadvantaged communities (i.e., with a community median household income of less than 80% of the state annual median household income), who rely on groundwater as their only potable water source, are the most severely impacted.
Small communities with impaired local well water and lack of feasible (or timely) connection to a centralized water system [
6,
7] can potentially opt for wellhead water treatment as a mid- or long-term solution to providing safe drinking water [
4,
8]. However, sufficient data and models of high temporal resolution (hourly to seasonal variability) for forecasting small communities’ water use patterns are critical in order to establish (i) community water system design and operational specifications; (ii) water storage capacity; (iii) water treatment system treatment for upgrading community water quality as needed; (iv) handling of sanitary water; and (v) overall community planning (e.g., expansion and water system infrastructure upgrade).
There is a large body of literature on the analysis of water consumption data, at various temporal scales (i.e., monthly, weekly, and daily), and associated models for urban environments via machine learning (ML)-based models [
9]. The existing studies, however, have focused primarily on describing overall city (or geographical region) water usage [
9]. For example, Avni et al. [
10] presented an approach to analyze average monthly water demand patterns based on classification with K-means clustering at the scale of cities, farming communities, various industries, and agrarian and communal settlements, located throughout Israel. The above study suggested that data-driven models of water use can be developed where similarities exist of water use patterns. In another study, models of total monthly urban water use have been reported based on fuzzy inference systems (FIS) that included an adaptive neuro-fuzzy inference system and a Mamdani fuzzy inference system [
11]. The above water use models were with the predictive performance of
R2 of 0.75 for the city of Izmir [
11], respectively. Models of water use were also reported for the city of Izmir based on generalized regression neural networks (GRNN), feed forward neural networks (FFNN), radial basis neural networks (RBNN), and multiple linear regression (MLR)) [
12]. Overall, models for monthly average urban water consumption, based on 1997–2006 data, demonstrated predictive accuracy quantified by efficiency (E) metric of 0.89 (representing the relative magnitude of the residual variance of model predictions relative to the measured data variance; the values of CORR and E close to 1.0 indicate good model performance), and normalized root mean square error (NRMSE) of ~0.07. In another study, data-driven back propagation neural network (BPNN)-based models were proposed for urban peak of weekly water demand for the town of Nicosia, Cyprus, with the population of ~200,000 [
13], based on 2002–2007 data. These models built based on total city maximum daily water consumption in each week, and utilizing weekly maximum temperature and total rainfall as added model input variables from 2002 to 2006 (260 data points), demonstrated prediction accuracy for 2007 peak weekly city water consumption (52 data points) with
R2 ~0.94, and a root mean square error (RMSE) of ~0.12 million L/day relative to the average and maximum water use of 3.5 and 4 million L/day, respectively. In another study, water use in a part of the city of Ottawa (Canada), for a population of 30,000 for the period 1992–2002 [
14], was analyzed via linear regression (MLR), linear neural network (LNN), and BPNN models. Models for peak daily water use in each week of the study period were developed, which considered the maximum temperature and total rainfall for the peak daily water based on training data for 1992–2001 (total of 460 data point). The highest prediction accuracy (for January–April 2002 test dataset of 18 data points) was for the BPNN model demonstrating
R2 ~0.81 and average absolute relative error (AARE) of ~0.12%.
Simpler linear regression models for daily water use (Gallons per person) in large communities, in support of establishing water management strategies, have also been developed for the Swindon Area of the Thames Water Utility, UK. (population: 0.19 million). The approach introduced simple linear regression—Partial least squares (PLS) regression econometric model—that included economic variables such as water price, household income, occupancy rate, as well as meteorological information [
15]. In another study, BPNN models, along with a shuffled complex evolution metropolis (SCEM-UA) algorithm, regression, and adaptive neuro-fuzzy inference system (ANFIS), were developed to describe water demand in “Area Pilota” of Catania, Italy (population: 50,000). The model developed for daily water use averaged per person for the period of 2003–2004 [
16]. Training and testing data comprised merely 200 and 65 data samples, respectively, and demonstrated the performance of RMSE ~2.34 L/person/day relative to the average and maximum water use of 110 L/person/day and 139 L/person/day, respectively.
Predictive GRNN-based models for daily water consumption, incorporating meteorological data (i.e., average daily temperature, daily humidity, and total daily rainfall) were reported for the city of Al-Khobar (population: 455,500) in Saudi Arabia [
17], based on (February 2009–October 2009) training and test data interspersed for the same period, and demonstrated the predictive performance of
R2 ~0.9. In another study, BPNN models of daily and hourly water usage were demonstrated for 19 different buildings from eight North American cities [
18]. The above work, based on a single week of training data and subsequent testing with one week of data, demonstrated predictive performance, for single building hourly and daily water use, of AARE in 5–11% and 3–5%, respectively. In an earlier study [
19], Sugeno fuzzy time series analysis [
20] and autoregressive moving average (ARMA) models [
21] were developed for monthly water consumption in Istanbul (12 million population), which was reported to be in the range of 10–100 million (m
3/year). Model training was based on a dataset spanning a period of 7 years (1995–2002). Model validation was for a period of 18 months (2003–2004) demonstrating performance of RMSE of 1.9 million (m
3/year) and 2.0 million (m
3/year) for the above two models, respectively. It is also noted that the population water use in Kuwait was reported in a study [
22] that utilized a simple linear ARMA-based model in which one year-forward of water forecasting was based on the previous year consumption. Forecasting of water use was reported for the period of 2004–2025 based on water consumption data for 1954–2003. The above study also reported pair-wise correlation of water consumption and various socioeconomic factors (e.g., residence type (villa or apartment), average house size, number of household occupants, number of cars in the household, number of weekly laundry activities, weekly number of showering/bathing per household, and household monthly income). The analysis demonstrated a low level of correlation, which may suggest that water consumption may depend on multiple factors in a non-linear manner.
Relative to large urban centers, analysis and models of water use in small remote communities have been limited owing to the lack of time-series water use data. Here, we note that the estimates of household potable water use in small communities (30–400 households, 100–2400 people) for laundry, and personal hygiene have been highly approximate [
23,
24,
25] given that real-time water metering data are often lacking. It is also noted that the compilation of water use data for small communities has been typically based on questionnaire and telephone surveys [
23,
24,
25]. Water use data at a high temporal resolution are lacking for small communities that are not part of a centralized water distribution system.
Water use is expected to vary temporally, and thus time-series water use data are critical, particularly for communities that rely on well water, to assess needed water storage, water treatment capacity (if needed), and operational protocols. Although various ML techniques are presented in the literature, primarily for modeling water use in large urban regions, the development of robust predictive ML models is challenging when confronted with complex high-resolution time-series patterns. Additionally, models such as GRNN, ANN, BPNN, and PLS entail high complexity with a large hyperparameter space. This poses further challenges to the adaptability of such models, particularly for rapid predictions, model update, and transfer learning. Here, we note that the objective should be to arrive at a model (irrespective of the model parameter space) whereby the existing model can be used for sites of similar characteristics and where model retraining can be accomplished only based on the newly acquired data. In this regard, ARMA models have the advantage of requiring only two hyperparameters (autoregressive and moving average coefficients) [
21]. Therefore, ARMA-based models can provide rapid prediction (with respect to computational time) with significantly lower training time relative to BPNNs models.
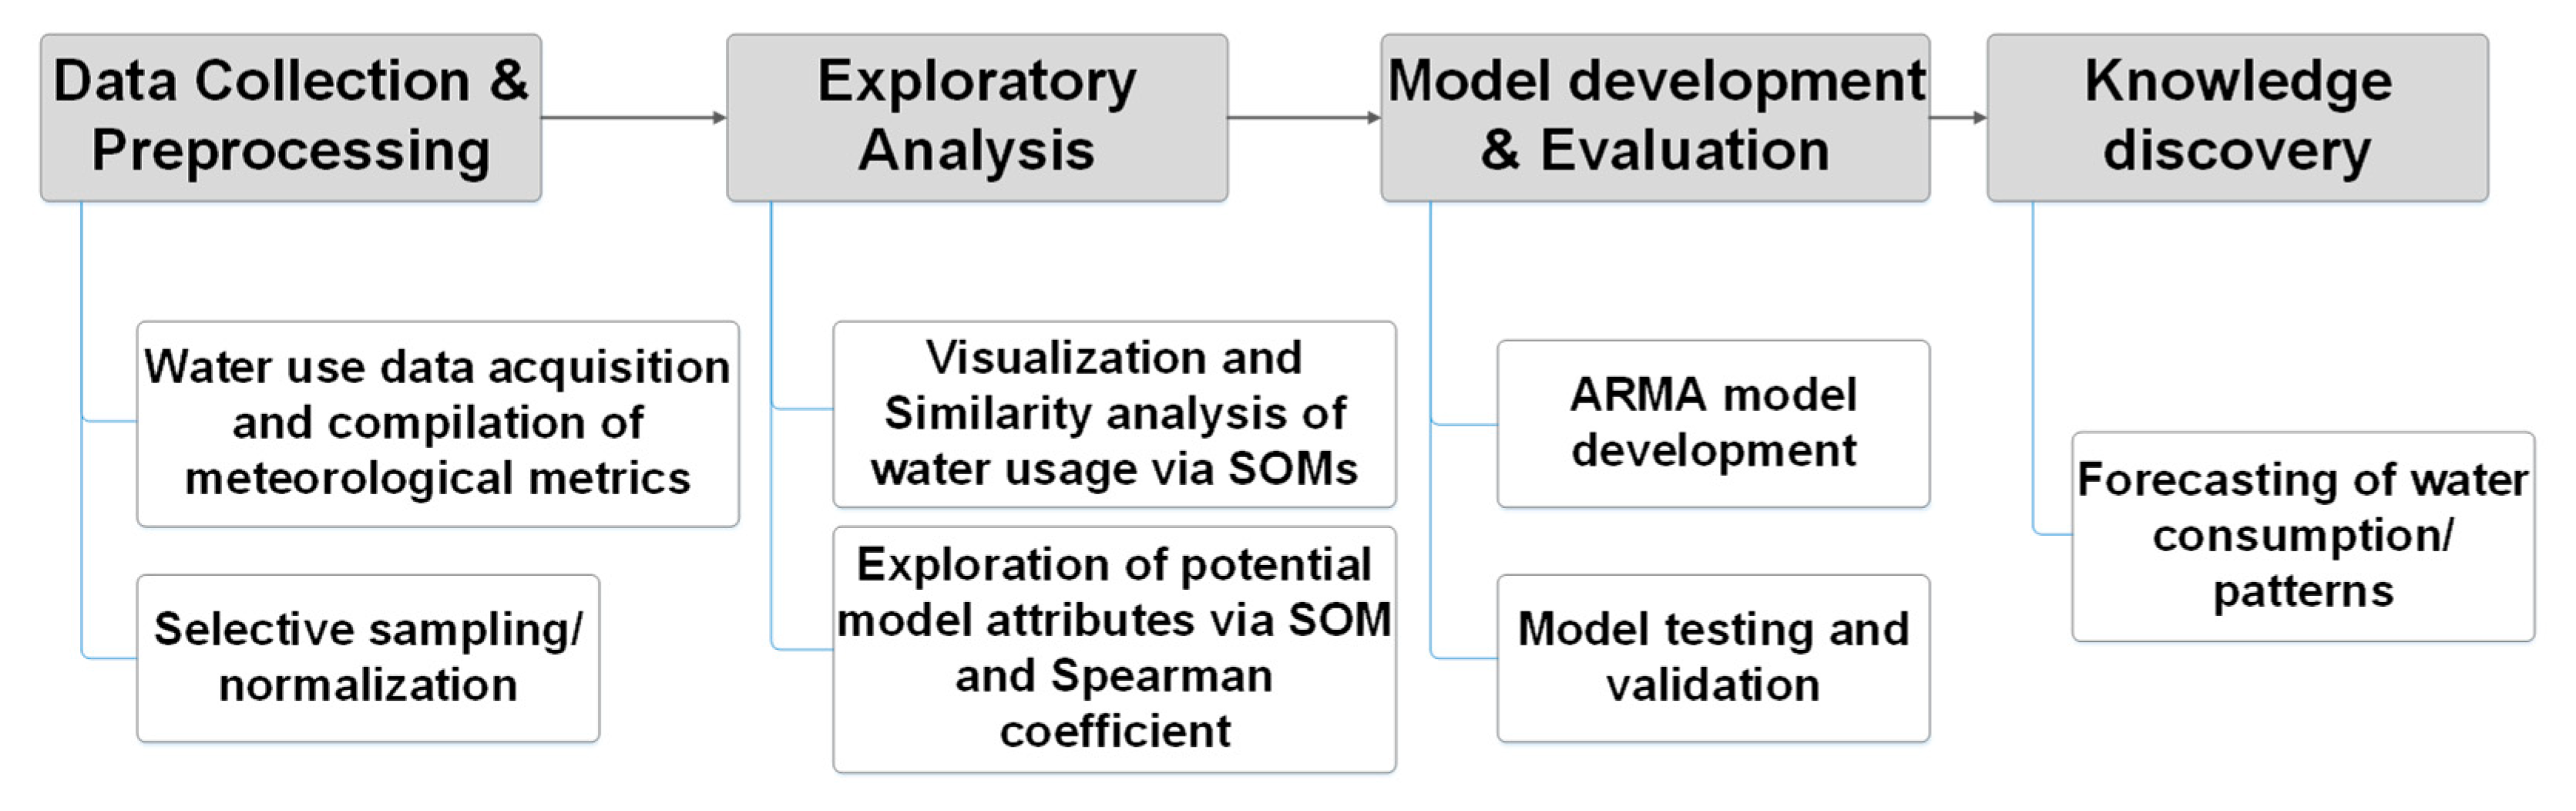
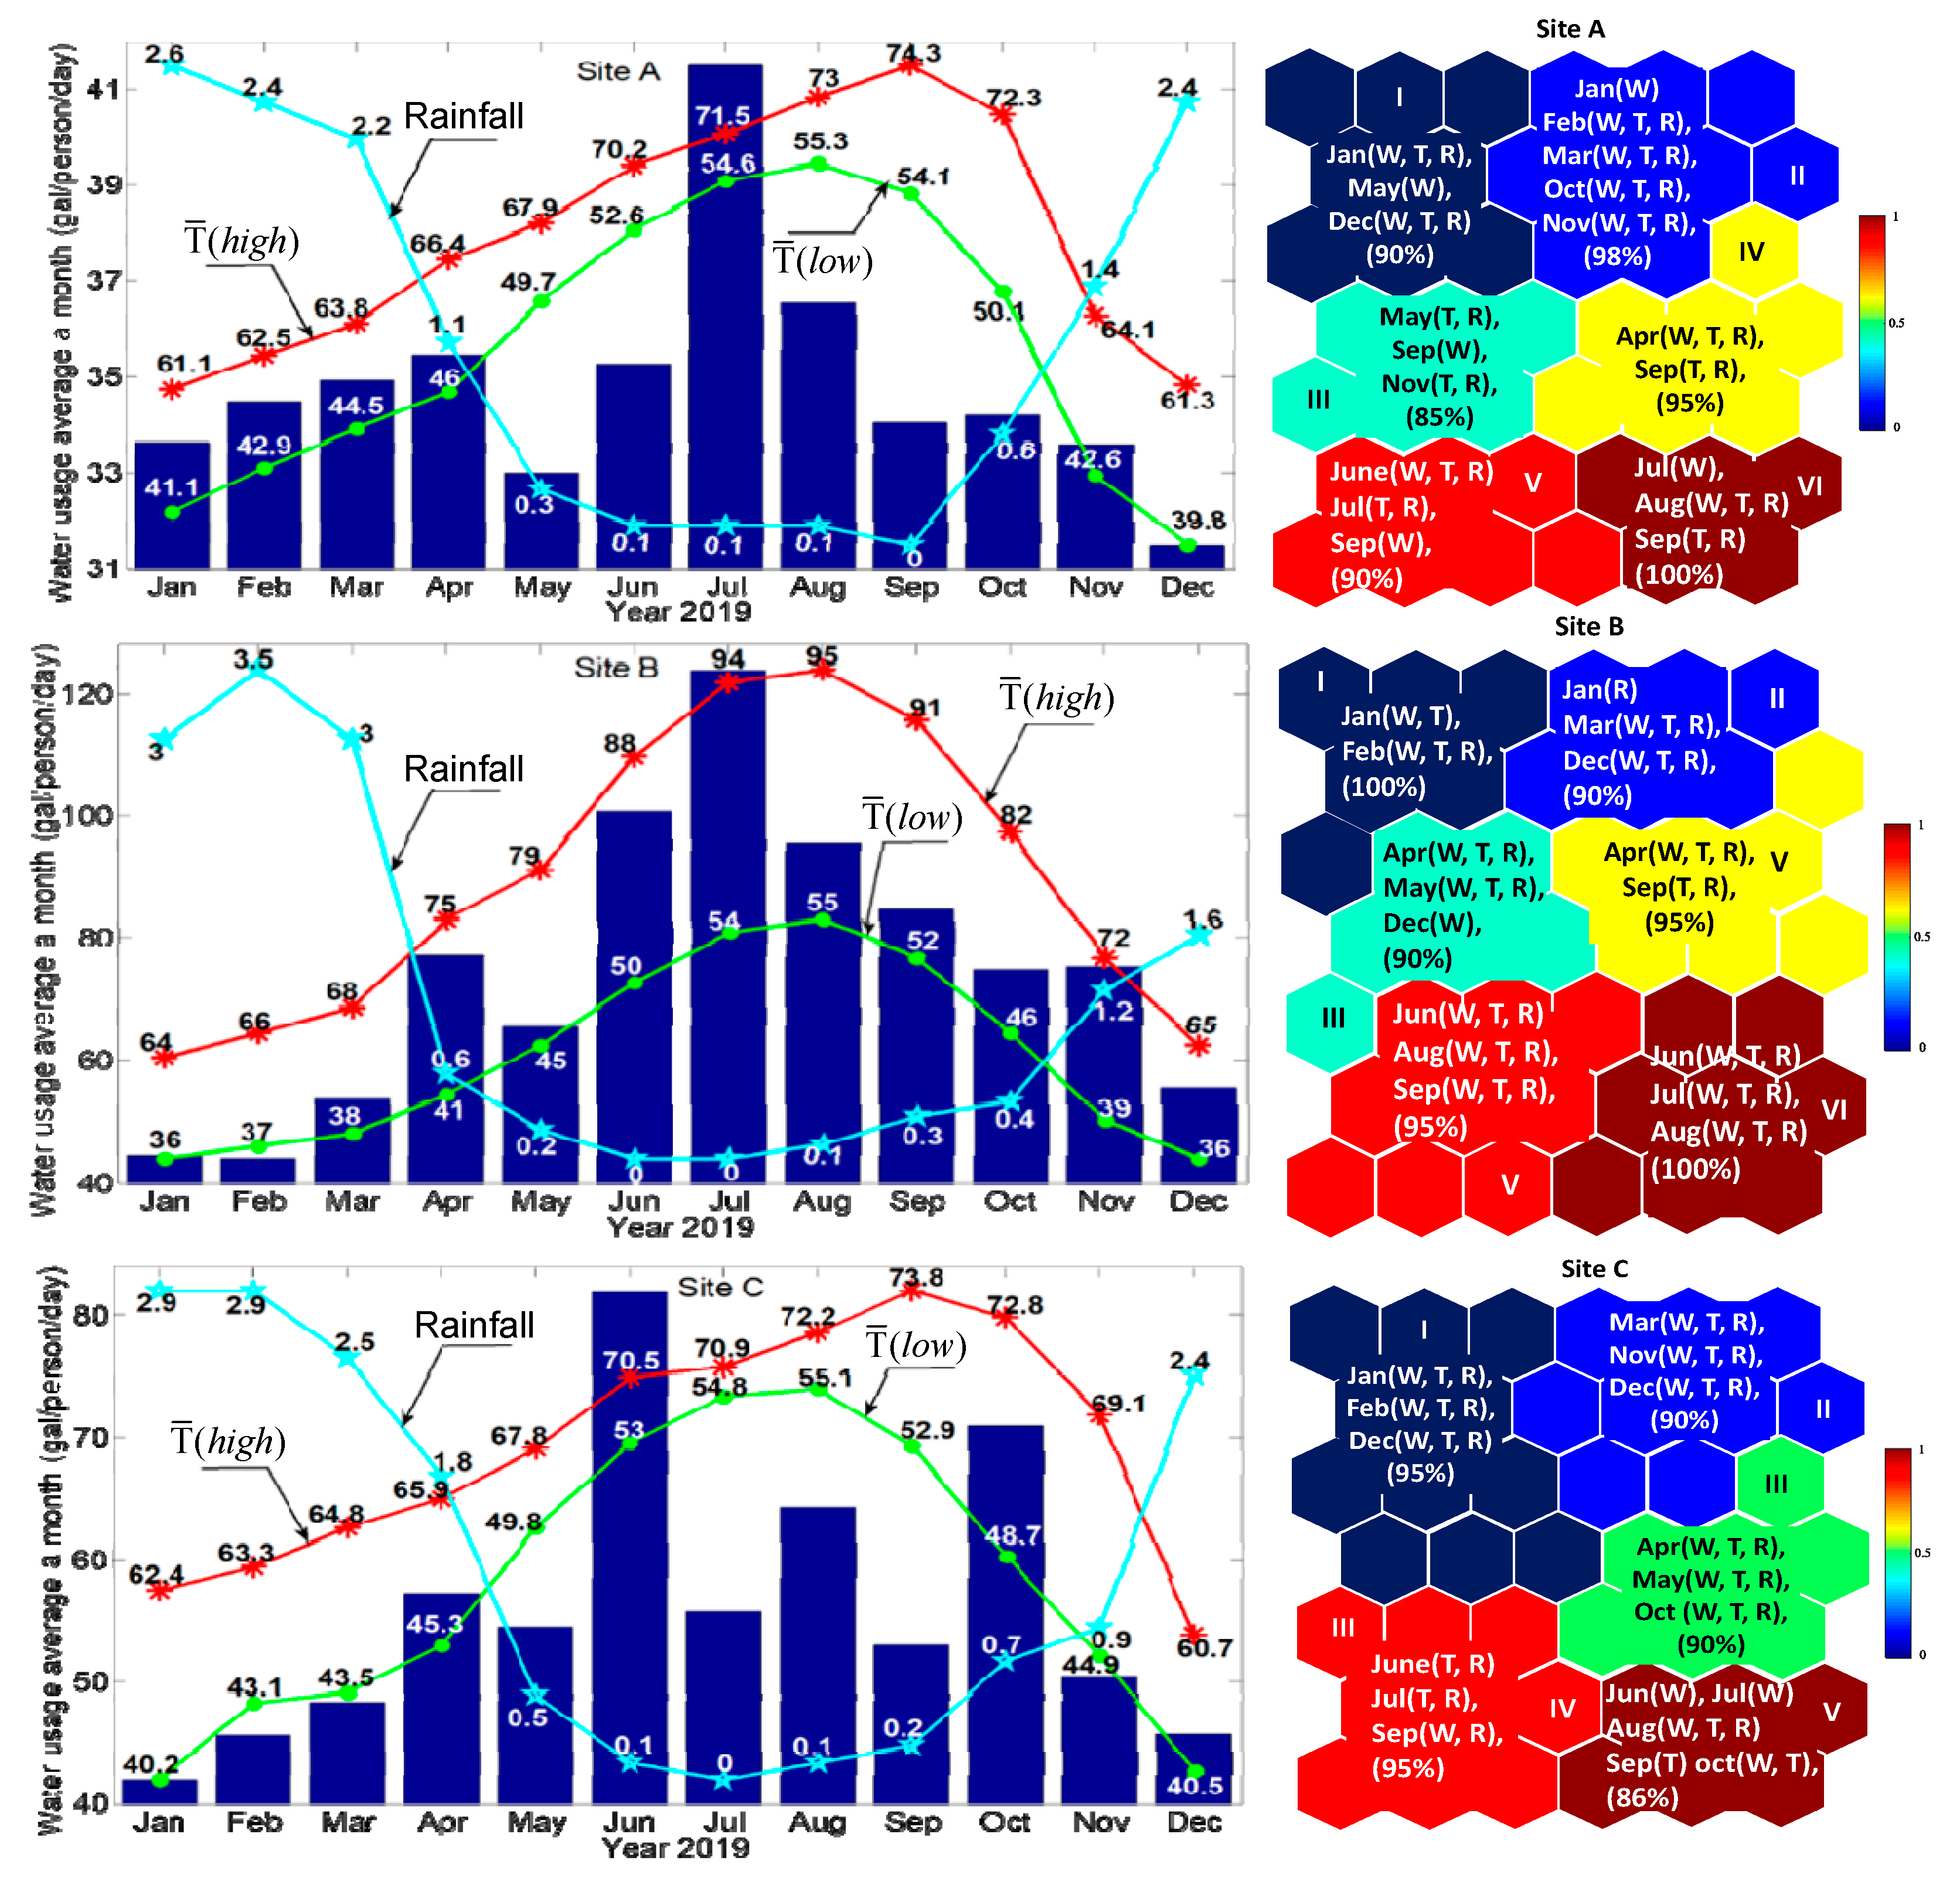
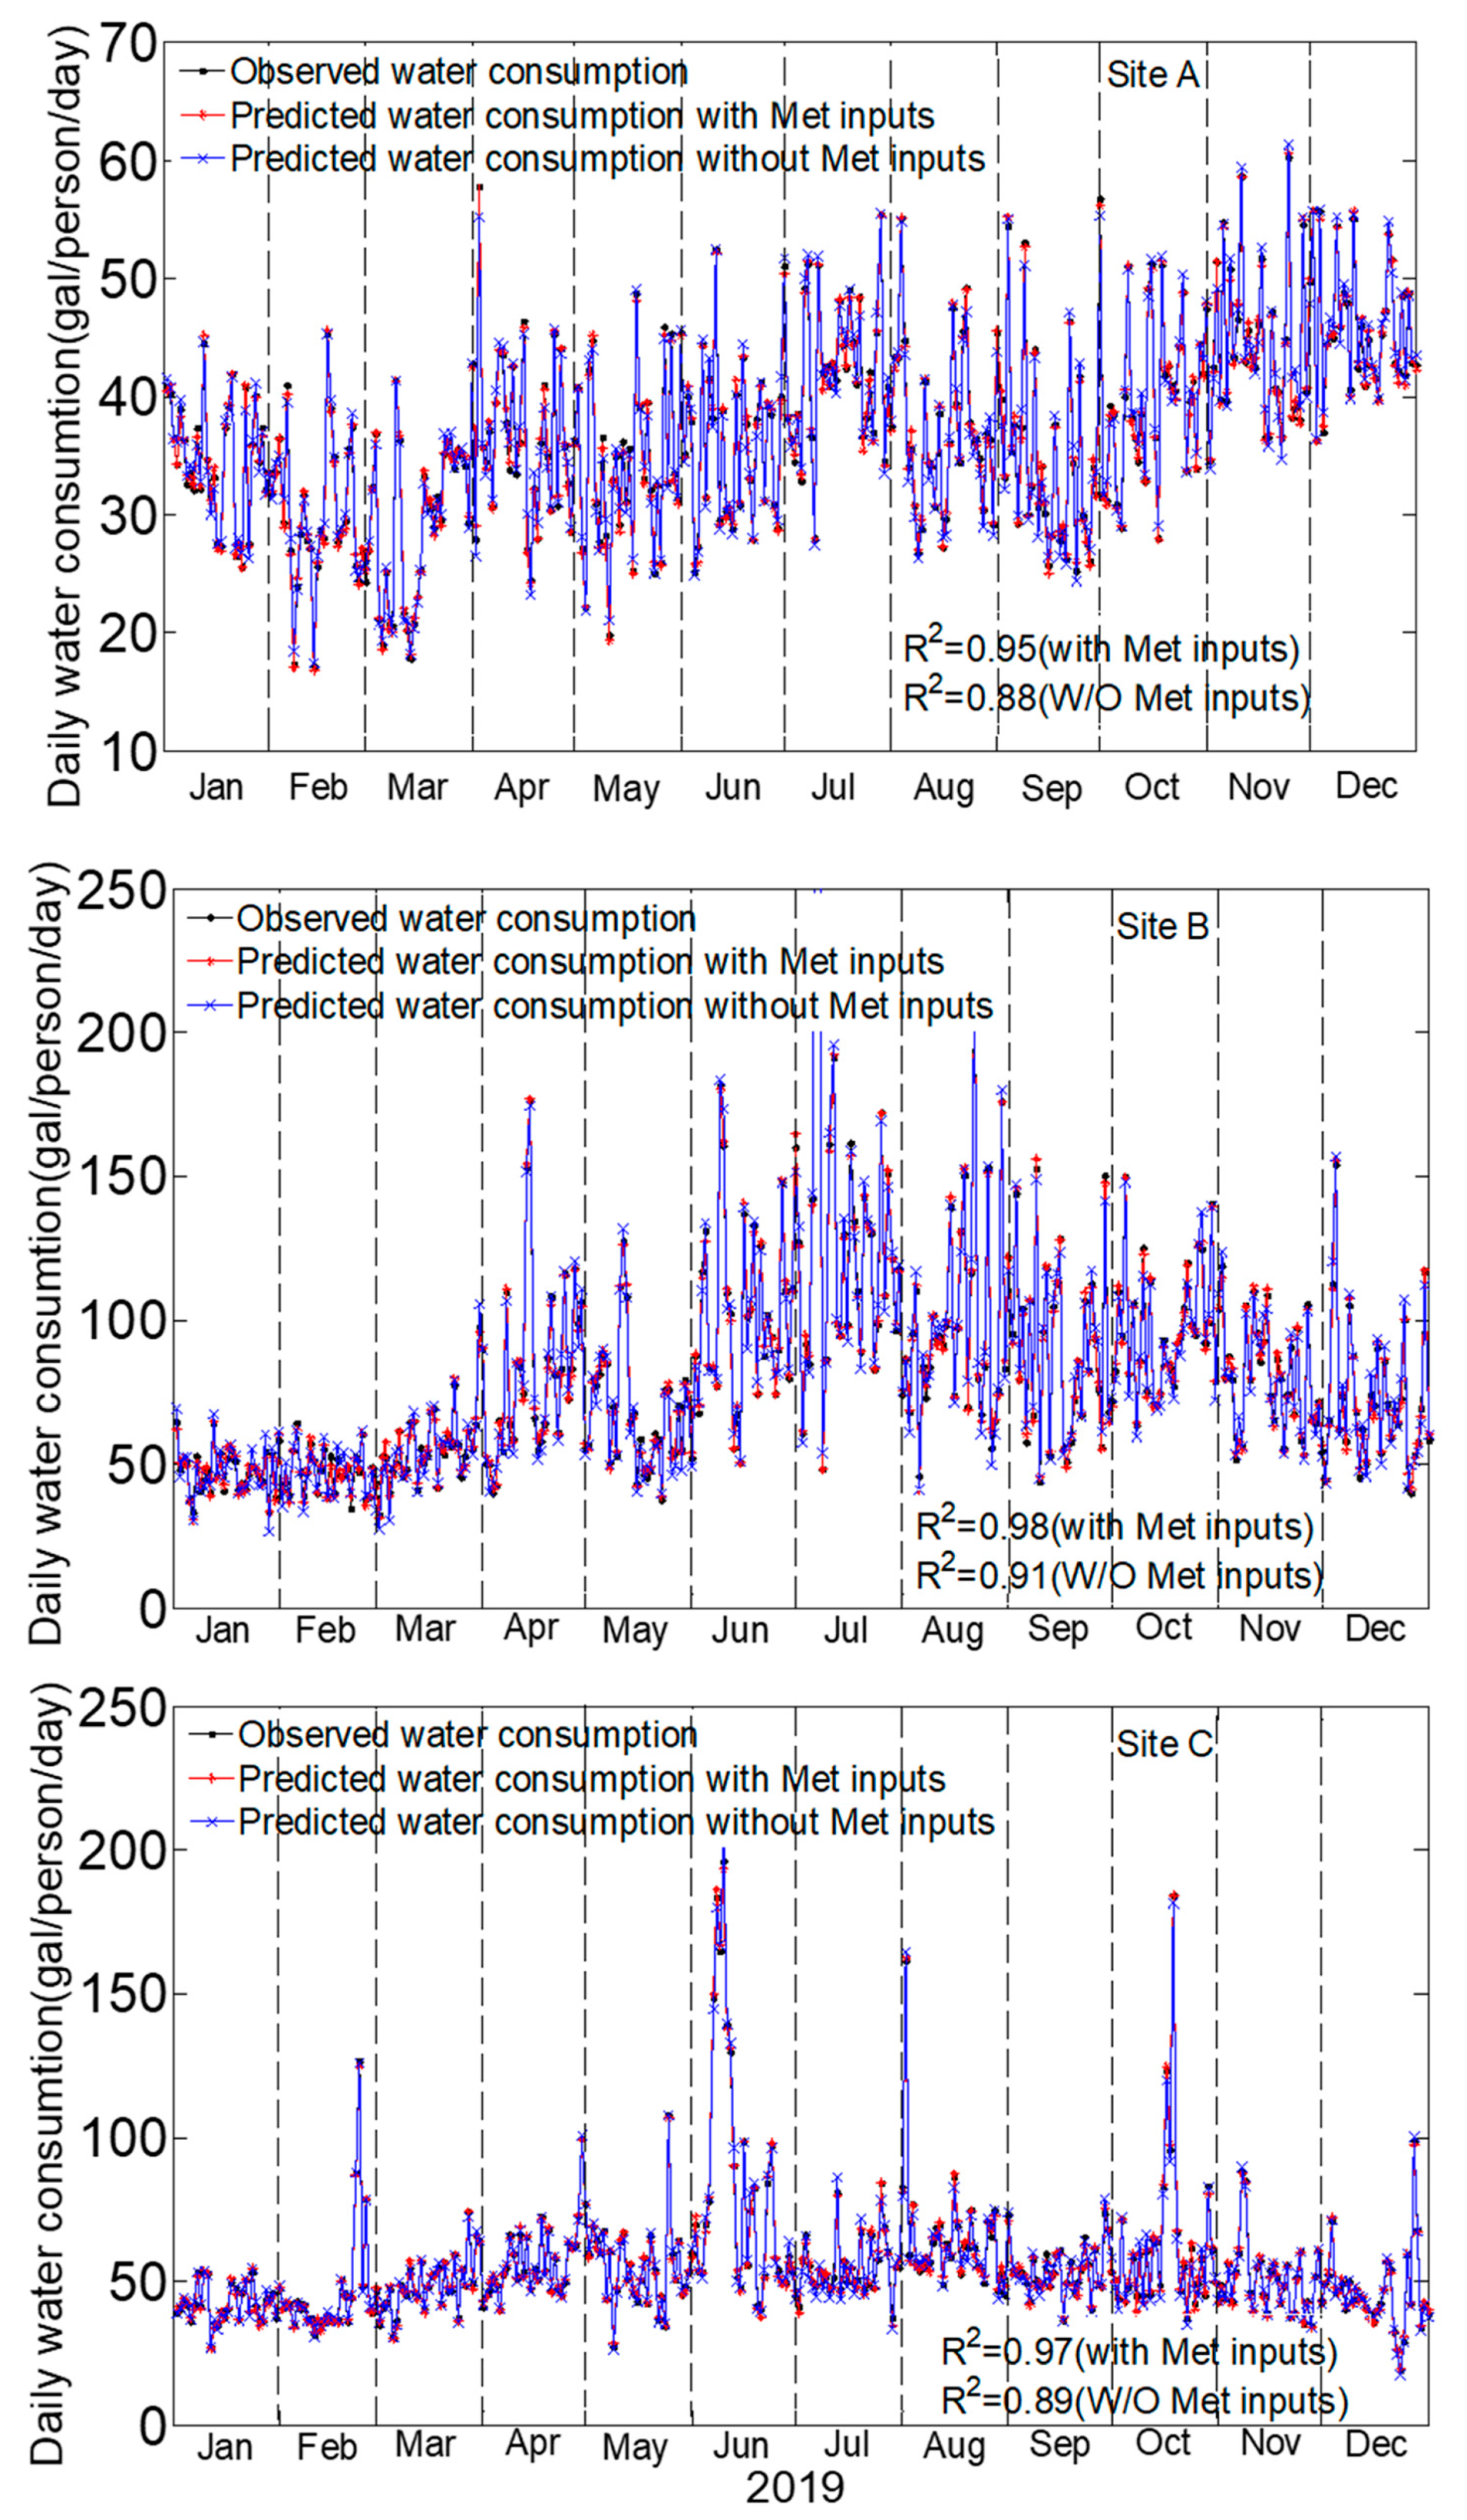
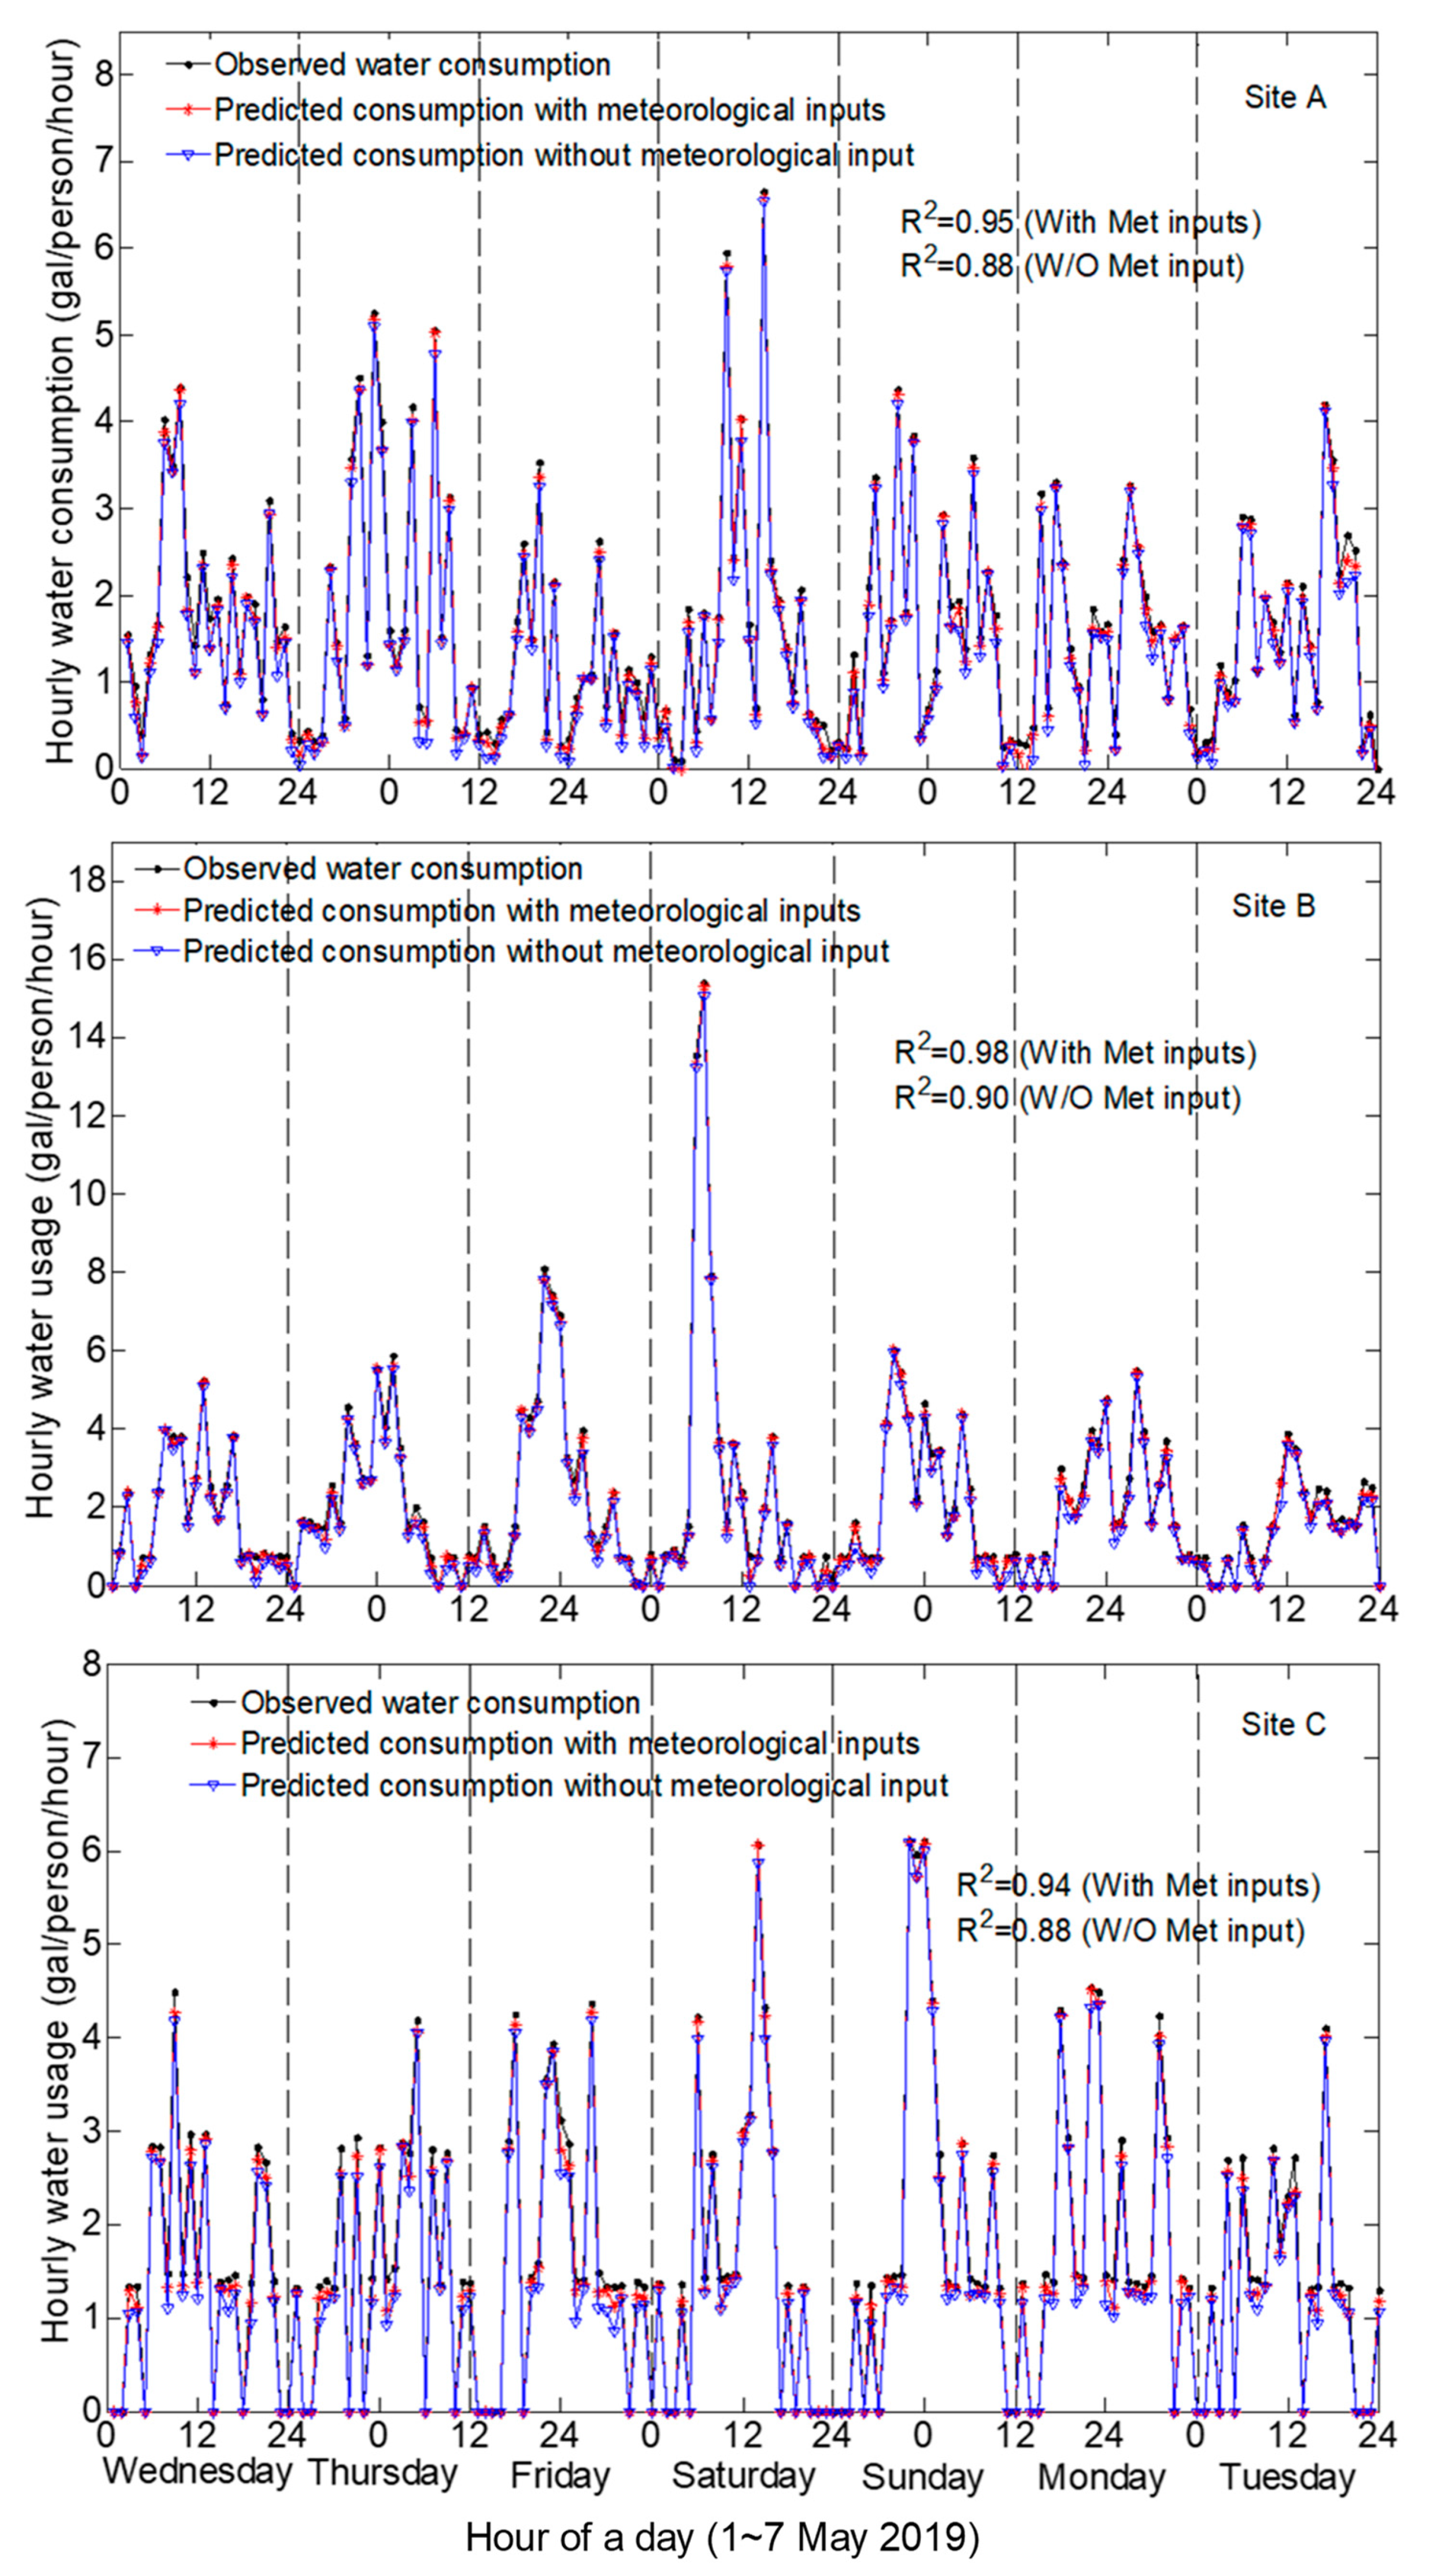
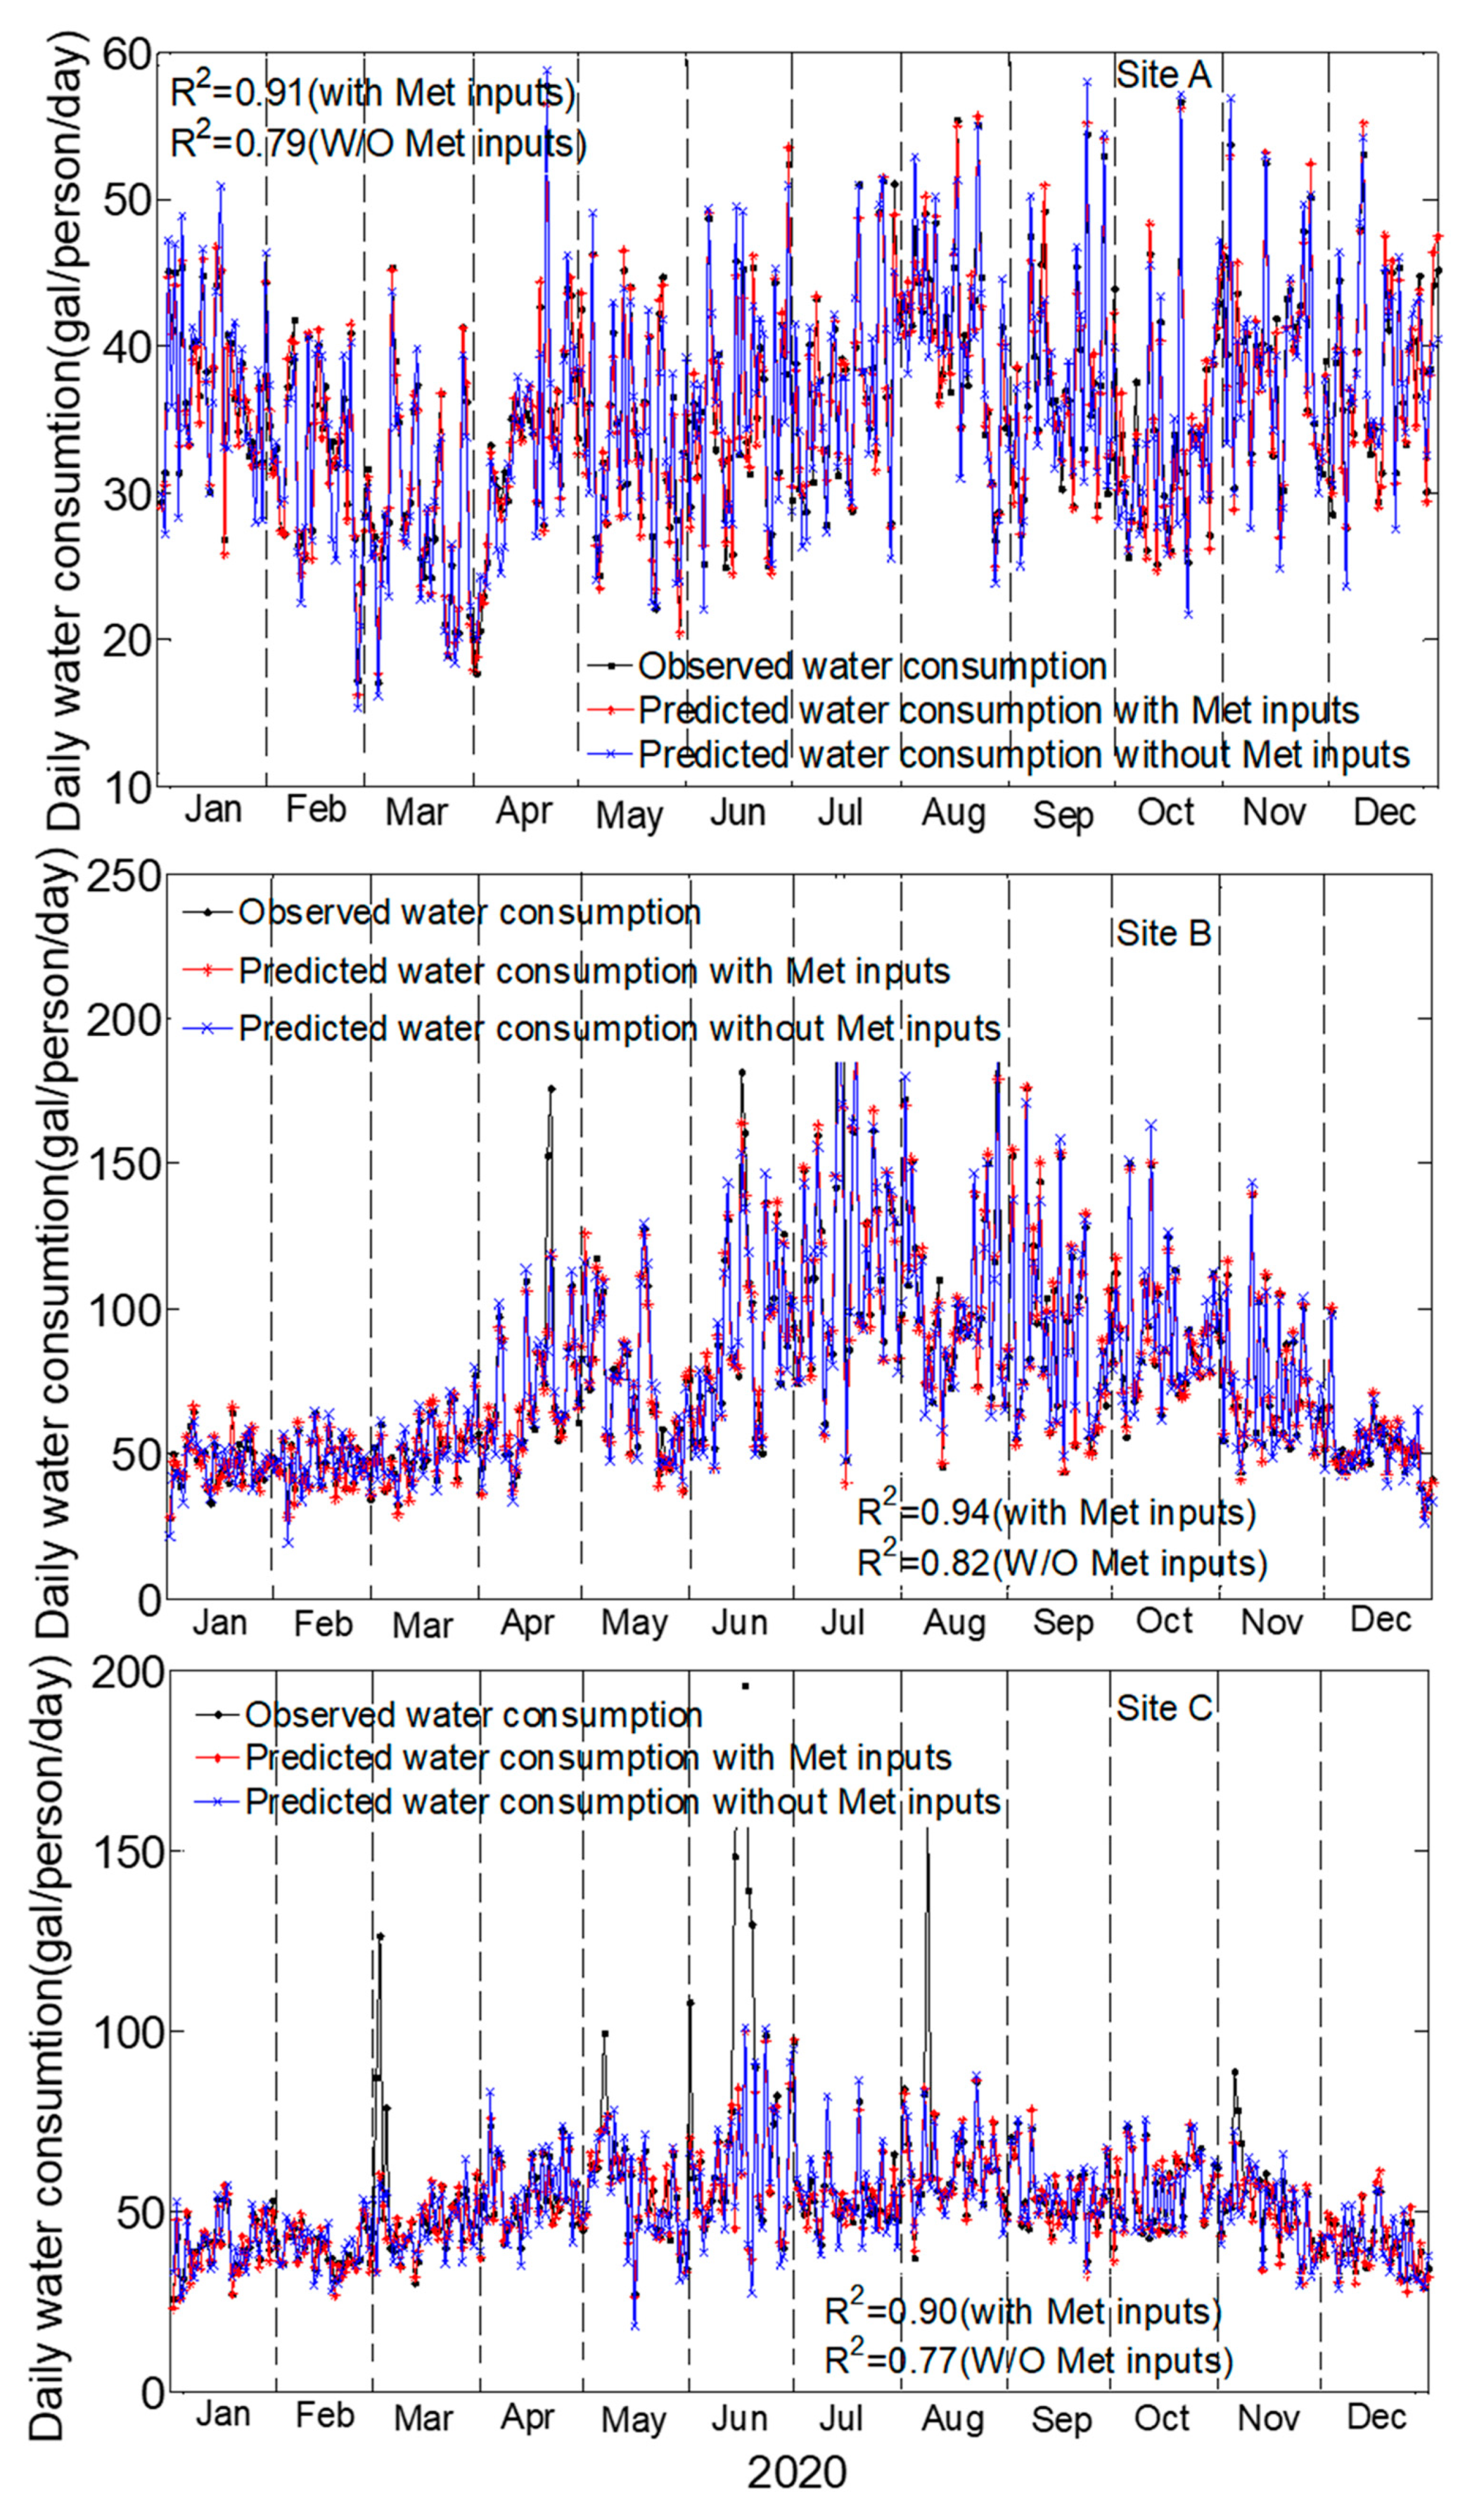
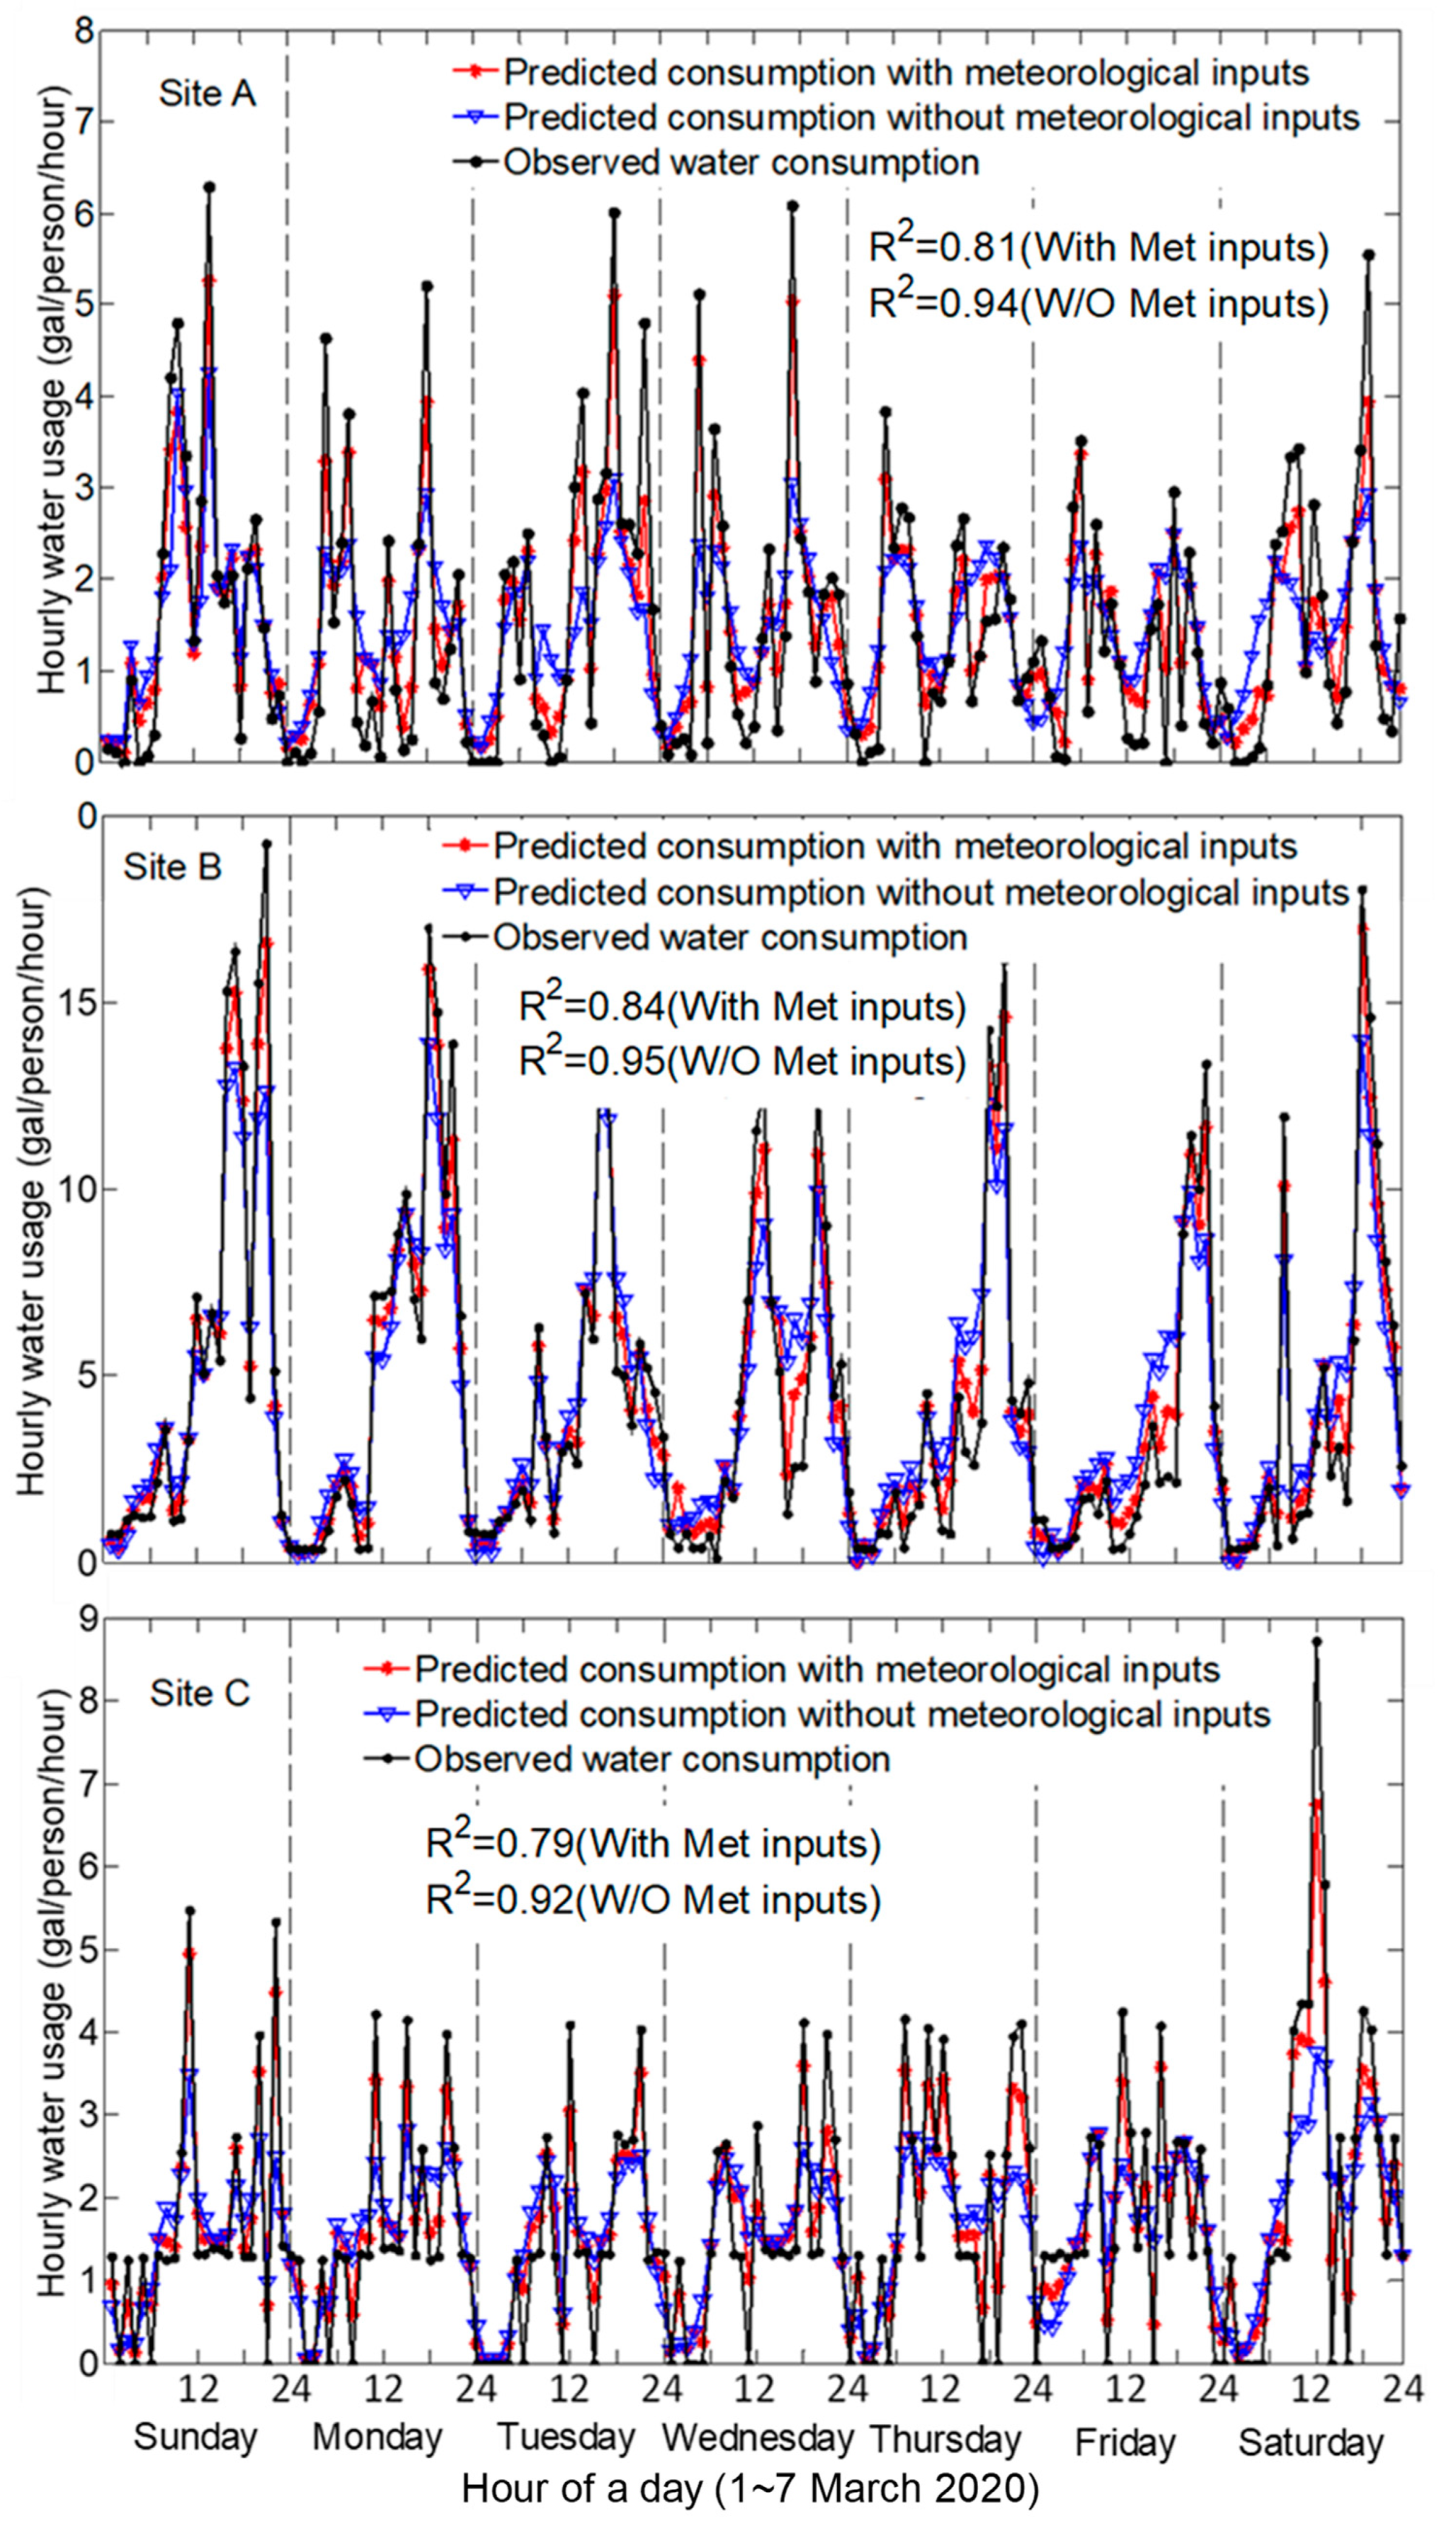
Accordingly, the current study presents a data-driven modeling approach to describe and forecast water use for small communities. The approach was explored for three small, disadvantaged communities of farm laborers and day workers located in the agricultural region in Salinas Valley, California. Extensive multi-year high-resolution time-series water use data were compiled for each community via wireless water meters. Water use patterns were first explored at hourly, daily, and monthly resolutions via self-organizing maps (SOM) and Spearman coefficient of correlation analysis. This was followed by data-driven ARMA models considering the time of day, day of the week and month, and the daily ambient temperature and rainfall as model inputs. The models were then assessed with respect to forecasting small community water use patterns.
4. Conclusions
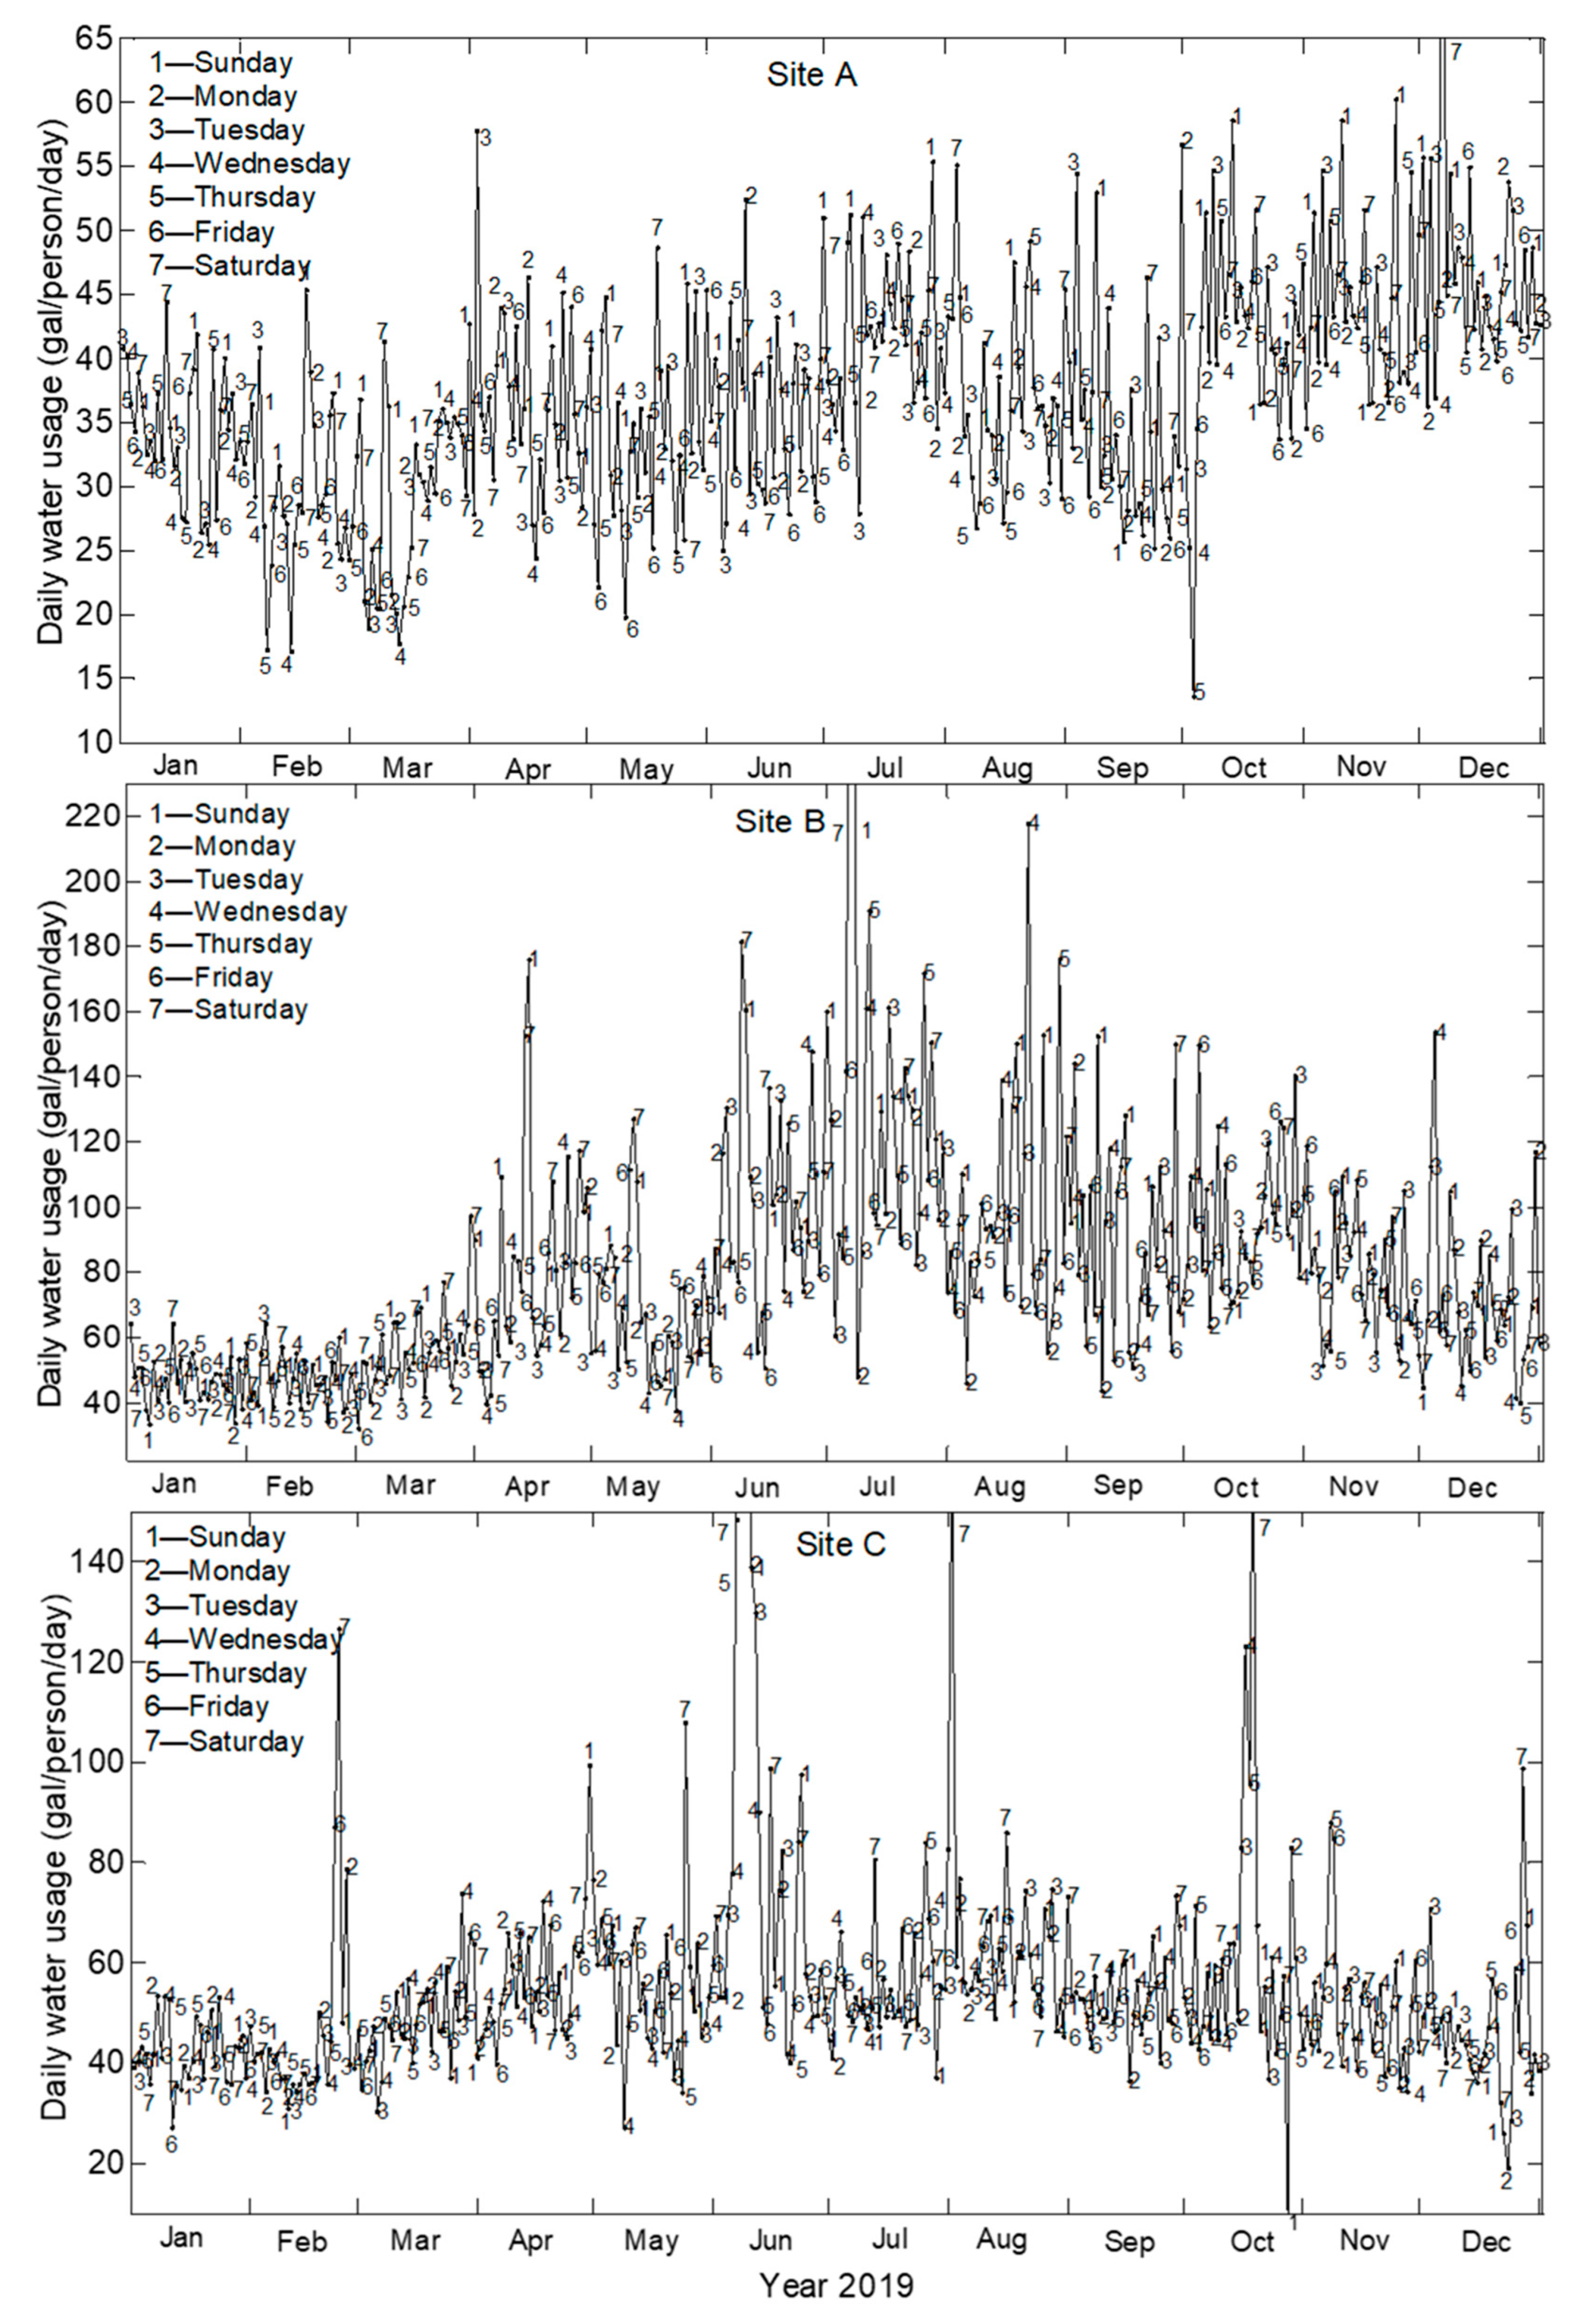
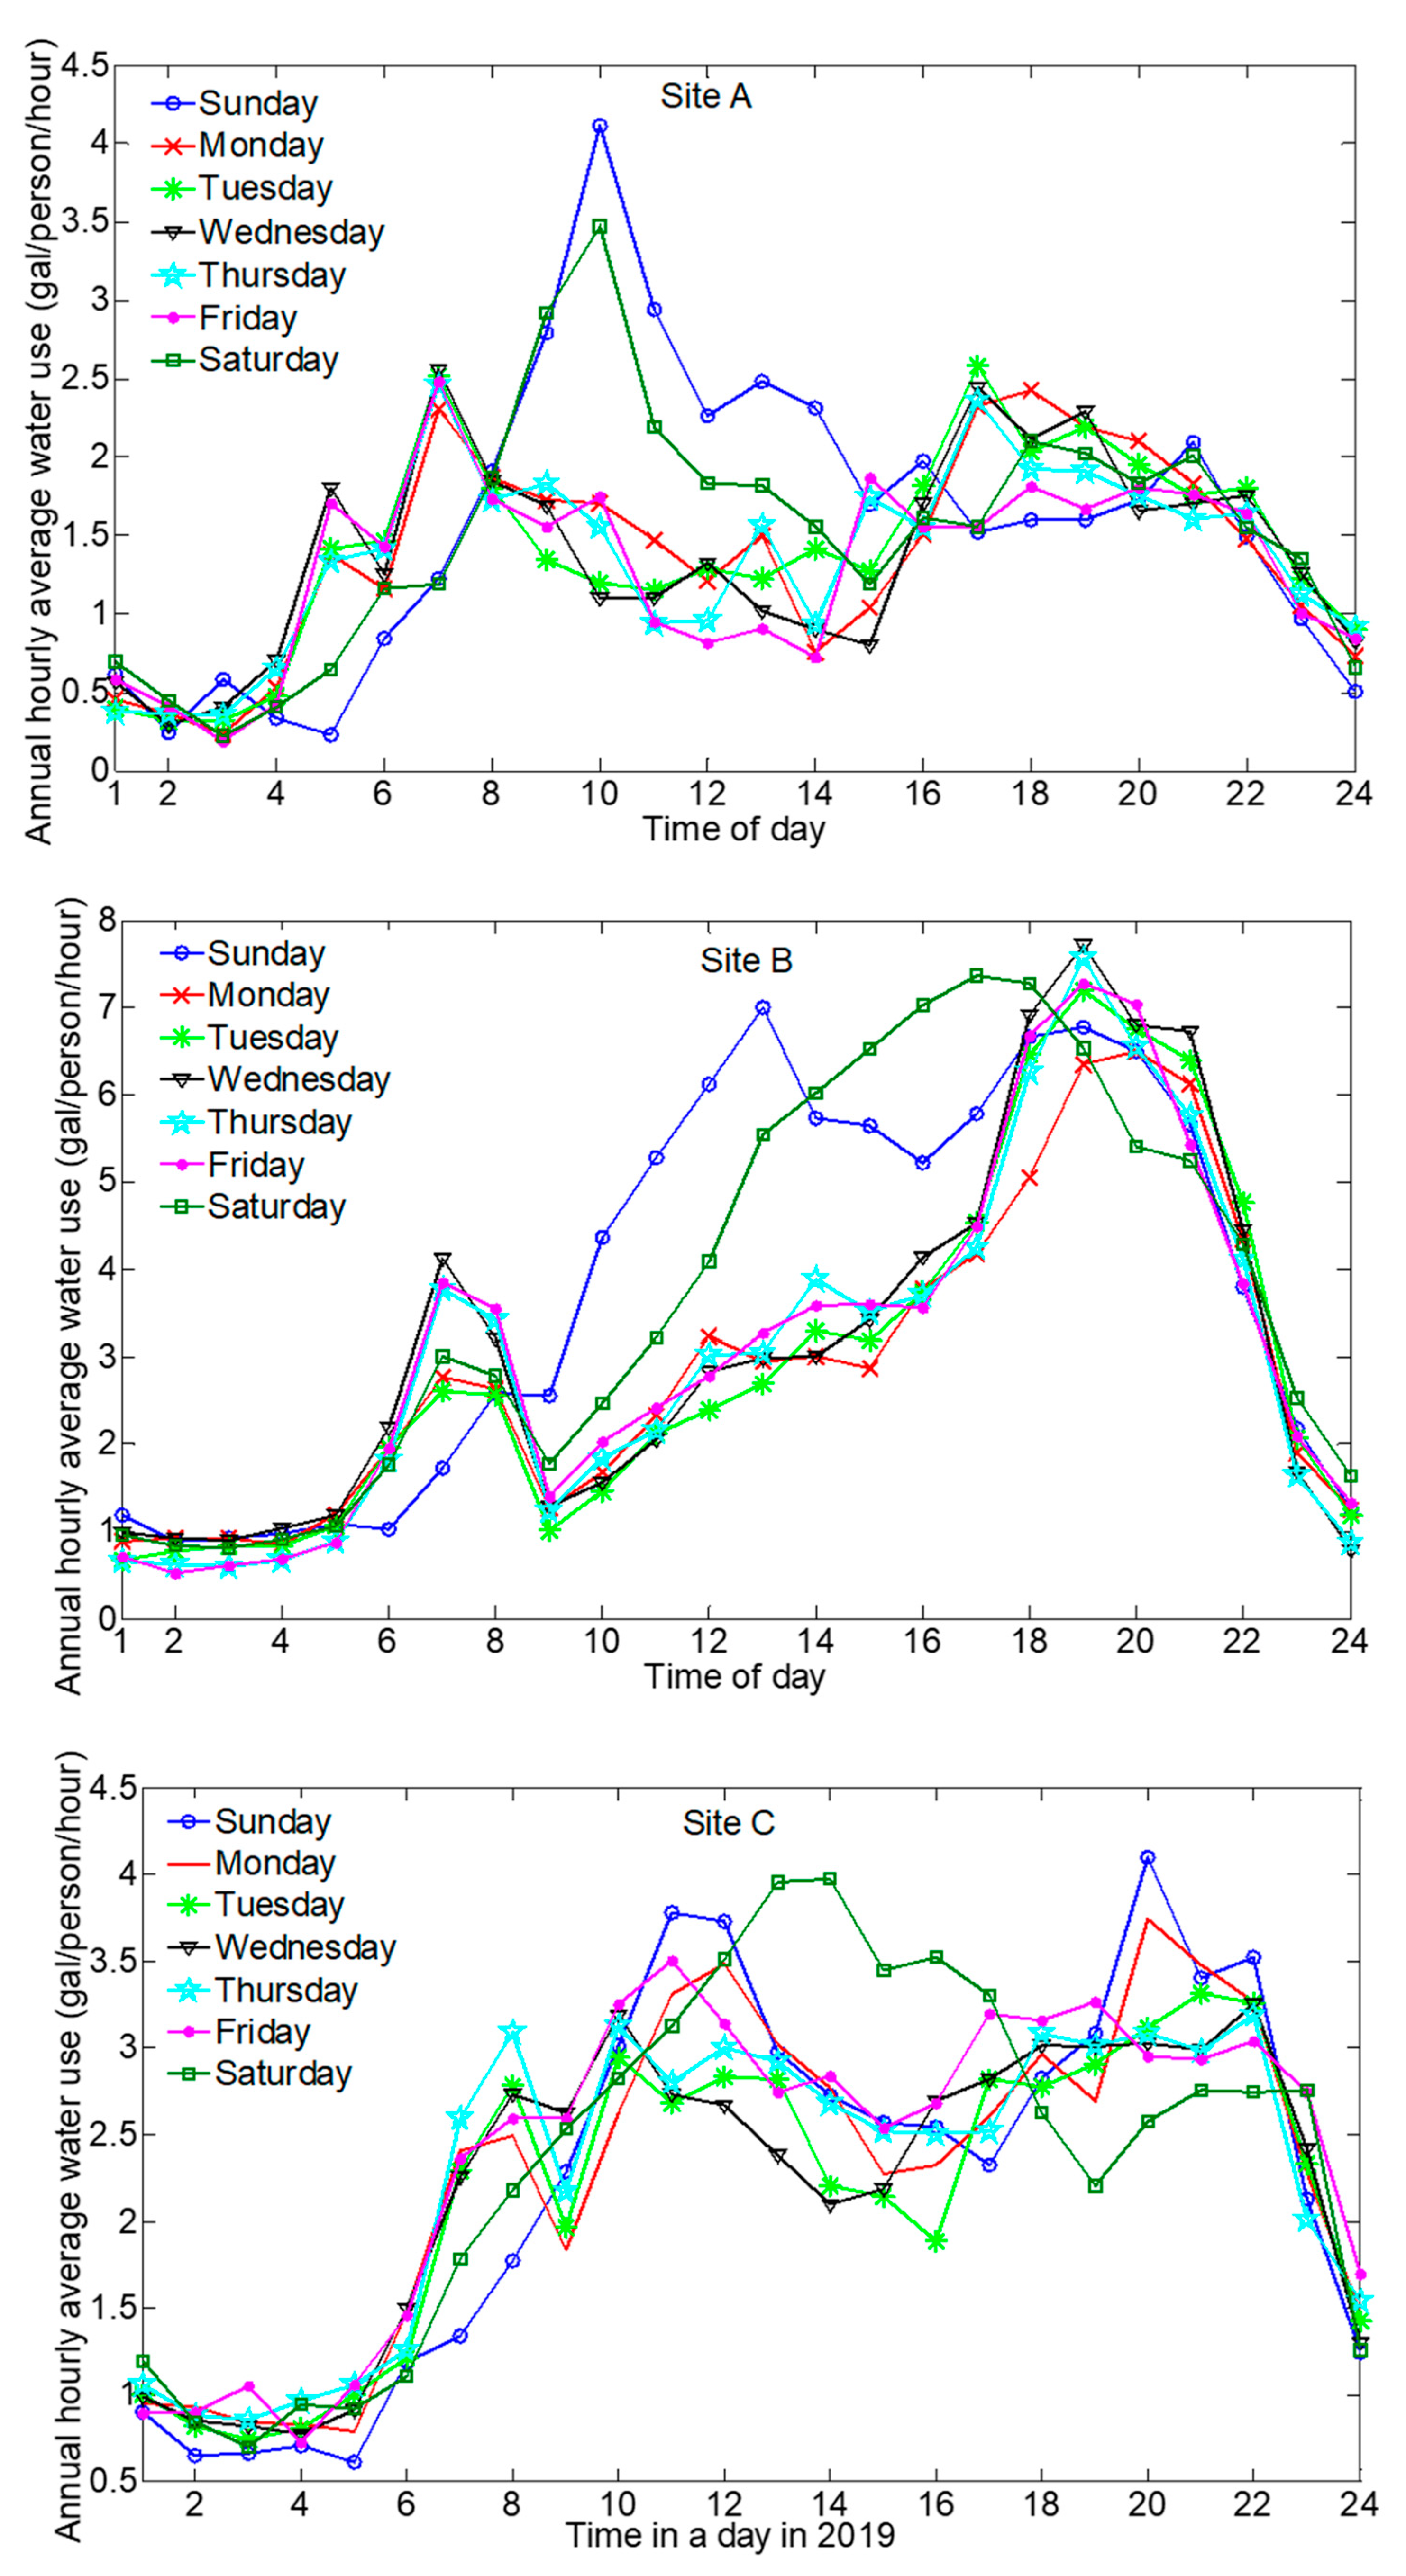
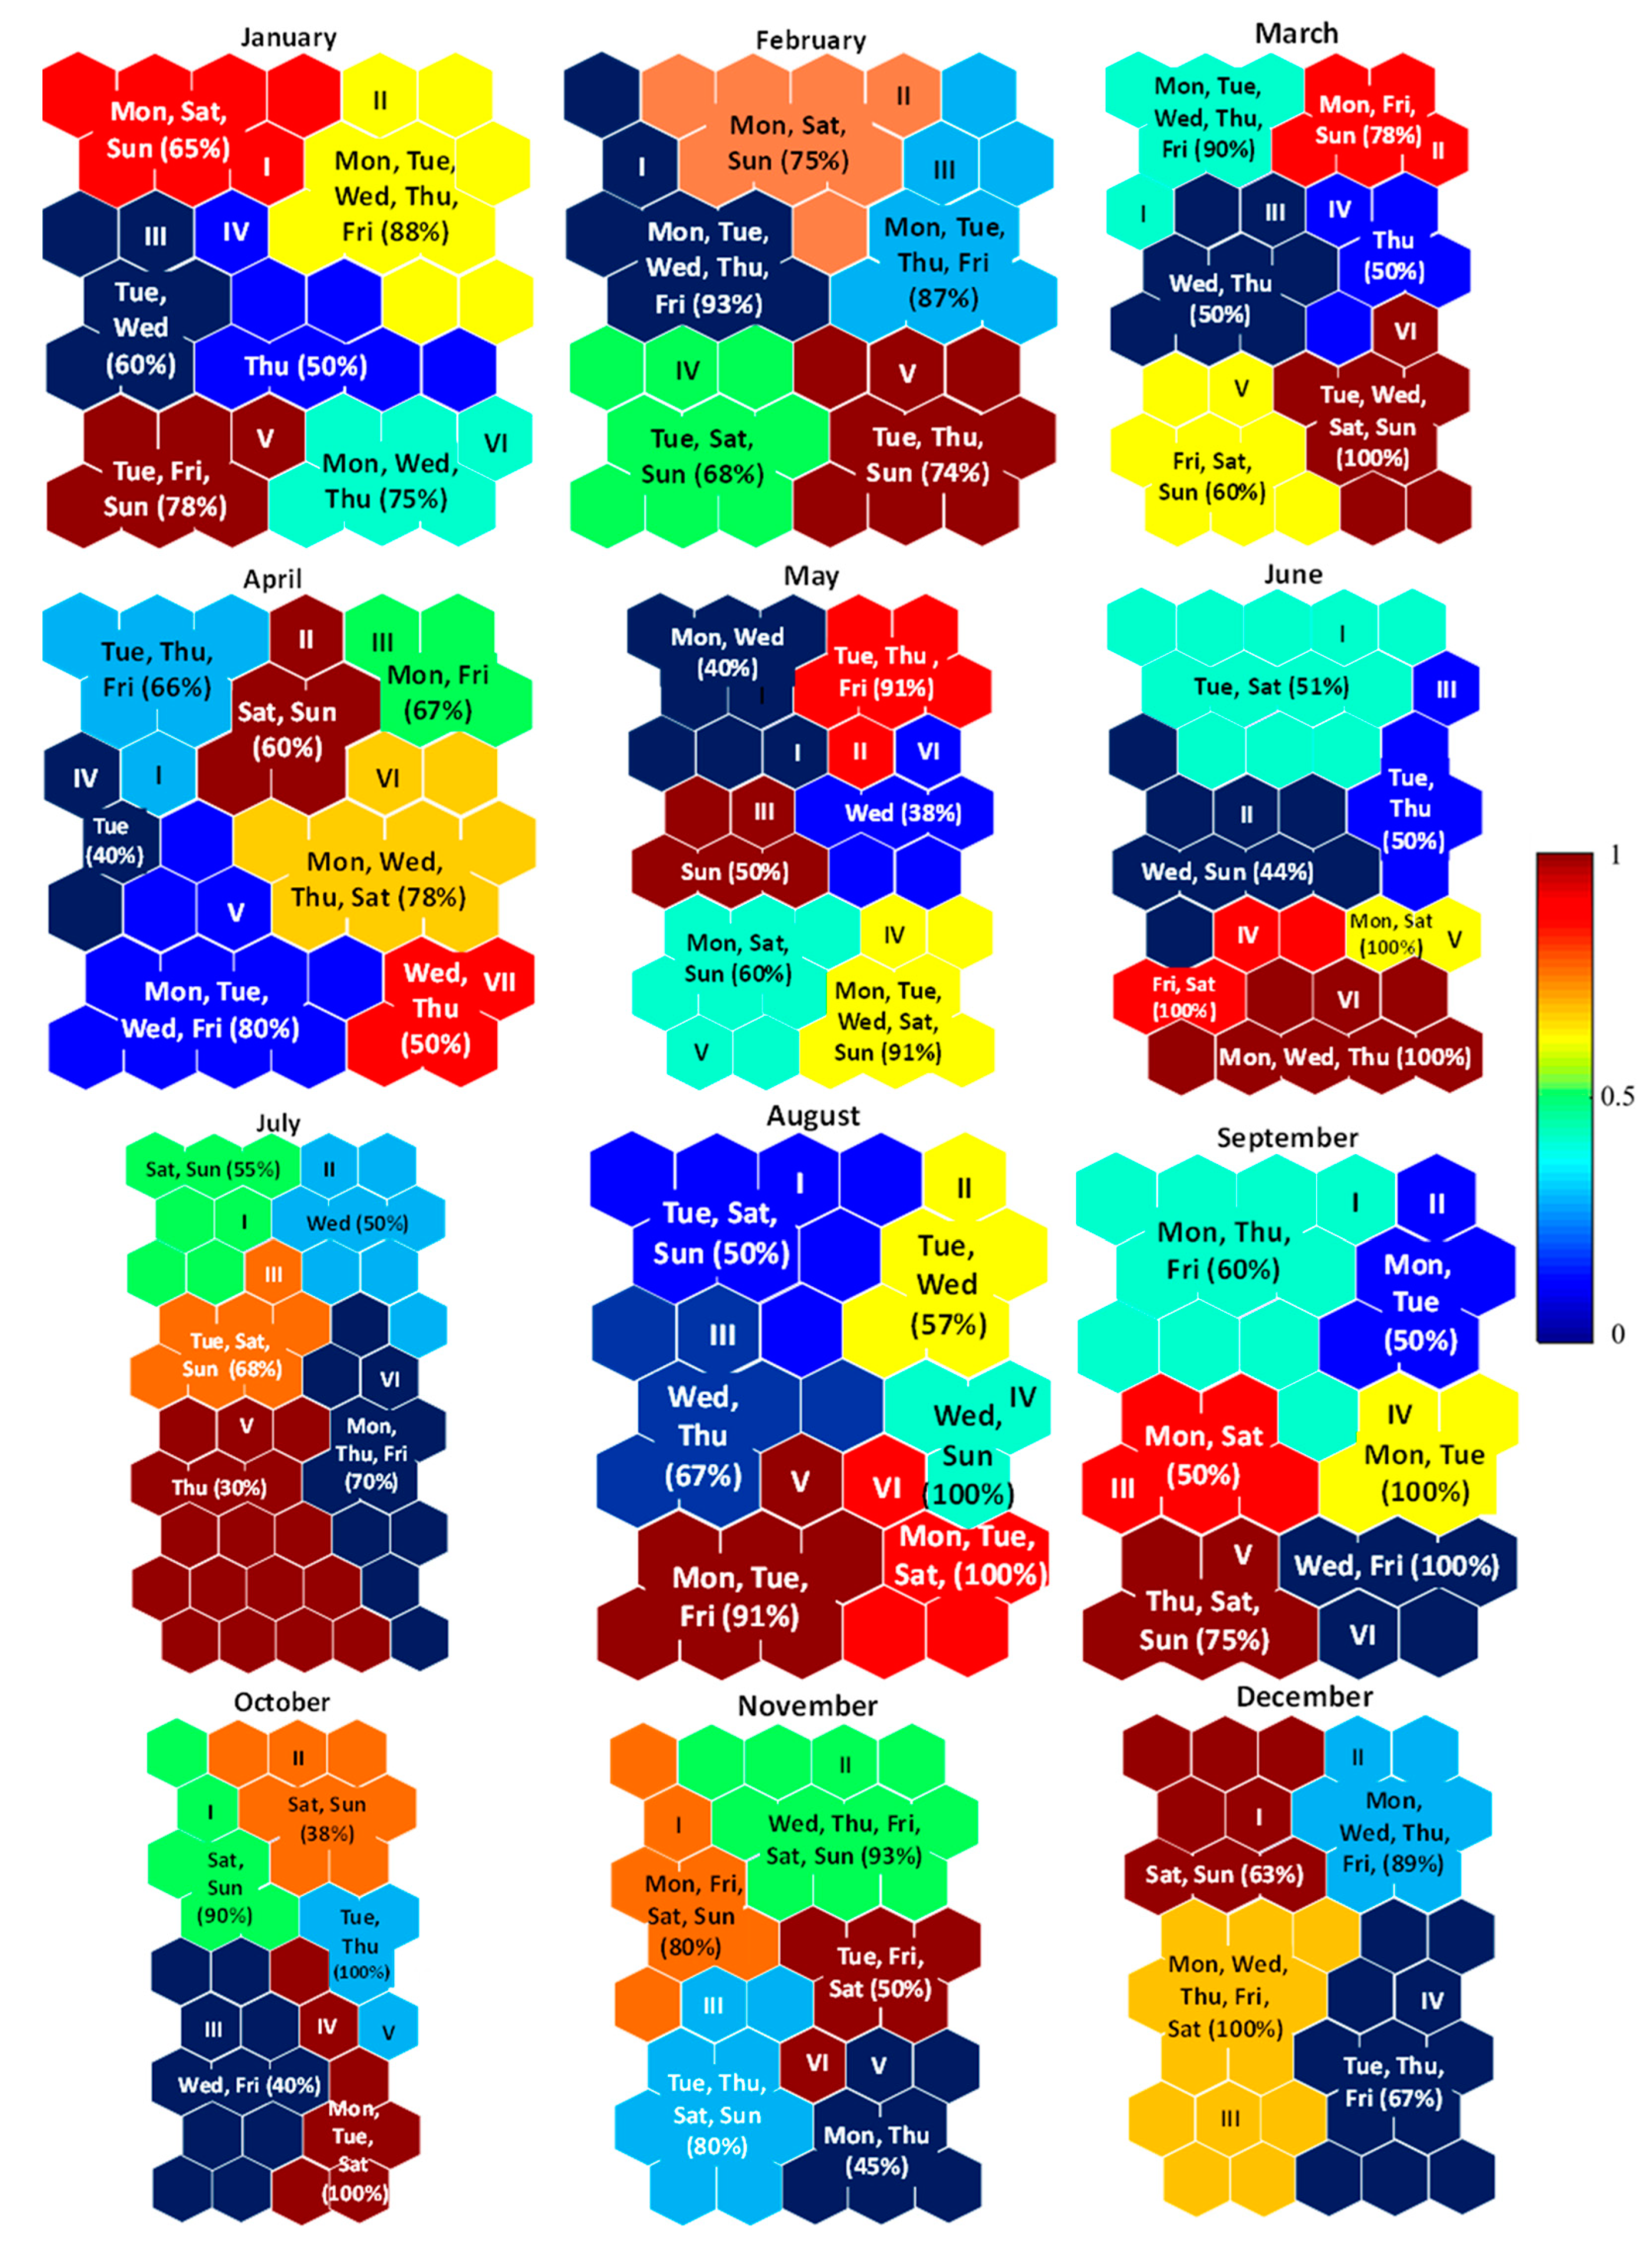
Water use patterns in multiple small communities, located in Salinas Valley, California (United States), were collected over a four-year period and analyzed to assess and quantitatively describe water use patterns. Self-organizing map (SOM) clustering was used for visual depiction of similarities in water use patterns among the days of the week and months of the year. SOM data exploration of the individual sites collectively showed that {Friday, Saturday, Sunday} are days with the highest water usage. SOM analysis further demonstrated that during the week, {Tuesday, Wednesday} are typically the days of lowest water usage. Among the three study communities, the daily peak water usage was during the periods of about 7:00–9:00 and 18:00–22:00. The highest daily water use during the week was for Saturday and Sunday and highest monthly water use was during the months of June, August, and September. Given that water use represents time-series data, predictive ARMA models were developed for different time scales, for each of the study sites, based on water use training data for the period of October 2015–October 2019 and test data for the period of January 2020–December 2020. The models included input regarding population density, categorical information (hour of the day, day of the week, and associated month) and climate metrics (temperature and rainfall). The performance of the ARMA models (for each community) for daily and hourly water use, based on a year of data forward in time relative to the training data, was with R2 in the range of 0.91–0.94 and 0.91–0.95, respectively, and corresponding absolute average error (AARE) of 2.9–4.95% and 1.91–3.83%. The present study suggests that there is merit in considering the ARMA type models for supporting water source management, and the design and deployment of local water systems, including the needed capacity for water treatment and wastewater handling. As suggested by the present similarity analysis of water use patterns for the three small study communities, it may be feasible to invoke transfer learning for the ARMA models to accelerate model training for similar sites, particularly when water use data may be limited. Admittedly, the development of water use models that are of a more general applicability would require specific continuous and categorical model parameters that are expanded to include, for example, details of community descriptors such as personal income, occupation, average residents per household, size of residential units and their number per community, as well as the specific source water (i.e., local well or centralized source).


