Article

The Effect of a Backward-Facing Step on Flow and Heat Transfer in a Polydispersed Upward Bubbly Duct Flow

by
Tatiana V. Bogatko
1,
Aleksandr V. Chinak
2,
Ilia A. Evdokimenko
2,
Dmitriy V. Kulikov
2,
Pavel D. Lobanov
2 and
Maksim A. Pakhomov
1,*
1
Laboratory of Thermal and Gas Dynamics, Kutateladze Institute of Thermophysics, Siberian Branch of Russian Academy of Sciences, Academician Lavrent’ev Avenue 1, 630090 Novosibirsk, Russia
2
Laboratory of Problems of Heat and Mass Transfer, Kutateladze Institute of Thermophysics, Siberian Branch of Russian Academy of Sciences, Academician Lavrent’ev Avenue 1, 630090 Novosibirsk, Russia
*
Author to whom correspondence should be addressed.
Water 2021, 13(17), 2318; https://doi.org/10.3390/w13172318
Submission received: 29 June 2021 / Revised: 19 August 2021 / Accepted: 20 August 2021 / Published: 24 August 2021
(This article belongs to the Special Issue Gas-Liquid Two-Phase Flow in the Pipe or Channel)

Abstract

:
The experimental and numerical results on the flow structure and heat transfer in a bubbly polydispersed upward duct flow in a backward-facing step are presented. Measurements of the carrier fluid phase velocity and gas bubbles motion are carried out using the PIV/PLIF system. The set of RANS equations is used for modeling the two-phase bubbly flow. Turbulence of the carrier fluid phase is predicted using the Reynolds stress model. The effect of bubble addition on the mean and turbulent flow structure is taken into account. The motion and heat transfer in a dispersed phase is modeled using the Eulerian approach taking into account bubble break-up and coalescence. The method of delta-functions is employed for simulation of distributions of polydispersed gas bubbles. Small bubbles are presented over the entire duct cross-section and the larger bubbles mainly observed in the shear mixing layer and flow core. The recirculation length in the two-phase bubbly flow is up to two times shorter than in the single-phase flow. The position of the heat transfer maximum is located after the reattachment point. The effect of the gas volumetric flow rate ratios on the flow patterns and maximal value of heat transfer in the two-phase flow is studied numerically. The addition of air bubbles results in a significant increase in heat transfer (up to 75%).

1. Introduction

Upward gas-liquid bubbly flows in ducts are frequently employed in chemical, nuclear, power engineering and other practical applications. These flows are characterized by a strong interfacial momentum, heat and mass transfer between the carrier fluid phase (water) and dispersed phase (gas bubbles). Bubbly flows in a backward-facing step (BFS) are complicated detachment, recirculation and reattachment of a flow, polydispersity, break-up, coalescence and heat transfer [1,2]. The first papers concerned with the study of such flows were experimental studies of two-phase bubbly flows in ducts and pipes behind a backward-facing step [3,4]. Authors measured the pressure drops, bubble diameter and local void fraction and mean and fluctuational phase velocities.
The complexity of the numerical modeling of such flows is associated with the need to take into account the number of multiscale factors: turbulence of the carrier phase, gas bubble-carrier fluid interaction, bubble break-up and coalescence processes. Only a few papers devoted to the experimental investigations of turbulent bubbly flows in a duct or pipe with sudden expansion without heat transfer were found in the literature [5,6,7].
A theoretical and experimental investigation of the upward bubbly flow with a sudden pipe expansion was carried out in [5]. The distributions along the pipe length and across the pipe radius of mean and fluctuating axial velocities of the gas bubbles, local void fraction, distribution of bubble diameter, pressure drop and wall friction coefficient were studied in this work. The experimental study of a mixture of air and oil in a horizontal BFS flow was performed in a bubbly flow mode, in a transitional regime from bubbly to annular flows and in an annular regime [6]. It is shown that an increase in the gas volumetric flow rate ratio after the two-phase flow detachment cross-section occurs due to the separation of air from the two-phase flow in the recirculation region.
The flow structure of oil-water and kerosene-water flows in a horizontal conduit behind a sudden contraction and expansion has been experimentally studied [7]. Thick core flow can be revealed for high viscous oil in a sudden expansion. It increases the probability of wall fouling by the oil. The experimental values of contraction and expansion coefficients are found to be lower for oil-water as compared to only single-phase fluid water flow for other conditions being identical. Experimental studies of the pressure drop for a two-phase slug flow in a horizontal channel with a sudden expansion were carried out in work [8]. An electrochemical method was used to measure the wall shear stress. It has been shown that misalignment can affect the shear stress of the wall. It was shown that the gas superficial velocity directly affects the flow behavior, as well as the maximum pressure drop and it standard deviation upstream the sudden expansion of the channel. The experimental investigation using the high-speed photography of gas-liquid flow in a horizontal pipe with a sudden expansion was carried out in [9]. The bubble burst phenomenon is described, and liquid film thickness is estimated.
The PIV and shadowgraph measurements of flow and bubble dynamics in an upward bubbly flow in a square pipe with a sudden expansion were studied in [10]. The experiments were carried out for both laminar and turbulent flow regimes. Authors observed that in a two-phase bubbly flow, smaller bubbles migrate toward the pipe wall and larger ones rise in a tube core region by the effect of steeper velocity gradient with the increasing Reynolds number. The accurate modeling of flow structure, void fraction distribution over a duct cross-section and heat transfer in turbulent bubbly flows with a sudden expansion is very important for safety operations, and the predictions of different emergency situations for the energy equipment of thermal and nuclear power stations.
There are only a few works concerned the numerical study of turbulent bubbly flows behind a pipe or duct with sudden expansion without [11] and with heat transfer [12,13]. The mathematical model for describing a polydispersed bubbly flow in the vertical pipe with sudden expansion and its validation by their own measurements was performed in [8]. The turbulence of the carrier phase was modeled using the k-ω SST model [14]. The bubble break-up and coalescence dynamics are predicted using the inhomogeneous multiple size group (h-MUSIG) model [15].
The mathematical model developed and numerical results of the structure and heat transfer in a polydispersed bubbly turbulent flow downstream of a sudden pipe expansion were presented [12]. The turbulence of the carrier liquid phase is predicted using the model of Reynolds stress transport. Bubble dynamics was predicted taking into account changes in the average volume of bubbles due to the expansion of the change in their density, break-up and coalescence. The study was carried out at the change of initial diameter of air bubbles in the range of d1 = 1–3 mm and their volumetric gas flow rate ratios of β = 0%–10%. The effect of the gas volumetric flow rate ratios on the flow structure and heat transfer in the two-phase flow is numerically studied in a bubbly polydispersed flow in a horizontal duct with a single-side BFS [13]. The model based on the Eulerian two-fluid approach.
The modeling of vertical turbulent bubbly flows in a pipe (duct) or in a bubble column requires solving a wide range of time and length scales. The large Eddy simulation (LES) is one of the modern methods for simulating turbulent flows without modeling the fluid phase turbulence. This approach for modeling bubbly flows is much more reasonable than DNS, but it is still too complicated for engineering simulations of turbulent bubbly flows. LES was successfully used for the simulation of two-phase bubbly shear flows [16] or bubble motion in a bubble column [17,18] in the last two decades.
The effect of the bubble fraction and their diameter on the length of the flow recirculating zone, heat transfer and carrier fluid turbulence remain open. The authors did not find works concerning experimental or numerical study of heat transfer in turbulent bubbly flows in BFS. This work is a continuation of our previous papers [12,13] for modeling of flow and heat transfer in the bubbly polydispersed turbulent flows in a pipe [12] or duct [13] with sudden expansion. The main difference of this work from [12] is the method of simulations of the evolution of the spectrum of the bubble diameter. In this paper, the method of δ-functions is used [19,20]. Authors [12] used the model of [21] to describe the evolution of bubble size.
Another method for controlling the mean flow patterns, pressure drop, friction and heat transfer rate is the addition of nanoparticles to a backward-facing step flow [22]. The single-phase laminar flow and heat transfer of nanofluid flow in a horizontal backward facing step subjected to a bleeding condition (suction/blowing) is numerically investigated in [22].
The aim of the present paper is the experimental and numerical study of the flow and bubble dynamics, turbulence modification of the carrier fluid phase, mixing and heat transfer enhancement in the upward bubbly flow in a single-side backward-facing step. This paper may be interesting for scientists and research engineers dealing with the problem of flow control and heat transfer enhancement in power equipment.

2. Measurement Setup

The scheme of the test facility is shown in Figure 1a. The test liquid was stored in the tank (1). A centrifugal pump manufactured by Grundfos (Bjerringbro, Denmark) (2) with a maximum flow rate of 4.2 l/s is used to supply the working fluid. The pump speed and the flow rate of the fluid are set by the PumpMaster PM-P540 frequency converter. To measure the flow rate of the test fluid, an ultrasonic flow meter (3) KARAT-520-32-0 (NPO KARAT, Yekaterinburg, Russia) is used, the measurement uncertainty of the flow rate is 0.2% of the measured value. The test section (duct with sudden expansion) (4) was made of an organic glass with the inner dimensions 1000 × 200 × 20 mm. To create a separation zone, a plexiglass plate is fixed inside the channel. The length and height of the duct before the sudden expansion were L1 = 600 mm and h1 = 8 mm, and after the sudden expansion were L2 = 400 mm and h2 = 20 mm. The step height H = 12 mm, and the expansion ratio was ER = (H + h1)/h1 = h2/h1 = 2.5. A honeycomb was mounted on the duct inlet in front of the plate to establish a uniform fluid flow. The test section is fixed on a frame made of machine-tool aluminum profiles, which provides convenient fastening of the stand elements and the optical system and easy readjustment.
The liquid flow rate through the working section was 0.72 L/s, which corresponds to the mean-mass flow velocity Um1 = 0.55 m/s and Reynolds number based on step height ReH = Um1H/ν = 6600. Gas bubbles were introduced into the liquid flow through 9 capillaries with an inner diameter of 0.7 mm located in the lower part of the working section.
The measurements were carried out using the PIV/PLIF system (5), based on the use of a green laser with a constant glow (wavelength 532 nm), full power 1 W and a high-speed camera JET 19 (Kaya Instruments, Haifa, Israel). Since the duct has a large width, measurements in a two-phase flow using the PIV/PLIF method in a situation where the laser knife and the camera’s field of view are located perpendicularly is extremely difficult. This is due to the significant overlap of the measurement area by bubbles that move between the region of interest (ROI) and the camera. Therefore, for measurements, the laser knife was wound perpendicular to the wall of the test section, and the camera was directed at an angle of 45 (see Figure 1a). Because of this, we had different scales along the horizontal and vertical axes. The calibration of the linear dimensions was performed for both axes. Measurements were performed along the central axis of the channel with a sudden expansion just behind the BFS (see Figure 1b). The shooting speed during the experiments was 1000 frames per second. Distilled water with the addition of fluorescent (rhodamine filled) polyamide particles manufactured by Dantec Dynamics (Skovlunde, Denmark) (their diameter was 1–20 μm) was used in measurements. To make bubbles invisible, no Rhodamine was added to the test liquid accorded [23].
The recognition of bubbles in a separated flow is a nontrivial task and requires the development of new methods and approaches. Examples of images obtained by adding Rhodamine to the flow are shown in Figure 2a–c, obtained at Re = 6600 and b = 0.03 and different sizes of bubbles. The figures show that the bubbles in the separation region of the flow can have a substantially non-spherical shape. The currently developed methods, as a rule, deal with spherical or elliptical bubbles [24]. Development of a deep learning-based image processing technique for bubble pattern recognition and shape reconstruction in dense bubbly flows were performed in [25,26]. In addition, depending on the position relative to the laser knife, the bubbles can be “light” or “dark”, as well as cast a shadow and reflect a noticeable glare. In the case without adding a fluorescent dye to the flow, but using fluorescent particles for PLIF, the flow pattern is shown in Figure 2d. An optical threshold filter was used to view the position of particles in the flow. In this case, the recognition of bubbles is not required, however, it is possible to obtain information only on the hydrodynamic characteristics of the liquid phase. However, since the liquid flow structure determines the heat transfer, it may be sufficient for some tasks, including the validation of CFD codes.
A series of 10,000 frames for each regime was accrued. Data processing was carried out by “ActualFlow” software developed in IT SB RAS. Firstly, the subtraction of the mean intensity field averaged over the whole sample range were successively applied to enhance the quality of the raw data. Velocity fields were calculated using the iterative cross-correlation algorithm with a continuous window shift and deformation and 75% overlap of the interrogation windows. The initial size of the interrogation window was chosen to be 64 × 64 pixels but it was subsequently reduced to 32 × 32 pixels. The obtained instantaneous velocity vector fields were then validated with the following procedures: peak validation with the threshold of 2.0 and adaptive median 5 × 5 filter.
In order to validate the proposed method, preliminary measurements of the hydrodynamic structure of the flow were carried out using Laser Doppler anemometry system with a measurement uncertainty ±2%. The deviations of the data obtained using the PIV and LDA in a single-phase flow did not exceed 3%.

3. Mathematical Model and Method of Numerical Realization

3.1. D RANS + SMC “In-House” Numerical Code

The flow and heat transfer in the bubbly flow is modeled using the Eulerian approach [26]. It treats the dispersed phase as a continuous medium with properties analogous to those of liquid and this method is widely used for the simulation of turbulent bubbly flow with and without bubble break-up and coalescence processes in various types of flow geometries. The Eulerian approach is based on kinetic equations for a one-point probability density function [27]. The 2D steady-state, incompressible RANS model [12] is used for modeling of turbulent bubbly flow in the BFS. The set of governing equations consists of continuity, two-momentum and energy equations taking into account the effect of bubble presence on the transport processes in the carrier fluid phase. The effect of bubbles on the mean and fluctuational characteristics of turbulent carrier fluid flow is determined by drag, gravity lift, virtual mass, wall lubrication forces, turbulent transport and turbulent diffusion (so called two-way coupling) [12].
The system of 2D RANS equations for the two-phase bubbly flow is given as [23,28]
× Φ l ρ U = 0 × Φ l ρ U U = Φ l P + ρ g + × Φ l ρ τ × ( Φ l ρ u u + k = 1 K σ k B I ) + + P P i n × Φ l + k = 1 K M l k × Φ l ρ C P U T = × Φ l λ T × Φ l ρ C P u θ + k = 1 K 6 h k T T b k d k + + k = 1 K ρ b k C P b , k g u t , k u θ × Φ l Φ l + Φ b = Φ 1
Hereinafter, the index k is partially omitted; Φl and Φb are the volume fractions of the liquid phase and bubbles, respectively; K is the number of groups of bubbles; P and PinPb are the pressures in the liquid phase and on the surface of bubble [1,29], respectively; σBI is the influence of the kth group of bubbles on the tensor of averaged Reynolds stresses in the liquid phase [1,27]; τ, u u and u θ are the tensors of viscous stress and Reynolds stress and turbulent heat flow in the carrier phase, respectively; M l = k = 1 K M l k = M b interfacial term [23,27]; g is the gravity acceleration; g u t , k is the coefficient of involvement of gas bubbles of the kth fraction in the thermal fluctuation movement of the carrier fluid [27]; τ Θ k is the thermal relaxation time. The right-hand side of the momentum equation includes the pressure gradient in carrier phase, gravity, the viscous stress, Reynolds stresses in bubbly flow, interfacial pressure gradient and momentum exchange between carrier fluid and gas phases that arise from the actions from interfacial forces.
The turbulence of the carrier fluid is predicted using the Reynolds stress model (second moment closure—SMC) [30] taking the effect of gas bubbles on fluid phase turbulence [31].
Φ l ρ U u u = × Φ l D K + Φ l P K + ϕ ε + S K × Φ l ρ U ε = × Φ l D ε + Φ l P ε ε + S ε χ L T 2 2 χ = 1 ε T T
Here ϕ i j = 1 k χ ϕ i j W + k χ ϕ i j H is the velocity-pressure-gradient correlation, well known as the pressure term [30], χ is the blending coefficient, which goes from zero at the wall to 8 unity far from the wall [27]; ϕ i j H is “homogeneous” part (valid away from the wall), and ϕ i j W is “inhomogeneous” part (valid in the wall region) and L T = 0.45   m a x k 3 / 2 / ε ;   80 ν / ε 3 / 4 is the turbulent macro-scale length. Last terms SK and Sε in the right part of the turbulence model take into account the effect of the dispersed phase on transport processes [31].
The dispersed phase is modeled by the Eulerian two-fluid approach. The system of axisymmetric mean transport equations for the kth fraction of bubbles has the form [23,28] (to simplify the equations the index k is partially omitted).
ρ b t + × α b k ρ b k U b k = 0 D α b k ρ b k U b k D t = α b k D b k τ k × α b k ρ b k × α b k ρ b k E u u + k = 1 K M b k D α b k ρ b k T b k D t = 1 τ Θ k × ρ b k D b k Θ α b k α b k T T b k ρ b k τ Θ k ρ b k = α b k P b / R b T b k
The method of δ-approximation of [19,20] is used for modeling the polydispersity of the bubbly flow. The break-up and coalescence processes are predicted according to the model of [23,28] and they are described in detail in [32].
The governing transport equations for both gas (1) and dispersed (2) phases, and the turbulence model (3) are solved using a control second-order upwind finite control volumes approach on a staggered grid. The convective terms are discretized using the third order QUICK algorithm and the diffusion terms are numerically solved employing the second-order central difference scheme. The SIMPLEC scheme is used for the coupling of velocity and pressure. The basic grid with 256 × 124 control volumes (CVs) along the longitudinal and transverse directions is used for all numerical simulations. The time derivatives are discretized using the implicit Euler scheme of the first-order accuracy. The components of Reynolds stresses are determined at the same points along the faces of the control volume as the corresponding components of the mean fluid velocity [33]. Grid convergence is verified for three grid sizes is used for the “in-house” code: coarse grid: 128 × 62, basic grid 256 × 124 and fine grid: 400 × 180 control volumes (see Figure 3a).

3.2. D RANS + SST and LES (Ansys CFD Package)

Three-dimensional RANS and LES predictions for the single-phase fluid flow behind the single-side BFS are performed in the paper using the commercial CFD package Ansys Fluent 2020R2 [34]. Ansys CFD package was used for the additional validation of the “in-house” RANS + SMC numerical code. 3D RANS simulations by Fluent are employed Menter’s k-ω SST model [14] and LES with wall-adapting local eddy-viscosity (WALE) subgrid-scale (SGS) model [35]. The Menter’s k-ω SST model is one of the most popular isotropic two-equation turbulence models for simulation of various turbulent flows. The WALE SGS model is one of a major SGS model for flow simulations in complicated geometries.
The Fluent 3D RANS basic grid consist of 256 × 100 × 100 = 2.56 Mio CVs. Grid convergence is verified for three grid sizes: coarse grid: 150 × 50 × 50 CVs, basic grid: 300 × 150 × 100 and fine grid: 450 × 184 × 150 (see Figure 3b). The control volume method for discretization of the governing equations is used. The computational grid is non-uniform, and more refined grid is performed to all wall surfaces. The grid resolution is chosen optimal after preliminary simulations, and it provides the condition for the position of the first cell from the wall y+ < 1. The profiles of the velocity, turbulent kinetic energy and the rate of their dissipation are set at the entrance to the duct with a backward-facing step. They are simulated in the upstream section with the length 5H before the section of flow separation. The wall functions are not used, i.e., the predictions are carried out directly to solid surfaces. Boundary conditions at the duct entrance profiles—velocity, turbulent kinetic energy and their dissipation rate—are set after the preliminary simulations of the flow in the upstream section. The temperature of the incoming water flow is constant T1 = 298 K, and the change in the thermophysical properties is neglected in the predictions.
The LES simulations are conducted using the basic grid with 490 × 124 × 30 = 1.82 Mio CVs. Grid convergence is verified for three grid sizes: coarse grid: 250 × 62 × 20 CVs, basic grid: 490 × 124 × 30 and fine grid: 650 × 190 × 45 (see Figure 3c). It should be noted that the periodic boundary condition in z (duct width) direction for the LES method were used. The governing equations are solved numerically using a pressure-based non-iterative time-advancement (NITA-FS) solver with Courant-Friedrichs-Lewy condition CFL < 0.5. The second-order central scheme is used to discretize the convective terms. To predict the flow in the upstream section, the 3D RANS method was conducted. LES modeling is carried out only for a duct with a single-side backward-facing step. The grid resolution is chosen optimal after preliminary simulations, and it provides the condition for the position of the first cell from the wall y+ < 1. The temperature of the incoming water flow was constant T1 = 298 K, and the change in the thermophysical properties was neglected in the calculations. The boundary conditions on the wall behind the step is TW = const = 313 K. The end wall of the step is not heated.
Differences in the value of local Nusselt number Nu calculated for the bubbly flow is less than 0.1%. The maximum error emax is defined as: e m a x i = 1 ,   N Nu i n Nu i n 1 6 m a x , where N is the total number of CVs in corresponding direction, the subscript i is the specific CV and the superscript n is the iteration level. The computational grid is nonuniform both in the streamwise and transverse directions. A more refined grid is applied in the recirculation region and in the zones of flow detachment and reattachment and in the inlet region of the duct. The coordinate transformation is suitable for such a two-dimensional problem:
Δψj = K × Δψj-1,
where Δψj and Δψj-1 are the current and previous steps of the grid in the axial or radial directions and K = 1.05 (longitudinal direction) and K = 1.03 (transverse direction). The first cell is located at a distance y+ = yU*/ν = 0.3–0.5 from the wall surfaces, where U* is the friction velocity obtained for the single-phase flow in the inlet of the duct (other parameters being identical). At least 10 CVs were generated to ensure resolution of the mean velocity field and turbulence quantities in the viscosity-affected near-wall region (y+ < 10). The time step was Δt = 0.1 ms. The Courant number, which is a necessary condition for the stability of numerical solution of differential equations in partial derivatives, does not exceed 1 for all simulations.
At the inlet streamwise and transverse components, temperatures of the phases and turbulence levels are uniform. No-slip conditions are set on the wall surface for the carrier fluid phase. At the outlet edge, the computational domain condition ∂θ/∂x = 0 is set for all variables.

4. Comparison with Experimental and Numerical Results

4.1. Single-Phase Flow in the BFS

At the first stage, comparisons were carried out with the measurement data for a single-phase gas duct flow behind a single-side backward-facing step. The well-known experimental results [36] were used for comparisons on the heat transfer. Additionally, comparisons were performed with the semi-empirical correlation data [37] for minimal wall friction coefficient distribution.
The measured [36] and authors’ predicted distributions of Stanton number St along the streamwise coordinate are shown in Figure 4a. The measurements were performed in duct with single-side BFS with dimensions: height 188 mm after sudden expansion and width was 500 mm. The step height was H = 38 mm and expansion ratio was ER = 1.25. The carrier fluid was air with temperature T1 = 298 K. The mean upstream fluid velocity Um1 = 11 m/s and Reynolds number was ReH = 2.8 × 10⁴. The Stanton number is calculated using the expression: St = h/(ρCpU m1). Here h is the heat transfer coefficient, ρ is the density of the carrier fluid flow and Cp is the specific heat at constant pressure.
The distributions of the minimum value of the wall friction coefficient Cf, min in the separation region for single-phase fluid flow vs. the Reynolds number ReH based on the step height are given in Figure 4b. The measurements of [37] were performed in the duct with single-side backward-facing step with dimensions: length was 1600 mm, height 70 mm after sudden expansion and width was 220 mm. The step height was H = 20 mm and expansion ratio was ER = 1.4. The carrier fluid was water with temperature T1 = 298 K. The mean upstream fluid velocity Um1 = 0.024–0.24 m/s and Reynolds number varied ReH = (0.12—1.22) × 104. The wall shear stress was measured using the electrodiffusion method. Line 1 is the semi-empirical correlation [37] for calculating the wall friction C f , min = 0.38 R e H 0.57 , and points (2) represent the author’s predictions. The strong dependency of minimal values of wall friction in the reverse zone on the Reynolds numbers was obtained as well as in experiments [37] and our numerical predictions. Good agreement was obtained between the results [36,37] and the data of authors’ numerical predictions.

4.2. Two-Phase Bubbly Flow in Round Vertical Pipe

Comparison of experimental [38] and authors’ predicted data on the distributions of carrier fluid and gas bubbles velocities over the round pipe cross-section is shown in Figure 5a. The mean axial velocities of both carrier fluid (line 2) and gas (line 3) phases in a two-phase flow is always higher than in a single-phase flow (line 1). The velocity profile of gas bubbles (line 3) over the cross section of the pipe has a flatter form in comparison with the velocity of the fluid (line 2). The mean axial velocity of the bubbles in the upward flow is higher than that one for the liquid phase due to the action of the Archimedes force.
The radial profiles of the mean Sauter bubble diameter along the pipe radius are shown in Figure 5b. An increase in the gas volumetric flow rate ratios causes an increase in the size of bubbles over the pipe cross-section. The bubble size in the near-wall region is slightly higher than the corresponding value for the core part of a two-phase pipe flow. This conclusion is typical both for measurements [36] and for authors’ numerical simulations. This due to the fact that small bubbles migrate to the wall due to the action of the lift and turbulent migration forces and they accumulate near the wall. The probability of their coalescence is increased in this case.

4.3. Two-Phase Bubbly Flow in the BFS

The numerical model was validated against comparison with experimental results for the bubbly flow in a vertical upward pipe with sudden expansion. These results were presented in our previous papers [12,23] and they are not presented here only for brevity. We have carried out the comparison with measurements of [39] and LES of [40] for the isothermal flow regime. The mean-mass velocity was Um1 = 1.78 m/s, which corresponds to the Reynolds number ReH = 1.1 × 10⁵. The pipe diameter, before the abrupt, was 2R1 = 50 mm, while after expansion, 2R2 = 100 mm, which corresponded to the step height of H = 25 mm, and ER = (R2/R1)2 = 4 and the inlet bubble Sauter diameter was d1 = 2 mm. The authors results agree well with experiments and LES data. We have conducted the comparison with present measurements for the mean fluid axial velocity profiles and heat transfer enhancement [23]. The maximal difference between our and other authors measured results and our predictions is up to 20%.

4.4. Two-Phase Bubbly Flow behind a Backward-Facing Step. Our Measurements and Numerical Simulation and Their Discussion

Based on a successful comparison of the results obtained using different methods, studies of the local structure of the two-phase bubbly flow in a BFS are carried out. Symbols and curves are the authors’ measurements and predictions, respectively. The transverse profiles of measured and predicted mean streamwise fluid velocities at the ReH = 6600 in the single-phase fluid flow (lines 1) and at gas volumetric flow rate ratio β = 3% (lines 2) along the duct length are shown in Figure 6. The carrier fluid velocity was normalized to the maximum value of liquid velocity. The point of flow reattachment in the single-phase fluid flow is located at a distance of (7–8)H, which is in good agreement with the literature data [41,42]. The following characteristic features of the bubbly flow can be distinguished. Immediately behind the step, the flow recirculation zone is observed. The gas bubbles badly penetrate this region and the effect of gas bubbles on the flow is rather weak in this area. The position of the flow reattachment point shifts towards the step for the two-phase flow and, in general, the establishment of a profile in the channel after the expansion occurs faster in a two-phase flow than in a single-phase flow, which was previously reported, for example, in [23]. Our numerical results capture the main features of the bubbly flow behind the BFS described above. The main difference between the experimental and numerical results for the two-phase bubbly is obtained in the near-wall zone in the flow relaxation region.

5. Numerical Results and Its Discussion

5.1. Single-Phase Fluid Flow in a Backward-Facing Step Flow

The distribution of mean streamwise fluid velocity component at various distances from the BFC is presented in Figure 7. The measurements are conducted using the PIV. The 3D RANS + SST predicted contours of the longitudinal velocity component and streamlines at a few stations along the z axis are shown in Figure 8a. The computations are carried out using the commercial CFD package Ansys Fluent 2020R2. This figure clearly shows the three-dimensional flow pattern in the recirculation area. The length of the recirculation zone is maximum in the central section (z/H = 8.3). The length of the recirculation zone behind the backward-facing step increases with distance from the side walls of the duct. When flowing around the backward-facing step, the flow detaches the sharp edge, and a separation bubble is formed. A long recirculation zone and, characteristic of it, a secondary vortex is formed behind the edge. It has the opposite direction of flow rotation to the main one, and the rotation velocity in it is relatively low, which leads to the formation of a stagnant zone in this region.
The change in the turbulent kinetic energy behind the step in various sections along the z axis is presented in Figure 8b. A turbulization of the flow occurs when flowing in the BFS due to additional vortex formation. The largest values of TKE are located in the region of the mixing shear layer, and their minimum values are observed in the region of the secondary vortex. The turbulent kinetic energy increases toward the center duct. The largest values of turbulent kinetic energy in the region are observed in the central section.
The transverse profiles of single-phase flow mean streamwise velocity behind a single-side backward-facing step are shown in Figure 9. Here symbols and curves are the authors’ measurements and predictions, respectively. The first three sections are located in the recirculation region, the fourth station is set close to the reattachment point and last two sections are set in the flow relaxation zone. It was obtained a qualitatively agreement between authors’ measurements and LES and RANS results.

5.2. Upward Bubbly Flow in a Backward-Facing Step Flow

Numerical simulations are carried out for a fluid flow of a water and polydispersed air bubbles at atmospheric pressure and all these results given in this subsection are obtained using the “in-house” 2D RANS + SMC model. The upward bubbly flow in the duct with a single-side backward-facing step is considered (see Figure 1b). The Reynolds number Re = Um1H/ν = 6600, and the mean-mass velocity at the inlet Um1 = 0.55 m/s. The height of the duct before separation h1 = 8 mm, height of the duct after separation h2 = 20 mm, and the step height H = 12 mm, the expansion ratio ER = (H + h1)/h1 = h2/h1 = 2.5, the wall temperature TW = const = 313 K and the initial temperatures of carrier liquid and gas bubbles T1 = Tb1 = 293 K. In the inlet section, the mean phase velocities have the same value. The initial gas volumetric flow rate ratios are varied β = 0–10% and the mean initial Sauter diameter of air bubbles d1 = 3 mm. All simulations are performed for four monodispersed δ-functions (modes) of air bubbles at the inlet cross-section: 1—d/d1 = 0.33, 2—0.66, 3—1, and 4—1.33. The volume fraction of each fraction is Φ1(1 mm) = 0.031Φ, Φ2(2 mm) = 0.12Φ, Φ3(3 mm) = 0.6Φ, and Φ4(4 mm) = 0.15Φ, where Φ is the total volume fraction of gas bubbles. Authors did not carry out the measurements of the distributions of the diameters of gas bubbles at the inlet cross-section. Therefore, the choice of just such values of gas bubbles diameters and their volume fractions is based on our preliminary numerical predictions. There is no steam generation on wall surface. The same assumptions were used in our previous recent numerical simulations [12,13,29], but they may be important in other thermal boundary conditions on the wall [43].
In Figure 10 the transverse profiles of the total local void fraction (a) and total bubble diameter (b) of all monodispersed four modes are shown along the duct length in the upward bubbly flow behind the backward-facing step. The so-called “top-hat” distribution [44] of the local void fraction is obtained at the inlet (line 1) (the cross-section of sudden expansion). This is one of the most typical distributions of void fraction in a vertical upward bubbly flow for a low gas bubble concentration. The obvious maximum of void fraction in the near-wall regions is typical for this type of void fraction distribution [44]. Further, there is a significant change in the predicted distributions of the local void fraction over the duct cross-section. It can be explained by a significant increase in the two-phase flow cross-section behind the BFS (see Figure 10a). The “right” local maximum of the void fraction is also located near the “right” wall of the duct, but its value is noticeably less than for the inlet section (lines 2–5). The “left” local maximum of the void fraction becomes much less noticeable along the duct length by bubbles scattering and diffusion across the duct cross-section. In the area of the recirculation zone of the two-phase flow (curves 2–4), an extremely small number of gas bubbles are obtained. It can be explained by their relatively large initial diameter. It was recently shown in our previous work [12] that large bubbles practically do not penetrate the recirculation region in a pipe with sudden expansion and are observed mainly in the mixing layer and in the flow core. The bubbles distribution after the reattachment point is characterized by the presence of bubbles over the entire all cross section of the duct by the effect forces acting on a bubble in a transverse direction and low maximum in the near-wall zone of the duct (line 5). The profile of local void fraction at x/H = 10 has almost uniform distribution. The profiles of the local void fraction are characterized by a zero-value close to the duct wall. This is explained by the fact under the action of the wall force a bubble cannot approach a wall. The profiles of dimensionless bubble diameter of all monodispersed four δ-functions are presented in Figure 10b. The maximum bubbles size is obtained in the near-wall zone of the duct. The bubbles diameter in the recirculation region is less than that one in the flow core.
The “in-house” 2D RANS + SMC numerical results for the sum (total) of all four fractions of air bubbles were shown in Figure 11. To better understand the complicated and coupled break-up and coalescence processes in bubbly turbulent flows, the results of local void fractions and bubble diameter distributions obtained for four various bubble fractions are important, and these results are presented in Figure 11. The cross-section x/H = 4 is located in the area of flow recirculation. The void fraction profiles of the smallest (line 1) and middle (curve 2) bubbles have only one local maximum located close to the duct wall. Only the bubbles of the smallest size (line 1) are observed in the recirculation zone of the duct (see Figure 11a). The void fraction profiles of large bubbles (curves 3 and 4) have two local maxima and are set close to the duct wall and in the shear mixing layer. Two obvious local maxima are revealed in the distribution of void fraction of all modes (line 5) too.
The distribution of all fractions of bubble diameters across the duct cross-section is practically uniform (see Figure 11b). Bubbles of the smallest investigated diameter d/d1 ≤ 0.33 (line 1) are found over the entire section of the channel, both in the flow recirculation zone and in the flow core. The smallest air bubbles can come closer to the duct wall than the larger bubbles due to the effect of transverse forces (lift, turbulent migration, turbulent diffusion and wall force). The largest bubbles d/d1 ≥ 1 (line 5) are located mainly in the near-wall part of the channel, which confirms the data of our numerical predictions presented in Figure 11a,b. Bubbles of the other two monodispersed fractions (d/d1 = 0.33–0.66, 0.66–1, lines 2 and 3) also practically do not penetrate the flow separation region.
The effect of the volumetric flow rate gas content on the profiles of the longitudinal liquid velocity is shown in Figure 12. The carrier fluid (water) velocity in the two-phase bubbly flow (curves 2 and 3) is slightly higher that one in the single-phase flow (line 1). This effect increases with an increase in the concentration of air bubbles.
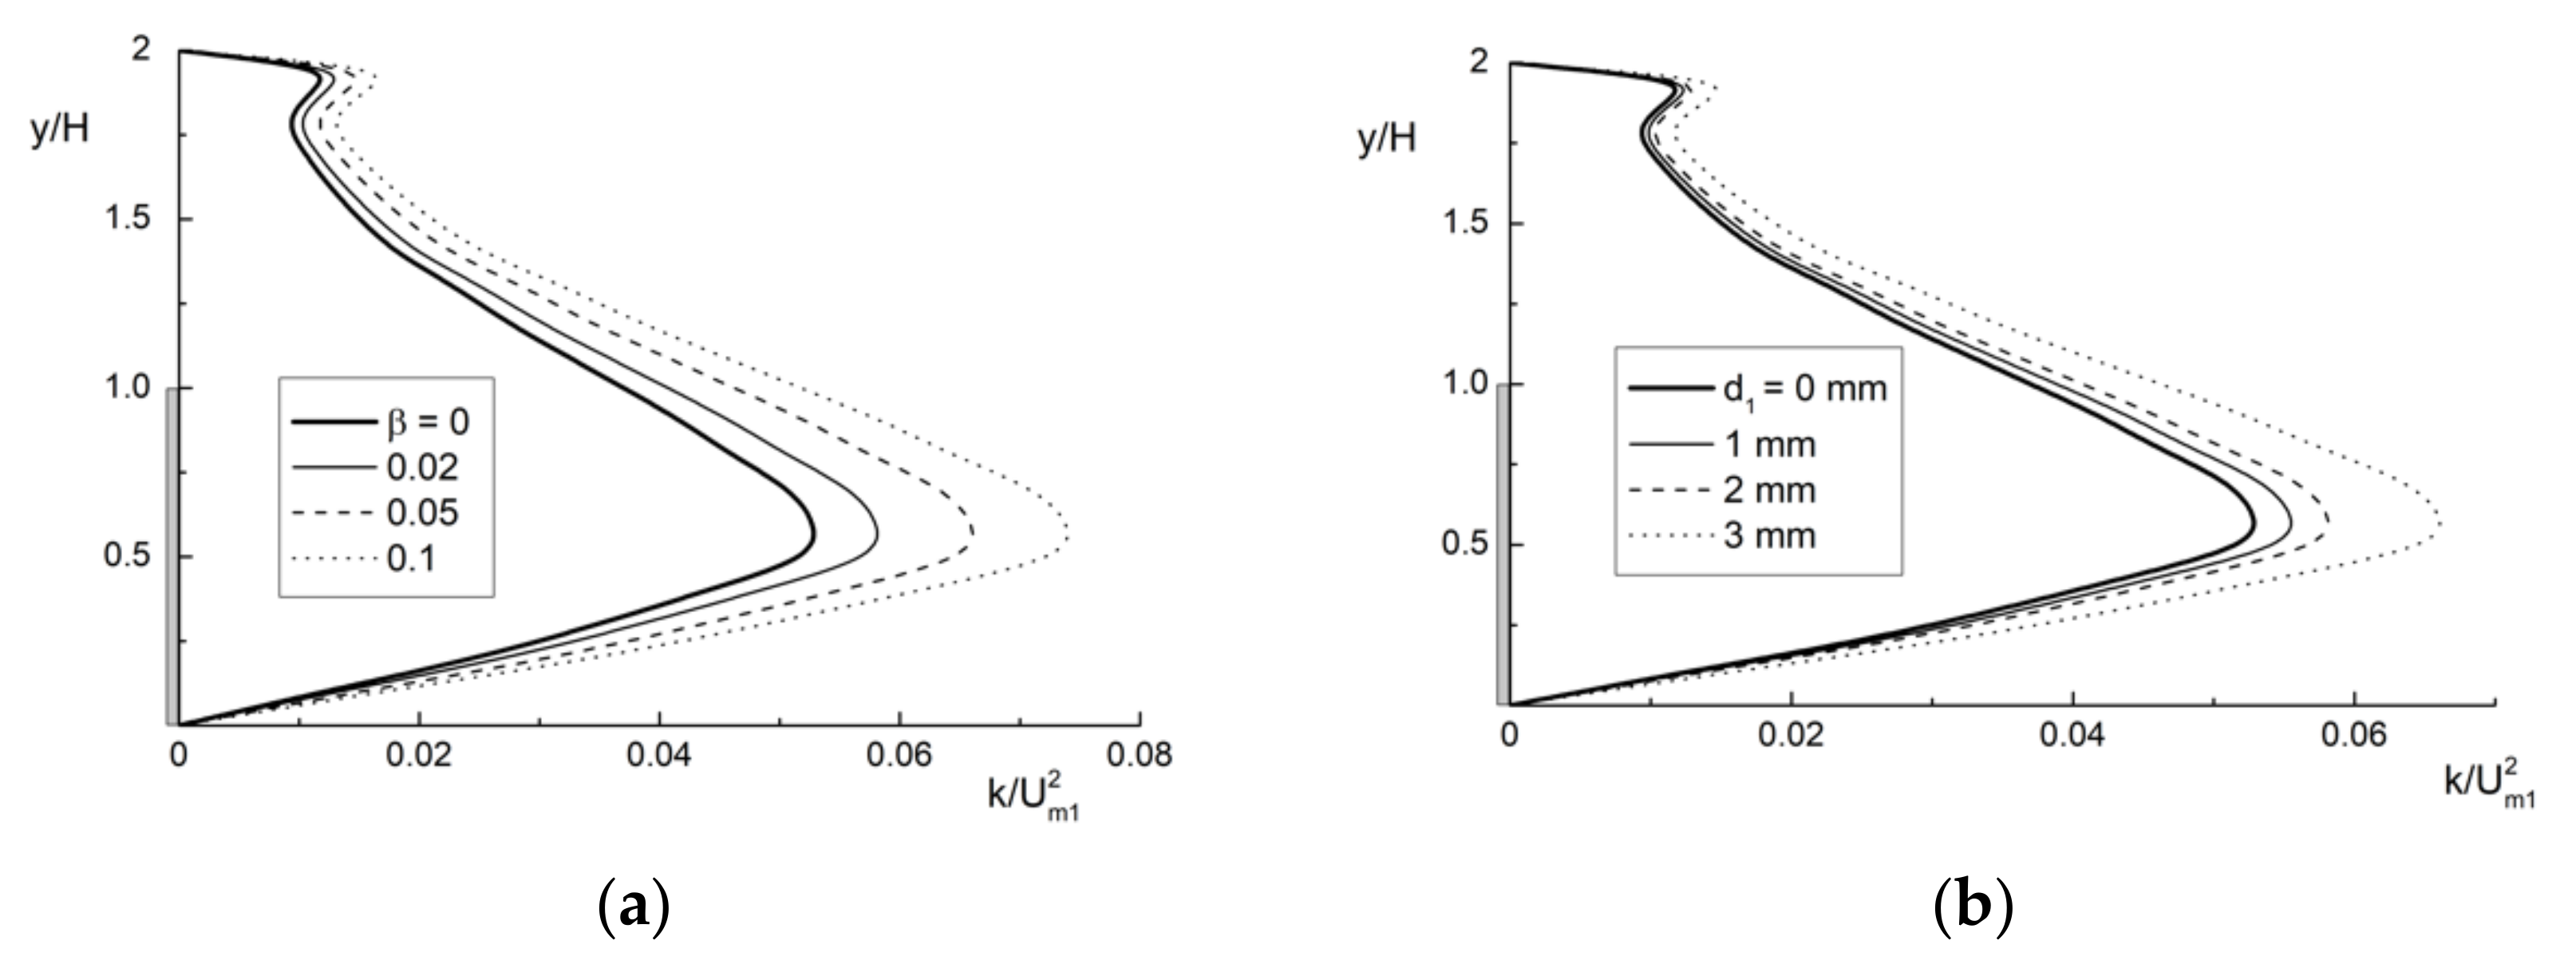
The effect of the gas volumetric flow rate ratios (a) and gas bubbles diameter at the inlet (b) on the carrier fluid phase turbulent kinetic energy is shown in Figure 13. Carrier fluid phase turbulence level for a 2D flow is estimated using the expression: 2 k = u i u i = u 2 + v 2 + w 2 1.5 u 2 + v 2 . The maximum of TKE of the fluid in the two-phase flow is located in the shear mixing layer. The significant enhancement of the carrier fluid phase turbulence level in the two-phase flow (up to 40% at β = 10%) is shown in comparison with the single-phase flow (bold solid curves). The increase of initial bubble size causes a significant increase in the turbulent kinetic energy in the bubbly flow (up to 25% at d1 = 3 mm). The additional production of carrier fluid phase turbulence is explained by vortex formation upon streamlining of the gas bubbles by the carrier fluid flow. The profiles of TKE at a small value of β agree qualitatively with those for the case of one-phase flow in a duct with single-side BFS. The same tendencies were obtained in our previous works [12,23] for a pipe with sudden expansion.
In Figure 14 the effect of the addition of the gas bubbles on heat transfer from the wall to the two-phase bubbly flow. The local convective Nusselt number at constant wall temperature is estimated:
Nu = T / y W H / T W T m
where (∂T/∂y) W is the gradient of the fluid temperature on the wall, TW is the wall temperature and Tm is the mean temperature of the carrier fluid (water) in this section. Lines 1 are Nusslet number in the fully developed single-phase duct flow and dashed curves 2 are the predictions of heat transfer in the single-phase duct flow with sudden expansion for the fluid (water) flow with other conditions being identical.
A noticeable increase of heat transfer (up to 35% at d1 = 3 mm in comparison with the single-phase fluid flow) with an increase in the volumetric flow rate ratio β is observed (see Figure 14a). This is explained by an increase in the velocity and temperature gradients and turbulization of the carrier fluid (water) phase in the near-wall region of the duct. The position of the peak of heat transfer shifts upstream and at β = 5% is xNu_max/H = 4.5, and the length of the recirculation zone approximately coincides with it, xR/H = 4.8 at β = 5%. The same values for the single-phase fluid flow are xNu_max/H = 6.8 and xR/H = 7. The position of the peak of heat transfer rate xNu_max is close to the position of the flow reattachment point xR in two-phase bubbly flow. The same tendency was observed in [41,42] for single-phase fluid flows in a BFS. The effect of bubble diameter in the inlet on the Nusselt number distributions along the duct length is given in Figure 14b. The largest increase in heat transfer (approximately 35% at fixed value β = 5%) is characteristic for the largest gas bubbles with the initial diameter d1 = 3 mm.
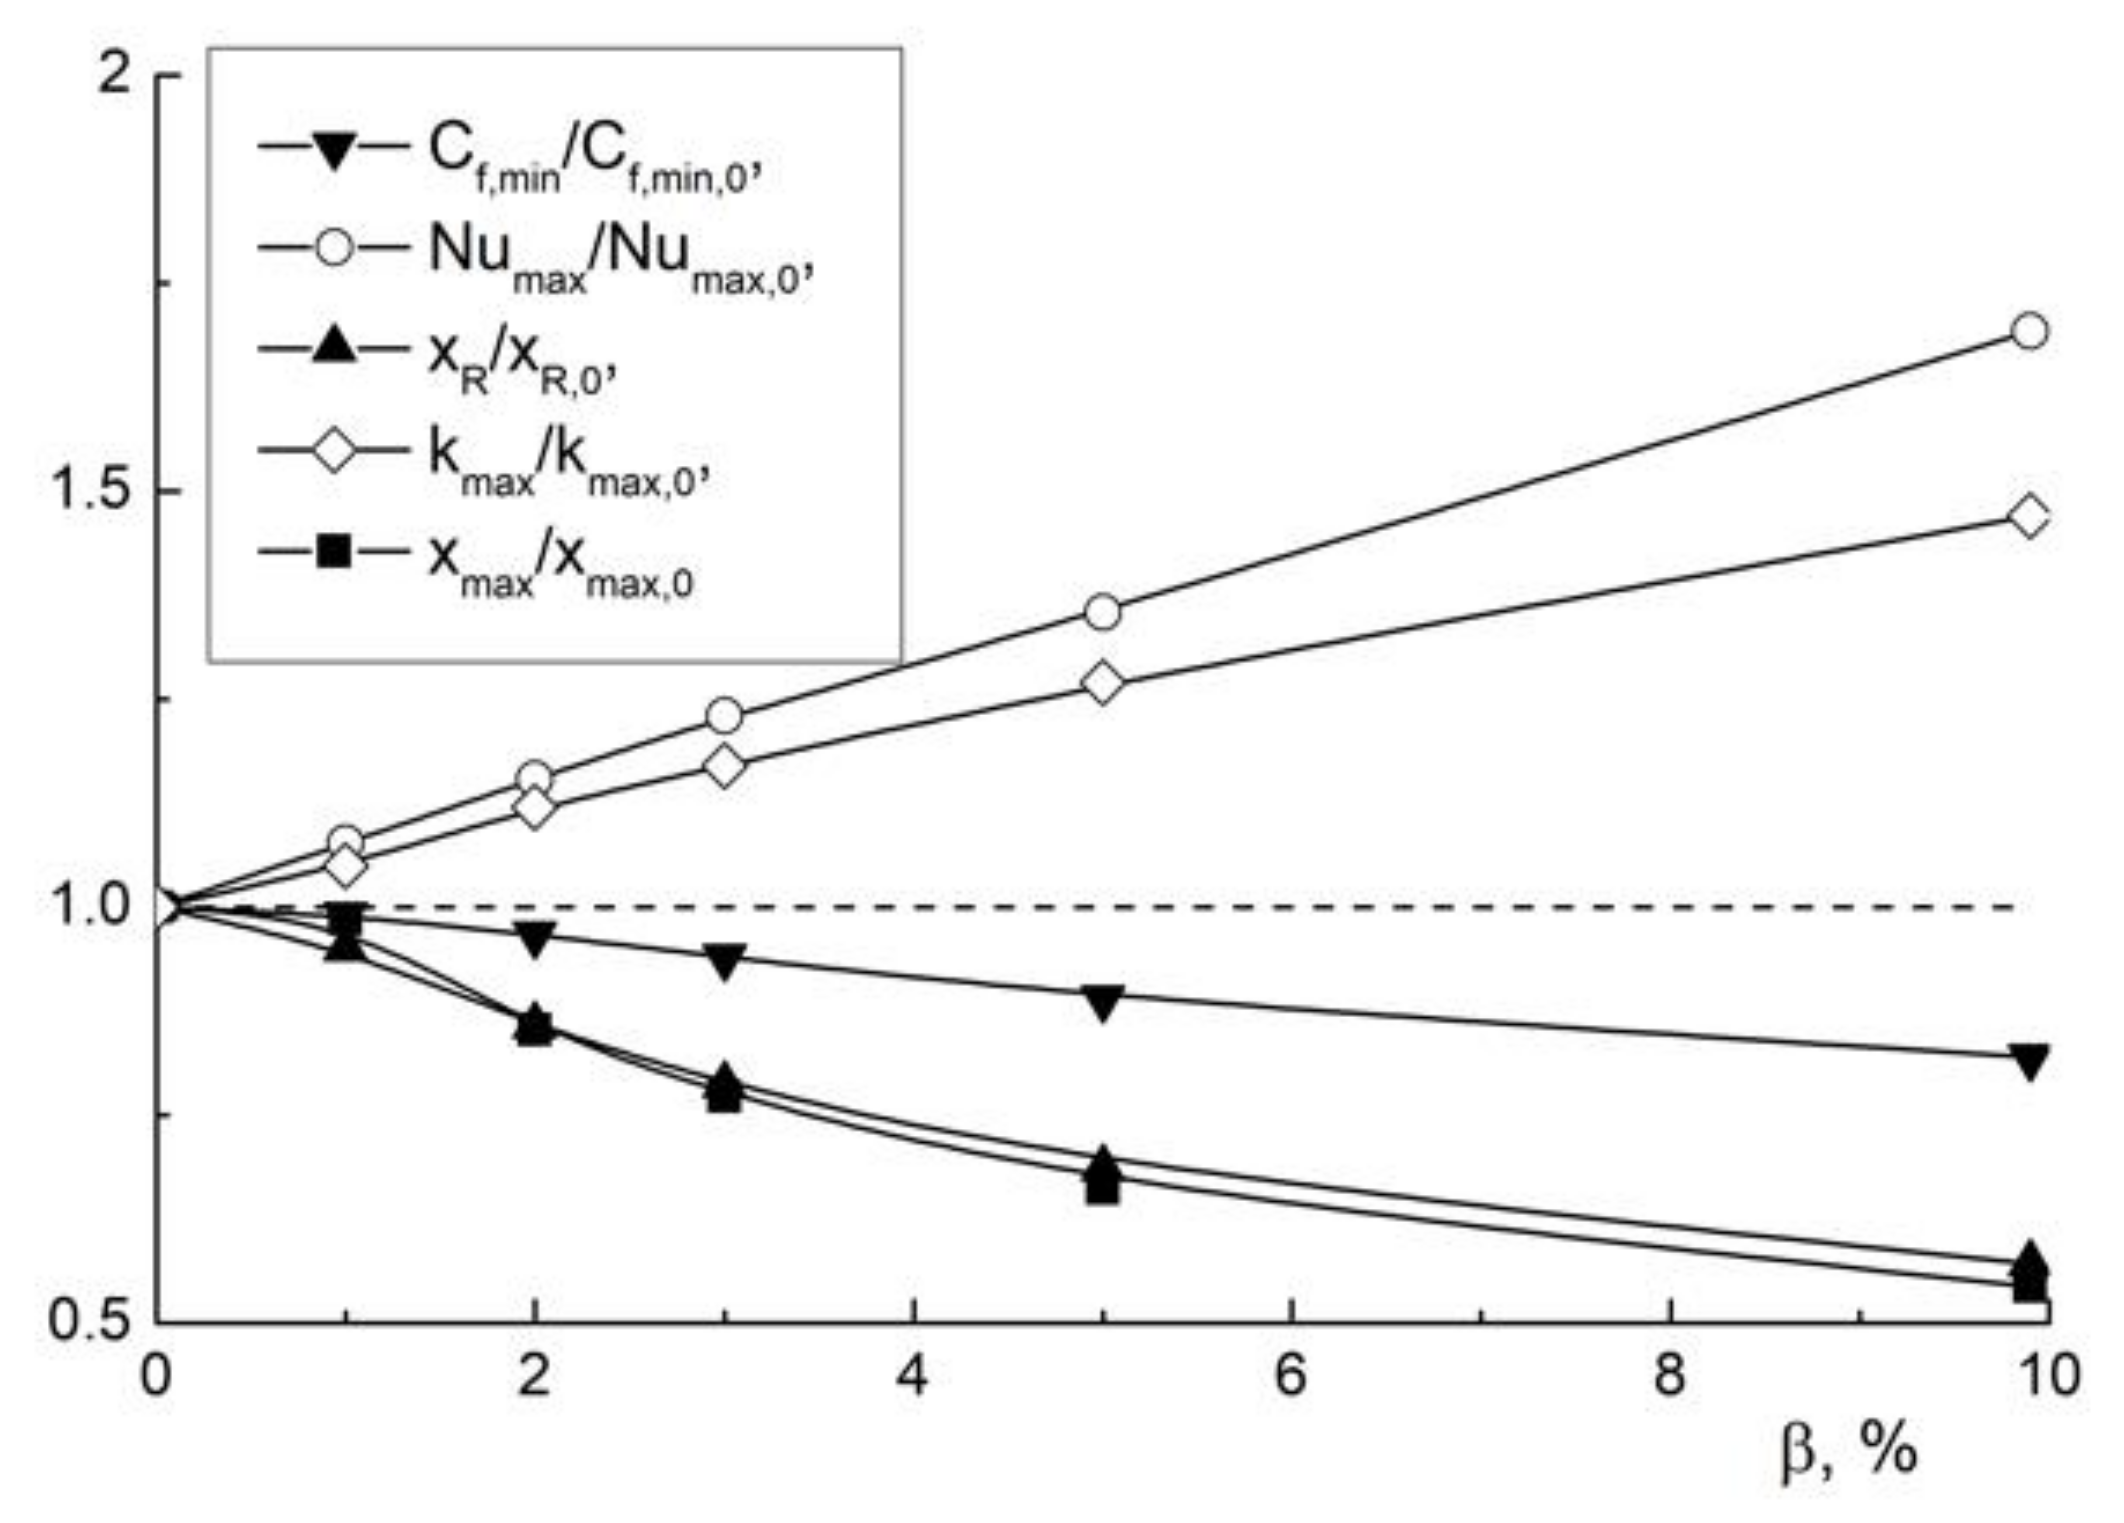
The effect of gas volumetric flow rate ratios β on values of minimal wall friction coefficient Cf,min/Cf,min,0, maximal heat transfer enhancement ratios Numax/Numax,0, recirculation length xR, maximal values of turbulence modification ratios kmax and position of heat transfer maximum xmax are shown in Figure 15. All these variables are normalized on the value in the single-phase fluid flow and subscript “0” is the in the single-phase flow parameter with other conditions are identical to the two-phase bubbly flow.
It is obtained that the magnitude of minimal wall friction coefficient decreases with the increase in the bubble concentration and for β = 10% the minimal value of wall friction ratio is Cf,min/Cf,min,0 ≈ 0.75. The reduction of minimal value of wall friction ratio is small (up to 10%) for the β ≤ 5%. Almost linear convective heat transfer enhancement is observed for the range studied of gas volumetric flow rate ratios and for β = 10% the heat transfer augmentation ratio is Numax/Numax,0 ≈ 1.75. The addition of gas bubbles leads to the significant shortening of the recirculation length ratio of bubbly flow. The shortening of the recirculating zone is almost twice in comparison with the case of the single-phase fluid flow. The main reason is the flow turbulization by flowing around the gas bubbles. The maximal value of turbulent kinetic energy modification is up to 50% at β = 10%. It causes the intensification of mixing process. The same trends were obtained for the single-phase separated flows [41,42]. It is well known [41,42] that the position of maximal value of heat transfer is close to the flow reattachment point for the single-phase for both gas (air) and fluid (liquid) flows behind a BFS and a sudden pipe expansion. The addition of relatively large air bubbles shifted the position of maximal value of heat transfer far from the reattachment point for the bubbly flow in the pipe with sudden expansion [12]. In the case of bubbly flow in the backwards-facing step we observe the same trends. The position of the heat transfer maximum is located after the reattachment point.

6. Conclusions

The PIV/PLIF measurements of mean streamwise flow structure and RANS numerical simulation of the bubbly polydispersed upward duct flow in a backward-facing step are performed. Measurements of the carrier fluid phase velocity are performed using the PIV/PLIF system. The numerical model is based on the Eulerian two-fluid approach. Turbulence of the carrier fluid phase is predicted using the Reynolds stress model.
Experimental study of the characteristics of the motion of gas bubbles behind a single side backward facing step with variations in the volumetric flow rates of carrier fluid and gas have been carried out. The distribution of the mean streamwise gas bubbles and liquid velocities are obtained. It is shown that the bubbles slow down at a distance from the flow detachment cross-section, and it is associated with the slowing down of the liquid velocity due to the increase in the duct cross-section. The bubbles have a more curvilinear trajectory in the separation zone than in the duct before the sudden expansion cross-section. It is shown that bubble clusters can form in the flow relaxation region.
Small bubbles are presented over the entire duct cross-section, and the larger bubbles mainly observed in the shear mixing layer and flow core. The recirculation length in two-phase bubbly flow is shorter (up to twice) than that one in the case single-phase flow. The position of the heat transfer maximum is located after the reattachment point. The effect of the gas volumetric flow rate ratios on the flow and heat transfer in the two-phase flow is numerically studied. The addition of air bubbles results in a significant increase in the heat transfer (up to 75%).

Author Contributions

Conceptualization, P.D.L. and M.A.P.; methodology, T.V.B., A.V.C., P.D.L. and M.A.P.; investigation, T.V.B., I.A.E., D.V.K., P.D.L. and M.A.P.; data curation, M.A.P.; formal analysis, P.D.L. and M.A.P.; writing—original draft preparation, P.D.L. and M.A.P.; writing—review and editing, P.D.L. and M.A.P.; resources, P.D.L. and M.A.P.; project administration, P.D.L. and M.A.P.; All authors have read and agreed to the published version of the manuscript.

Funding

The numerical part of the paper was funded by Ministry of Science and Higher Education of the Russian Federation (mega-grant 075-15-2021-575) and the measurements were performed under IT SB RAS state assignment (Project No. 121032200034-4).

Institutional Review Board Statement

Not applicable.

Informed Consent Statement

Not applicable.

Data Availability Statement

Data are contained within the article.

Conflicts of Interest

The authors declare no conflict of interest.

Nomenclature

C f = 2 τ W / U 1 2 wall friction coefficient
CPheat capacity
dmean bubble Sauter diameter
h1height of the duct before the sudden expansion
h2height of the duct after the sudden expansion
Hstep height
Jand Jb superficial velocity of carrier fluid (water) and gas bubbles respectively
2 k = u i u i turbulent kinetic energy
Lduct length
Nu = T / y W H / T W T m Nusslet number
ReH = Um1Hthe Reynolds number
St = h/(ρCpU m1)Stanton number
Ttemperature
Um1mean-mass flow velocity
U*friction velocity
xstreamwise coordinate
xRposition of the flow reattachment point
xNu_maxposition of the peak of heat transfer rate
ydistance normal from the wall
Subscripts
0single-phase fluid (water) flow
1initial condition
Wwall
bbubble
lliquid
mmean-mass
Greek
Φvolume fraction
αvoid fraction
βgas volumetric flow rate ratio
εdissipation of the turbulent kinetic energy
λthermal conductivity
ρdensity
νkinematic viscosity
τWwall shear stress
Acronym
BFSbackward-facing step
CVcontrol volume
DNSdirect numerical simulation
ERexpansion ratio
LESlarge eddy simulation
PIVparticle image velocimetry
PLIFplanar laser induced fluorescence
RANSReynolds-averaged Navier-Stokes
ROIregion of interests
SMCsecond moment closure
SSTshear stress tensor
TKEturbulent kinetic energy

References

  1. Nigmatulin, R.I. Dynamics of Multiphase Media; Hemisphere: New York, NY, USA, 1991; Volume 1. [Google Scholar]
  2. Ishii, M.; Hibiki, T. Thermo-Fluid Dynamics of Two-Phase Flow; Springer: Berlin/Heidelberg, Germany, 2011. [Google Scholar]
  3. Aloui, F.; Souhar, M. Experimental study of a two-phase bubbly flow in a flat duct symmetric sudden expansion. Part I: Visulization, pressure and void fraction. Int. J. Multiph. Flow 1996, 22, 651–665. [Google Scholar] [CrossRef]
  4. Schmidt, J.; Friedel, L. Two-phase pressure change across sudden expansions in duct areas. Chem. Eng. Commun. 1996, 141, 175–190. [Google Scholar] [CrossRef]
  5. Aloui, F.; Doubliez, L.; Legrand, J.; Souhar, M. Bubbly flow in an axisymmetric sudden expansion: Pressure drop, void fraction, wall shear stress, bubble velocities and sizes. Exp. Therm. Fluid Sci. 1999, 19, 118–130. [Google Scholar] [CrossRef]
  6. Ahmed, W.H.; Ching, C.Y.; Shoukri, M. Development of two-phase flow downstream of a horizontal sudden expansion. Int. J. Heat Fluid Flow 2008, 29, 194–206. [Google Scholar] [CrossRef]
  7. Balakhrisna, T.; Ghosh, S.; Das, G.; Das, P.K. Oil–water flows through sudden contraction and expansion in a horizontal pipe—phase distribution and pressure drop. Int. J. Multiph. Flow 2010, 36, 13–24. [Google Scholar] [CrossRef]
  8. Arabi, A.; Salhi, Y.; Si-Ahmed, E.K.; Legrand, J. Influence of a sudden expansion on slug flow characteristics in a horizontal two-phase flow: A pressure drop fluctuations analysis. Meccanica 2018, 53, 3321–3338. [Google Scholar] [CrossRef]
  9. Zhang, D.W.; Goharzadeh, A. Effect of sudden expansion on two-phase flow in a horizontal pipe fluid dynamics. Fluid Dyn. 2019, 54, 123–136. [Google Scholar] [CrossRef]
  10. Kim, Y.; Park, H. Upward bubbly flows in a square pipe with a sudden expansion: Bubble dispersion and reattachment length. Int. J. Multiph. Flow 2019, 118, 254–269. [Google Scholar] [CrossRef]
  11. Krepper, E.; Beyer, M.; Frank, T.; Lucas, D.; Prasser, H.-M. CFD modelling of polydispersed bubbly two-phase flow around an obstacle. Nucl. Eng. Des. 2009, 239, 2372–2381. [Google Scholar] [CrossRef]
  12. Pakhomov, M.A.; Terekhov, V.I. Modeling of the flow patterns and heat transfer in a turbulent bubbly polydispersed flow downstream of a sudden pipe expansion. Int. J. Heat Mass Transfer 2016, 101, 1251–1262. [Google Scholar] [CrossRef]
  13. Bogatko, T.V.; Pakhomov, M.A. Modeling bubble distribution and heat transfer in polydispersed gas-liquid flow in a backward-facing step. IOP J. Phys. Conf. Ser. 2020, 1677, 012052. [Google Scholar] [CrossRef]
  14. Menter, F.R. Two-equation eddy-viscosity turbulence models for engineering applications. AIAA J. 1994, 32, 1598–1605. [Google Scholar] [CrossRef] [Green Version]
  15. Krepper, E.; Lucas, D.; Frank, T.; Prasser, H.-M.; Zwart, P.J. The inhomogeneous MUSIG model for the simulation of polydispersed flows. Nucl. Eng. Des. 2008, 238, 1690–1702. [Google Scholar] [CrossRef]
  16. Lakehal, D.; Smith, B.L.; Milelli, M. Large-eddy simulation of bubbly turbulent shear flows. J. Turbul. 2002, 3, 1–21. [Google Scholar] [CrossRef] [Green Version]
  17. Dhotre, M.T.; Niceno, B.; Smith, B.L. Large eddy simulation of a bubble column using dynamic sub-grid scale model. Chem. Eng. J. 2008, 136, 337–348. [Google Scholar] [CrossRef]
  18. Long, S.; Yang, J.; Huang, X.; Li, G.; Shi, W.; Sommerfeld, M.; Yang, X. Large-eddy simulation of gas-liquid two-phase flow in a bubble column reactor using a modified sub-grid scale model with the consideration of bubble-eddy interaction. Int. J. Heat Mass Transfer 2020, 161, 120240. [Google Scholar] [CrossRef]
  19. Zaichik, L.I.; Mukin, R.V.; Mukina, L.S.; Strizhov, V.F. Development of a diffusion-inertia model for calculating bubble turbulent flows: Isothermal polydispersed flow in a vertical pipe. High Temp. 2012, 50, 621–630. [Google Scholar] [CrossRef]
  20. Mukin, R.V. Modeling of bubble coalescence and break-up in turbulent bubbly flow. Int. J. Multiphase Flow 2014, 62, 52–66. [Google Scholar] [CrossRef]
  21. Lehr, F.; Mewes, D. A transport equation for the interfacial area density applied to bubble columns. Chem. Eng. Sci. 2001, 56, 1159–1166. [Google Scholar] [CrossRef]
  22. Pour, M.; Nassab, S. Numerical investigation of forced laminar convection flow of nanofluids over a backward facing step under bleeding condition. J. Mech. 2012, 28, N7–N12. [Google Scholar] [CrossRef]
  23. Lobanov, P.D.; Pakhomov, M.A.; Terekhov, V.I. Experimental and numerical study of the flow and heat transfer in a bubbly turbulent flow in a pipe with sudden expansion. Energies 2019, 12, 2375. [Google Scholar] [CrossRef] [Green Version]
  24. Poletaev, I.; Tokarev, M.P.; Pervunin, K.S. Bubble patterns recognition using neural networks: Application to the analysis of a two -phase bubbly jet. Int. J. Multiph. Flow 2020, 126, 103194. [Google Scholar] [CrossRef]
  25. Cerqueira, R.F.L.; Paladino, E.E. Development of a deep learning-based image processing technique for bubble pattern recognition and shape reconstruction in dense bubbly flows. Chem. Eng. Sci. 2021, 230, 116163. [Google Scholar] [CrossRef]
  26. Drew, D.A. Mathematical modeling of two-phase flow. Ann. Rev. Fluid Mech. 1983, 15, 261–291. [Google Scholar] [CrossRef]
  27. Zaichik, L.I.; Alipchenkov, V.M. A statistical model for predicting the fluid displaced/added mass and displaced heat capacity effects on transport and heat transfer of arbitrary density particles in turbulent flows. Int. J. Heat Mass Transfer 2011, 54, 4247–4265. [Google Scholar] [CrossRef]
  28. Pakhomov, M.A.; Terekhov, V.I. Modeling of flow structure, bubble distribution, and heat transfer in polydispersed turbulent bubbly flow using the method of delta function approximation. J. Eng. Thermophys. 2019, 28, 453–471. [Google Scholar] [CrossRef]
  29. Drew, D.A.; Lahey, R.T., Jr. Application of general constitutive principles to the derivation of multidimensional two-phase flow equations. Int. J. Multiph. Flow 1979, 5, 243–264. [Google Scholar] [CrossRef]
  30. Fadai-Ghotbi, A.; Manceau, R.; Boree, J. Revisiting URANS computations of the backward-facing step flow using second moment closures. Influence of the numerics. Flow Turbul. Combust 2008, 81, 395–410. [Google Scholar] [CrossRef]
  31. Lopez de Bertodano, M.; Lee, S.J.; Lahey, R.T., Jr.; Drew, D.A. The prediction of two-phase turbulence and phase distribution using a Reynolds stress model. ASME J. Fluids Eng. 1990, 112, 107–113. [Google Scholar] [CrossRef]
  32. Nguyen, V.T.; Song, C.-H.; Bae, B.U.; Euh, D.J. Modeling of bubble coalescence and break-up considering turbulent suppression phenomena in bubbly two-phase flow. Int. J. Multiph. Flow 2013, 54, 31–42. [Google Scholar] [CrossRef]
  33. Hanjalic, K.; Jakirlic, S. Contribution towards the second-moment closure modelling of separating turbulent flows. Comput. Fluids 1998, 27, 137–156. [Google Scholar] [CrossRef]
  34. Available online: www.ansys.com.
  35. Nicoud, F.; Ducros, F. Subgrid-scale stress modelling based on the square of the velocity gradient tensor. Flow Turbul. Combust 1999, 62, 183–200. [Google Scholar] [CrossRef]
  36. Vogel, J.C.; Eaton, J.K. Combined heat transfer and fluid dynamics measurements downstream of a backward facing step. ASME J. Heat Transfer 1985, 107, 922–929. [Google Scholar] [CrossRef]
  37. Tihon, J.; Legrand, J.; Legentilhomme, P. Near-wall investigation of backward-facing step flows. Exp. Fluids 2001, 31, 484–493. [Google Scholar] [CrossRef]
  38. Hibiki, T.; Ishii, M.; Xiao, Z. Axial interfacial area transport of vertical bubbly flows. Int. J. Heat Mass Transfer 2001, 44, 1869–1888. [Google Scholar] [CrossRef]
  39. Bel Fdhila, R. Analyse Experimental et Modelisation d’un Ecoulement Vertical a Bulles dans un Elargissement Brusque. Ph.D. Thesis, Institut National Polytechnique de Toulouse, Toulouse, France, 1991. [Google Scholar]
  40. Papoulias, D.; Splawski, A.; Vikhanski, A.; Lo, S. Eulerian multiphase predictions of turbulent bubbly flow in a step-channel expansion. In Proceedings of the Nineth International Conference on Multiphase Flow ICMF-2016, Firenze, Italy, 22–27 May 2016. [Google Scholar]
  41. Eaton, J.K.; Johnston, J.P. Review of research on subsonic turbulent flow reattachment. AIAA J. 1981, 19, 1093–1100. [Google Scholar] [CrossRef]
  42. Chen, L.; Asai, K.; Nonomura, T.; Xi, G.N.; Liu, T.S. A review of backward-facing step (BFS) flow mechanisms, heat transfer and control. Thermal Sci. Eng. Progr. 2018, 6, 194–216. [Google Scholar] [CrossRef]
  43. Wang, H.G.; Zhang, C.G.; Xiong, H.B. Growth and collapse dynamics of a vapor bubble near or at a wall. Water 2021, 13, 12. [Google Scholar] [CrossRef]
  44. Kashinsky, O.N.; Chinak, A.V.; Kaipova, E.V. Bubbly gas-liquid flow in an inclined rectangular channel. Thermophys. Aeromech. 2003, 10, 69–75. [Google Scholar]
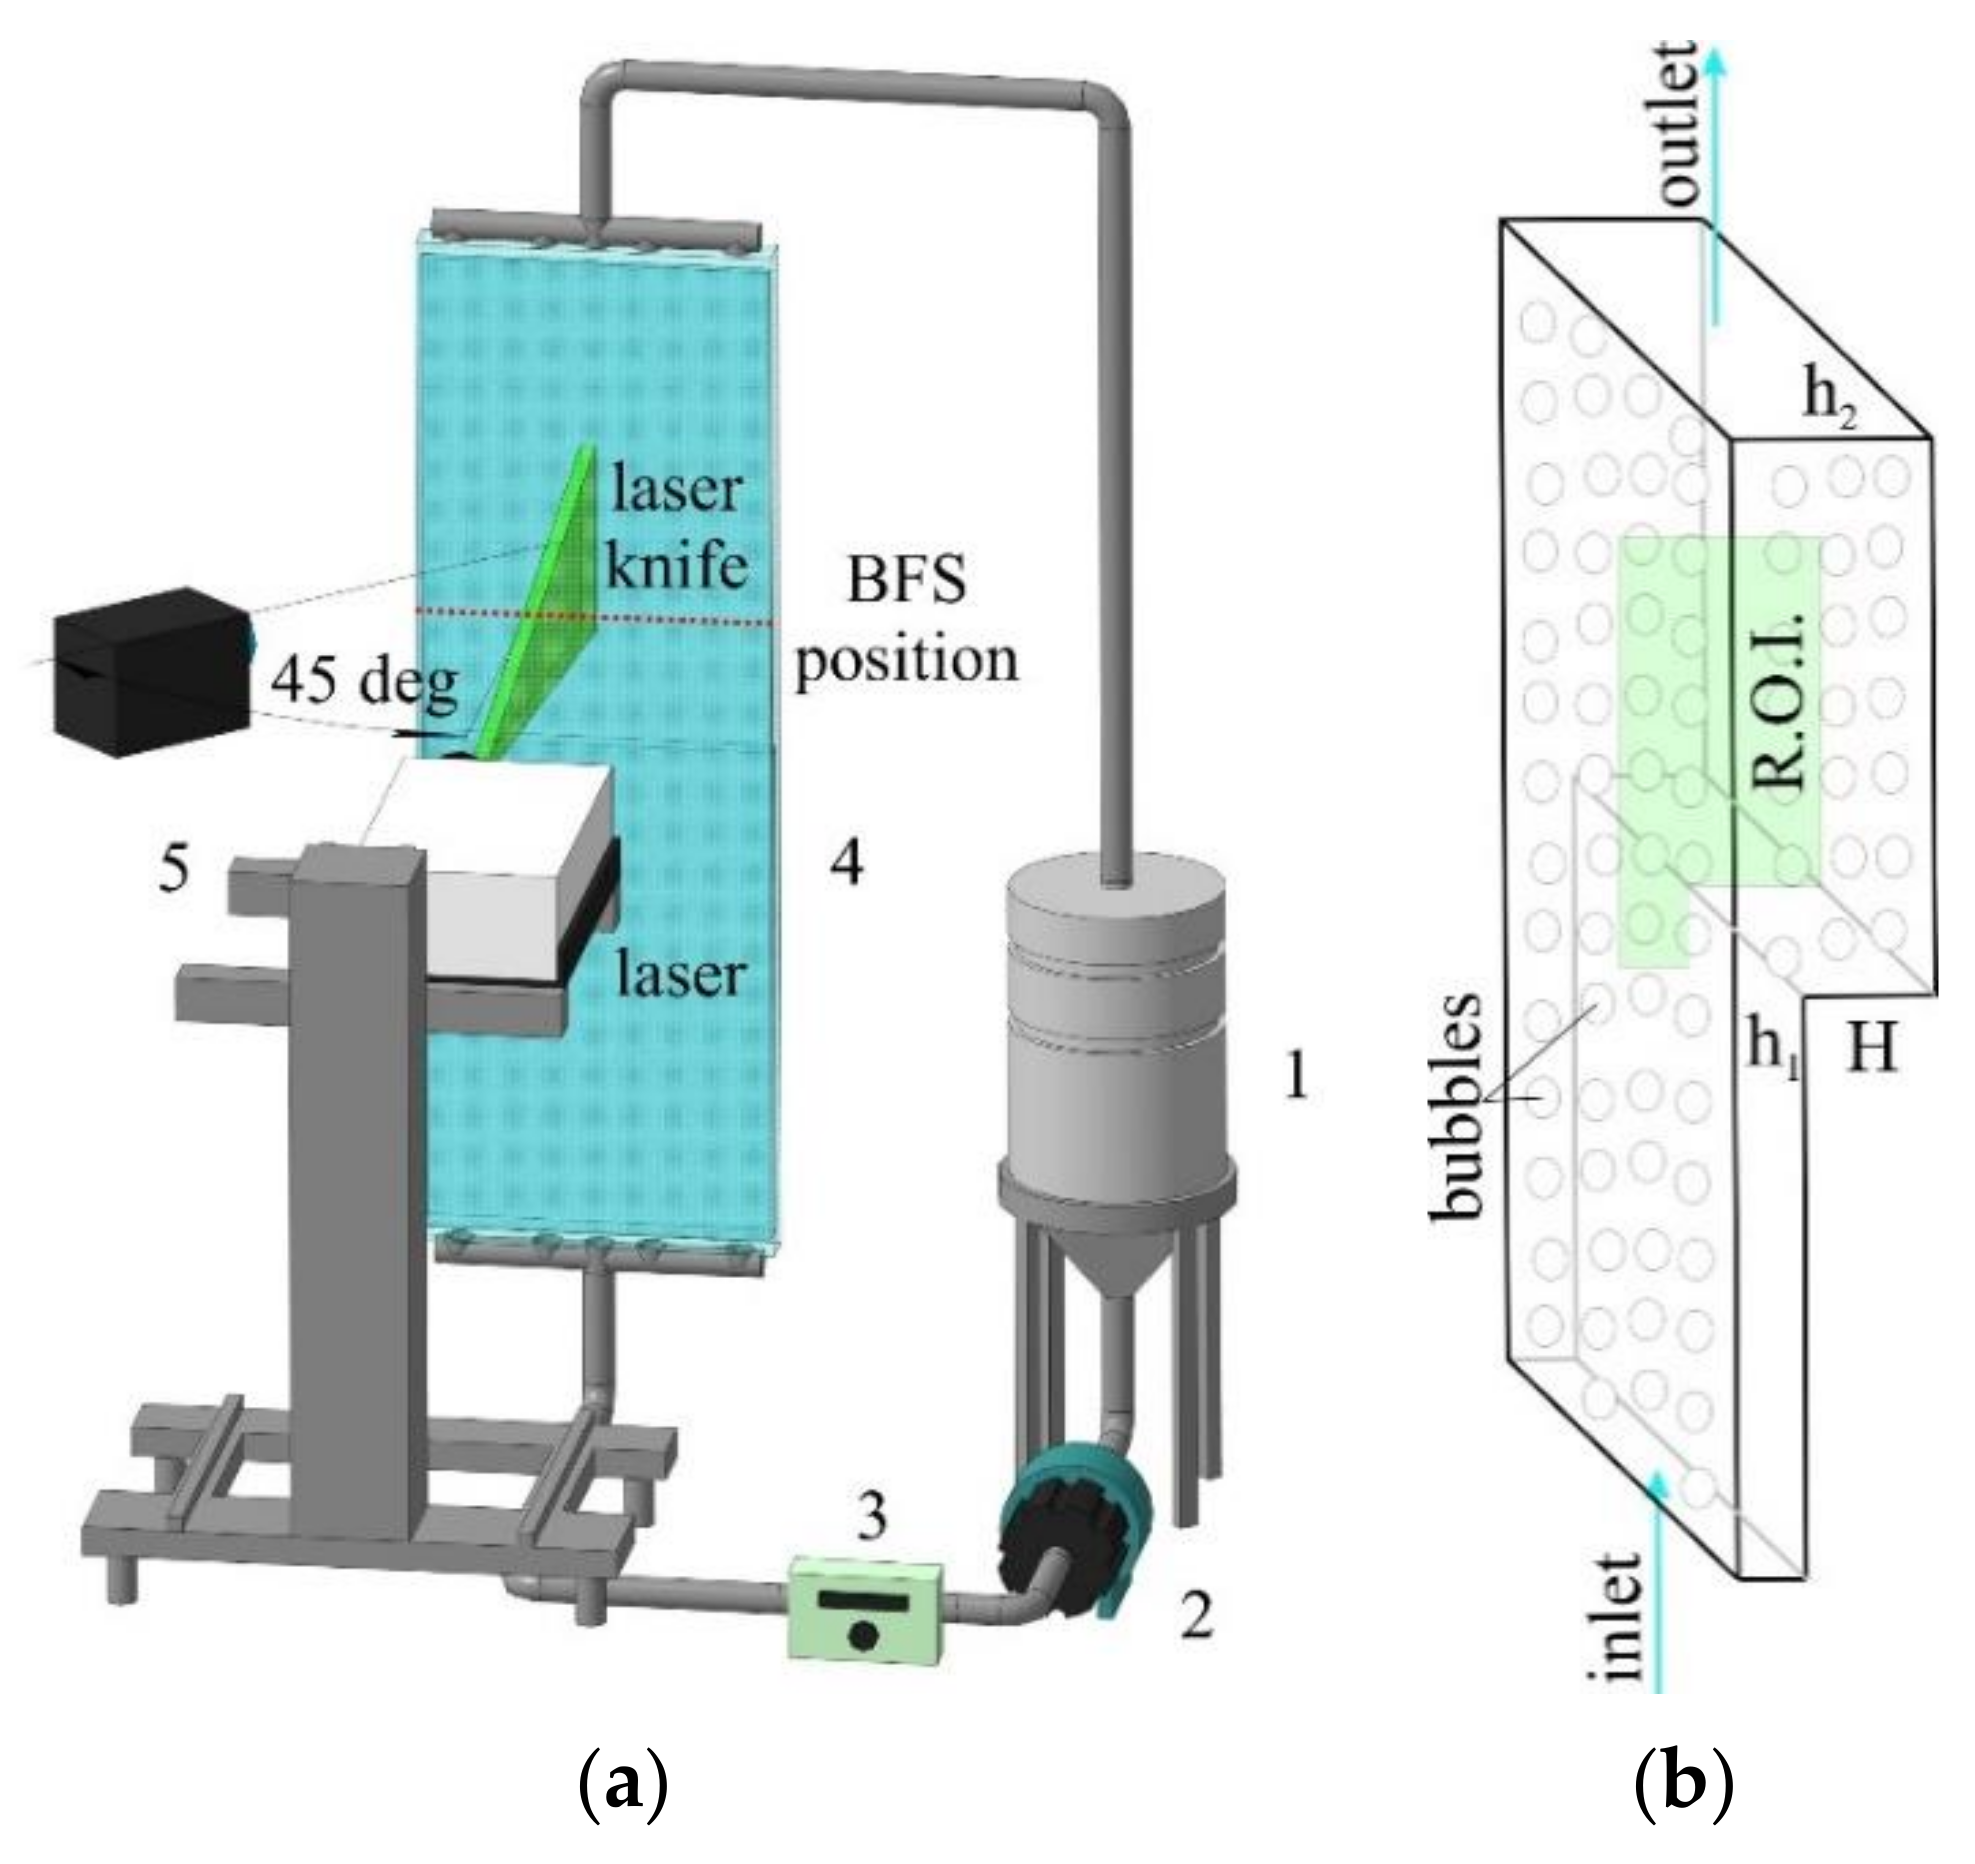
Figure 1. The scheme of the experimental setup (a): 1 is the water tank, 2 is the pump, 3 is the flowmeter, 4 is the test section, 5 is the PIV/PLIF system. (b) The scheme of a two-phase bubbly upward flow behind a backward-facing step.
Water 13 02318 g001
Figure 2. Single frames of the flow at Re = 6600 and β = 0.03: (a) “small” bubbles; (b) “medium” bubbles; (c) “large” bubbles; (d) “small” bubbles without Rhodamine in the test fluid.
Water 13 02318 g002
Figure 3. Grid convergence test of 2D RANS + SMC “in-house” code for the bubbly flow at TW = 313 K, T1 = Tb1 = 293 K, β = 5%, d1 = 3 mm (a), single-phase fluid flow 3D RANS+SST (b) and LES+WALE (c) in a duct with sudden expansion. ReH = 6600, ER = 2.5.
Water 13 02318 g003aWater 13 02318 g003b
Figure 4. Heat transfer coefficient distributions along the streamwise coordinate (a) and minimal wall friction values in the reverse zone vs. Reynolds number (b). (a): Symbols are the experiments of [36], line is our RANS + SMC “in-house” code simulations. (b): 1 is the semi-empirical correlation [37], 2 is our RANS+SMC “in-house” code simulations.
Water 13 02318 g004
Figure 5. Radial profiles of the carrier fluid and gas bubbles (a) and mean Sauter gas bubbles diameters (b). β = 4.6%, Re = Um12R/ν = 4.9 × 10⁴, x/(2R) = 53.5, 2R = 50.8 mm, Um1 = 0.986 m/s, d1 = 2.4 mm. Symbols are the measurements of [38], curves are the authors predictions. (a): 1, 2 are the carrier fluid axial velocities in the single-phase and two-phase bubbly flows respectively; 3 is the gas bubbles axial velocity. (b): 1—Jb = 0.0473 m/s, β = 4.6%, d1 = 2.4 mm; 2—0.113 m/s, 10.3%, 2.5 mm; 3—0.242 m/s, 19.7%, 2.8 mm.
Water 13 02318 g005
Figure 6. The transverse profiles of the carrier phase mean streamwise velocity along the duct length. Symbols and curves are the authors’ measurements and predictions respectively. ReH = 6600, ER = 2.5, β = 3%. 1—single-phase flow (β = 0), 2—β = 3%. (a)—x/H = 2, (b)—4, (c)—6, (d)—8, (e)—10.
Water 13 02318 g006aWater 13 02318 g006b
Figure 7. Velocity distribution on the channel centerline.
Water 13 02318 g007
Figure 8. The 3D RANS + SST predicted contours of the longitudinal velocity component and streamlines (a) and turbulent kinetic energy (b) at the z = 10, 50, 100, 190 mm (z/H = 0.8, 4.2, 8.3 and 15.8).
Water 13 02318 g008
Figure 9. The transverse profiles of single-phase mean longitudinal velocity behind a backward-facing step. Symbols and curves are the authors’ measurements and predictions, respectively. ReH = 6600, ER = 2.5.
Water 13 02318 g009
Figure 10. The transverse profiles of total local void fraction (a) and bubble diameter (b) along the duct length in the upward bubbly flow behind the backward-facing step. ReH = 6600, ER = 2.5, β = 3%. (a): 1—x/H = 0, 2—2, 3—4, 4—6, 5—10; (b): 1—x/H = 2, 2—4, 3—6, 4—10.
Water 13 02318 g010
Figure 11. The transverse profiles of local void fractions (a) and bubble diameter (b) for various bubble size modes. ReH = 6600, ER = 2.5, β = 3%, x/H = 4. (a): 1—d/d1 = 0–0.33, 2—0.33–0.66, 3—0.66–1, 4—>1, 5—sum of all modes; (b): 1—d = 0–0.33, 2—0.33–0.66, 3—0.66–1, 4—>1.
Water 13 02318 g011
Figure 12. Profiles of mean axial fluid velocity in bubbly flow in the backward-facing step. 1—β = 0 (single-phase fluid flow, other conditions being identical), 2—2%, 3—5%.
Water 13 02318 g012
Figure 13. The effect of the gas volumetric flow rate ratios (a) and gas bubbles diameter at the inlet (b) on the carrier fluid phase turbulence.
Water 13 02318 g013
Figure 14. Heat transfer in the bubbly flow behind the backward-facing step along the streamwise coordinate. (a): d1 = 3 mm, 1—Nusslet number value in the fully developed single-phase duct flow, 2—β = 0 (single-phase fluid flow, other conditions being identical), 3—2%, 4—5%; (b): β = 5%, 1—Nusslet number value in the fully developed single-phase duct flow, 2—d1 = 0 (single-phase fluid flow, other conditions being identical), 3—0.5 mm, 4—2 mm, 5—3 mm.
Water 13 02318 g014
Figure 15. The magnitudes of minimal wall friction coefficient (1), maximal heat transfer enhancement ratios (2), recirculation length (3), maximal values of turbulence modification ratios (4) and position of heat transfer maximum (5) depending on gas volumetric flow rate ratios β. ReH = 6600, ER = 2.5.
Water 13 02318 g015
Publisher’s Note: MDPI stays neutral with regard to jurisdictional claims in published maps and institutional affiliations.