Article

Source, Partition and Ecological Risk of Polycyclic Aromatic Hydrocarbons in Karst Underground River Environment, Southern China

1
School of Chemistry, Biology and Material Science, East China University of Technology, Nanchang 330013, China
2
Institute of Karst Geology, Chinese Academy of Geological Sciences, Guilin 541004, China
3
State Key Laboratory of Nuclear Resources and Environment, East China University of Technology, Nanchang 330013, China
*
Author to whom correspondence should be addressed.
Water 2021, 13(19), 2655; https://doi.org/10.3390/w13192655
Submission received: 23 July 2021 / Revised: 17 September 2021 / Accepted: 23 September 2021 / Published: 26 September 2021
(This article belongs to the Section Water Quality and Contamination)

Abstract

:
As the main source of drinking water in the karst areas of southern China, underground rivers play an important supporting role in local economic and social development. However, due to the special aquifer structure in the karst areas of southern China, polycyclic aromatic hydrocarbons (PAHs) can easily enter the water environment of underground rivers and cause serious pollution, which will affect the water quality safety. In this study, Qing-shui Spring underground river in Nanning city was selected as a representative of the typical underground river in southern China, and the pollution characteristics, source analysis, ecological risk assessment and diffusion law of PAHs were studied. The results showed that the total concentration of PAHs in groundwater and surface sediments was in the range of 282.42–464.88 ng/L and 400.14–1194.69 ng/g, respectively, and the overall concentrations of PAHs were below the moderate pollution level. Pollutant discharge and physical and chemical properties of PAHs caused the concentrations of PAHs to decrease gradually from upstream to downstream, but the proportion of high-cyclic PAHs increased gradually. According to the source analysis results of the ratio method, PAHs sources in groundwater were mainly biomass combustion sources in the upstream, oil sources in the middle and mixed sources in the downstream. Sediment and groundwater had some differences. The middle and upper reaches were the source of biomass combustion, while the middle and lower reaches were the mixed source. The ecological risk assessment results showed that the ecological risk of groundwater was at a moderate level, while the ecological risk of sediment was at a low level. Benzo[a]anthracene (BaA) and benzo[b]fluoranthene (BbF) in groundwater and acenaphthylene (Acy) and fluoranthene (Flu) in sediment should be monitored intensively. Appropriate control measures should be put in place to prevent further pollution. Partition coefficients varied from 0.73 to 3.85 L/g in the sediment–water interface, increasing with the rise of PAH compounds. All of the organic carbon partition coefficients (Koc) in the sediment–water interface were higher than predicate values based on the typical model of equilibrium distribution; this indicated that PAHs were strongly adsorbed in the sediment. The linear free energy relationship coefficient between the Koc value and the n-octanol-water partition coefficient (Kow) was 0.85 but the slope was lower than 1, indicating that sediment in the Qing-shui Spring underground river had weak lipophilic characteristics and adsorption ability for PAHs. The results can provide a reference for the risk assessment and pollution control of PAHs in the karst underground rivers in South China.

1. Introduction

Polycyclic aromatic hydrocarbons (PAHs), as typical highly toxic organic pollutants, belong to the type of persistent organic pollutants, and are ubiquitous in water environments [1]. Because of its carcinogenicity, teratogenicity and mutagenicity, etc., and its long-term accumulation and transmission in the water environment, it can cause serious harm to the ecological environment and human health, and has been listed as a blacklist of water pollutants by various countries [2]. The US Environmental Protection Agency (US EPA) gives priority to 16 kinds of PAHs with stronger toxicity [3], which generally enter the water environment through atmospheric dry–wet deposition and surface runoff.
Because water can directly affect human health through oral intake, skin contact and respiratory inhalation, domestic and foreign research institutions and related scholars have focused on PAHs’ pollution of the water environment. At present, domestic and foreign scholars have carried out a lot of research work on PAHs’ pollution of water environments, mostly focusing on surface rivers [4,5], urban runoff [6], lakes [7], estuaries [8], bays [9] and other areas. For example, Guo et al. [10] analyzed the concentration characteristics, sources and potential ecological risk assessment of 16 PAHs by collecting water samples from the main stream and tributaries of the Songhua River Basin, Northeast China, and studied the factors influencing concentration changes and ecological risks. Mahler et al. [11] investigated how concentrations and assemblages of PAHs and azaarenes in the runoff from a pavement newly sealed with coal-tar-based (CT) or asphalt-based (AS) sealcoat changed over time. The results demonstrate that runoff from a CT-sealcoated pavement, in particular, continues to contain elevated concentrations of PAHs long after a 24 h curing time. Yuan et al. [12] measured and evaluated, chronologically, the PAH and oxygen consumption potential (OCP) concentrations in sediment cores collected from Yangzonghai Lake, and analyzed the variation rules of PAH and OCP concentrations and pollution sources in different time periods. Yu et al. [13] used matrix factorization models to analyze the sources of sedimentary PAHs in the Yangtze River Estuary, and identified the distribution and proportion of each source. The above research objects are all water environments in a non-karst area, but the groundwater environment in a karst area is very different from that in a non-karst area, and its groundwater has strong heterogeneity and anisotropy. Therefore, the study of PAHs in a karst groundwater environment can better identify the pollution characteristics of PAHs in karst groundwater.
As a special water environment medium, underground rivers are the main drinking water source in the karst area of southern China, which supports social and economic development. Because the surface soil layer in a karst area is thin and there is a dual structure of surface and underground, pollutants can easily enter the underground river and cause serious pollution. After PAHs enter an underground river through the groundwater tunnel along with the surface runoff, because the underground river develops deep underground, its internal space is relatively closed and dark, and it is difficult for PAHs to undergo light degradation reaction, which makes PAHs accumulate continuously in the underground river water environment, resulting in ecological risks. There are a few studies on PAHs in the underground river water environment. For example, Lu et al. [14] took sediments from typical karst underground rivers in Nanning city as the research object, analyzed the pollution characteristics of PAHs and the pollution sources. Lan et al. [15] continuously collected water samples in an outlet of the Laolongdong underground river and determined the concentration and composition of PAHs in the dissolved phase and quantified the ecological risk of dissolved PAHs during rainfall events. The research objects in the above work are only single environmental media such as groundwater or sediment, which cannot reflect the pollution characteristics of PAHs in the whole water environment. Moreover, the rules between the partition and transformation of groundwater and sediment in the underground river system has not been thoroughly studied. Therefore, this study took the Qing-shui Spring underground river in Nanning City as the research object and analyzed the PAHs’ distribution, partition and ecological risk in the surface sediments and groundwater of the underground river, which can reflect the overall evolution trend of PAHs in an underground water environment, and would provide scientific basis for environmental protection and prevention, and the control of persistent pollutants of karst underground rivers in southern China.

2. Materials and Methods

2.1. Study Area

Qing-shui Spring underground river is located in the northwest of the Yong-Ning District of Nanning, covering most of Pu-miao town and the north of Xin-jiang town, with an area of about 55.3 km2 (Figure 1). The regional topography is generally high in the east and low in the west, with peak cluster depression landform as the main feature, elevation difference of about 60~180 m, geographical coordinates of 108°25′40″~108°36″28″ E and 22°40′10″~22° 47′13″ N. It belongs to subtropical humid climate, with annual average temperature of 21.7 °C and annual average rainfall of 1304.2 mm.
The main recharge source of groundwater in the study area is atmospheric rainfall recharge, and the recharge mode is plane infiltration recharge. Groundwater flows from east to west, and the main mode of groundwater runoff is pipeline water runoff. Groundwater is finally discharged in Qing-shui Spring Village in the form of underground river outlet (S15), and then flows into Bachi River. Groundwater depth ranges from 15–30 m. The underground river flow ranges from 0.9–3.2 m3/s, with the maximum flow in June and the minimum flow in January, which is closely related to rainfall. There are two underground river pipelines in the area, one is the main pipeline with a length of about 6.6 km (east–west trend), and the other is the branch pipeline with a length of about 1.9 km (northeast–southwest trend). The branch pipeline merges into the main pipeline at the skylight (S11) of Ganhuai Village. The underground river has become one of the main drinking water sources in Nanning, with an annual water supply capacity of 0.19 million cubic meters, mainly covering parts of Yong-Ning District and Liang-qing District, providing living water for about 270,000 people. The main pollution sources of PAHs in the basin include cement plants, paper mills, quarries and gas stations, etc.

2.2. Sample Collection

In January 2018, groundwater and surface sediments were collected in the direction of groundwater flow, and the collection points were S01 to S15 from upstream to downstream. According to the previous research results in the research area, the concentrations of PAHs in Qing-shui Spring underground river were relatively stable with the seasonal change. The minimum flow of the underground river occurs in January every year, so sampling at this time can reflect the most serious pollution situation of the study area and has a good representation. Groundwater samples were collected with 1 L brown glass bottles without bubbles, and were refrigerated and stored at 4 °C for subsequent treatment. The surface sediments at depths of 0 to 10 cm were collected by the sediment sampler, and the sediment samples were stored in aluminum containers and sent to the laboratory where they were freeze-dried, screened (100 mesh), and then frozen at minus 20 °C.

2.3. Sample Pretreatment and PAHs Analysis

Major chemical reagents: HPLC-grade dichloromethane, positive hexane, acetone were purchased from Fisher Scientific, Waltham, MA, USA; 16 PAHs mixed bid were purchased from Sigma-Aldrich, St. Louis, MO, USA, and five recovery rates were purchased from Supelco, USA: Indicators (Naphthalene-d8, Acenaphthylene-d10, Phenanthrene-d10, Phenanthrene-d12, Perylene-d12) and an internal object (Hexamethylbenzene).
Groundwater samples were pretreated using EPA 525.2 method. The water sample was filtered by a 0.45 μm filter membrane and added with recovery indicator. The extracted liquid was extracted three times by dichloromethane. The extracted liquid was separated and purified by a chromatography column composed of silica gel and alumina with a volume ratio of 2:1. Then the mixture consisting of n-hexane and dichloromethane was used for elution and concentrated nitrogen blowing. The volume ratio of n-hexane and dichloromethane in the mixture was 3:2. Finally, the internal standard was put into the mixture to be measured at a constant volume of 0.2 mL. Surface sediment samples were pretreated using EPA 3545 method. In total, 5 g surface sediment samples were evenly mixed with 5 g anhydrous sodium sulfate and then extracted in the extraction tank. The extraction agent was a solvent composed of dichloroethane and acetone with a volume ratio of 1:1. The extraction temperature was set at 100 °C, the extraction pressure was 1.03 × 10⁷ Pa, the static extraction time was 5 min × 3 times, and the extraction liquid was concentrated and blown with nitrogen. Then, the internal standard substance was added to a volume of 0.2 ml to be measured.
The concentrations of 16 kinds of PAHs in groundwater and surface sediments were analyzed by gas chromatography–mass spectrometry (Agilent, Santa Clara, CA, USA, 7890AGC/5975CMS); the 16 kinds of PAHs were naphthalene, acenaphthylene, acenaphthene, fluorene, phenanthrene, anthracene, fluoranthene, pyrene, benzo[a]anthracene, chrysene, benzo[b]fluoranthene, benzo[k]fluoranthene, benzo[a]pyrene, indeno[1,2,3-cd]pyrene, dibenzo[a,h]anthracene and benzo[ghi]perylene. Test analysis conditions for GC-MS: the column was HP-5MS column (30.00 m × 0.25 mm × 0.25 μm); the temperature of the inflow was 270 °C; the carrier gas was helium (purity 99.99%); the flow rate was 1 mL/min without shunt injection; the ion source was EI source. The programmed heating conditions were as follows: the initial temperature was 80 °C for 2 min, the temperature was raised to 180 °C at 3 °C/min for 1 min, and then the temperature was increased to 290 °C at 5 °C/min for 10 min. The PAHs were quantitatively analyzed by using the internal calibration method and the multi-point correction curve.

2.4. Quality Control and Quality Assurance

The method blank, blank standard, matrix standard and parallel sample were set up for quality control and assurance while the samples of groundwater and surface sediments were treated and determined. The recoveries of recovery indicators ranged from 81.5% to 101.2%. The target compounds were not detected in the blank samples of the method, and the relative standard deviations of parallel samples were all less than 10%. The detection limits of the method for groundwater and sediments were determined by using a 3 times signal-to-noise ratio (SNR). The range was 0.22–1.50 ng/L and 0.28–3.15 ng/g, respectively.

2.5. Data Processing

The test data processing, statistics and related graphics were based on SPSS18.0, Excel 2016, Origin 7.5 and other software.

2.6. Method for Source Analysis of PAHs

At present, many scholars at home and abroad usually use the isomer ratio method for PAHs source analysis [16,17]. The isomer ratios include Ant/(Ant + Phe), FlA/Pyr and BaA/(BaA + Chr), etc. Due to the poor stability and easy decomposition of low-molecular weight monomer PAHs (such as Ant, Phe, etc.), the isomer ratios would generate errors, which would affect the identification of the source. Therefore, the study used the ratios of FlaA/(FlA + Pyr) and BaA/(BaA + Chr) to determine the sources of PAHs in underground rivers and sediments, as shown in Table 1.

2.7. Calculation of Distribution Coefficient

The partition coefficient KP is defined as the concentration of PAHs in particulate matter or sediment (cs) relative to the concentration of PAHs in dissolved phase (cw), that is
Kp = cs/cw
It can be obtained through laboratory experiments, but it cannot truly reflect the field environment. Adsorption experiments in laboratory and field showed that organic matter was beneficial to the adsorption of PAHs in sediments or particulate matter [18,19]. Theoretically, it is assumed that the adsorption of PAH compounds is only affected by organic carbon so it can be expressed in the form of normalized organic carbon.
Koc = Kp/foc
In the formula, foc is the percentage (%) of organic carbon of particulate matter or sediment, and Koc can either be field tested or calculated by the n-octanol-water partition coefficient (Kow) of organic compounds using the linear free energy equation relationship. There is a good correlation between Koc and the n-octanol-water partition coefficient Kow, so the linear free energy relationship can be established as follows
lgKoc = a · lgKow + b

2.8. Methods for Ecological Risk Assessment of PAHs

The ecological risk assessment of groundwater in the study area was carried out using the risk quotation method (RISK QUOTIENT) proposed by Kalf [20] and Cao [21], calculated as follows
RQ = CPAHs/CQV
RQNCs = CPAHs/CQV(NCs)
RQ = CPAHs/CQV
In the formula, RQ is the risk provider value, CPAHs is the concentration of monomer PAHs, CQV is the standard risk value of monomer PAHs, RQNCs is the lowest risk quotient value, CQV(NCs) is the lowest risk standard value, RQMPCs is the highest risk quotient value and CQV(MPCs) is the highest risk standard value. When RQNCs < 1.0, it indicates that a monomer PAHs is of low risk. When RQMPCs > 1.0, it indicates high risk. When RQNCs > 1.0 and RQMPCs < 1.0, it is shown as medium risk.
The low value of effect interval (ERL) and median value of effect interval (ERM) method proposed by Long [22] has been a relatively popular method for ecological risk assessment of sediments in the world.
When the concentration of PAHs is less than ERL value, the probability of PAHs producing ecological toxicity is less than 10%, and less negative ecological effects are generated. When the concentration of PAHs is greater than ERM value, the probability of ecological toxicity of PAHs is greater than 50%, often causing negative ecological effect. When PAHs concentration is greater than ERL value and less than ERM value, the probability of ecological toxicity is between 10–50%, with occasional negative ecological effects.

3. Results and Discussions

3.1. Contamination Characteristics of PAHs in Groundwater and Sediments

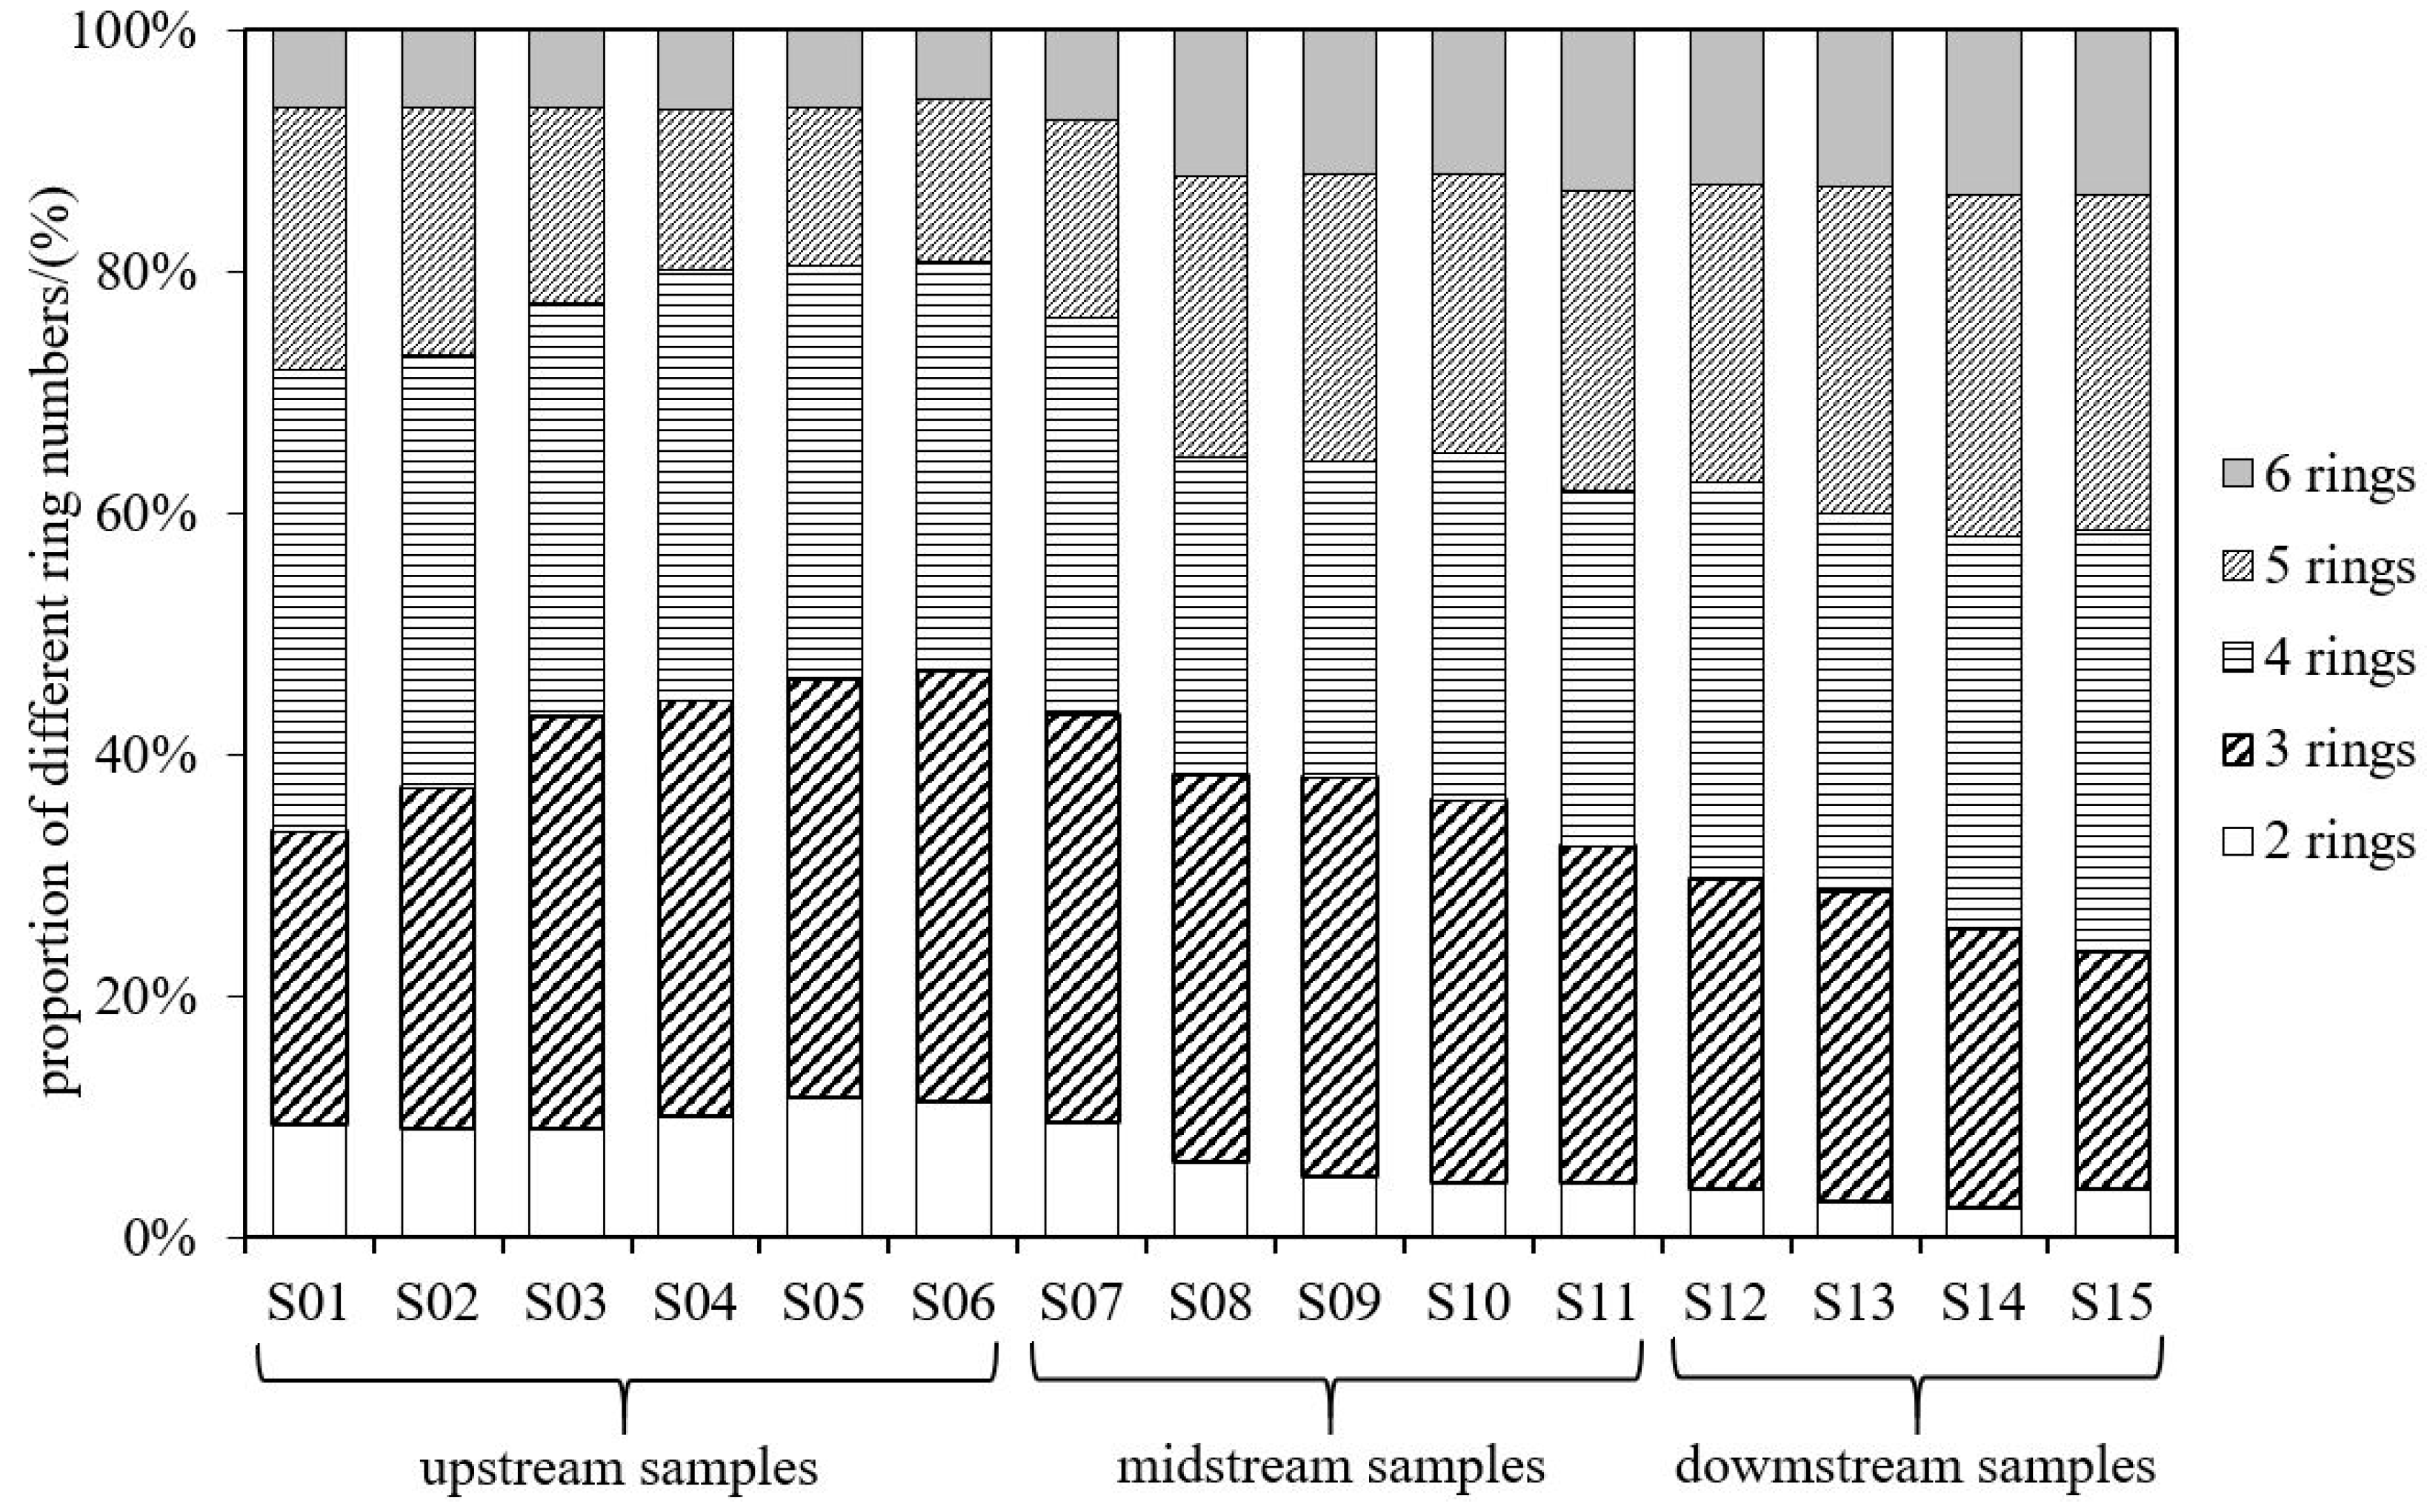
3.1.1. Residue Levels and Composition Characteristics

Test results of concentrations of PAHs in groundwater and sediments at each sampling point are shown in Table 2. All 16 kinds of PAHs were detected in groundwater with a detection rate of 100%. The concentrations of ∑16PAHs ranged from 279.62–464.88 ng/L, with an average value of 346.05 ng/L. According to the different number of ring PAHs to distinguish, the order of concentration of PAHs in groundwater with different ring numbers was as follows: 2–3 ring > 4 ring > 5–6 ring. Overall, the main PAHs in the aqueous phase were 2–3 ring PAHs, accounting for 38.31%. The detection rate of 16 kinds of PAHs in sediments was 100%, and the concentrations of ∑16PAHs varied from 405.78–1194.69 ng/g, with an average of 699.53 ng/g. Compared with groundwater, the order of concentrations of PAHs in sediments with different ring numbers was significantly different, which was 5–6 ring > 4 ring > 2–3 ring, and the sedimentary facies were mainly 5–6 ring PAHs.
The concentrations of PAHs in the water environment in the study area were compared with those in water facies and sedimentary facies in other areas, and the results are given in Table 3 and Table 4.
As shown in Table 3, except for the 5–6 ring PAHs of groundwater in the suburbs of Xi’an, the PAHs in the rest of the water bodies were mainly 2–4 ring, which was the same as the groundwater body in the study area. In terms of concentration, the concentrations of PAHs in the underground water in the study area were lower than those in the Guozhuang karst spring [23], the Huaian drinking water source [24], the epikarst spring in Nanchuan [25] and Laolongdong underground river in Chongqing [26]; similar to those in groundwater on the outskirts of Xi’an [27], Qingmuguan underground river [28], groundwater in the Liuzhou industrial zone [29]; higher than those in the groundwater in the Huang liang area [30], deep shallow pore water of the Hutuo River Pluvial Fan [31] and groundwater in the upper region of the Sihu Lake Basin from Jianghan Plain [32]. In conclusion, the pollution level of PAHs in the underground water in the study area was at a medium or low level.
Table 4 shows that the main ring number of sediments in the Moshui River, the Three Gorges Reservoir Area (Chongqing section), the Beijiang River and the Bailang underground river in Dashiwei were the same as that in the study area, and the main ring number of sediments in the other areas was a low–middle ring. In terms of concentrations, the concentrations of PAHs in the sediments in the study area were lower than those in the surface sediments of Fenhe River [33], Moshui River [34], Hun River [35] and Songhua River [36], similar to those in the Three Gorges Reservoir area (Chongqing section) [37], and much higher than those in the sediments of the Beijiang River [38], Sanya River [39], Yangtze River (Wuhan section) [40], Laolongdong underground river [41] and Bailang underground river of Dashiwei [42]. In conclusion, the level of PAHs’ pollution in sediments in the study area was at a moderate level.

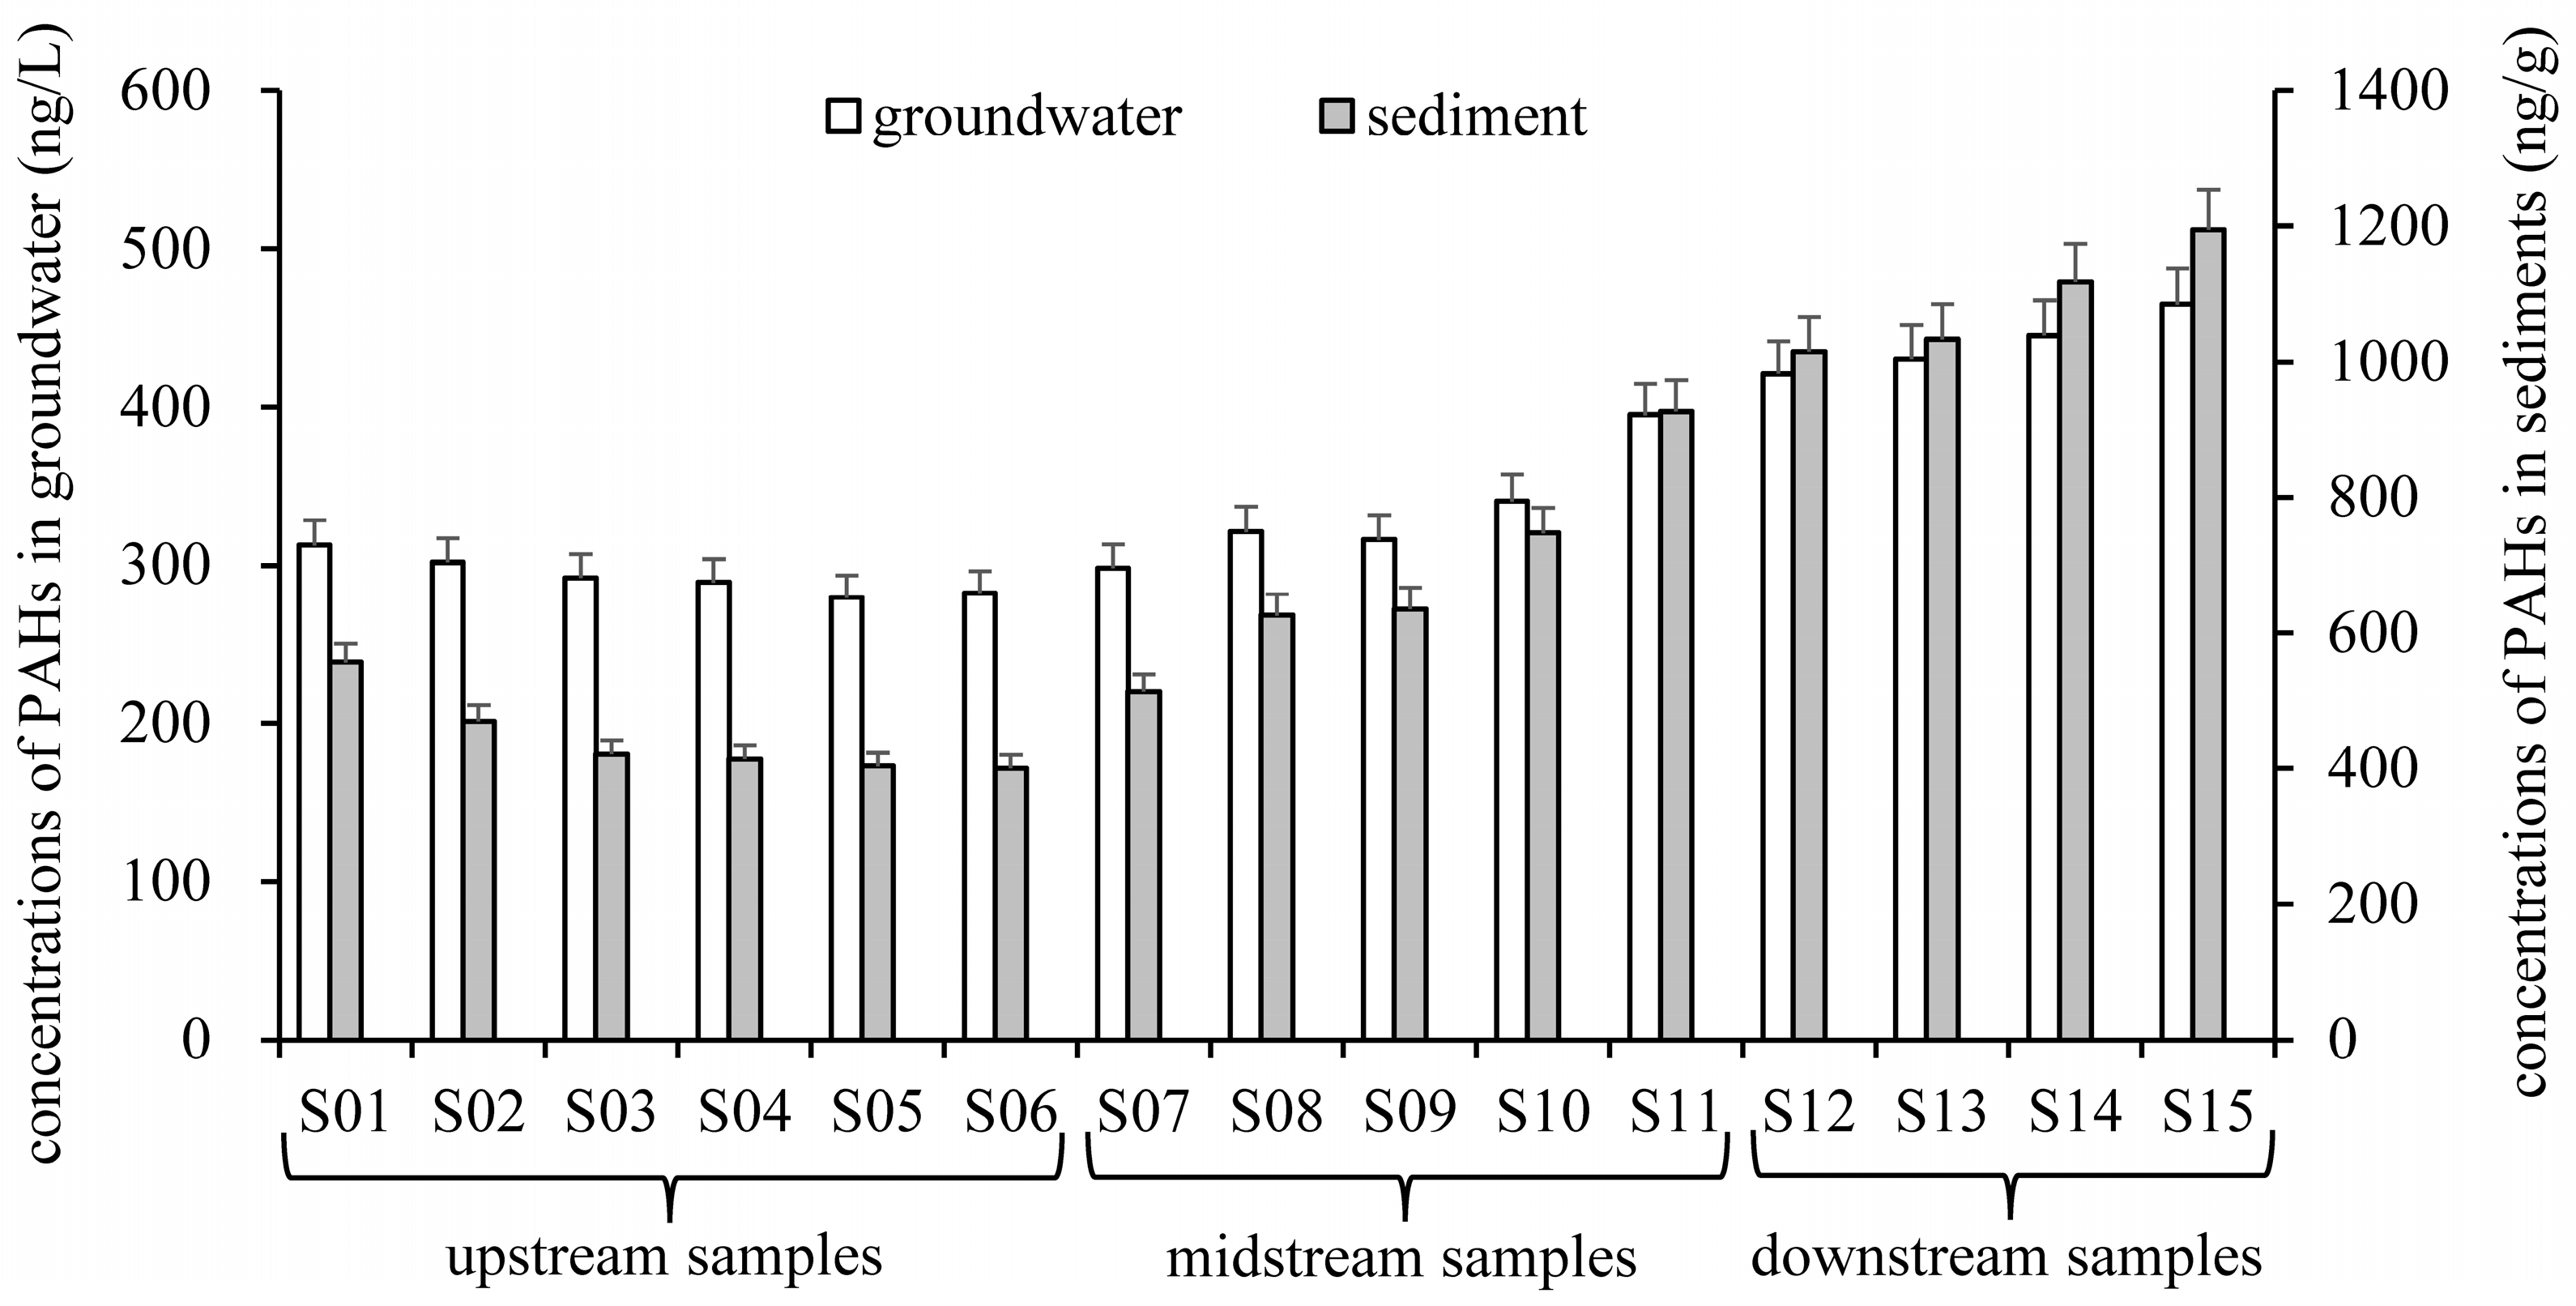
3.1.2. Concentration and Distribution Characteristics of PAHs

The study area was divided into upstream (S01–S06), midstream (S07–S11) and downstream (S12–S15) by region. As seen in Figure 2, the concentrations of PAHs in the water environment of the Qing-shui Spring underground river system was obviously different from the upstream to the downstream, in which the average concentration of PAHs in the upstream, midstream and downstream of groundwater was 292.98 ng/L, 334.22 ng/L and 440.44 ng/L respectively, while the average concentration of PAHs of sediments in the upstream, midstream and downstream was 444.25 ng/g, 689.77 ng/g and 1090.67 ng/g, respectively. In brief, the concentration in the upstream region < the concentration in the midstream region < the concentration in the downstream region. The main reason was that from the upstream to the downstream, the industrial, agricultural and domestic pollution sources gradually increased, and the pollutant discharge gradually increased, making PAHs’ pollutants flow into the underground river system and continue to accumulate.
As shown in Figure 2, Figure 3 and Figure 4, the variation characteristics of concentrations and compositions of PAHs in each region were different. In the upstream of the Qing-shui Spring underground river, the concentration of PAHs in the groundwater and sediments decreased gradually by 10.33% and 26.09%, respectively, but the proportions of 2–3 ring PAHs increased rapidly, in groundwater by 9.04% and sediments by 13.05%.
The main reason for this phenomenon was that the upstream area was far away from the city, which bears fewer pollution sources, and the underground river system itself had a certain purification ability, which reduced the concentrations of PAHs. At the same time, due to the physical and chemical properties of PAHs themselves (the 2–3 ring PAHs are hydrophilic and easily adsorbed by an aqueous medium, but the 4–6 ring PAHs are lipophilic and easily adsorbed by solid phase media), the migration modes of 2–3 ring PAHs and 4–6 ring PAHs were different, which were long-distance water phase migration and close-distance solid phase migration, respectively. Therefore, the ratio of 2–3 ring PAHs increased while that of 4–6 ring PAHs decreased.
The concentrations of PAHs in groundwater and sediments in the midstream and downstream increased by 53.71% and 130.35%, respectively, but the proportions of 2–3 rings decreased rapidly. The proportions of 2–3 ring PAHs in groundwater and sediments decreased 19.55% and 19.28%, respectively. It should be noted that the variation range of concentrations of PAHs and 2–3 ring PAHs ratio was the largest at the S11 sampling point. There were two reasons for the rapid increase in concentrations of PAHs. On the one hand, from midstream to downstream, the pollution sources in this region increased sharply, including paper mills and gas stations in the midstream and quarries, paper mills and cement plants in the downstream. Many pollution sources increased PAHs emissions. On the other hand, the underground river system has strong light protection and closure, and weak photolysis ability, which leads to the difficult decomposition of PAHs after aggregation. The decrease in the proportions of 2–3 ring PAHs was mainly due to the increase in pollution sources, which may emit high-ring PAHs pollutants, resulting in the decrease in the proportions of 2–3 ring PAHs in the midstream and downstream areas, but the increase in the proportion of 4–6 ring PAHs. According to the distribution characteristics of the underground river pipelines in the study area, the sampling point of S11 is the intersection of the main pipeline and the branch pipeline of the underground river. Therefore, PAH pollutants from the two pipelines were collected at S11, which led to the largest variation range of concentrations of PAHs and the different ring number ratio in the study area.

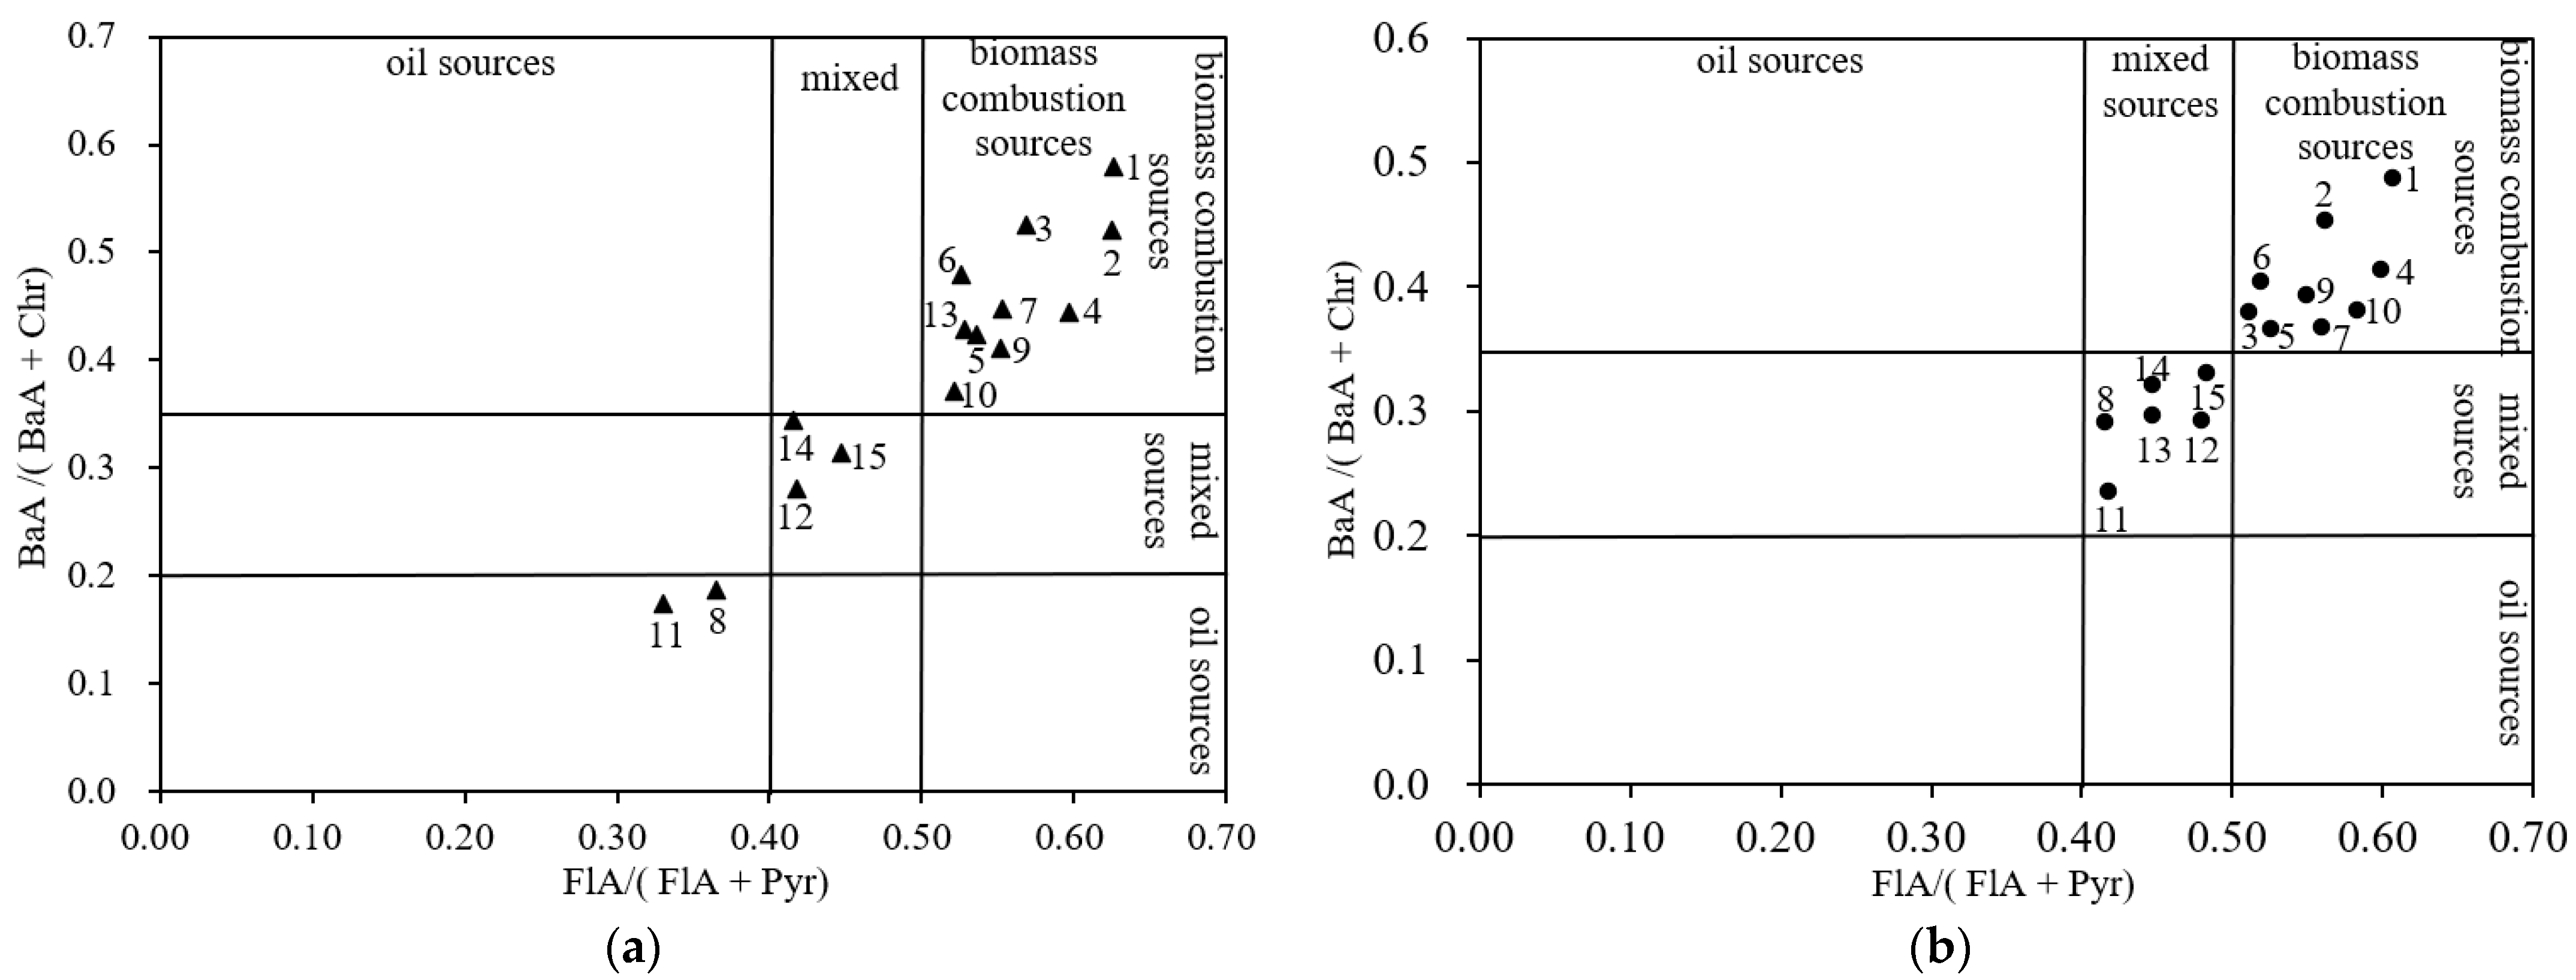
3.2. Source Analysis of PAHs in Groundwater and Sediments

To determine the specific source of PAHs in the environmental system is the premise and basis for environmental pollution prevention and control, and it is also of great significance for future environmental planning. The sources of PAHs generally include two types. The first type is natural, mainly produced in the biosynthesis process of terrestrial and aquatic plants and microorganisms. The second type is man-made, mainly produced in the incomplete combustion of fossil fuels, vegetation fuels or oil spills.
The source analysis results of PAHs in the groundwater and sediments in the study area are shown in Figure 5. As shown in Figure 5a, the sources of PAHs in the groundwater were obviously divided into three types, namely, biomass combustion sources in the upstream region, petroleum sources in the midstream region and mixed sources in the downstream region. The upstream region was far away from cities, with a large rural population, backward energy consumption structure and large consumption of wood, coal and other biomass fuels, leading to more biomass combustion sources of PAHs in the upstream region. The source of PAHs was petroleum in the midstream because of the leakage from gas stations. The downstream area was located in the suburbs of the city, and there were both combustion sources such as paper mills and quarries, as well as input sources of oil leaks in the midstream area, so it was characterized as a mixed source.
As shown in Figure 5b, the sources of PAHs in sediments were different from those in groundwater. The main sources of PAHs in sediments were biomass combustion sources and mixed sources, among which, biomass combustion sources were mostly in the middle and upper reaches of the sediments, and mixed sources were mostly in the middle and lower reaches of the sediments.
The main reason for the difference of PAHs in groundwater and sediments was the physical and chemical properties of PAHs themselves. Fla, Pyr, BaA and Chr belong to middle ring PAHs, which are hydrophobic and lipophilic on the whole. They were easy to accumulate continuously in sediments and are insoluble in water. As a result, the source analysis results of PAHs in the water generally only represented the status of pollution sources in the near distance, while the source analysis results of PAHs in the sediments more accurately showed the pollution sources of PAHs. Here, sampling points S08 and S11 are taken as examples. These two sampling points were located in the midstream of the underground river system. In addition to the pollution sources of oil leakage from the nearby gas stations, they were obviously affected by the influence of paper mills, quarries and upstream fossil fuel combustion, so they were more appropriate to be characterized as mixed sources.

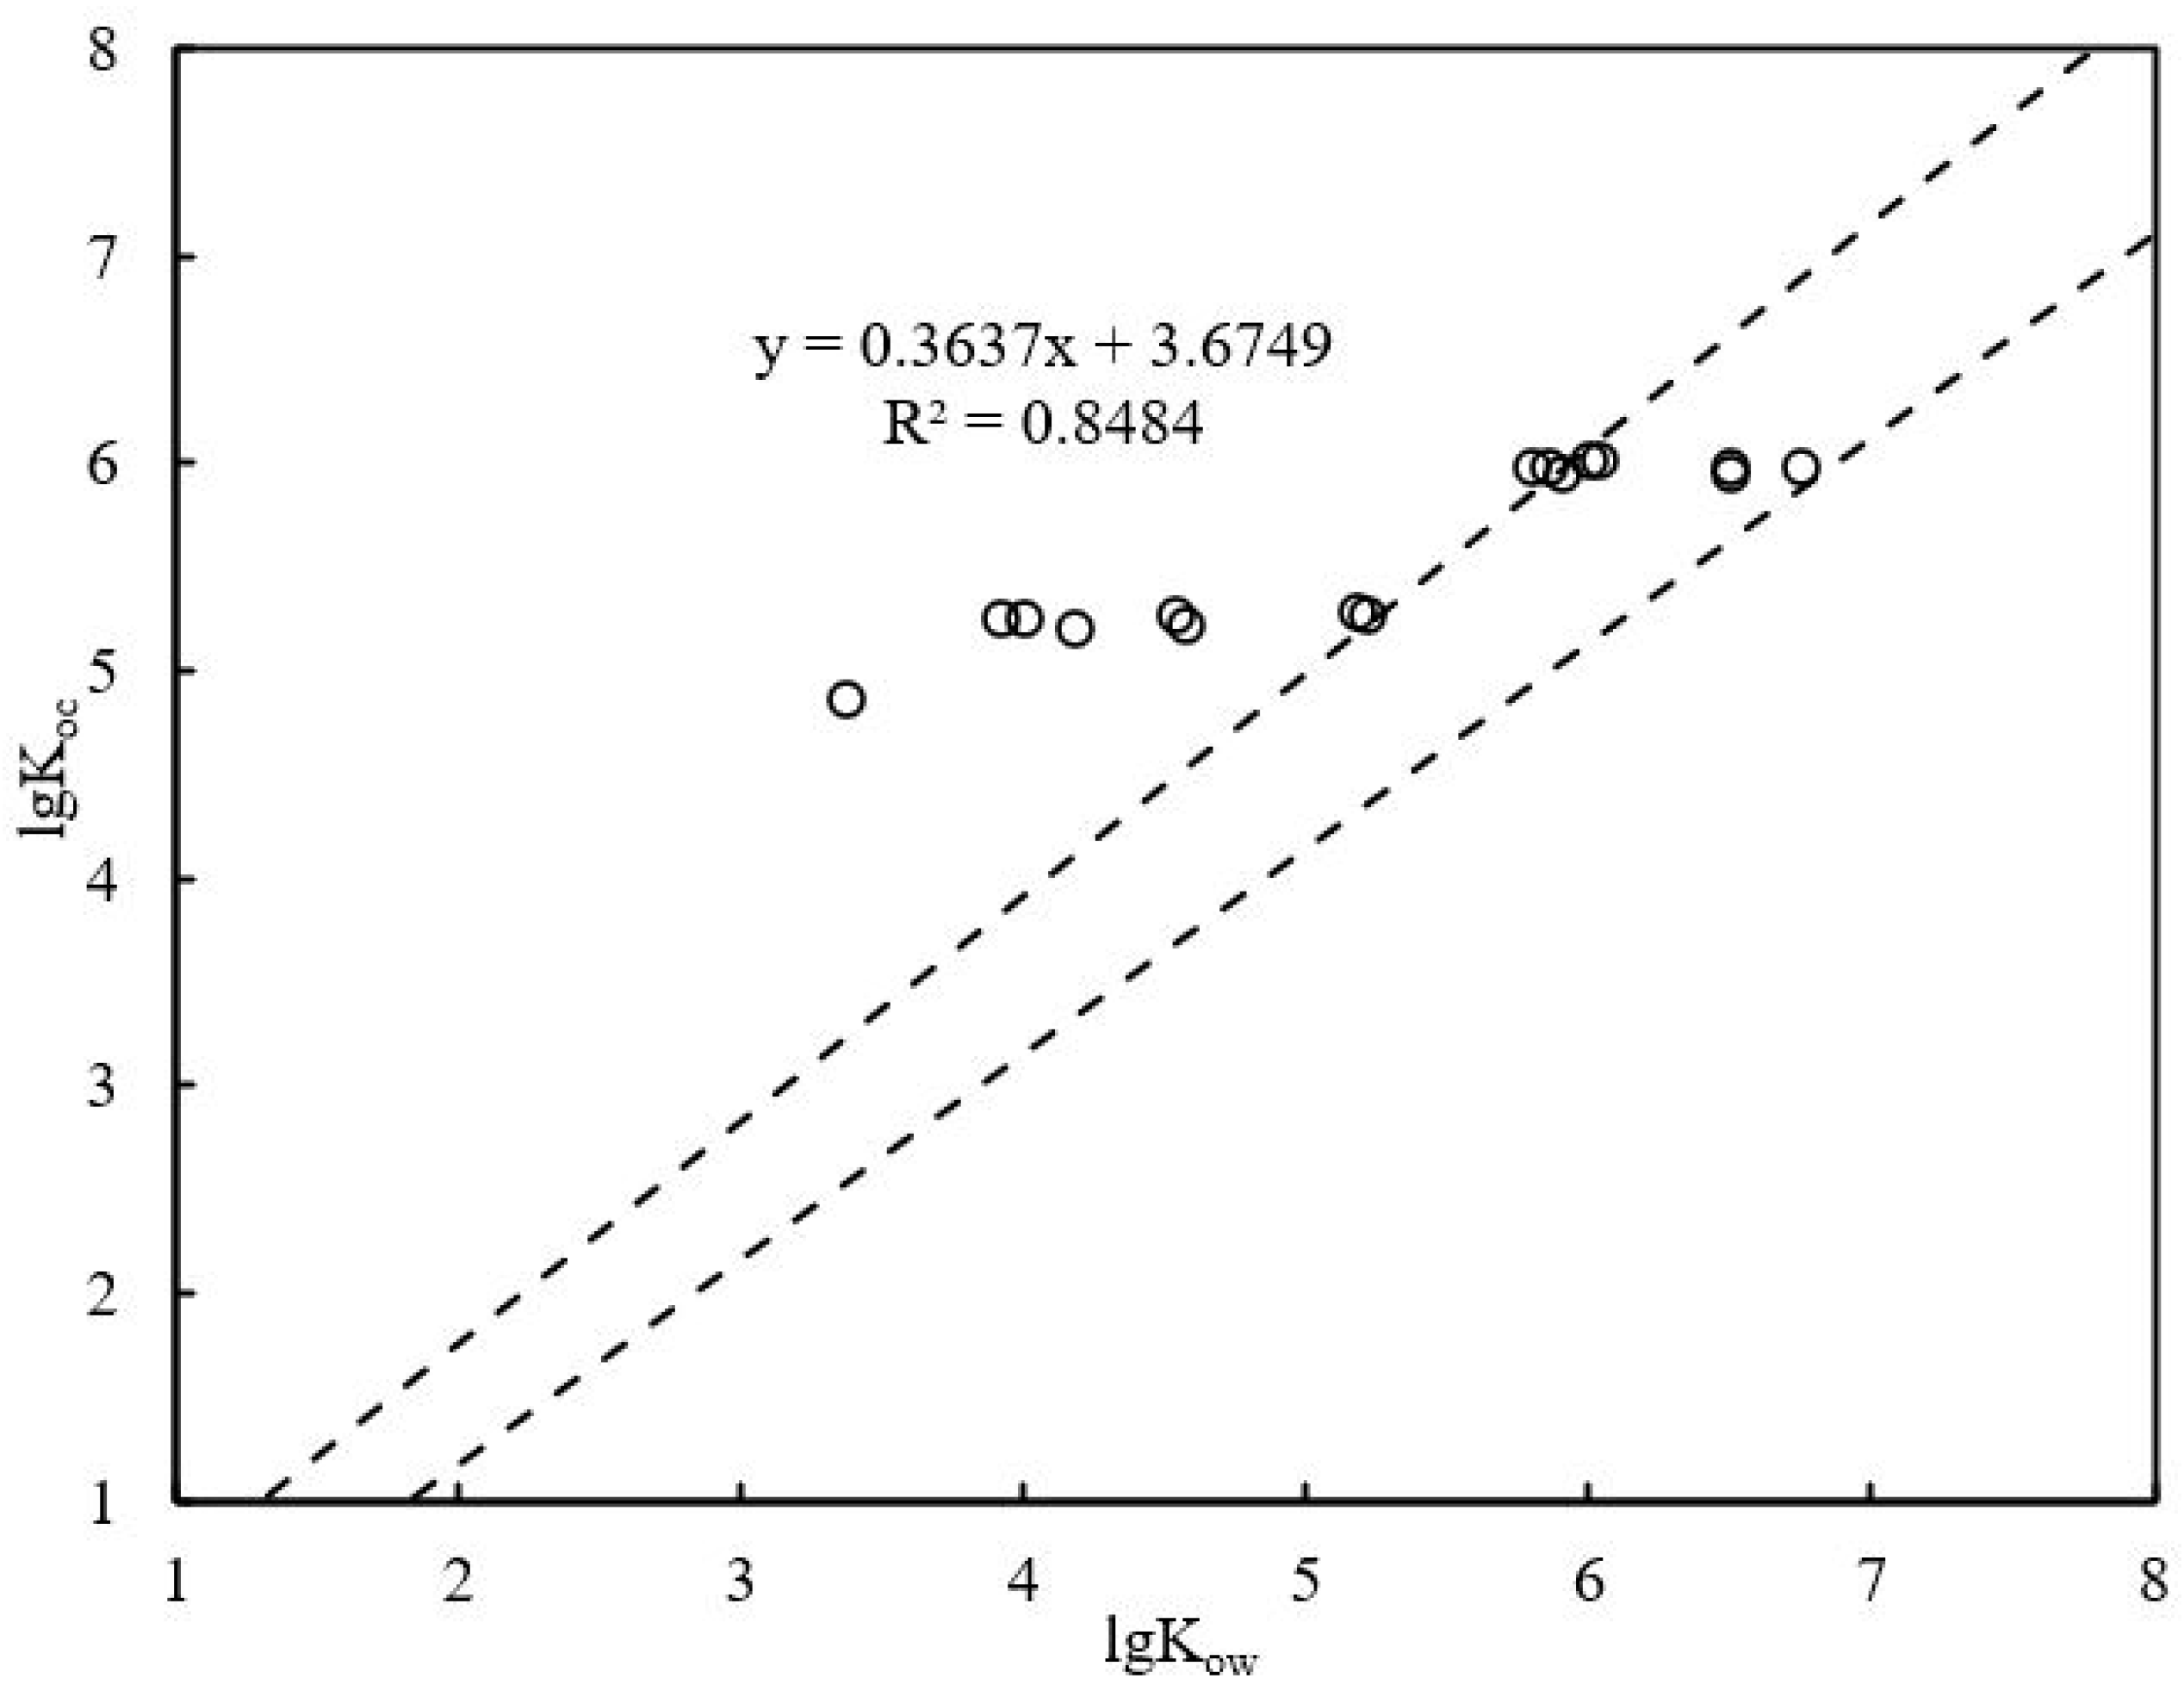
3.3. Partition of PAHs in Groundwater and Sediments

The partition coefficient of PAHs in the study area was calculated using the concentrations of PAHs in the groundwater and sediment water (Figure 6). The Kp value of PAHs in the sediment–water interface in the Qing-shui Spring underground river ranged from 0.73 to 3.85 L/g, which basically increased with the increase in the ring number of PAHs, indicating that a large number of PAHs were enriched in the sediments, and the larger ring number of PAHs was more likely to be adsorbed in the sediments.
The Kp value was normalized for organic carbon, and the obtained Koc value was plotted using the common logarithm and the n-octanol-water partition coefficient Kow, and it was found that there was a significant correlation between the two coefficients. Thus, the linear free energy equation was obtained
lgKoc = 0.3637Kow + 3.6749
Figure 7 shows that the dotted lines are the upper and lower limits of the standardized distribution coefficient of PAHs’ particulate matter and water phase organic carbon measured under the indoor equilibrium state, which was measured by Seth (Seth et al. 1999). The upper limit equation is lgKoc = 1.08Kow − 0.41, and the lower limit equation is lgKoc = 0.99Kow − 0.81.
As shown in Figure 7, most of the lgKoc values of PAHs in the underground river exceed the upper limit of the predicted values, and a few are distributed within the predicted range. PAHs were significantly higher than the upper limit of the predicted value, indicating that PAHs were strongly adsorbed on particulate matter, while lower than the lower limit of the predicted value indicated that the distribution of PAHs was affected by dissolved organic matter. The slope of the linear free energy equation is used to characterize the lipophilicity of the particles. A slope of 1 indicates that the particles have the same lipophilicity as n-octanol. Compared with n-octanol, a slope of < 1 indicates that the lipophilicity of the particles is low and the affinity of the particles to PAHs is poor. As seen in Figure 7, sediments from Qing-shui Spring underground river had a weak affinity for PAHs.

3.4. Ecological Risk Assessment of PAHs in Groundwater and Sediments

The risk quotation method was used to evaluate the ecological risk of PAHs in groundwater in the Qing-shui Spring underground river system, and the evaluation results are shown in Table 5. As can be seen from Table 5, except for BaA and BbF, the RQNCs values of other PAH monomers were all more than one, and the RQMPCs values were less than one, indicating that these PAH monomers were of medium risk in any area of the study area. In the upstream, middle and downstream regions, the RQMPCs of BaA were all more than one, indicating that BaA was high risk. There were certain differences between BbF and BaA. Although BbF was high risk on the whole, a regional analysis showed that BbF was characterized as medium risk in the upstream region, while high risk in the midstream and downstream regions. Therefore, according to the evaluation results, environmental protection measures should be taken to monitor all PAH monomers, focusing on monitoring BaA and BbF, and corresponding environmental pollution control schemes should be formulated to gradually reduce ecological risks.
The ecological risk of sediments in the study area was evaluated according to the lower-median effect interval method, and the evaluation results are found in Table 6. As can be seen in Table 6, except for Acy and Flu, the concentrations of the other PAH monomers were less than the ERL value, indicating that these PAH monomers were less likely to produce ecological hazards. The concentrations of Acy and Flu were between the ERL value and ERM, indicating that these monomers occasionally caused ecological hazards, and their possible ecological risk areas were in the midstream and downstream areas. The ecological risks of a few PAHs were different in different regions. For example, the concentrations of Ace and DaA in the midstream and downstream were less than the ERL value, and the probability of ecological toxicity was less than 10%. However, their concentrations in the downstream were between the ERL value and ERM value, and the probability of ecological toxicity was between 10–50%. In addition, because BbF, BkF, InP and BgP are not defined as the minimum safety values, as long as these PAHs are detected in the underground river environment, they will cause harm to the ecological environment of the underground river system. Therefore, according to the evaluation results, reasonable pollution prevention and control measures should be taken to reduce and control the ecological risk of PAHs’ pollution, avoid the escalation or expansion of ecological risk, deeply analyze the regional pollution status and pollution channels, and formulate reasonable pollution prevention and control plans.
In addition to the study area, the PAHs’ pollution of the Laolongdong underground river, Chongqing city, China has been relatively serious, and the average concentration of PAHs in groundwater was 1648 ng/L [43]. There are two reasons for the serious pollution. On the one hand, there have been intensive population activities. On the other hand, there are many industrial pollution sources in the midstream and downstream. The long-term PAHs’ pollution discharge has resulted in the deterioration of the ecological environment of the Laolongdong underground river tourist area, which has been closed as a tourist attraction. In response to the problems, the local government is taking measures such as closing small industrial and mining enterprises, reducing pollutant emissions and carrying out ecological environmental restoration to gradually improve the quality of the ecological environment.

4. Conclusions

The concentration range of ∑16PAHs in groundwater and surface sediments in the Qing-shui Spring underground river system in Nanning city was 282.42–464.88 ng/L and 400.14–1194.69 ng/g, respectively. The main PAHs in the groundwater were 2–3 ring PAHs, and the sediments were dominated by 5–6 rings PAHs. Compared with other regions, the concentrations of PAHs in the groundwater in the region were at medium and low pollution levels, and the concentrations of PAHs in sediments were at a medium pollution level.
The distribution of PAHs in the water environment of the Qing-shui Spring underground river followed the order of: PAH values upstream < PAH values midstream < PAH values downstream. The concentrations and compositions of PAHs were different in different regions. The concentrations of PAHs decreased gradually in the upstream area, but the proportions of 2–3 ring PAHs increased rapidly. The concentrations of PAHs increased rapidly in the midstream and downstream areas, but the proportions of 2–3 rings PAHs decreased rapidly. The variation difference was closely related to pollutant discharge, the physical and chemical characteristics of PAHs and the particularity of underground river pipelines.
The isomer ratio method showed that the sources of PAHs in groundwater were different in the upstream, midstream and downstream areas, including biomass combustion sources, petroleum sources and mixed sources, respectively. The source of PAHs in sediments was different from that in groundwater, that was, most of the PAHs were from biomass combustion sources in the middle and upper reaches, and most of the PAHs were from mixed sources in the middle and lower reaches. The reason for the difference was the physical and chemical properties of PAHs.
The Kp value of the sediment–water phase of PAHs in the Qing-shui Spring underground river ranged from 0.73 to 3.85 L/g, and basically increased with the increase in PAHs ring numbers, which tended to be adsorbed in the sediments. The lgKoc value of PAHs was almost higher than the predicted value, and most of them were higher than the upper limit of the predicted value, and PAHs were strongly adsorbed on the particles. The slope of the linear free energy equation was less than 1, indicating that the lipophilicity of underground river sediments was poor.
There were obvious ecological risks in both the groundwater and sediment. Groundwater as a whole was at a medium risk level, but BaA and BbF were at a high risk level regionally. Compared with groundwater, the overall ecological risk of sediment was low, but Acy and Flu may cause ecological harm. Therefore, it is necessary to focus on the monitoring of key high risk pollutants and formulate implementation plans to control environmental pollution.

Author Contributions

Conceptualization, Z.W. and J.L.; methodology, Z.W.; software, L.L.; validation, Z.W., J.C. and L.L.; formal analysis, L.Z. and J.C.; investigation, S.L.; resources, J.L.; data curation, Z.W.; writing—original draft preparation, Z.W. and L.L.; writing—review and editing, Z.W. and J.L.; visualization, J.C.; supervision, L.Z.; project administration, Z.W. and L.L.; funding acquisition, Z.W., J.C. and L.L. All authors have read and agreed to the published version of the manuscript.

Funding

The authors gratefully acknowledge the financial support provided by the National Science Foundation of China (Grant No. 41807218, Grant No. 41602277), and Geological Survey Project of the China Geological Survey (Grant No. DD20190342, Grant No. DD20190825).

Data Availability Statement

The data presented in this study are available on request from the corresponding author. The data are not publicly available due to privacy reasons.

Conflicts of Interest

The authors declare no conflict of interest.

References

  1. Du, L.L.; Ding, T.T.; Dong, H.J.; Liu, X.X.; Zhang, Y.H.; Zeng, H.H.; He, L.S. Pollution and ecological risk assessment of polycyclic aromatic hydrocarbons in the water environment of Shaying River Basin, China. J. Agro-Environ.Sci. 2020, 39, 601–611. [Google Scholar]
  2. Wang, C.L.; Zou, Q.X.; Zhao, Y.F.; Li, B.J. Source Apportionment and Ecological Risk Assessment of Polycyclic Aromatic Hydrocarbons in Surface Water from Yangtze River, China: Based on PMF Model. Chin. J. Environ. Sci. 2016, 37, 3789–3797. [Google Scholar]
  3. Zhang, M.; Tang, F.L.; Zhang, W.; Ma, Q.; Wang, J.P.; Xu, J.F.; Chen, F.; Xu, Z.B. Vertical Profile, Source and Potential Ecological Risk of Polycyclic Aromatic Hydrocarbons in Sediment Cores from the Qingshan Reservoir of Hangzhou. Earth Environ. 2020, 48, 405–412. [Google Scholar]
  4. Wu, Y.L.; Wang, X.H.; Ya, M.L.; Li, Y.Y.; Hong, H.S. Seasonal variation and spatial transport of polycyclic aromatic hydrocarbons in water of the subtropical Jiulong River watershed and estuary, Southeast China. Chemosphere 2019, 234, 215–223. [Google Scholar] [CrossRef] [PubMed]
  5. Khumana, S.N.; Chakraborty, P.; Cincinellic, A.; Sonw, D.; Kumar, B. Polycyclic aromatic hydrocarbons in surface waters and riverine sediments of the Hooghly and Brahmaputra Rivers in the Eastern and Northeastern India. Sci. Total Environ. 2019, 636, 751–760. [Google Scholar] [CrossRef] [PubMed]
  6. Wu, J.; Xiong, L.J.; Wu, J.; Sha, C.Y.; Hao, T.; Lin, K.F.; Li, K.F.; Li, D.Y.; Shen, C. Comparison and Source Apportionment of PAHs Pollution of Runoff from Roads in Suburb and Urban Areas of Shanghai. Chin. J. Environ. Sci. 2019, 40, 2240–2248. [Google Scholar]
  7. Han, R.L.Y.; Rao, R.C.; Dong, Y.C.; Liu, Y.C.; Wang, Q.; Li, J.Y.; Yin, J. Distribution and Health Risk Assessment of Polycyclic Aromatic Hydro-carbons in Surface Water, Sediments and Organisms of Dishui Lake and Its Surrounding Water System. Asian J. Ecotoxicol. 2020, 15, 240–251. [Google Scholar]
  8. Yin, S.; Bai, J.H.; Wen, X.J.; Zhang, G.L.; Han, L.; Hu, X.Y. Effects of polycyclic aromatic hydrocarbon(phenanthrene)addition on soil nitrogen mineralization processes in rural and urban river wetlands of the Pearl River Estuary, China. J. Agro-Environ. Sci. 2019, 38, 600–608. [Google Scholar]
  9. Liu, Q.; Gao, J.H.; Shi, Y.; Ai, Q.; Sheng, H.; Zhang, D.L.; Li, J.; Bai, F.L. Distribution characteristics and controlling factors of PAHs in surface sediments in north of North Yellow sea. Mar. Environ. Sci. 2020, 39, 53–58. [Google Scholar]
  10. Hu, J.; Liu, C.Q.; Guo, Q.J.; Yang, J.; Okoli, C.P.; Lang, Y.C.; Zhao, Z.Q.; Li, S.L.; Liu, B.J.; Song, G.W. Characteristics, source, and potential ecological risk assessment of polycyclic aromatic hydrocarbons (PAHs) in the Songhua River Basin, Northeast China. Environ. Pollut. Res. 2017, 24, 17090–17102. [Google Scholar] [CrossRef]
  11. Mahler, B.J.; Van Metre, P.C.; Foreman, W.T. Concentrations of polycyclic aromatic hydrocarbons (PAHs) and azaarenes in runoff from coal-tar- and asphalt-sealcoated pavement. Environ. Pollut. 2014, 188, 81–87. [Google Scholar] [CrossRef]
  12. Yuan, H.Z.; Liu, E.F.; Zhang, E.L.; Luo, W.L.; Chen, L.; Wang, C.; Lin, Q. Historical records and sources of polycyclic aromatic hydrocarbons (PAHs) and organochlorine pesticides (OCPs) in sediment from a representative plateau lake, China. Chemosphere 2017, 173, 78–88. [Google Scholar] [CrossRef]
  13. Yu, W.W.; Liu, R.M.; Xu, F.; Men, C.; Shen, Z.Y. Identifications and seasonal variations of sources of polycyclic aromatic hydrocarbons (PAHs) in the Yangtze River Estuary, China. Mar. Poll. Bull. 2016, 104, 347–354. [Google Scholar] [CrossRef]
  14. Lu, L.; Wang, Z.; Pei, J.G. Pollution Characteristics of Polycyclic Aromatic Hydrocarbons in Surface Sediments from Typical Underground River in Southwest China. Environ. Sci. Technol. 2019, 42, 51–56. [Google Scholar]
  15. Lan, J.C.; Sun, Y.C.; Hu, N. Changes of the concentration and composition of polycyclic aromatic hydrocarbons and their ecological risk assessment during the scale of rainfall events in a karst underground river. Environ. Chem. 2018, 37, 2049–2059. [Google Scholar]
  16. Song, Y.M.; Wang, C.; Liu, S.; Pan, J.C.; Guo, P.R. Distribution, Sources, and Health Risk Assessment of PAHs in Water Supply Source Regions of Guangzhou. Chin. J. Environ. Sci. 2019, 40, 3489–3500. [Google Scholar]
  17. Tian, D.N.; Dang, H.L.; Ding, R.M.; Cai, Q.; Zhang, P.J.; Wang, L.; Yang, H.F. Distribution, Sources, and Ecological Risk Assessment of Polycyclic Aromatic Hydrocarbons in the Surface Waters of the Yinchuan Wetlands. Chin. J. Environ. Sci. 2019, 40, 3068–3077. [Google Scholar]
  18. Karickhoff, S.W.; Brown, D.S.; Scott, T.A. Sorption of hydrophobic pollutants on natural sediments. Water. Res. 1979, 13, 241–248. [Google Scholar] [CrossRef]
  19. McGeoddy, S.E.; Farrington, J.W. Sediment porewater partitioning of polycyclic aromatic hydrocarbons in three cores from Boston Harbor, Massachusetts. Environ. Sci. Technol. 1995, 29, 1542–1550. [Google Scholar] [CrossRef] [PubMed]
  20. Kalf, D.F.; Crommentuijn, T.; Plassche, E.J. Environmental quality objectives for 10 polycyclic aromatic hydrocarbons (PAHs). Ecotoxicol. Environ. Saf. 1997, 36, 89–97. [Google Scholar] [CrossRef]
  21. Cao, Z.G.; Liu, J.L.; Luan, Y.; Ma, M.Y.; Xu, J.; Han, S.L. Distribution and ecosystem risk assessment of polycyclic aromatic hydrocarbons in the Luan River, China. Ecotoxicology 2010, 19, 827–837. [Google Scholar] [CrossRef]
  22. Long, E.R.; Macdonald, D.D.; Smith, S.L.; Calder, F.D. Incidence of adverse biological effects within ranges of chemical concentrations in marine and estuarine sediments. Environ. Manag. 1995, 19, 81–97. [Google Scholar] [CrossRef]
  23. Shao, Y.X. A Dissertation Submitted to China University of Geosciences for the Doctor Degree of Environmental Science and Engineering. Ph.D. Thesis, China University of Geosciences, Wuhan, China, 2014. [Google Scholar]
  24. Zhang, Q.; Hu, W.; Wu, X.; Pan, E.C.; Xu, Q.J.; Liang, C.Z.; He, Y.; Wang, C. Polycyclic Aromatic Hydrocarbons Levels in Drinking Water Sources in Rural Areas in a City of Jiangsu Province. J. Environ. Occupat. Med. 2016, 33, 691–694. [Google Scholar]
  25. SUN, Y.C.; Zhang, S.Y.; Lan, J.C.; Xie, Z.L.; Pu, J.B.; Yuan, D.X.; Yang, H.; Xing, B.S. Vertical migration from surface soils to groundwater and source appointment of polycyclic aromatic hydrocarbons in epikarst spring systems, southwest China. Chemosphere 2019, 230, 616–627. [Google Scholar] [CrossRef] [PubMed]
  26. Lan, J.C.; SUN, Y.C.; Yuan, D.X. Transport of polycyclic aromatic hydrocarbons in a highly vulnerable karst underground river system of southwest China. Environ. Sci. Pollut. Res. Int. 2018, 25, 34519–34530. [Google Scholar] [CrossRef]
  27. Wang, W.Y.; Zhang, J.; Li, X.F.; Li, Y.X.; Hou, H.; Wang, L.Q.; Li, F.S. Characteristics and sources of polycyclic aromatic hydrocarbons pollution in water of Xi’an outskirt regions. Agric. Res. Arid Areas 2015, 33, 201–206. [Google Scholar]
  28. Xie, Z.L.; Sun, Y.C.; Zhang, M.; Liao, Y.; Wang, Z.B.; Liang, Z.B. Distribution Characteristics and Source Identification of Polycyclic Aromatic Hydrocarbons, Fatty Acids in Water of Karst Underground River. Chin. J. Environ. Sci. 2016, 37, 2547–2555. [Google Scholar]
  29. Miao, Y.; Kong, X.S.; Li, C.Z. Distribution and Sources of Polycyclic Aromatic Hydrocarbons in a Karst Groundwater System in a Strongly Industrial City. Chin. J. Environ. Sci. 2019, 40, 239–247. [Google Scholar]
  30. Jia, X.Q.; Wang, H.T.; Zhou, H. Investigation of Organochlorine Pesticides and Polycyclic Aromatic Hydrocarbons in Water Environment of Karst Agricultural Region—Taking the Huangliang Area of Hubei Province as an Example. Saf. Environ. Eng. 2018, 25, 61–66. [Google Scholar]
  31. Geng, M.J.; Chang, S.; Liu, Y.; Wang, S.J.; Han, X.Y. Pollution status and health risks of drinking water of the polycyclic aromatic hydrocarbons and phthalate esters in the deep shallow pore water of Hutuo River Pluvial Fan. Chin. J. Environ. Sci. 2016, 36, 3824–3830. [Google Scholar]
  32. Gong, X.Y.; He, Y.Z.; Sun, Y.L. Distribution and source of polycyclic aromatic hydrocarbons in groundwater in the upper region of Sihu Lake Basin from Jianghan Plain. Acta Sci. Circumst. 2015, 35, 789–796. [Google Scholar]
  33. Zhao, Y.; Dang, J.H.; Wang, F. Spatial Variety and Ecological Risk of Polycyclic Aromatic Hydrocarbons (PAHs) in Water and Surface Sediments of Fenhe River Basin, China. Asian J. Ecotoxicol. 2017, 12, 579–596. [Google Scholar]
  34. Liu, S.P.; Li, X.G.; Zhang, D.H.; Li, J.F.; Han, B. Distribution, source and ecological risk assessment of polycyclic aromatic hydrocarbons (PAHs) in surface sediments from Moshui River. Environ. Chem. 2018, 37, 843–850. [Google Scholar]
  35. Li, S.; Liu, Y.Z.; Liu, R.Y.; Xiang, X.X.; Zhang, S.C.; Lu, Y.T. The pollution characteristics and risk assessment of polycyclic aromatic hydrocarbons of Shen-Fu section of the Hun River Basin. China Environ. Sci. 2019, 39, 1551–1559. [Google Scholar]
  36. Yang, Y.Y.; Wang, H.Y.; Chang, Y.; Yan, G.K.; Chu, Z.S.; Zhao, Z.J.; Li, L.; Li, Z.W.; Wu, T. Distributions, compositions, and ecological risk assessment of polycyclic aromatic hydrocarbons and phthalic acid esters in surface sediment of Songhua river, China. Mar. Poll. Bull. 2019, 152, 110923. [Google Scholar] [CrossRef] [PubMed]
  37. Zou, J.S.; Sun, X.P.; Zheng, X.; Sun, J.; Zhang, X.L.; Liu, K. Analysis of the contamination characteristics and the eco-risk assessment of PAHs in sediments from the Three Gorges section in Chongqing area. J. Saf. Environ. 2017, 17, 1548–1553. [Google Scholar]
  38. Han, X.Y.; Chang, S.; Fu, Q.; Wang, S.J.; Yang, G.; Zhao, X.R.; Geng, M.J. Pollution Characteristics and Ecological Risk Assessment of Polycyclic Aromatic Hydrocarbons in Qingyuan section of Beijiang River in Flood Season. Res. Environ. Sci. 2018, 31, 61–69. [Google Scholar]
  39. Lan, J.C.; Sun, Y.C.; Xiao, S.Z. Water-Sediment Partition of Polycyclic Aromatic Hydrocarbons in Karst Underground River. Chin. J. Environ. Sci. 2015, 11, 4081–4087. [Google Scholar]
  40. He, S.H.; Cao, X.C.; Li, T.Y.; Zhang, M.S.; Liang, Y.; Chen, B.J. Distribution, source and ecological risk assessment of polycyclic aromatic hydrocarbons (PAHs) in surface sediments from Sanya River. Environ. Chem. 2019, 4, 967–970. [Google Scholar]
  41. Dong, L.; Tang, X.Q.; Lin, L.; Li, C.; Li, R.; Wu, M. Pollution Characteristics and Source Identification of Polycyclic Aromatic Hydrocarbons and Phthalic Acid Esters During High Water Level Periods in the Wuhan Section of the Yangtze River, China. Chin. J. Environ. Sci. 2018, 6, 2588–2899. [Google Scholar]
  42. Kong, X.S.; Luan, R.J.; Miao, Y.; Qi, S.H.; Li, F. Polycyclic aromatic hydrocarbons in sediment cores from the Dashiwei Tiankeng reach in the Bailang underground river, South China. Environ. Earth Sci. 2015, 73, 5535–5543. [Google Scholar] [CrossRef]
  43. Hu, Y.Q.; Sun, Y.C.; Li, X.L.; Cao, M.; Yuan, D.X. Spatial Distribution and Ecological Risk Assessment of PAHs in Different Karst Underground Rivers Based on Species Sensitivity Distribution. Earth Environ. 2021. online. [Google Scholar]
Figure 1. Location map showing sampling points in the study area, and regional distribution of geological units.
Water 13 02655 g001
Figure 2. Distribution of concentrations of ∑16PAHs in groundwater and sediments.
Water 13 02655 g002
Figure 3. Composition distribution of PAHs in groundwater.
Water 13 02655 g003
Figure 4. Composition distribution of PAHs in sediments.
Water 13 02655 g004
Figure 5. (a) Sources of PAHs in groundwater; (b) Sources of PAHs in sediments.
Water 13 02655 g005
Figure 6. Partitioning coefficients of PAHs in sediment–water interface of underground river.
Water 13 02655 g006
Figure 7. Relationship between lgKoc and lgKow in sediment–water interface.
Water 13 02655 g007
Table 1. Standard for determining the sources of PAHs by isomer ratio method.
PAHs RatioPAHs Source
FlA/(FlA + Pyr)Oil sourcesCombustion sources of petroleumCombustion sources of grass, wood, coal
<0.40.4–0.5>0.5
BaA/(BaA + Chr)Oil sourcesMixed sources of oil and combustionCombustion source
<0.20.2–0.35>0.35
Table 2. Concentrations of ∑16PAHs in the water environment of Qing-shui Spring underground river.
PAHsGroundwater (ng/L)Sediments (ng/g)
Minimum MaximumAverageMinimum MaximumAverage
Nap31.02 55.98 45.24 25.48 47.41 32.98
Acy5.15 14.43 12.87 17.74 57.93 22.61
Ace6.75 13.72 12.87 21.56 61.49 23.20
Flu7.18 31.32 18.89 20.60 58.68 29.78
Phe25.98 50.59 36.55 40.53 109.98 61.15
Ant3.93 7.98 6.14 7.71 24.47 11.27
FlA24.22 49.86 32.45 32.91 116.53 60.71
Pyr20.13 70.20 43.31 35.89 119.61 82.64
BaA9.77 45.14 15.89 21.93 61.25 35.63
Chr17.22 75.12 28.35 37.58 118.71 67.90
BbF9.24 29.54 21.21 12.75 106.19 52.07
BkF7.70 29.21 13.87 10.74 87.30 36.45
BaP6.67 38.50 22.49 12.57 87.14 48.39
InP2.79 19.14 8.55 15.75 77.23 30.42
DaA5.91 25.15 13.17 10.69 78.46 49.62
BgP6.28 27.75 14.20 11.46 89.76 54.71
2–3 ring113.04 140.44 132.56 135.63 338.31 180.99
4 ring94.21 212.07 120.00 132.67 390.61 246.87
5–6 ring42.38 135.01 93.49 80.91 505.66 271.67
16PAHs282.42 464.88 346.05 400.14 1194.69 699.53
Table 3. Comparison of concentrations of ∑16PAHs in groundwater from different research areas.
Research Area16PAHs Range (Average)/(ng/L)PlaceNumber of Main RingsSampling Time
Guozhuang karst spring2137–9037 (5020)Linfen City, Shanxi Province, China 2–32012
Huaian drinking water source2700.9Huai an City, Jiangsu Province, China22012
Epikarst spring of Nanchuan,
Chongqing
341–4968 (1772)Nanchuan District, Chongqing City, China2–32010–2011
Laolongdong underground river211.7–970.4 (442.2)Banan District, Chongqing City, China2–32013
Groundwater on the outskirts of Xi’an247.05–1867.18 (415.79)Xi’an City, Shaanxi Province, China5–62013
Qingmuguan underground river77.3–702 (398)Shapingba District, Chongqing City, China2–32013
Groundwater in Liuzhou industrial zone
of Guangxi Province
Dry season: 128.61–562.66 (302.02)
Wet season: 61.19–899.39 (367.13)
Liuzhou City, Guangxi Province, China42015
Groundwater in the Huang liang area of Hubei Province84.79–263.74Yichang City, Hubei Province, China2–32016
Deep shallow pore water
of Hutuo River Pluvial Fan
34.4–598.5 (249.7)Shijiazhuang City, Hebei Province, China2–32015
Groundwater in the upper region of
Sihu Lake Basin from Jianghan Plain
Dry season: 62.74–224.63 (129.77)
Wet season: 55.86–115.15 (82.85)
Qianjiang City, Hubei Province, China2–32011–2012
Qing-shui Spring underground river279.62–464.88 (346.05)Nanning City, Guangxi Province, China2–32018
Table 4. Comparison of concentrations of ∑16PAHs in surface sediments from different research areas.
Research Area16PAHs Range (Average)/(ng/g)PlaceNumber of Main RingsSampling Time
Fenhe River1290–8440 (3774)Shanxi Province, China32013
Moshui River196.51–8549.33 (3320.03)Qingdao City, Shandong Province, China5–62015
Hun River95.19–8444.21 (2518.42)Shenyang City, Liaoning Province, China3–52015–2016
Songhua River226.70–7086.62 (1179.62)Heilongjiang Province, China42016
Three Gorges reservoir area (Chongqing Section)68.6–4226 (685)Chongqing City, China5–62014
Beijiang54.4–819.8 (424.9)Guangdong Province, China4–62016
Laolongdong underground river58.2–1051 (367.9)Chongqing City, China2–32012–2013
Sanya River3.23–49 3(211)Sanya City, Hainan Province, China42016
Yangtze River (Wuhan section)46.1–424.0 (191.8)Wuhan City, Hubei Province, China2–32016
Dashiwei Bailang underground river35.34–280.17 (107.65)Leye County, Guangxi Province, China52007
Qing-shui Spring underground river405.78–1194.69 (699.53)Nanning City, Guangxi Province, China5–62018
Table 5. RQNCs and RQMPCs in groundwater from different areas.
PAHs NCs/(ng/L)MPCs/ (ng/L)Overall RQNCsOverall RQMPCsUpstream RQNCsUpstream RQMPCsMidstream RQNCsMidstream RQMPCsDownstream RQNCsDownstream RQMPCs
Nap1212003.77 0.04 4.11 0.04 3.16 0.03 4.02 0.04
Acy0.77018.39 0.18 19.60 0.20 20.64 0.21 13.76 0.14
Ace0.77018.38 0.18 20.25 0.20 17.01 0.17 17.29 0.17
Flu0.77026.98 0.27 33.34 0.33 33.44 0.33 9.37 0.09
Phe330012.18 0.12 10.20 0.10 14.30 0.14 12.51 0.13
Ant0.7708.78 0.09 9.31 0.09 8.48 0.08 8.36 0.08
FlA330010.82 0.11 10.68 0.11 8.86 0.09 13.47 0.13
Pyr0.77061.87 0.62 42.33 0.42 62.30 0.62 90.63 0.91
BaA0.110158.90 1.59 136.77 1.37 130.54 1.31 227.56 2.28
Chr3.43408.34 0.08 4.24 0.04 9.03 0.09 13.61 0.14
BbF0.110212.11 2.12 126.35 0.96 200.05 2.20 355.82 3.76
BkF0.44034.68 0.35 25.98 0.26 35.20 0.35 47.08 0.47
BaP0.55044.98 0.45 31.79 0.32 38.57 0.39 72.77 0.73
InP0.44021.38 0.21 18.41 0.18 13.28 0.13 35.97 0.36
DaA0.55026.34 0.26 20.66 0.21 21.90 0.22 40.41 0.40
BgP0.33047.33 0.47 31.24 0.31 42.81 0.43 77.11 0.77
16PAHs27.2272012.72 0.13 10.77 0.11 12.29 0.12 16.19 0.16
Table 6. Comparison of concentrations of PAHs in sediments in different areas with ERL and ERM (Unit: ng/g).
PAHsERLERMOverall Average ValueUpstream Average ValueMidstream Average ValueDownstream Average Value
Nap160210032.98 34.59 29.14 35.37
Acy1650022.61 15.27 23.56 32.44
Ace4464023.20 11.23 18.63 46.86
Flu1954029.78 18.78 29.16 47.07
Phe240150061.15 51.37 75.01 58.49
Ant85.3110011.27 8.64 9.92 16.90
FlA600510060.71 47.34 49.37 94.91
Pyr665260082.64 51.18 71.57 143.66
BaA261160035.63 30.61 30.98 48.97
Chr384280067.90 42.17 66.27 108.54
BbF 52.07 23.86 48.74 98.53
BkF 36.45 16.41 37.65 65.01
BaP430160048.3922.79 47.37 88.08
InP30.42 13.47 32.32 53.47
DaA63.426049.62 26.77 48.12 85.76
BgP54.71 20.08 59.95 100.12
16PAHs402240792699.53 446.90 689.78 1090.67
Publisher’s Note: MDPI stays neutral with regard to jurisdictional claims in published maps and institutional affiliations.

