Abstract
Ecosystem-based adaptation (EbA) can potentially mitigate watershed degradation problems. In this study, various EbA measures were evaluated using a bio-physical model called the Soil and Water Assessment Tool (SWAT), in a small, forested watershed named Hui Ta Poe, in the northeastern region of Thailand. The developed watershed model was first used to investigate the effect of various degraded watersheds due to land-use changes on the sediment yield in the study area. The most degraded watershed produced an annual average sediment yield of 13.5 tons/ha. This degraded watershed was then used to evaluate the effectiveness of various EbA measures such as reforestation, contouring, filter strips, and grassed waterways in reducing the sediment yield. Under all individual and combined EbA scenarios analyzed, there was a significant reduction in sediment yield; however, the maximum reduction of 88% was achieved with a combined scenario of reforestation, grassed waterways, and filter strips. Reforestation alone was found to be the second-best option, which could reduce the sediment yield by 84%. Contouring alone was the least effective, with a reduction in sediment yield of only 23%. This study demonstrates the usefulness of implementing EbA measures for sediment management strategies to address watershed degradation, which is a severe problem across the globe.
1. Introduction
Deforestation, changes in land use, and unsustainable agricultural management practices have been identified as the critical driving forces leading to high rates of watershed degradation in many parts of the world [1,2,3]. Encroachment of agricultural activity into natural ecosystems has led to significant losses in ecosystem services such as biodiversity conservation and carbon storage capacity [4,5,6,7]. Increased sedimentation due to watershed degradation has significantly reduced reservoir capacities [8]. About 2 billion people and 1.9 billion hectares of land are affected by land degradation globally [9]. For example, mining for minerals, coal, oil, and gas has caused severe land degradation in the United States and Canada [10]. In the European context, loss of biodiversity and habitat fragmentation are some of the significant impacts on ecosystems due to land degradation [11]. Moreover, the mean soil loss rate in the countries of the European Union’s erosion-prone lands (agricultural, forests, and semi-natural areas) was found to be 2.46 t ha−1yr−1 [12]. In sub-Saharan regions, the combined impacts of climate change and rainfall variability have further exacerbated the adverse impacts of land degradation, leading to lower rates of agricultural productivity, which has increased hunger and poverty levels in these regions [13,14].
Watershed degradation, which encompasses soil loss, increased sedimentation, and depletion of water resources [15], is a common problem in many developing countries, mainly due to the over-utilization of forest-related resources by rural people for their survival and well-being [16]. Many countries in Southeast Asia, including Cambodia, Laos, Malaysia, Vietnam, and Thailand, are facing intensive land degradation rates [17]. Increasing population levels [18], urbanization trends [19], unsustainable land conversion practices [20], and large-scale development projects [21] are some key reasons for land degradation in the region. Land degradation has increased the risk of floods and droughts and loss of ecosystem-related services. Climatic changes and environmental hazards have further exacerbated the risks associated with land degradation [22].
Higher rates of watershed degradation are likely to occur in the future with changes in precipitation patterns [23]. For instance, Borrelli et al. [24] pointed out that agricultural lands in Southern Brazil, Argentina, India, East China, Midwestern United States, Ethiopia, and Mediterranean Europe will face severe erosion due to extreme rainfall events expected in the future. These rates will further amplify due to global increases in the levels of nitrogen, phosphorus, and potassium as agricultural yields increase to cater to increasing population levels [25,26]. Deforestation rates were relatively low during the 1850s to the 1950s in Thailand, but intensive deforestation occurred after the 1960s. The expansion of commercial crops and land clearance for human settlements were the primary reasons for land degradation during the 1960s and 1970s [27,28]. Currently, deforestation and the misuse of land are the two main factors that have aggravated the watershed degradation issue, leading to the loss of watershed-related services in Thailand. The country’s rich reserves of biodiversity have also been threatened due to deforestation [2]. The conversion of forested lands to agricultural lands in the northeastern part occurred due to a rapid expansion in commercial crops’ cultivation and the need to provide subsistence food to an ever-increasing human population [16,29]. In addition, to satisfy increasing energy demands and minimize fossil fuel imports, the Government of Thailand has been promoting the cultivation of biofuel crops such as cassava and sugarcane in the region, thereby changing land-use patterns significantly. It is estimated that this will lead to more loss of forested areas in the future [29]. The deterioration of soil quality due to increased soil erosion rates also results in decreased agricultural productivity since nutrients present in the soils are washed away [30,31].
There has been growing interest in ecosystem-based adaptation (EbA), defined as measures or practices that utilize natural or managed biophysical systems (ecosystems) and processes to achieve adaptation objectives, as an effective tool to improve soil and water conservation strategies and agricultural development.
EbAs offer a wide range of benefits focusing on rehabilitation, conservation, and sustainable management of ecosystems. Field studies have proved that EbAs can increase crop yield and reduce soil erosion risks [32]. Successful cases of EbA implementation have been reported in different parts of the world by Cohen-Shacham et al. [33]. Given the importance of watershed services, the Government of Thailand enacted the forest plantation policy in 1992, under which several reforestation programs in the country were carried out, including in the northeastern part where deforestation is widespread [27].
EbA measures have a profound impact on maintaining surface water quality by limiting nutrient and sediment loading in rivers and streams [30]. Filter strips and field borders are edge-of-field EbA practices, while terracing, contouring, no-tillage, forage and biomass planting, cover crops, and detention basins are in-field EbA practices. In general, both edge-of-field and in-field measures reduce soil erosion and improve soil fertility. Structural EbAs refer to the installation of filter strips, sediment ponds, grassed waterways, grade stabilization structures, stream stabilization structures, and agricultural management practices such as terracing, strip cropping, contour farming, etc. Non-structural EbAs include no-tillage and nutrient management practices [34]. However, the main limitations faced when implementing EbA measures in the developing world are associated costs and farmers’ willingness to adapt to these new measures [35].
Furthermore, it is challenging to quantify the effectiveness EbA measures on a larger scale due to the complex bio-physical processes involved. Measuring sediment loads in a watershed and assessing the effectiveness of EbAs through field monitoring approaches is a resource-intensive, time-consuming, and often impractical process. However, currently available modeling tools that have been successfully used to simulate watersheds on multiple spatial-temporal scales, including hydrological processes [36,37,38], fate and transport of sediment and nutrients [39,40,41], land-use change [42], climate change [43,44,45,46,47,48,49], and others, can be used to evaluate the EbA measures.
Many watershed models have been developed over the years, and each has its defined strengths and weaknesses. The Soil and Water Assessment Tool (SWAT) [50], the Vegetation Filter Strip Model [51], the Hydrologic Simulation Program-FORTRAN [52], the Riparian Ecosystem Management Model [53], the Annualized Agricultural Non-Point Source Model [54], and the Agricultural Non-Point Source Model [55] were developed for watershed modeling.
The SWAT model simulates flow, sediments, and nutrients from the field scale to a larger river basin scale [50]. Many studies that used SWAT to simulate watershed hydrologic processes, representing both structural and non-structural EbA measures, have been carried out worldwide [30,34,56,57,58,59,60,61,62]. This indicates that the SWAT model is robust and suitable for evaluating the effectiveness of land-use changes and land management practices as well as best agricultural management practices on small and large watershed scales. Several studies carried out in Thailand and in other regions have similarly reported the success of SWAT in evaluating the impact of land management practices on streamflow and sediment [16,63,64,65,66,67,68].
Despite the increasing global acceptance of EbAs, the efficiency and effectiveness of these measures have not yet been studied in developing countries like Thailand. This study developed a scenario-based approach to simulate and evaluate healthy and degraded watersheds through a modeling approach. Therefore, the objective of the study is to build a hydrological modeling framework for Huai Bang Sai watershed in northeastern Thailand and assess the usefulness and extent of impact and effectiveness of implementing EbA measures on soil erosion and sedimentation. The modeling framework integrates a bio-physical model, SWAT, and various input databases as well as the Geographical Information System (GIS) interface to simulate (through calibration and validation) the watershed hydrology and sediment accurately to investigate watershed degradation and the effectiveness of EbAs in the study area. Furthermore, and more importantly, the present work exemplifies how EbA measures can be adopted in a degraded watershed to conserve and possibly restore it to its original state. The findings of the present study will be useful for river basin managers and planners, and stakeholders including farmers, to understand best management practices with regard to soil erosion and sediment management practices to cope more effectively with the problems of land degradation and its associated impacts.
2. Materials and Methods
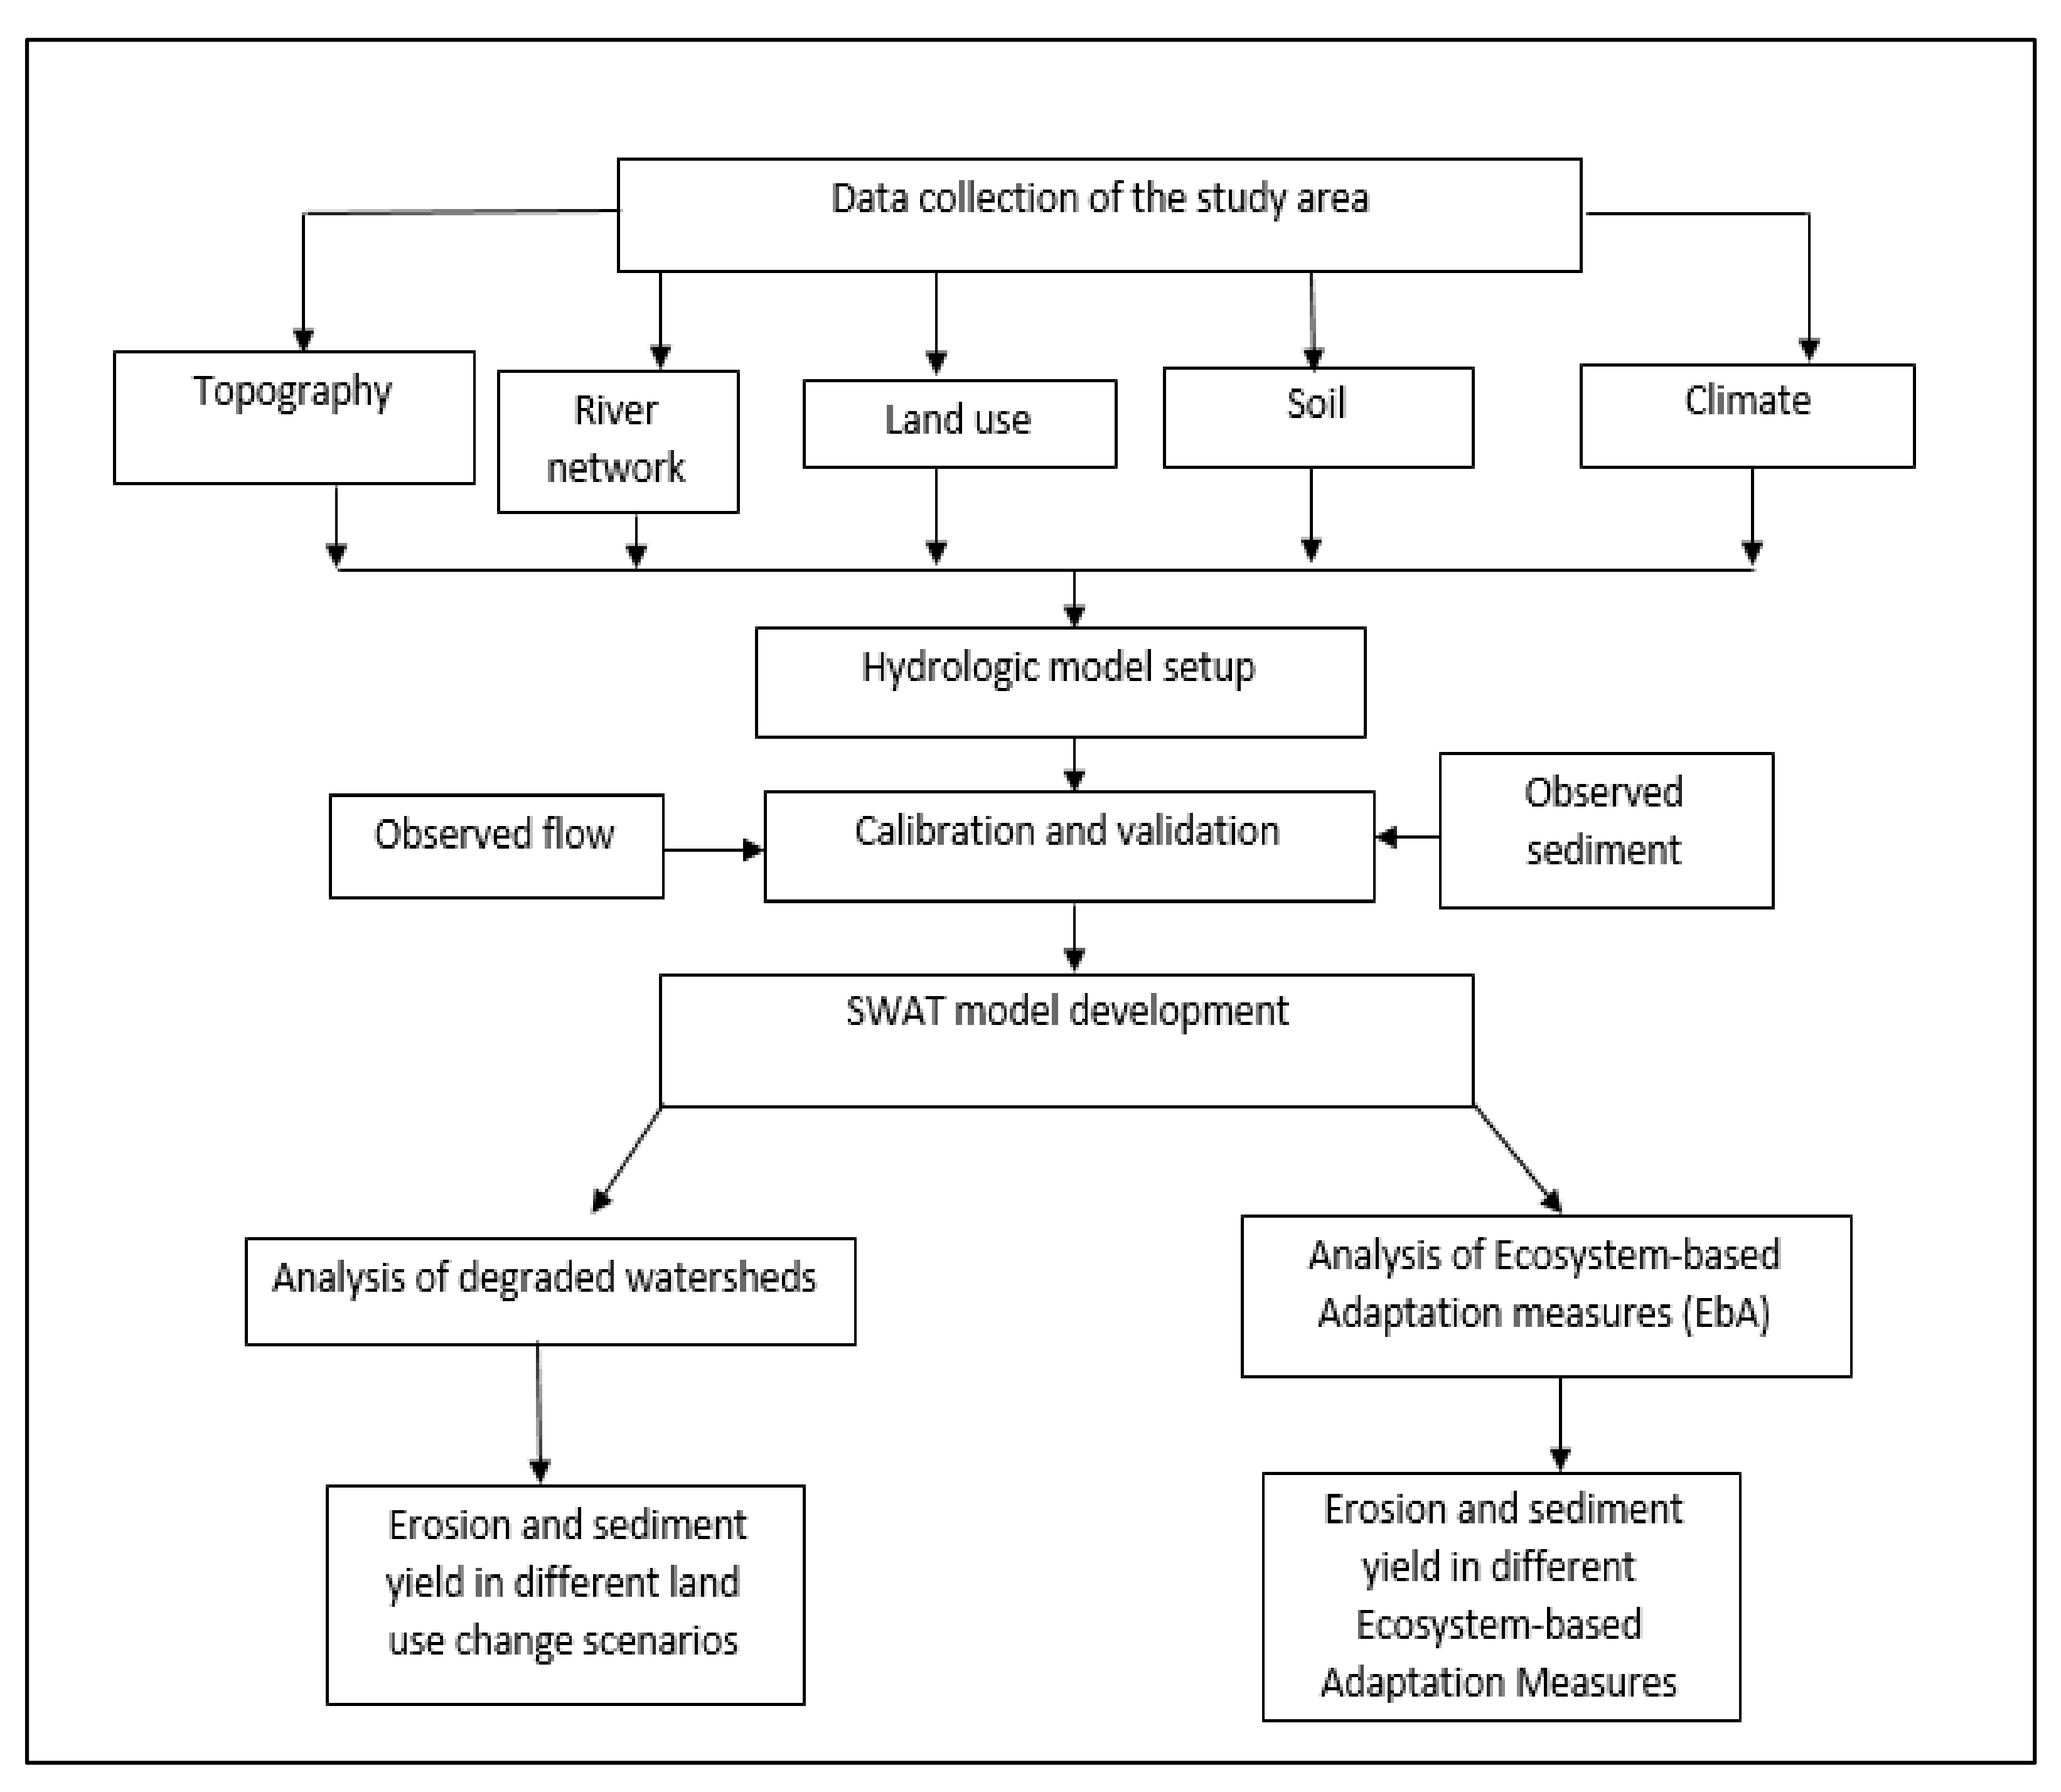
Figure 1 provides an overall framework of the study and the various components (study area, datasets, watershed model development, degraded watersheds, and ecosystem-based adaptation measures). These components are described below.
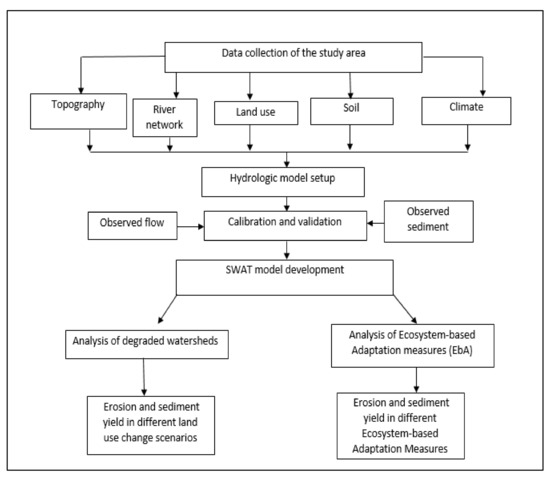
Figure 1.
The framework of the study.
2.1. Study Area
Several regions in northeastern Thailand are prone to soil erosion [69,70]. The main reason for the increasing rates of soil erosion is the replacement of upland forests and lowland paddy cultivation with cash crops such as cassava and sugarcane. This land-use change increases surface runoff and causes more soil erosion [71]. Lack of conservation practices has also contributed to high erosion rates in the traditionally agricultural regions in this part of Thailand [16]. Nontananandh et al. [72] demonstrated that 80% of the land area in the Songkhram River Basin in northeastern Thailand is subjected to an annual average soil erosion rate of 12.5 tons/ha.
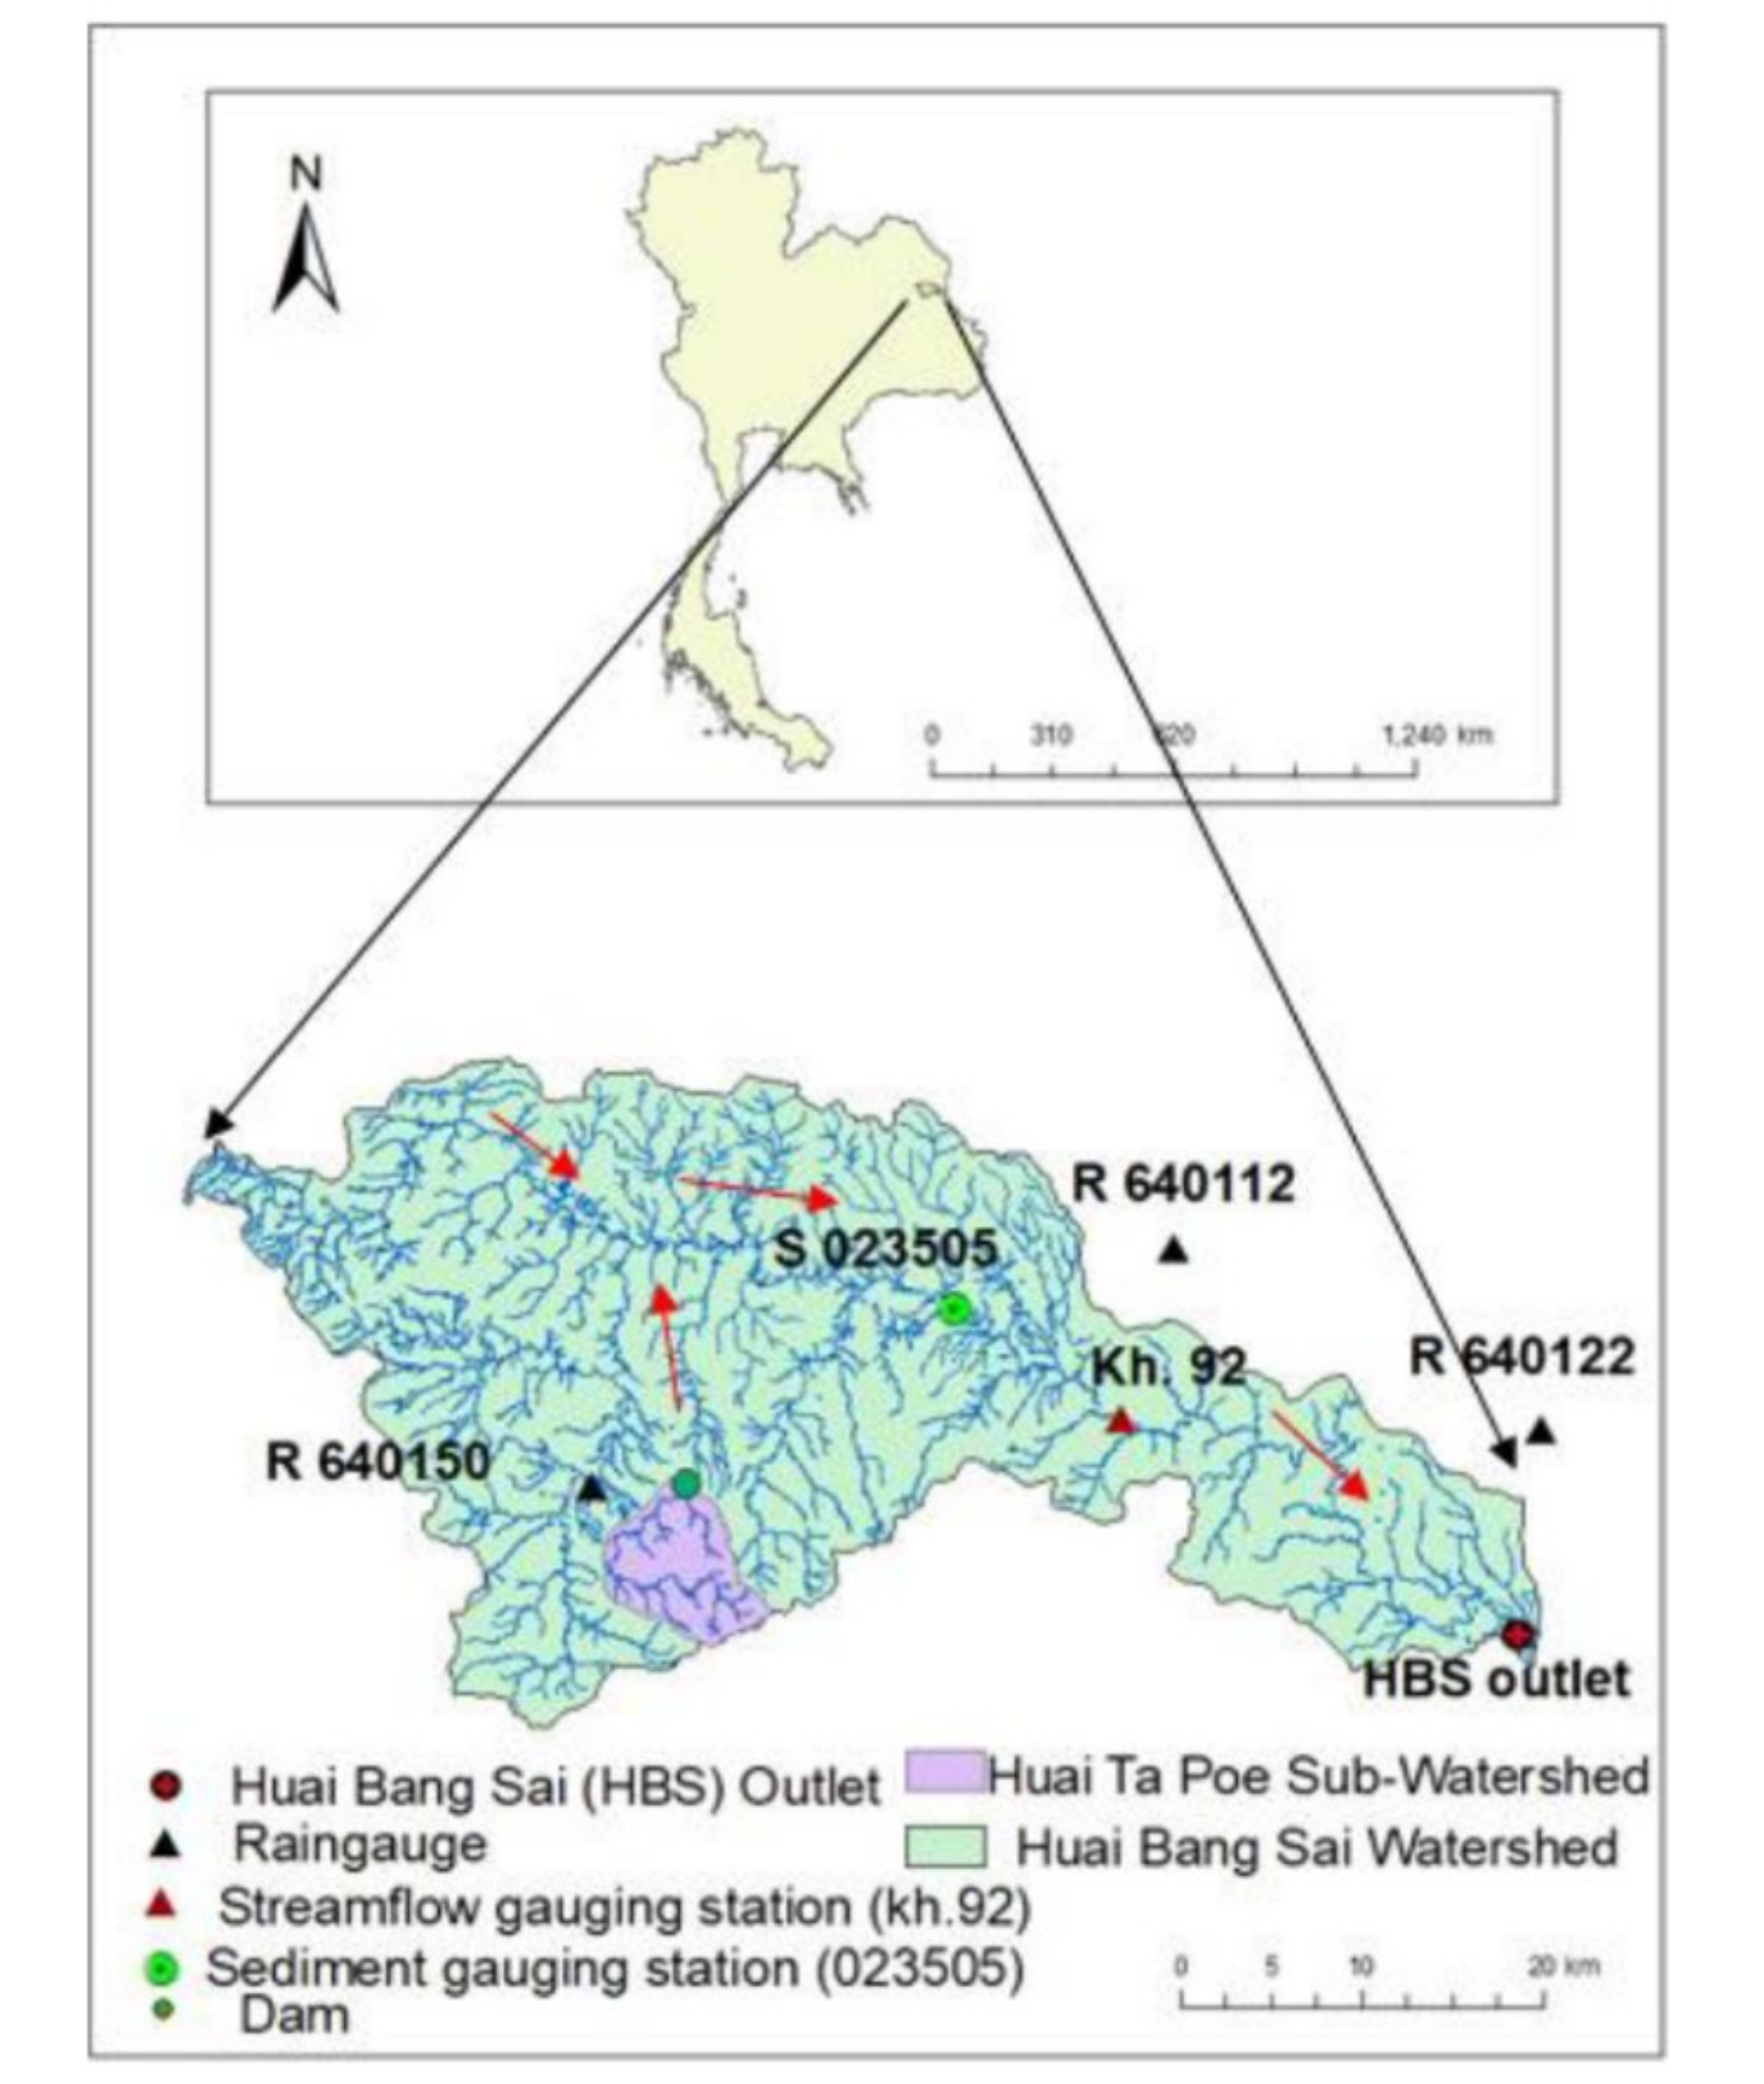
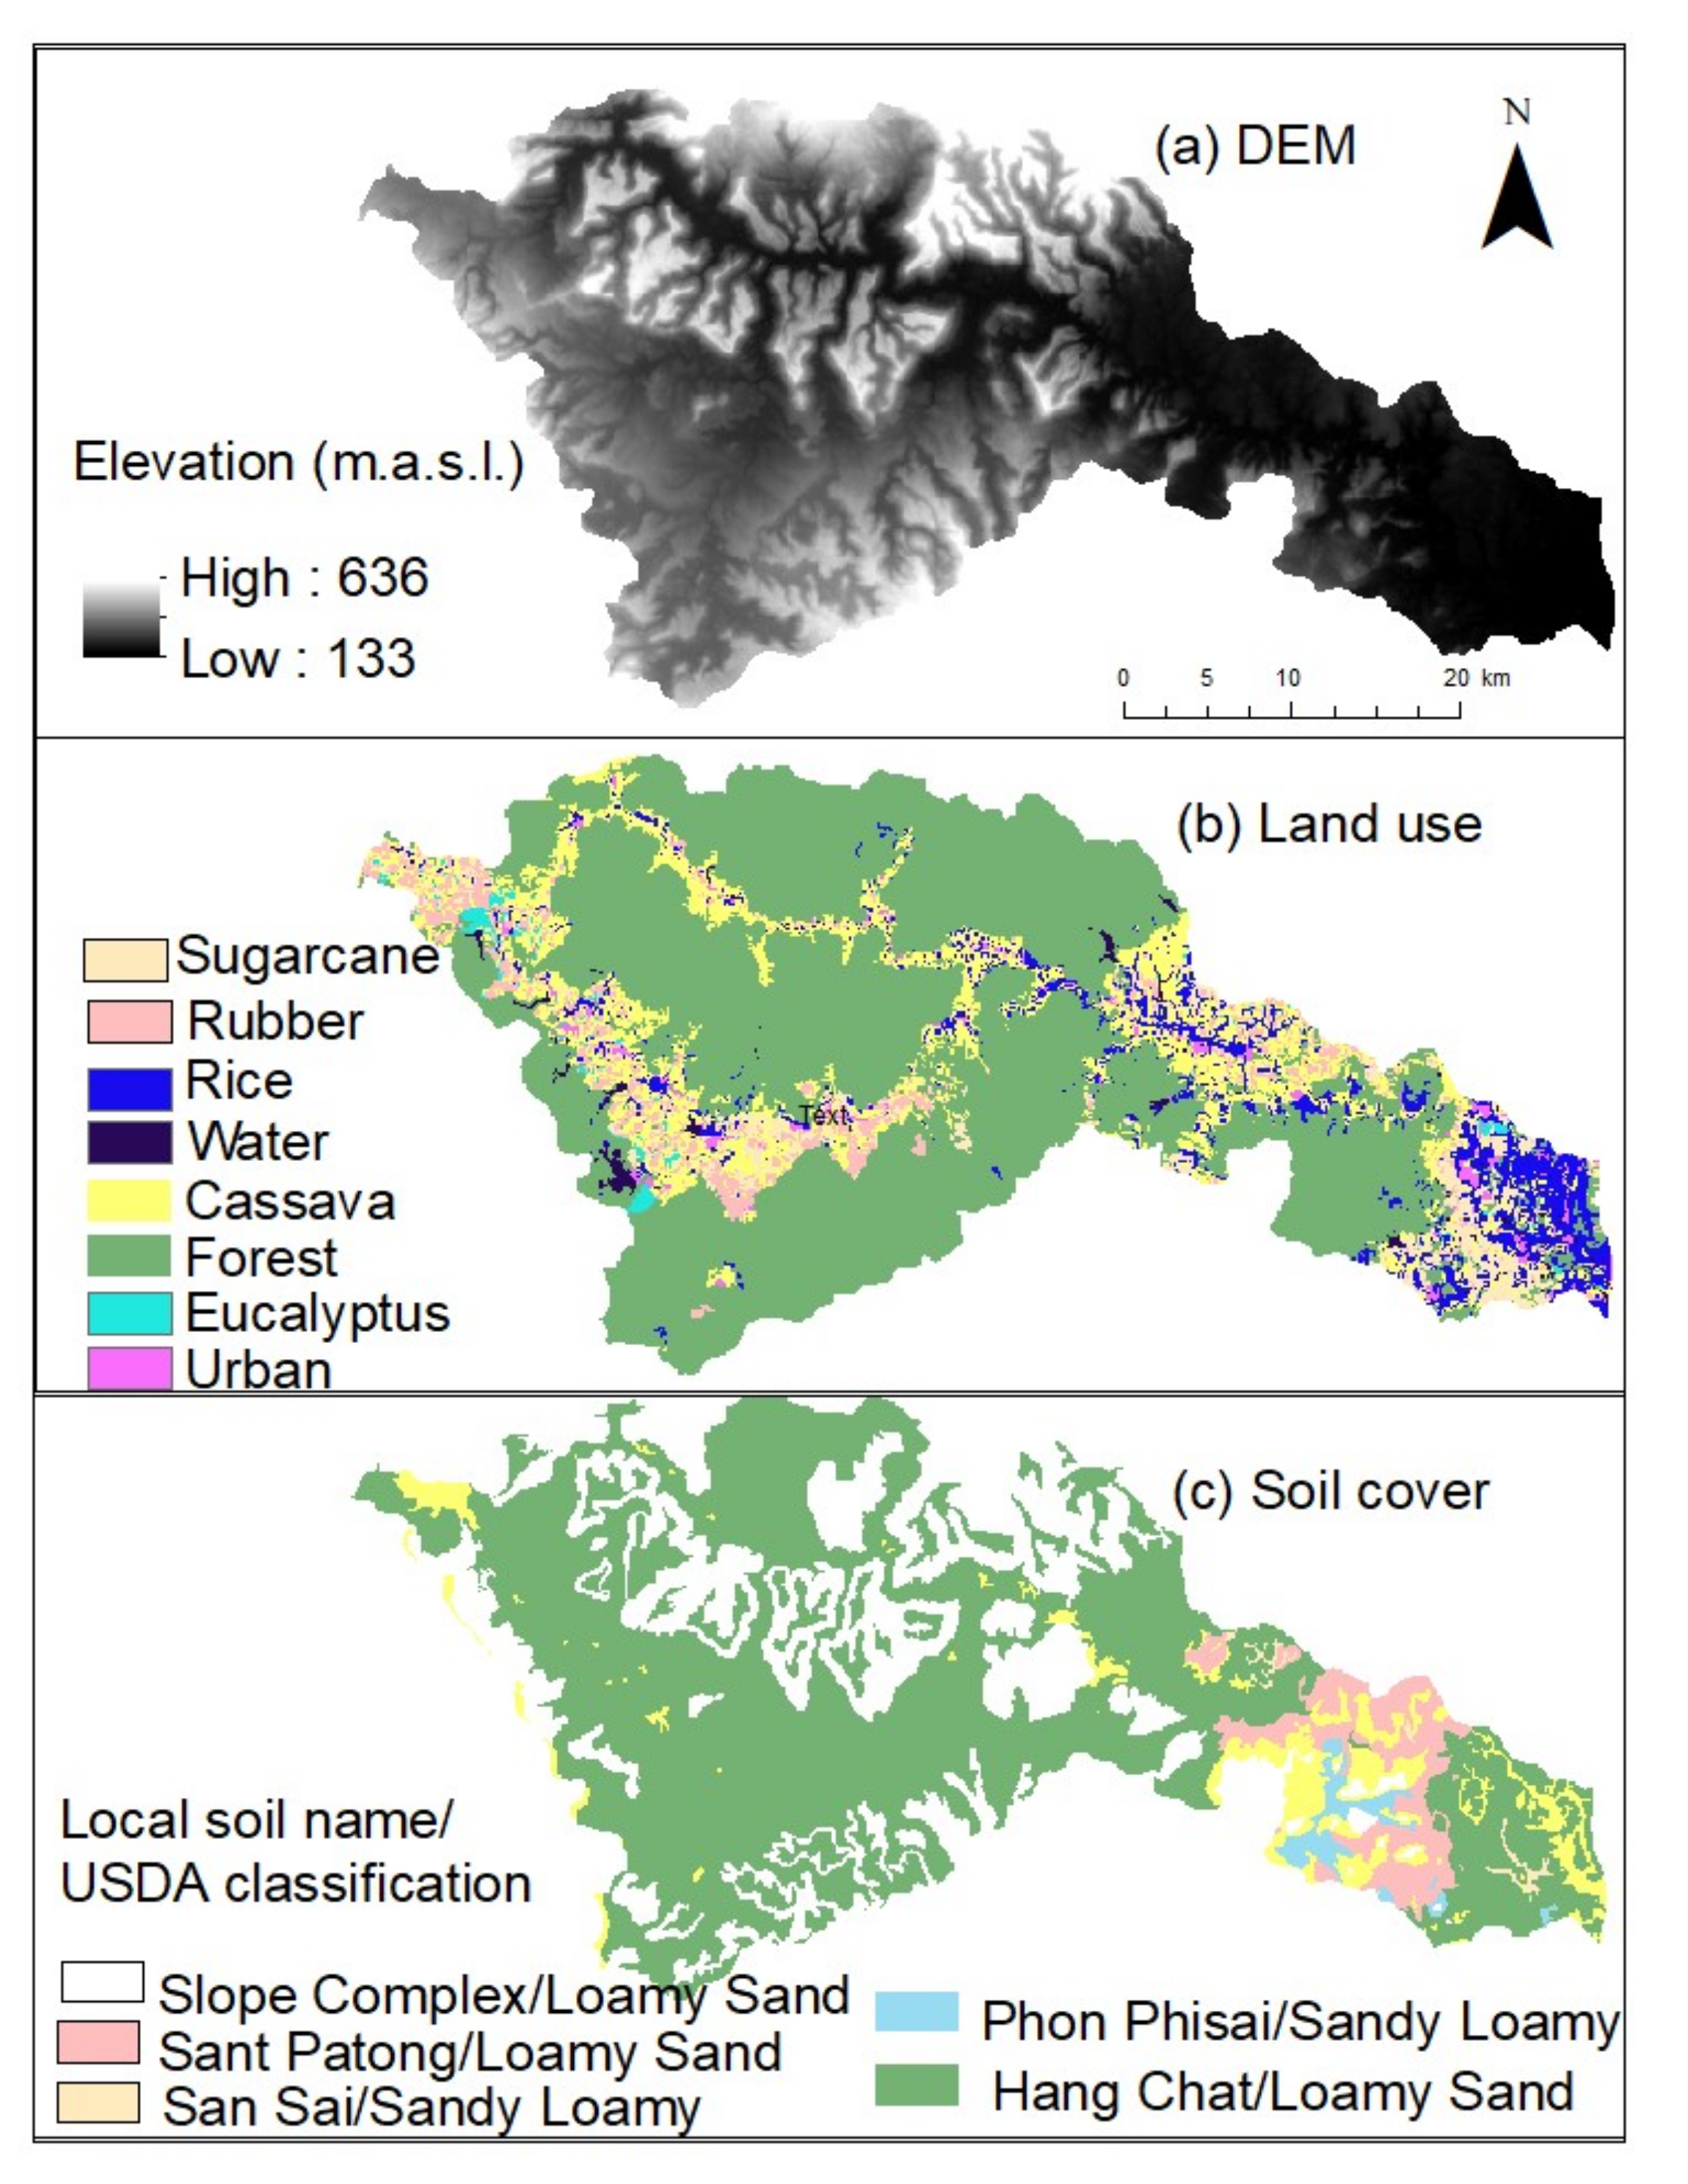
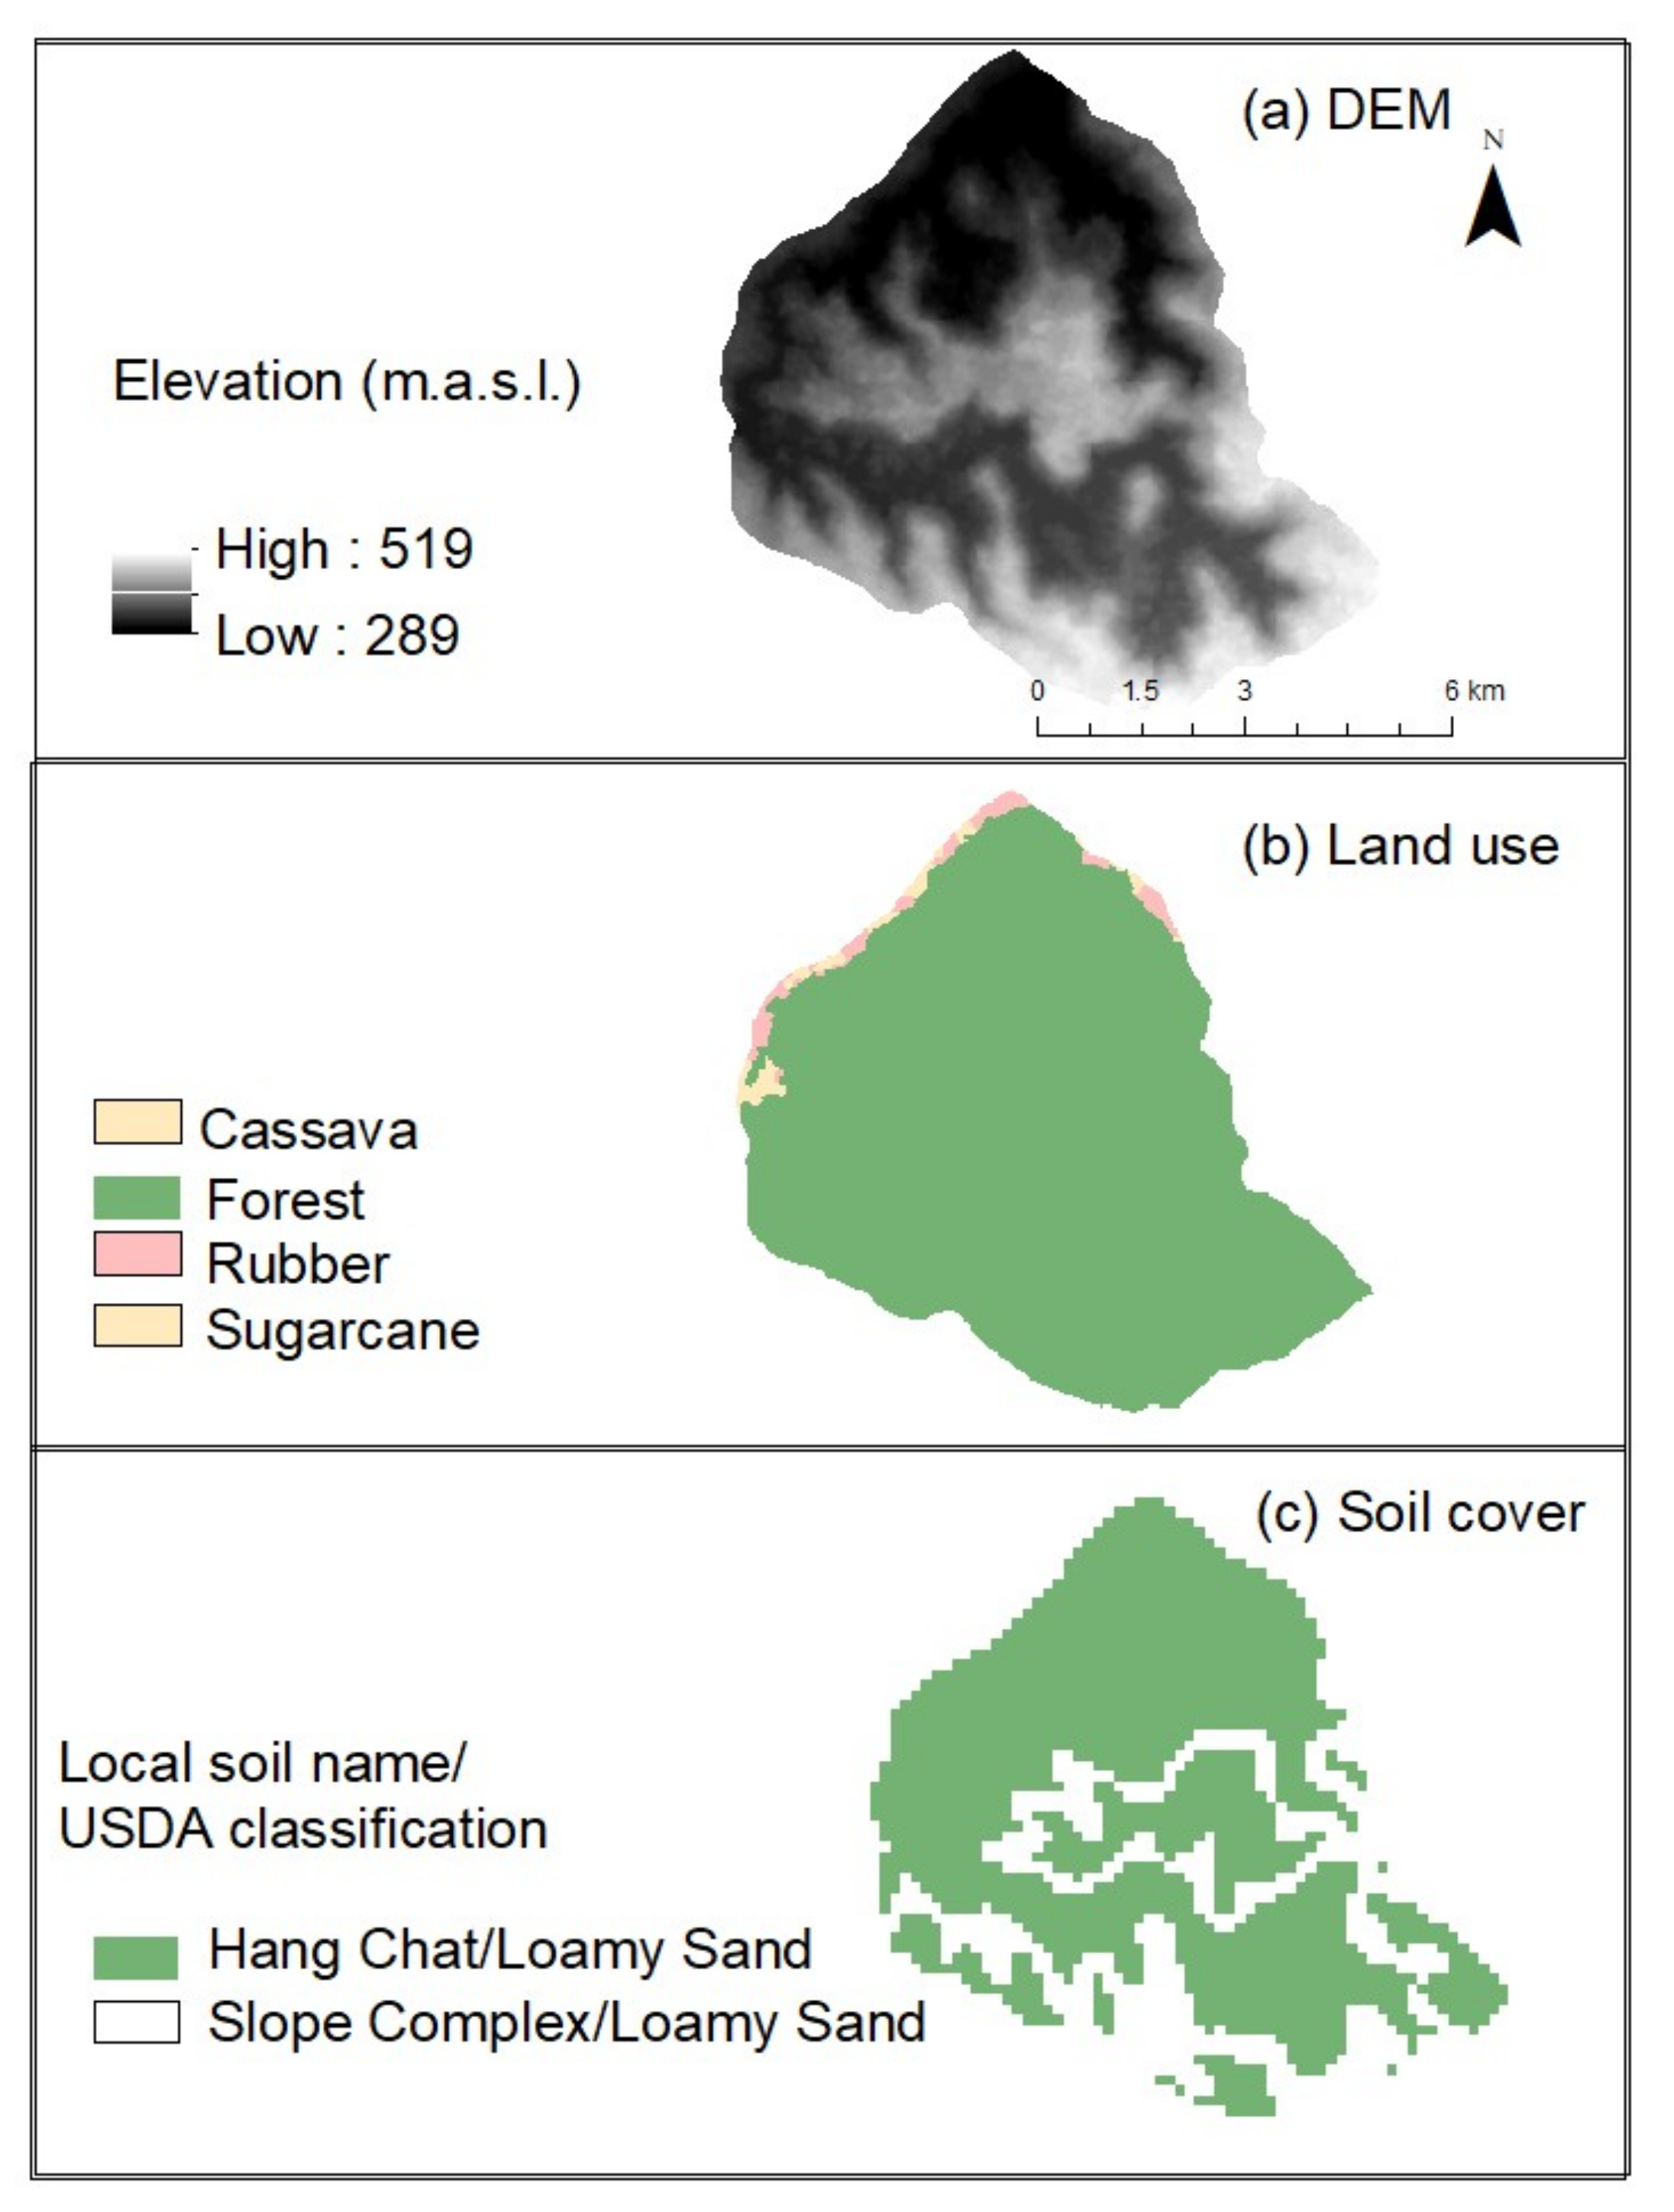
The Huai Bang Sai River Basin is a sub-catchment of the Mekong River. The study watershed, the Huai Ta Poe, is a sub-basin of the Huai Bang Sai, with a drainage area of approximately 1340 km2. The Huai Ta Poe watershed lies within 16°37′30′′–16°42′30′′ N and 104°15′30′′–104°20′30′′ E and drains an area of 48 km2 (refer to Figure 2). This watershed receives an average annual rainfall of 1200 mm [73]. Figure 3 and Figure 4 illustrate the topography (represented through the Digital Elevation Model or DEM (a)) and land-use (b) and soil types (c) in these two study areas. The dominant land-use type in the Huai Ta Poe is deciduous forest, which covers nearly 97% of the watershed (Figure 4b). The remaining land cover comprises cassava, sugarcane, and rubber cultivation. The altitude of the small watershed ranges from 289 m to 519 m above mean sea level (Figure 4a). The dominant soil type is Hang Chat, which has a loamy sand texture as per the United States Department of Agriculture (USDA) soil classification system.
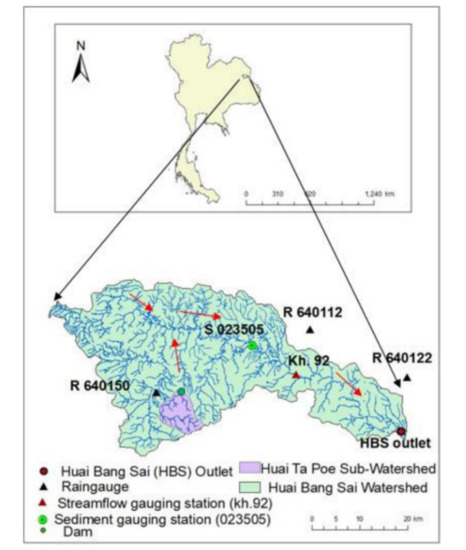
Figure 2.
Location map of Huai Bang Sai (HBS) and Huai Ta Poe watersheds and rainfall, streamflow, and sediment gauging stations.
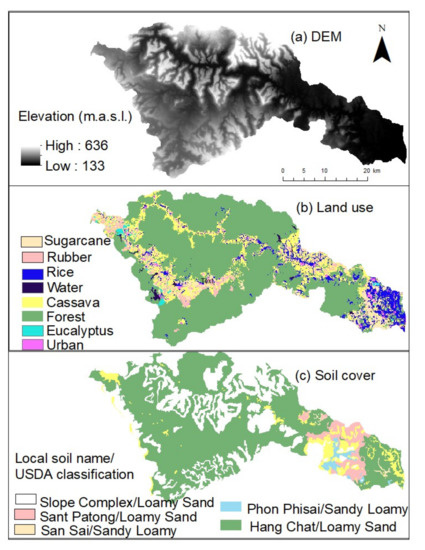
Figure 3.
(a) DEM, (b) land-use, and (c) soil cover maps of the Huai Bang Sai.
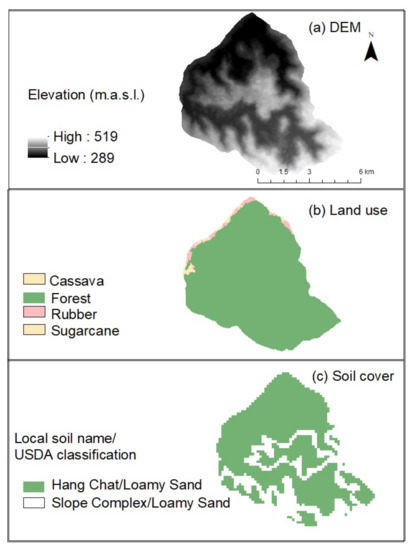
Figure 4.
(a) DEM, (b) land-use, and (c) soil cover maps of the Huai Ta Poe.
To increase water availability during dry spells, the Royal Irrigation Department (RID) of Thailand recently constructed a dam at the outlet of the Huai Ta Poe watershed. The dam at the full-supply level will facilitate storage of 20 million m3. The normal pool surface area is expected to be 3.44 km2. Through the development of this dam, nearly 320 households are expected to benefit. The reservoir area is home to nearly 109 species. Before the dam’s construction, 380 hectares of the land area were under cultivation during the dry season. It is expected that after the dam becomes operational, this area will increase to 1755 hectares [74].
2.2. Data
Table 1 presents the spatial and temporal data used in this study with their sources. The daily temperature data at Sakon Nakhon, Nakhon Phanom, and Nakon Phanom Agromet meteorological stations (2004–2014) were obtained from the Thai Meteorological Department (TMD).

Table 1.
Description of temporal and spatial data used in this study.
Daily rainfall data (for 2004–2014) at three stations with the station IDs 640112 (A. Dong Luang), 640122 (A. Wan Yai), and 640150 (A. Huai Ta Poe) were collected from the Royal Irrigation Department (RID) of Thailand. Daily streamflow data at Station kh.92 (Ban Kan Luang Dong, Dong Luang), draining an area of 1118 km2 (for 2007–2014), were also obtained from the RID. The daily suspended sediment data for Station 023505 (Ban Na Lak), with a drainage area of 918 km2 (for 2007–2014), were obtained from the Department of Water Resources (DWR). The drainage map of the Huai Bang Sai was collected from the Deutsche Gesellschaft für Internationale Zusammenarbeit (GIZ) office in Thailand. The Digital Elevation Model (DEM) of 30 m × 30 m resolution was downloaded from the United States Geological Survey website accessible through https://earthexplorer.usgs.gov/ assesed on 15 August 2017. Land-use data of 500 m resolution and scale of 1:50,000 and soil cover maps with 1 km resolution and scale of 1:100,000 for 2015 were obtained from the Land Development Department (LDD) of Thailand. Land-use data were reclassified according to SWAT land-use classification. To evaluate the effectiveness of EbAs for a longer period, the rainfall dataset was extended to 30 years using Asian Precipitation–Highly-Resolved Observational Data Integration Towards Evaluation of Water Resources (APHRODITE) [75]. Monthly observed precipitation data (from rain gauges) were compared with APHRODITE data for 2004–2014 (11 years). APHRODITE rainfall data were comparable with observed rainfall (R2 = 0.55) from 2004 to 2014, barring a few months in 2004. Overall, a strong correlation (R2 = 0.72) exists between APHRODITE and observed rainfall data for 2005–2014 (refer to Figure A1 in Appendix A).
2.3. SWAT Model
SWAT [50] was developed by the Agricultural Research Services of the USDA. Its availability in the public domain, as well as its robust algorithms used to simulate hydrologic processes, sedimentation, and nutrient-simulating mechanisms, and its user-friendly GIS interface, have increased the use of SWAT worldwide [76,77]. This physically based and semi-distributed model is operated on daily time scales. Unique features of topography, land use, and soil are lumped into spatial units called hydrological response units (HRUs), which are the finest level of simulation in SWAT. The main underlying equation of the model is the water balance of the system given by Equation (1),
where is the final water content (mm), is the initial water content (mm), t is time in days, is the amount of precipitation on day i (mm), is the amount of surface runoff on day i (mm), is the amount of evapotranspiration on day i (mm), is the amount of water entering the vadose zone from the soil profile on day i (mm), and is the amount of return flow on day i (mm) [78].
In the SWAT model developed in this study, surface runoff was predicted by the Soil Conservation Service Curve Number (SCS-CN) method, sediment yield was calculated by the Modified Universal Soil Loss Equation (MUSLE), and potential evapotranspiration was calculated by the Hargreaves method [78]. The current version of the SWAT model uses a simplified version of Bagnold’s stream power equation to route sediment in the channel [79]. The maximum amount of sediment that can be transported from a reach segment is a function of the peak channel velocity. Sediment transport in a channel network is a function of two processes, degradation and aggradation (i.e., deposition), operating simultaneously in the reach [78]. The MUSLE equation is given by Equation (2).
where Sed is the sediment yield (in metric tons) on a given day, is the surface runoff volume in mm/ha, is the peak runoff rate in m3/s, is the area of the HRU (ha), is the soil erodibility factor, is the cover management factor, is the support practice factor, is the topographic factor, and CFRG is the coarse fragment factor [78]. The values of and were directly imported by the model from the built-in crop database in the SWAT modeling framework, as presented in Table 2. The soil erodibility factor () of the soil types in the study watershed was obtained from Paiboonsak et al. [80]. The slope length and gradient factor () was calculated by the model using the Digital Elevation Model (DEM) of the Huai Bang Sai.

Table 2.
Land-use type and corresponding and values from the SWAT model database [78].
2.4. Watershed Model Development
The SWAT 2012 version was used to develop the watershed model in this study. The Huai Bang Sai was delineated into 7 sub-watersheds, and a total of 797 HRUs were created. The Huai Ta Poe was delineated into 25 sub-watersheds, and a total of 215 HRUs were generated. The SWAT model was calibrated and validated for the Huai Bang Sai Basin. The first three years (2004–2007) of the simulation period were treated as a warmup period to equilibrate various water storages in the hydrological cycle. The model was calibrated for streamflow at Station kh.92 and sediment yield at Station 023505 (refer to Figure 2). Due to a shorter data availability period, the calibration period was 2007–2010 (4 years), and the validation period was 2011–2014 (4 years) for streamflow. Similarly, sediment yield was calibrated for 3 years (2007–2009) and validated for 4 years (2011–2014). Calibration was carried out by following the guidelines provided by Neitsch et al. [78] and Jha et al. [81]. The analysis of the land-use maps of the Huai Bang Sai between 2004 and 2015 shows that land use and land cover remained relatively unchanged. In the current study, the model’s parameters were varied within acceptable ranges to match observed and simulated runoff. The SWAT Calibration and Uncertainty Procedures (SWAT-CUP) [82] were used initially to conduct a sensitivity analysis of the model’s parameters in the study area, followed by manual calibration and validation of the model for runoff and sediment yield. In the manual procedure, the calibration of the watershed’s water balance components on a long-term basis was performed, followed by annual and monthly comparisons of simulated and observed streamflow. The variations in CN and SOL_AWC with respect to default values are comparable to Homdee et al. [29], who calibrated the SWAT model for a neighboring sub-basin in northeastern Thailand. The values obtained in this study during the calibration of the groundwater parameters, including ALPHA_BF and GW_REVAP, are similar to the calibrated values for the Chi-River Basin in northeast Thailand by Kheereemangkla et al. [16]. In the current study, the default values of SPEXP and SPCON were kept unchanged, since this combination gave the best match of simulated and observed suspended sediment. Phomcha et al. [67] obtained 0.0001 for SPEXP and 1 for SPCON for a tropical river basin in Northern Thailand. These values are also similar to the calibrated values obtained by the simulation of sediment in the current study.
The parameters calibrated for the Huai Bang Sai Basin were then transferred to the Huai Ta Poe watershed. This was done because of the non-availability of data for the smaller watershed for calibration and validation. Furthermore, since this small Huai Ta Poe watershed is within the Huai Bang Sai watershed, it is assumed that the calibrated model for Huai Bang Sai will perform well within the calibration accuracy across the whole watershed. This watershed (the Huai Ta Poe) was selected to further analyze various watershed degradation scenarios and EbA-based options and their impacts on soil and water resources in the watershed. The calibrated model was executed for 30 years (1985–2014) to conduct a long-term assessment of the impacts. Rainfall data from APHRODITE for 19 years (1985–2003) and from rain gauges for 11 years (2004–2014) were used in the analysis.
2.5. Watershed Degradation (Land-Use Change) Scenarios
The government of Thailand has been promoting bioethanol and biodiesel through the Alternative Energy Development Plan 2015–2036 [83]. Oil palm, cassava, and sugarcane are the most favored crops in the rain-fed areas of northeast Thailand and are used to produce bioethanol and biodiesel [29,84]. To meet the rubber demand in the world market and increase farmers’ income, the Thai government has initiated several projects [85]. Hence, for this study, we developed seven watershed degradation (land-use change) scenarios replacing forested land with cassava, sugarcane, and rubber plantations individually and in combinations, considering the prevailing and expected trends in the country. The watershed degradation scenarios are presented in Table 3.

Table 3.
The Huai Ta Poe watershed degradation scenarios.
These land-use change scenarios were designed according to the crop suitability criteria (available in literature) based on land slope, soil depth, and soil texture. The minimum soil depth required for rubber plantations is 1 m [86,87,88]. Rubber plantations can be carried out on slopes up to 20% [88]. The soil types preferred to grow rubber are clayey characteristics such as clay loam and sandy clay loam. Sugarcane favors loamy soils in slopes less than 5% and soil depths of more than 1 m [89,90,91]. The minimum soil depth required for cassava plantation is 1.5 m, and the suitable soil type is loamy sand soil. Similarly, the most suitable slope for cassava plantation is less than 15% [92]. Table A1 in the Appendix A provides land areas under different watershed degradation scenarios.
2.6. Ecosystem-Based Adaptation (EbA) Measures
Five sediment-focused management practices, including reforestation, filter strips, contouring, terracing, and grassed watersheds, were used (individually or in combinations) to develop seven EbA scenarios, as presented in Table 4.

Table 4.
Description of EbA scenarios.
The selected EbA measures are feasible and applicable in the study area. Table 5 provides the list of adaptation measures with the modeling approach adopted in the study. Brief descriptions of the adaptation measures are presented in the Appendix A.

Table 5.
Representation of EbAs in the SWAT model.
3. Results and Discussion
3.1. Watershed Model Calibration and Validation
3.1.1. Streamflow
Manual calibration was performed, which included the calibration of the watershed’s water balance on a long-term basis, followed by annual and monthly comparisons of simulated streamflow with the observed data. The CN was adjusted within the range of ±5% to the model’s default values. The SOL_AWC factor, which controls the available soil water capacity, was adjusted between ±0.04 from the model’s default values. The ESCO factor, a parameter that controls depth distribution to meet the soil evaporative demand to account for the effects of capillary action, was adjusted within 0.7 to 0.95. Groundwater flow-related sensitive parameters were GW_REVAP, ALPHA_BF, GW_DELAY, and GWQMN. GW_REVAP allows water to move to the overlying saturated/vadose zone from the underlying aquifer. Similarly, the model parameter GW_DELAY controls the delay between water entering the soil profile and the underlying aquifer. GWQMN is the threshold depth of water in a shallow aquifer required for return flow to occur [78]. Table 6 lists the flow-related parameters, varied within their acceptable ranges, with their final calibrated values.

Table 6.
Adjusted range of parameters for streamflow calibration and their final values in the Huai Bang Sai River Basin.
The annual average values of water balance over 30 years (1985–2014) suggest that the developed SWAT model was capable of simulating hydrologic processes accurately in the Huai Bang Sai River Basin. The evapotranspiration simulated in the current study accounts for 49% of the total rainfall, which is consistent with a previous study conducted by Babel et al. [99] using the SWAT model for the Khlong Phlo Watershed in Thailand. Surface runoff accounts for 18% of the water balance in the Huai Bang Sai, similar to the study conducted by Sudjarit et al. [100], which used the SWAT model in Northern Thailand.
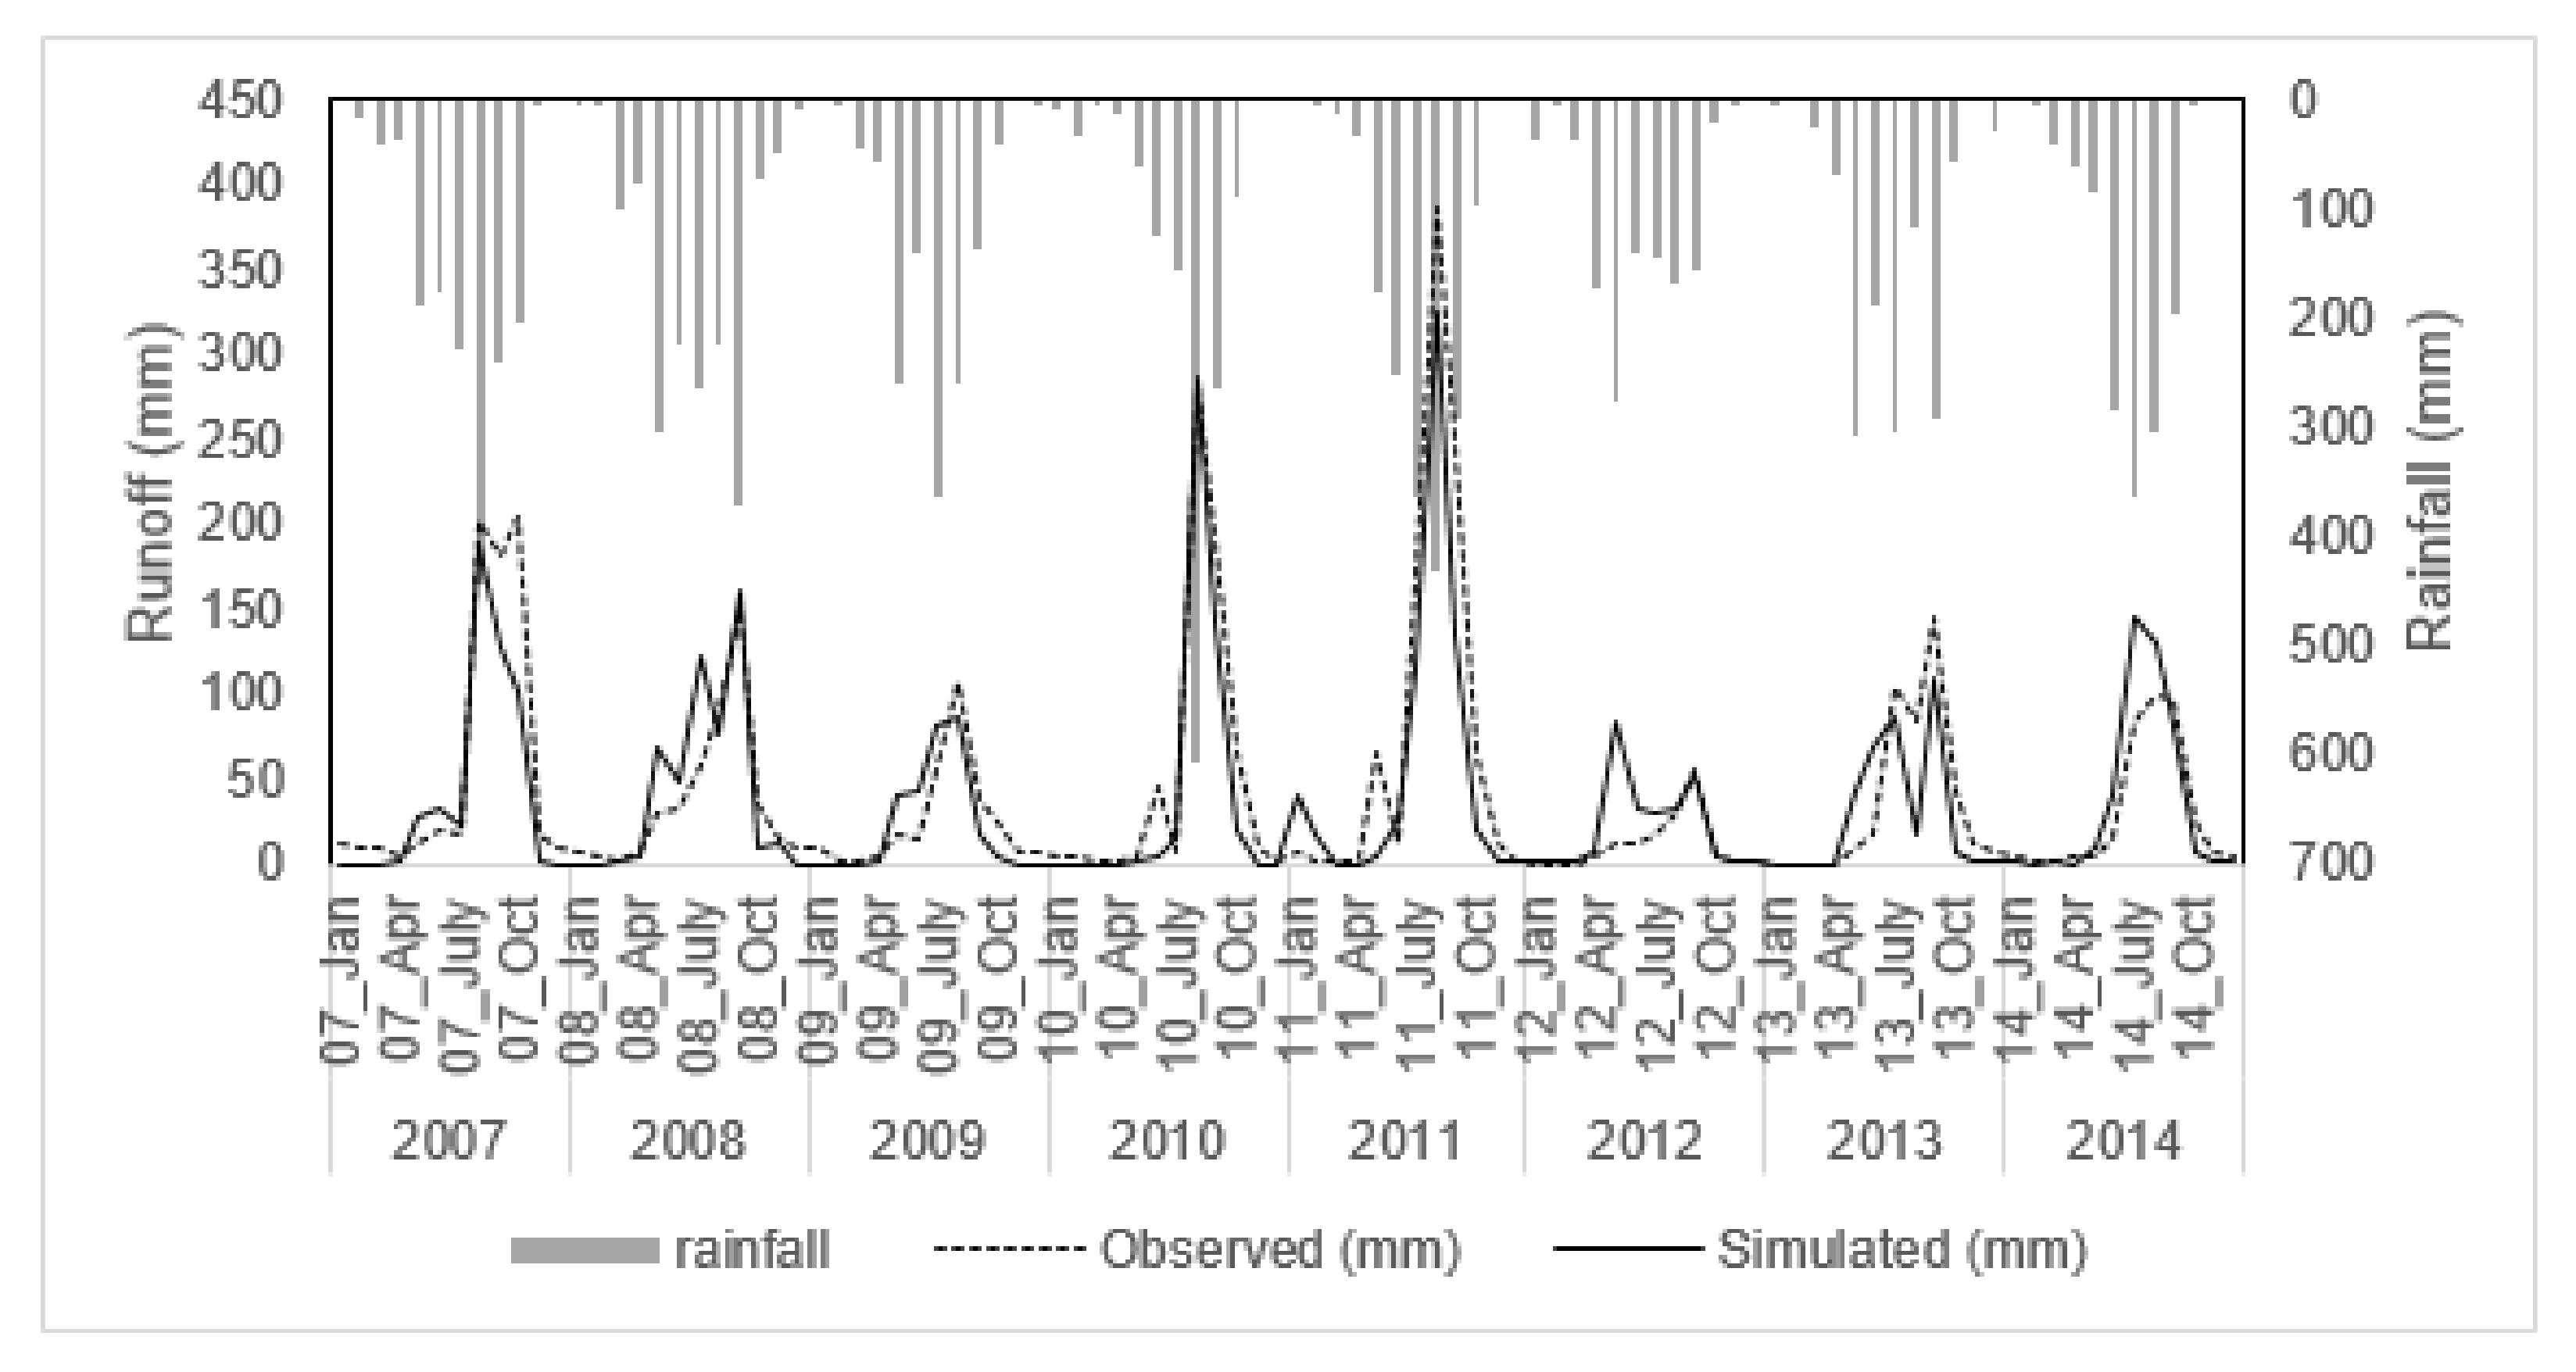
Overall, the model developed in the current study can simulate hydrologic responses very well and thus can be used confidently to simulate water balance components under various scenarios in the study basin. Figure 5 shows the comparison of simulated and observed monthly runoff at Station kh.92 (refer to Figure 2) during the calibration (2007–10) and validation periods (2011–2014).
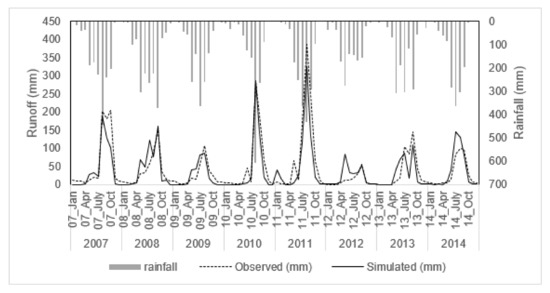
Figure 5.
Monthly hydrograph for calibration (2007–2010) and validation (2011–2014) at Station kh.92.
Visual observation also confirmed a good match between the simulated and observed runoff, but with some discrepancies. A statistical evaluation was performed using the coefficient of determination (R2) and Nash-Sutcliff’s Efficiency (NSE). The R2 and NSE values of 0.83 and 0.82 during the calibration period and 0.78 and 0.77 during the validation period, respectively, were obtained. These strong correlations suggest that the model is capable of tracking monthly runoff with an acceptable accuracy [101].
3.1.2. Sediment
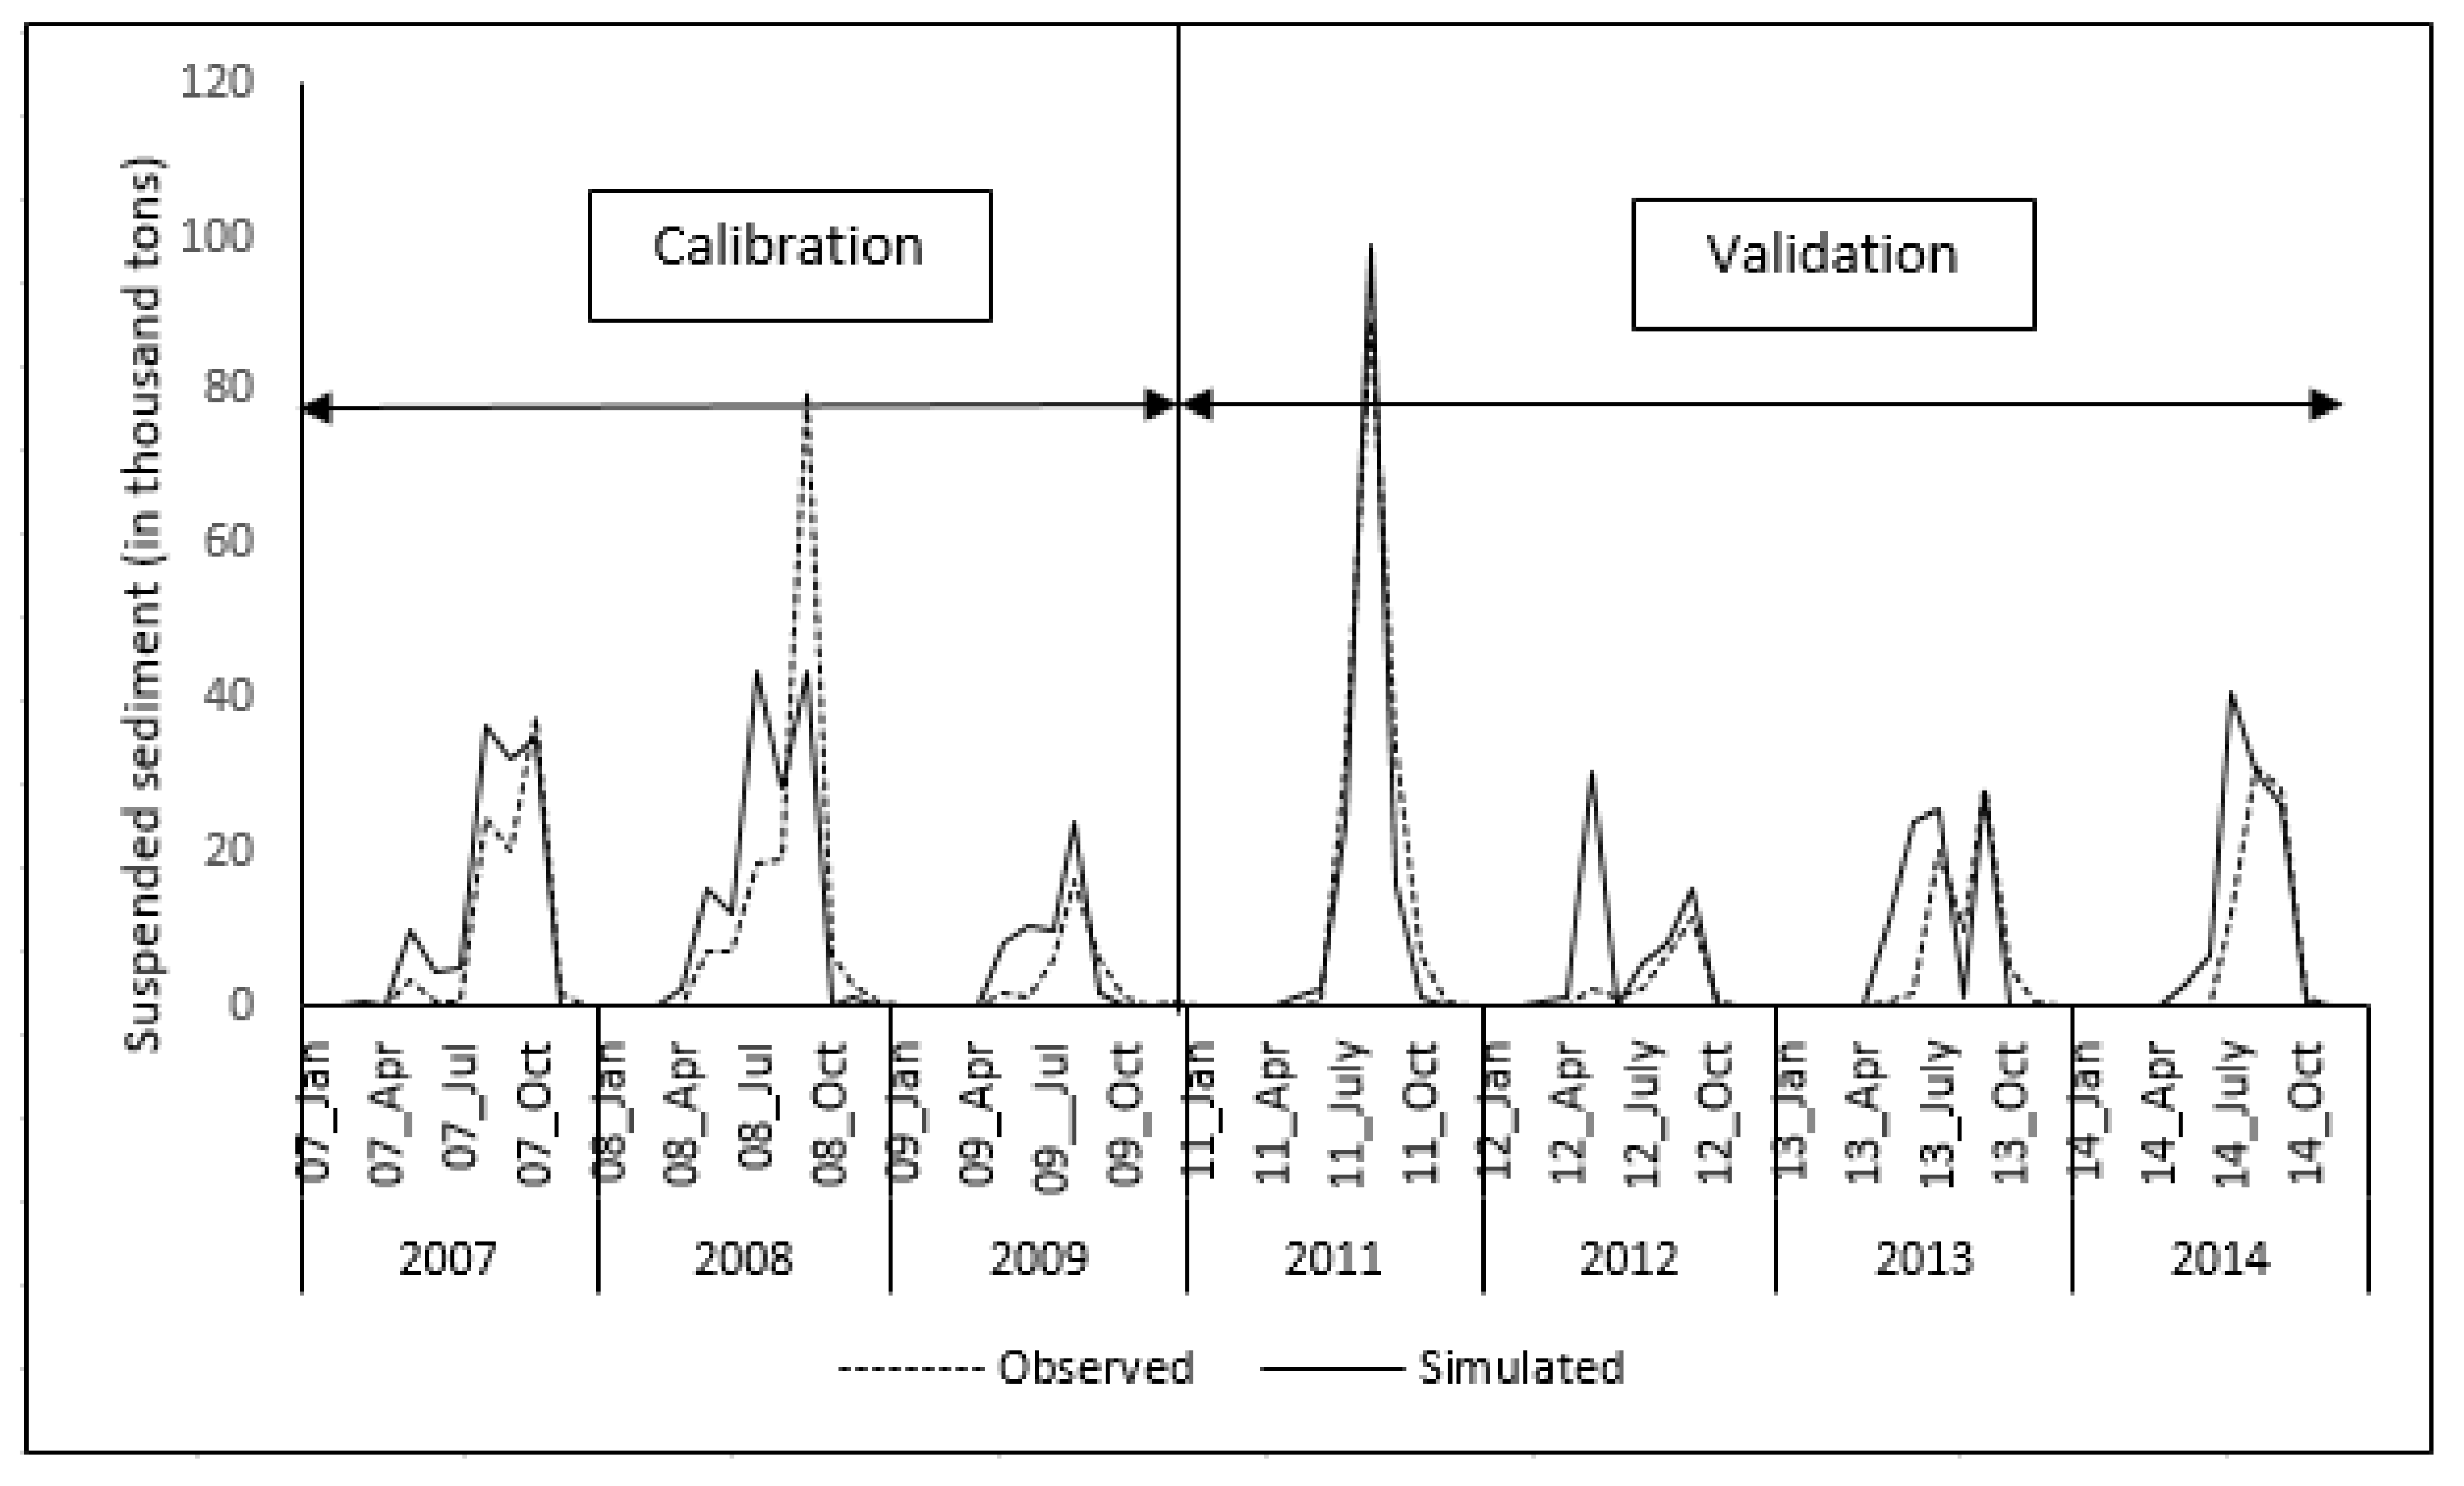
Soil erosion is driven by the amount and intensity of rainfall and sediment yield from surface runoff in HRUs. Since the model was already calibrated, as presented earlier, for base-flow and surface runoff, the calibration of sediment mainly focused on the routing process. The literature suggests two sensitive parameters—the linear parameter (SPCON) and the exponent parameter (SPEXP)—for calculating sediment re-entrained in the channel [78]. Sediment routing was used to match the observed suspended sediment load and simulated sediment loads [67,102,103]. The model’s default values of SPCON (=0.0001) and SPEXP (=1) were found to provide the best match between observed and simulated monthly sediment yields. These two parameters govern the maximum amount of sediment that can be re-entrained during channel sediment routing [79]. Figure 6 compares simulated and observed sediment loadings on the monthly scale at Station 023505 (refer to Figure 2).
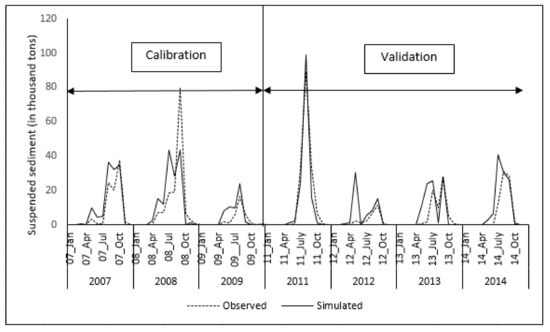
Figure 6.
Monthly sediment calibration (2007–2009) and validation (2011–2014) at Station 023505.
Statistical evaluation yielded R2 and NSE values of 0.82 and 0.68, respectively, during calibration and 0.80 and 0.74, respectively, during the validation period (2011–2014). The performance statistics are within an acceptable range [101]. The relatively inadequate prediction of sediment yield can be attributed to several factors, including inaccuracies in DEM when calculating the topographic factor [99] and inaccuracies in predicting peak runoff, which was used in Bagnold’s equation for sediment prediction [78].
3.2. Analysis of Degraded Watersheds
Land slope conditions, soil texture, and soil depths are the bio-physical factors considered to allocate land for the three most commonly grown crops (rubber, sugarcane, and cassava) in the region (refer to Table 3). Table 7 presents the SWAT-simulated sediment yield and the calculated deposition of sediment in the Huai Ta Poe watershed under different land-use scenarios. The sediment yield was lower in LU S1 than LU S0 even though the LU S0 has a higher forested area. The crop database used in the model has the same cover management factors (C) for forests and sugarcane. However, the change of forest area into sugarcane was based on slope and the soil type, which adopted different soil erodibility factor (K) and length slope (LS) factors. So, the combination of these complex changes may have contributed to a slightly lower sediment yield of 2.1 tons/ha/year in LU S1 compared to 2.3 tons/ha/year in LU S0.

Table 7.
Simulated sediment yield in HRUs, sediment outflux at the outlet, and calculated sediment deposition under different land-use change scenarios.
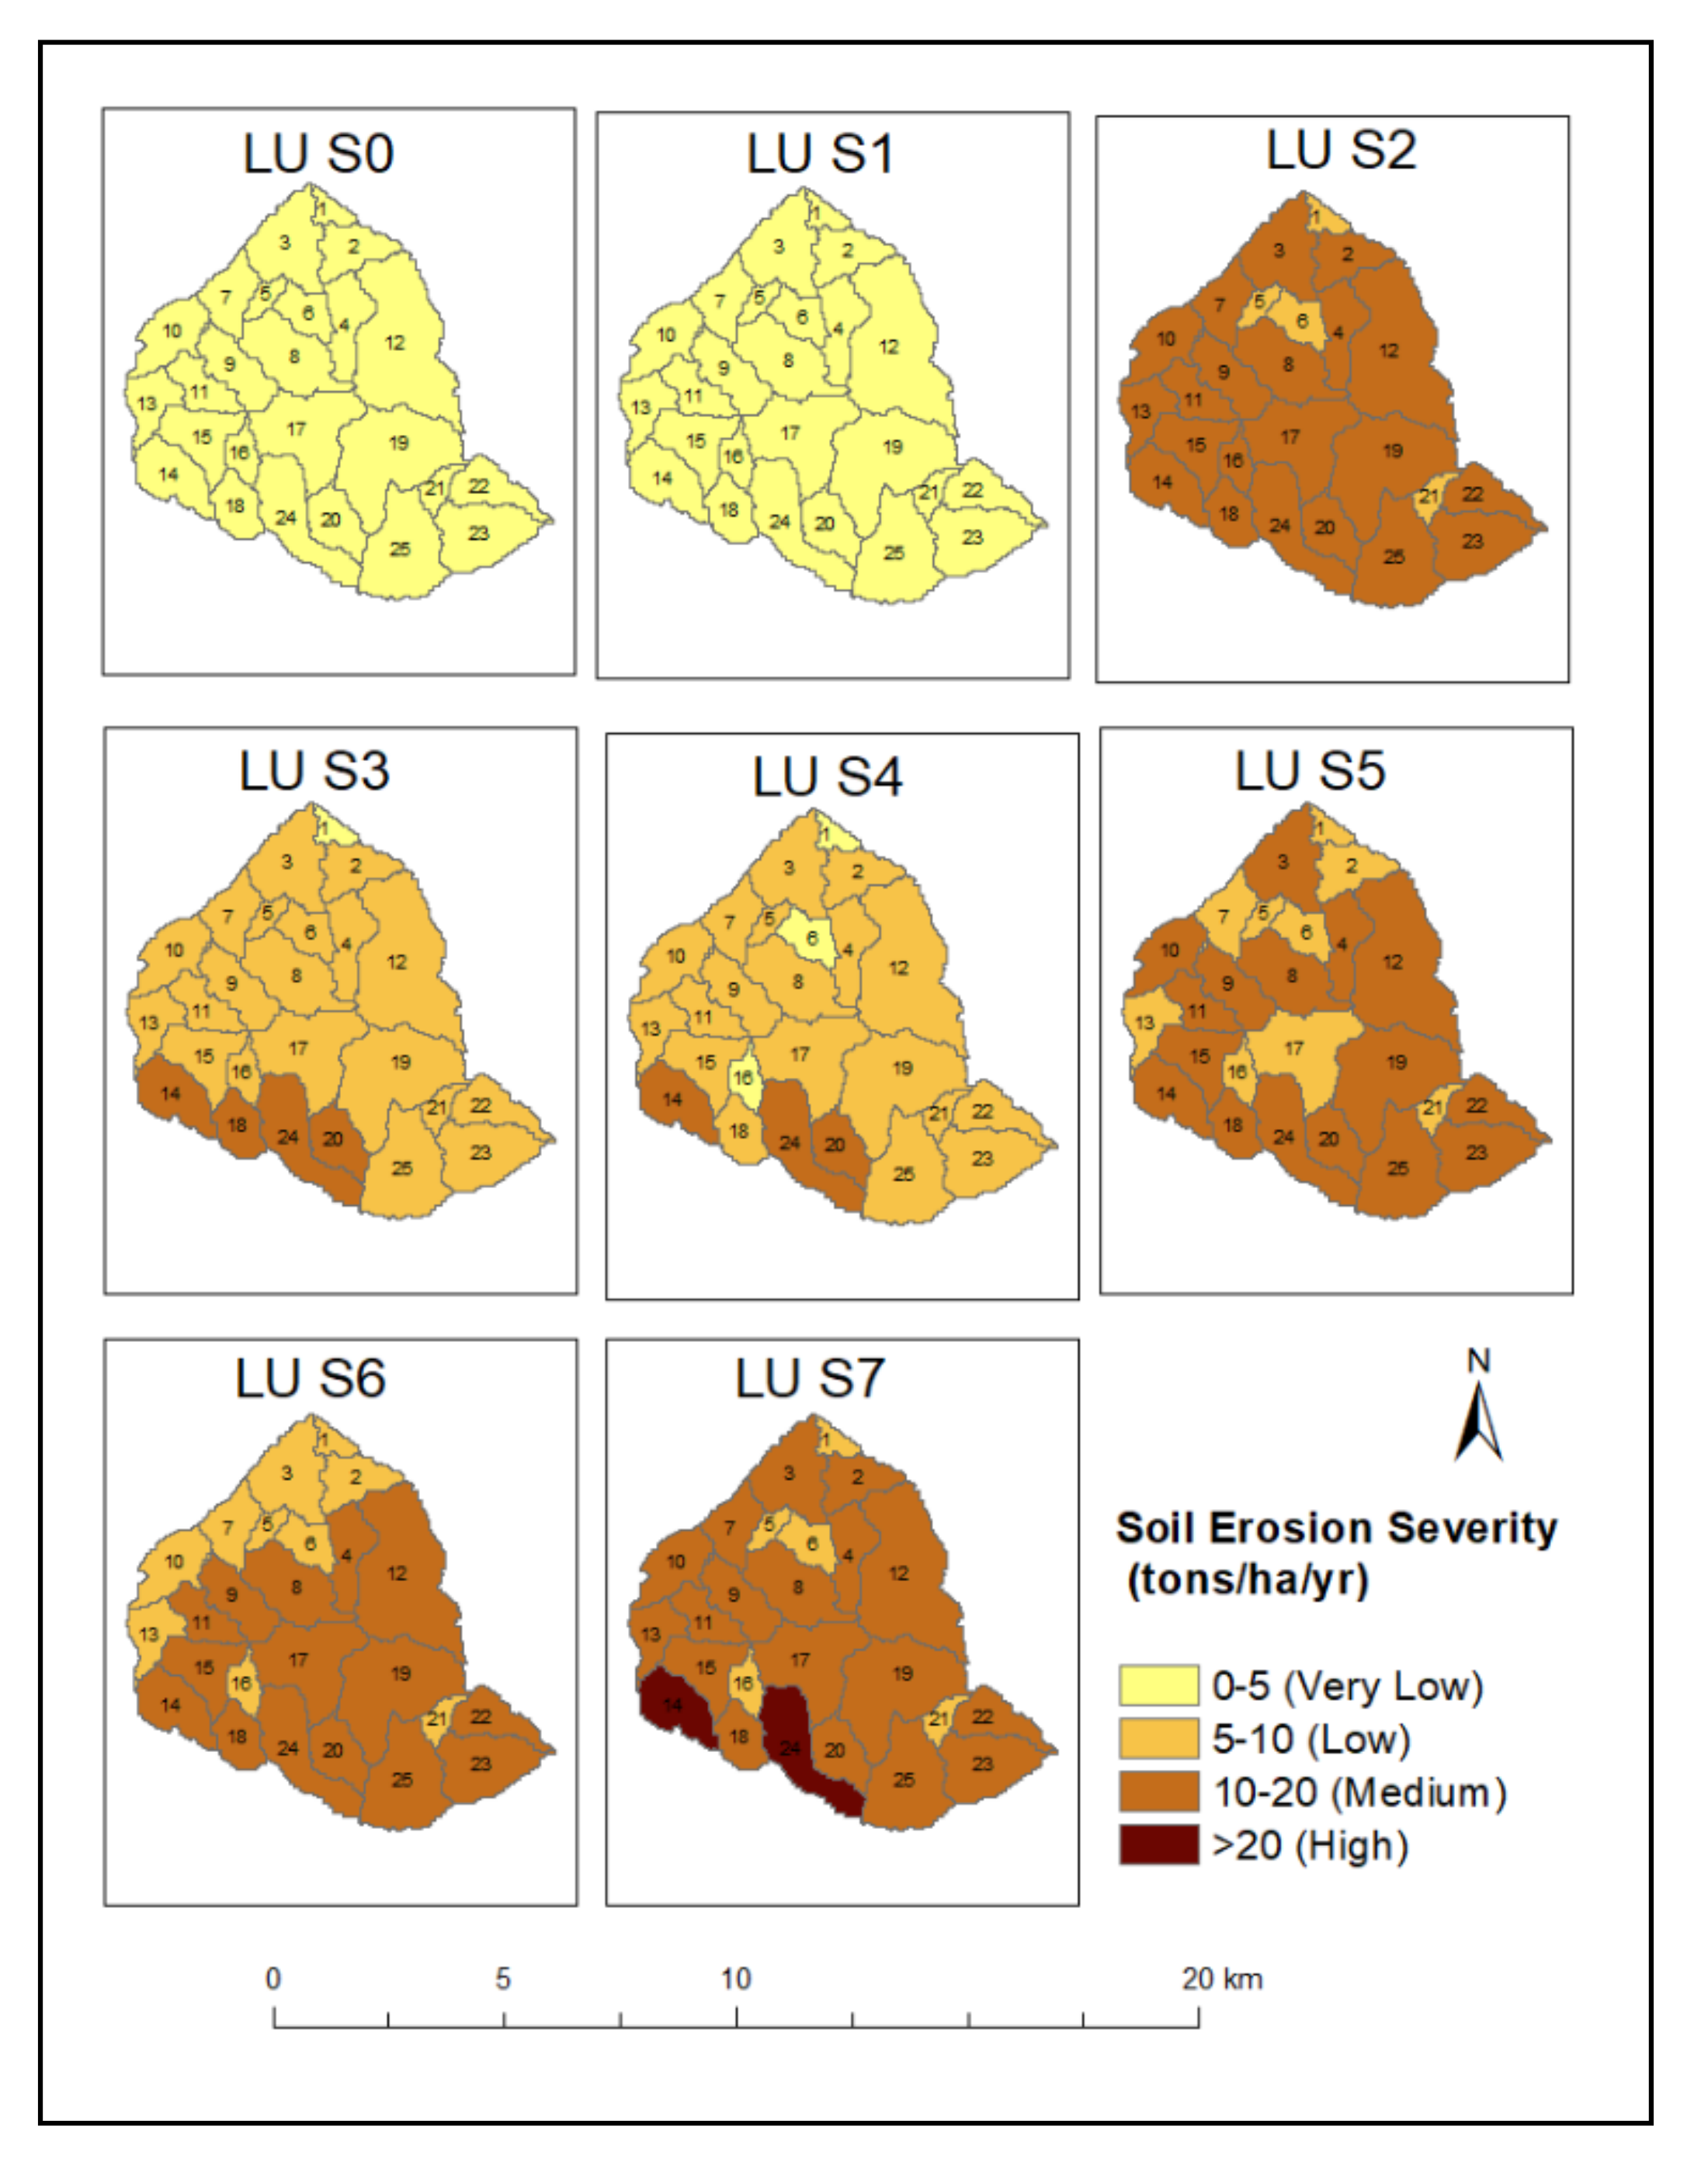
High erosion rates were found under scenarios LU S2, LU S5, LU S6, and LU S7, with cassava cultivation as one of the land uses. Cassava may have caused high soil erosion rates due to its low leaf area index. The low soil coverage during the first three months and during peak growth can cause high erosion rates when exposed to direct rainfall [104,105]. Through experimental observations, Putthacharoen [106] and Putthacharoen et al. [107] demonstrated that, under the soil and climatic conditions of Thailand, cassava causes threefold erosion as compared to maize, sorghum, and peanut. In another modeling study in the Khlong Phlo watershed in Thailand, Babel et al. [99] found that the highest soil erosion rates occurred with 40% of total land used for cassava cultivation. Scenario LU S5 (42% land used for cassava and 22% for sugarcane) and LU S6 (44% for cassava and 33% for rubber) had similarly significant erosion rates of about 56 thousand tons annually. Scenario LU S7 includes all land types (23% for sugarcane, 42% for cassava, 41% for rubber, and 21% for forest) depending on suitable land slopes and other factors. This scenario gives rise to the most degraded watershed, with an annual average erosion rate of 13.5 tons/ha.
Field experiments have shown that the leaf area index (LAI) of sugarcane in tropical regions is around 4.50 [108]. Previous studies have demonstrated that, on average, the LAI of young and old rubber trees is 2.2 and 3.1, respectively [109]. In the early stages of a cassava plant’s life cycle, its LAI is 0.2 [110]. In Thailand, Chanthorn et al. [111] reported that the LAI for very young forests is around 3.80. A higher value of LAI in sugarcane compared to forests might be attributed to the lower amounts of sediment yield produced through LUS1 than LU S0, as depicted in Table 7.
Figure 7 provides the spatial distribution of the severity of soil erosion under different land-use scenarios analyzed. Additionally, Table A2 in the Appendix A provides the land area (in %) under different soil erosion severity classes as defined by [112]. LU S7, in which areas under sugarcane, cassava, and rubber cultivation are expanded, and the minimum area is kept for the deciduous forest, generates the maximum amount of erosion, with 93% of the land area falling under medium and high erosion severity classes. These upland crops enhance soil erosion and sediment transport. As expected, the least erosion happens in LU S0 and LU S1 (maximum area under deciduous forests in these two land-use scenarios), and the total land area in the Huai Ta Poe comes under a very low (0–5 tons/ha/year) erosion severity class (refer to Figure 7).
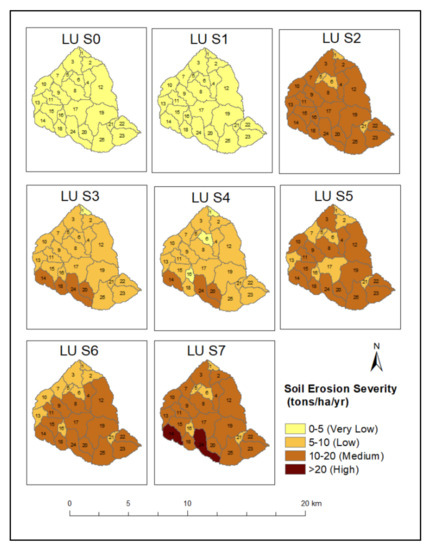
Figure 7.
Soil erosion severity in the Huai Ta Poe under different land-use scenarios.
3.3. Evaluation of EbA Measures
Land-use scenario LU S7 has the highest erosion rate. Several individual and combined EbA measures, as described earlier, were applied to this degraded watershed to examine the potential impacts of these adaptation measures. Scenario EbA S0 (same as LU S7) was used as the baseline to compare other EbA-based scenarios. Table 8 presents the results in terms of soil erosion and sediment yield for the scenarios considered.

Table 8.
Simulated sediment yield of HRUs, simulated sediment outflux at the outlet, and calculated sediment deposition under different EbA scenarios.
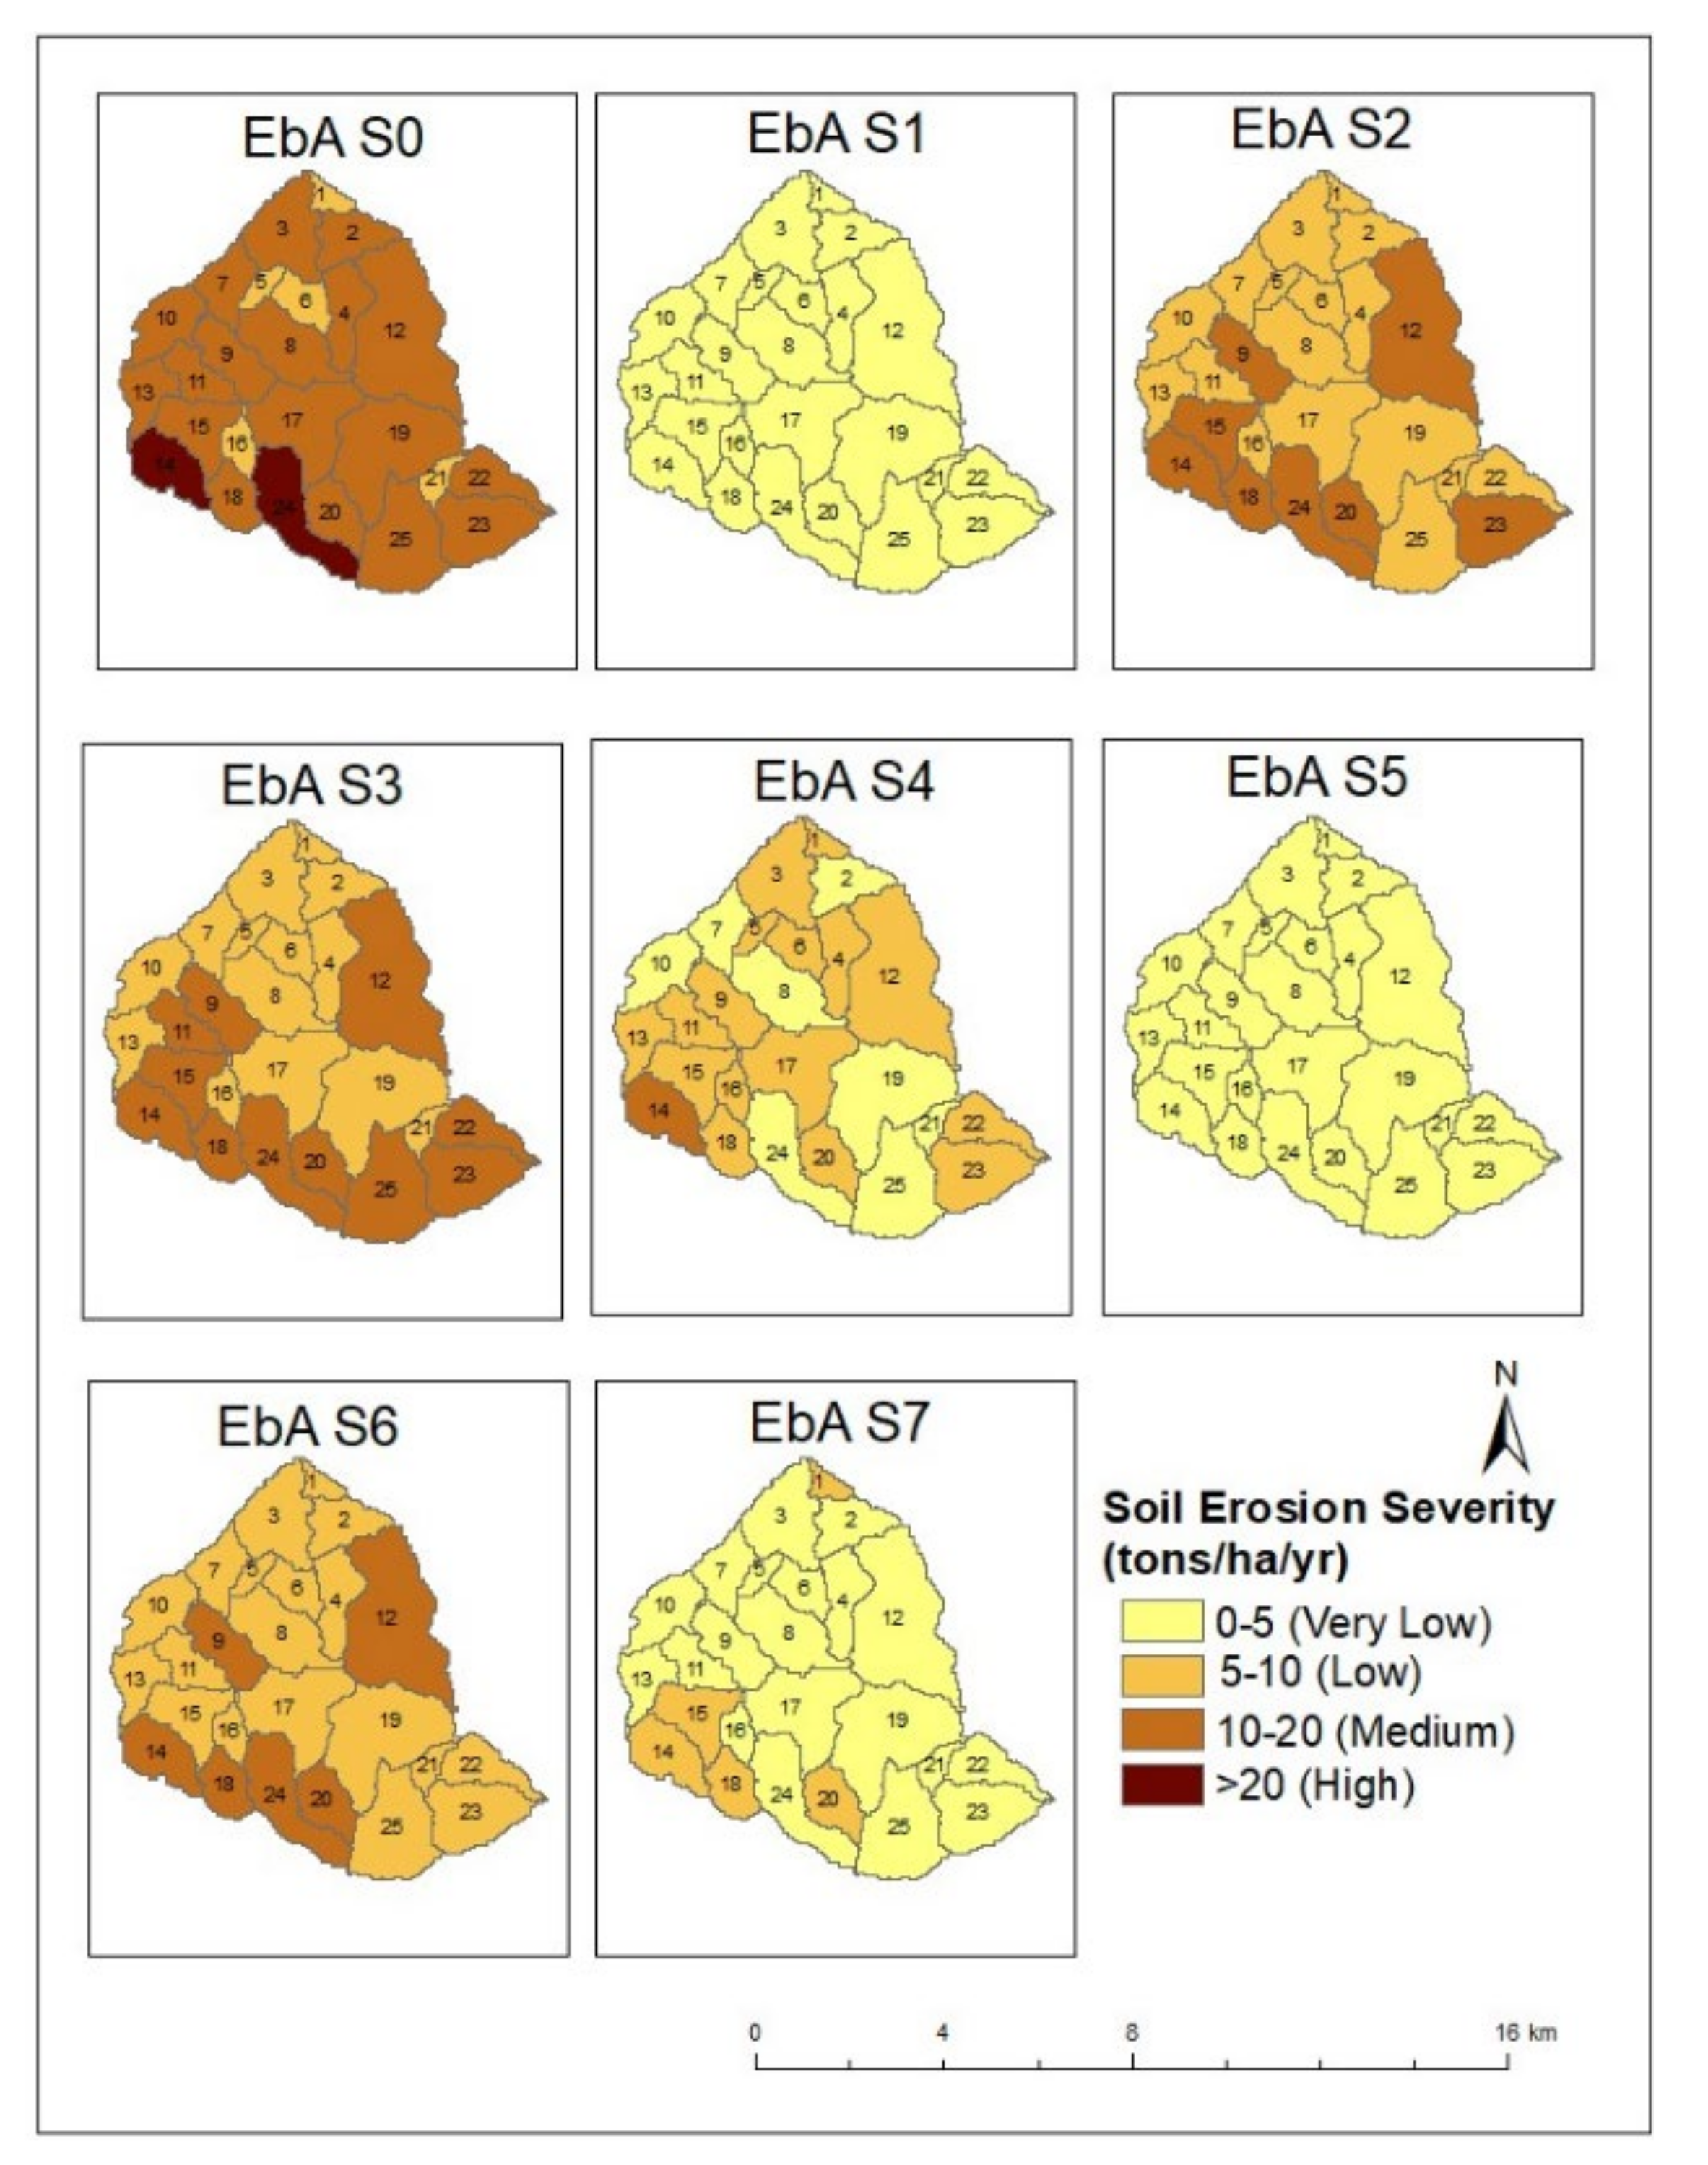
In Scenario EbA S1, reforestation was applied to the entire watershed area. The erosion rate reduced from 13.5 to 2.2 tons/ha/year (84% reduction), similar to 2.3 t/ha/year under the original watershed scenario (LU S0) with 97% forest cover. Similarly, filter strips alone (EbA S2) reduced erosion from 13.5 to 9.8 tons/ha/year (28% reduction). Contouring alone (EbA S3) reduced erosion from 13.5 to 10.4 tons/ha/year (23% reduction), and terracing alone (EbA S4) reduced it to 5.4 tons/ha/year (60% reduction). Combined EbA scenarios (EbA S5, EbA S6, and EbA S7) also seem to have caused significant reductions in erosion rates as well as in sediment yields. Scenario EbA S5, a combination of reforestation, filter strips, and grassed waterways, was found to have the highest reduction in erosion—from 13.5 to 1.6 tons/ha/year (88% reduction)—among the scenarios considered in this study. The possible reason for this high reduction in soil erosion might be the canopy cover, which reduces the impacts of direct rainfall. In addition, the deep roots of trees provide mechanical reinforcement for soil stabilization [78,113].
When comparing the sediment yield produced in EbA S4 and EbA S3, the higher reductions in sediment due to terracing (EbA S4), as compared to contouring (EbA S3), could be attributed to the increased amount of reduction in runoff when incorporating terracing practices [96,97]. Terracing uses shorter slope lengths, and the adjusted support practice factor reduces erosion better than contouring, which only incorporates changes in the support practice factor. The implementation of grassed waterways significantly reduces sediment yield because sediment yield gets trapped along the waterway as there is increased channel roughness (through increased vegetation cover). The changed model parameters reflect the effects of EbA measures in terms of runoff, soil erosion, and sediment load well. This indicates that the SWAT model can be implemented to evaluate EbA measures at the watershed level in this region. Figure 8 illustrates the spatial distribution of erosion due to implemented EbA measures categorized using the soil erosion severity classes.
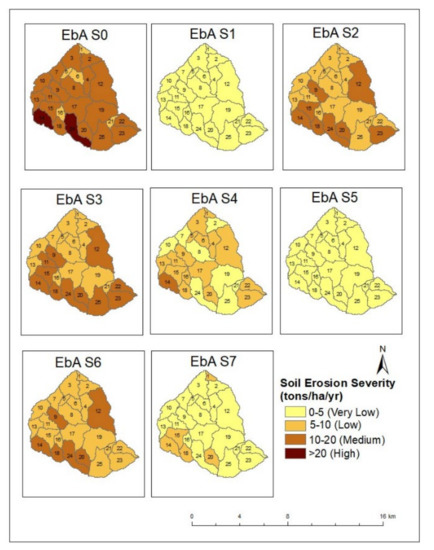
Figure 8.
Soil erosion severity in the Huai Ta Poe under different EbA scenarios.
As can be observed from Table 8, while the soil erosion values reflect the effects of various EbA scenarios, sediment outflux at the watershed outlet is not correspondingly sensitive. The SWAT model’s sediment transport component includes both overland and channel components. The overland component uses MUSLE to calculate sediment yield, which is then routed through the channel using the empirical approach. The calibration efforts adopted in this study used total sediment transport at the watershed outlet, which implicitly includes both components (sediment yield and routing through degradation and deposition). When analyzing the various scenarios, EbA measures were found appropriately effective at the field level (HRU) but less sensitive at the watershed level, which is linked to excessive deposition in the channels. Without proper knowledge of the channel’s degradation/deposition in the region, the effect of EbAs on sediment outflux at the watershed outlet remains uncertain and needs further investigation. However, the percentage reduction in sediment yield from land areas due to EbA adaptation was found to be consistent with the results of Mwangi et al. [97], Gassman et al. [114] and Schmidt et al. [115]. Table 9 below provides the annual average water balance components under the different EbA scenarios considered.

Table 9.
Average annual water balance components under different EbA scenarios.
When comparing EbA S0 (LU S7) and reforestation (EbA S1), it can be seen that the groundwater flow decreased significantly. This might be due to higher evapotranspiration rates from forested lands leading to reduced infiltration and decreased groundwater flow. The groundwater components in EbA S0 and EbA S2 are similar, indicating that filter strips do not alter the water balance components [78]. Interestingly, EbA S3 and EbA S4, representing contouring, demonstrate a reduction in surface runoff and an increase in infiltration, and thus also an increase in groundwater, similar to the results of Arabi et al. [96] and Arabi et al. [116]. Furthermore, Arabi et al. [96] and Fiener et al. [98] also found that grassed waterways do not change water balance components. However, these do affect sediment transport and, ultimately, sediment yield.
Since uncertainties exist due to simplified hydrological processes, limited process knowledge, and representation of EbAs in developed hydrological models, experimental and pilot studies should be conducted before implementing recommended EbA measures at the watershed level to validate modeling results and demonstrate the usefulness of the EbA measures on the ground. The study presented herein has limitations regarding several assumptions and simplifications inherent in the modeling to represent real-world complexities of hydrological processes and responses of watersheds, as also noted by Abbaspour [82]. Further, it is suggested that future studies related to EbAs should consider the concept of “Payment for Ecosystem Services” as adopted by Taffarello et al. [117].
4. Conclusions
The developed SWAT model can simulate the monthly flow and sediment yield of the studied watershed very well. The study’s results demonstrate how land use changes by introducing commercial and energy crops, and how their cultivation could degrade the watershed in terms of soil erosion and sediment yield, thereby causing other environmental problems downstream. The study also shows how EbA measures could reverse the process of land degradation. The combined EbA scenario comprising reforestation, filter strips, and grassed waterways was most effective and resulted in the greatest reduction in sediment yield. It can be concluded that watershed restoration programs should consider implementing combined EbA measures with filter strips and grassed waterways as they are most effective in controlling soil erosion and sediment transport.
At the local level, the study’s results will assist river basin managers, stakeholders (including farmers), and government agencies in evaluating and implementing EbAs to control sediment yield in the Huai Ta Poe watershed and other watersheds in the region that have similar agro-climatic conditions. Furthermore, the study demonstrates the usefulness of implementing EbA measures for sediment management strategies to address watershed degradation, which is a common problem across the globe. Further studies need to be conducted to evaluate the costs and benefits of implementing EbAs under current and projected climatic variability and change, as the EbA options can offset the negative impacts of climate change. Despite these limitations in the eco-hydrological modeling approach, it still provides important insights because the evaluation and post-monitoring of EbAs at an experimental scale is still quite expensive.
Author Contributions
Conceptualization, M.S.B.; methodology, M.S.B. and M.K.J.; software, M.B.G. and M.K.J.; formal analysis, M.B.G.; investigation, M.B.G.; data curation, M.B.G.; writing—original draft preparation, M.B.G., M.S.B. and M.K.J.; writing—review and editing, M.S.B., M.B.G. and M.K.J.; supervision, M.S.B. and M.K.J.; project administration, M.S.B.; funding acquisition, M.S.B. and M.K.J. All authors have read and agreed to the published version of the manuscript.
Funding
This article is based on the master’s thesis of the second author. The master’s program was partially funded by the Asian Institute of Technology, Thailand. The second author was also funded for an internship by the Deutsche Gesellschaft für Internationale Zusammenarbeit GmbH (GIZ) to work in the ECOSWat project “Improved Management of Extreme Events through Ecosystem-Based Adaptation in Watersheds”, which provided motivation and necessary data for the study. The authors are also thankful to the Thailand Meteorological Department (TMD), Royal Irrigation Department (RID), and Department of Water Resources (DWR) of the Government of Thailand for providing the data used in the study.
Institutional Review Board Statement
Not applicable.
Informed Consent Statement
Not applicable.
Data Availability Statement
The data presented in this study are available on request from the corresponding author. The data are not publicly available due to privacy restrictions.
Conflicts of Interest
The authors declare no conflict of interest.
Appendix A
The two points surrounded by triangles are outliers in Figure A1.
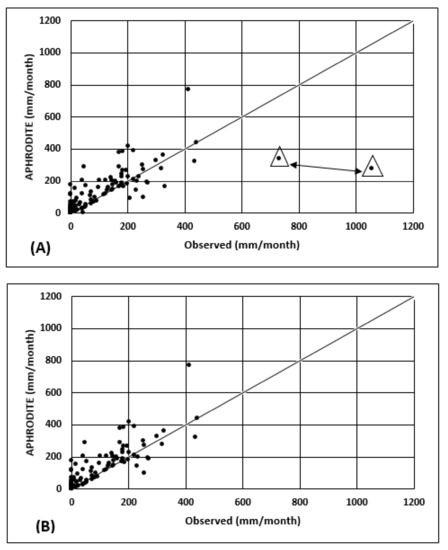
Figure A1.
(A) Scatter plot between APHRODITE and observed rainfall between 2004 and 2014. (B) Same as the above, but during 2005–2014.
Figure A1.
(A) Scatter plot between APHRODITE and observed rainfall between 2004 and 2014. (B) Same as the above, but during 2005–2014.
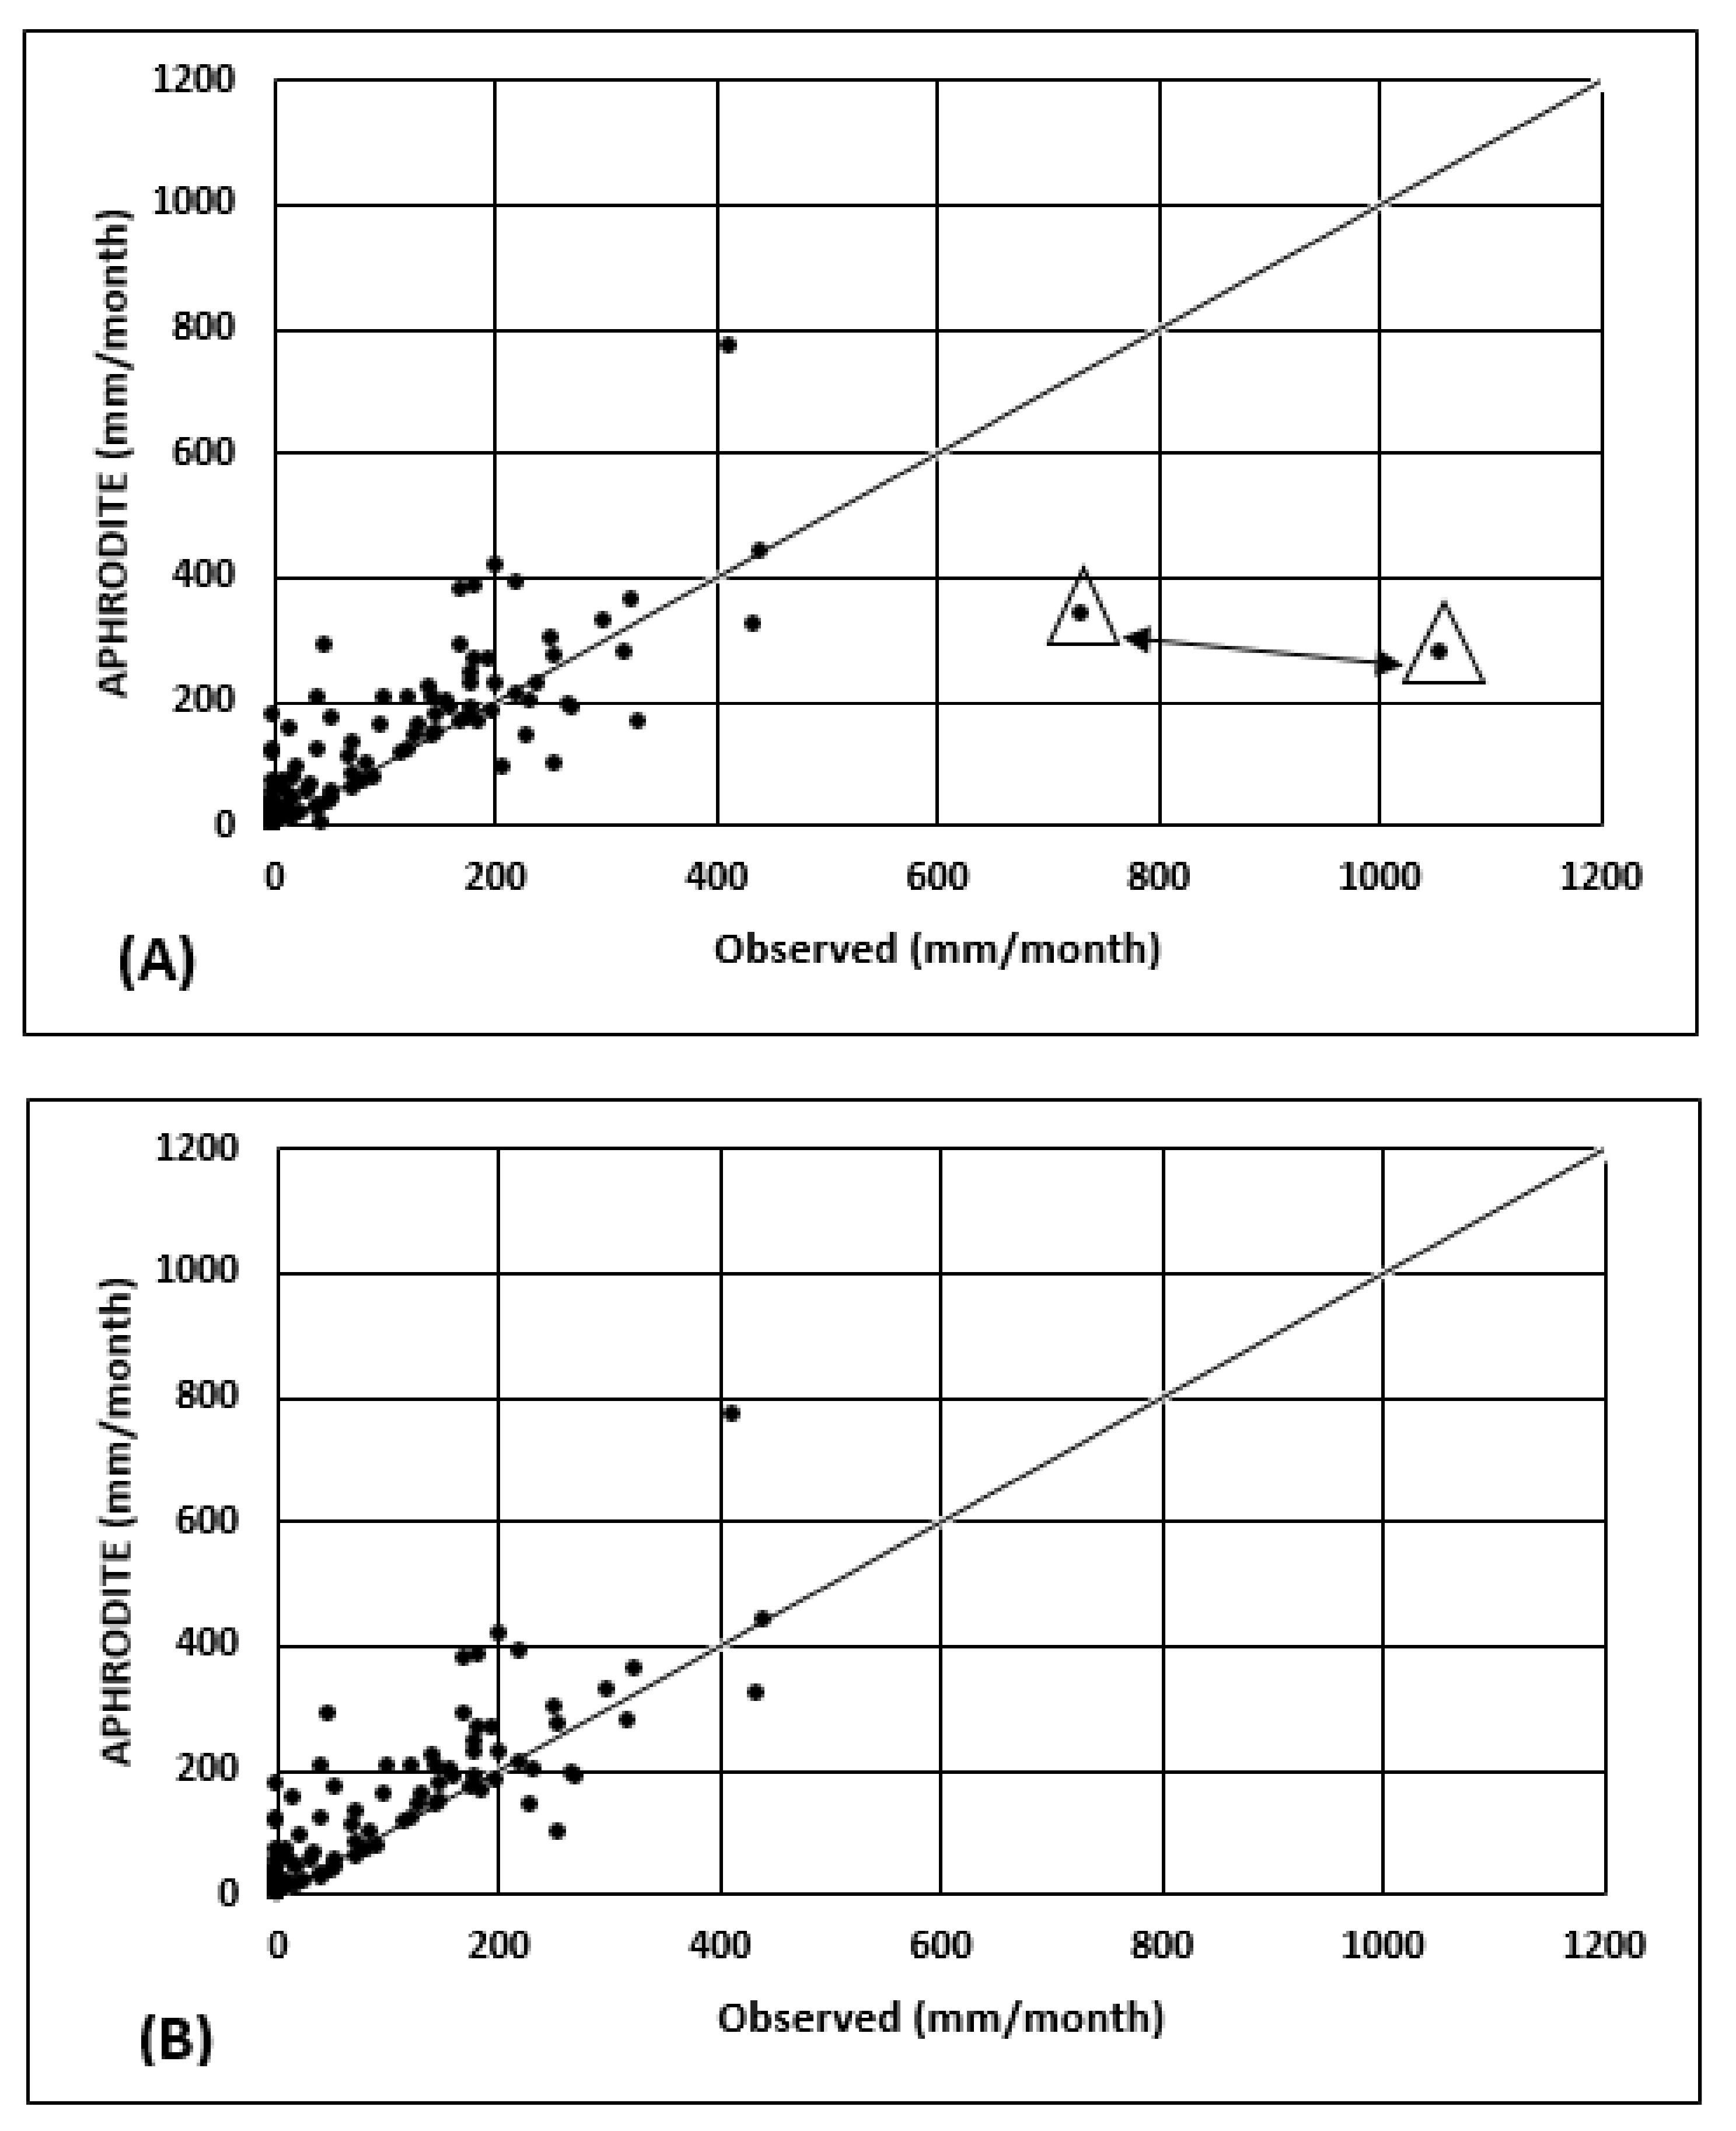

Table A1.
Land area under different land-use change scenarios.
Table A1.
Land area under different land-use change scenarios.
| Land-Use Change Scenario | Sugarcane | Cassava | Rubber | Deciduous Forest | ||||
|---|---|---|---|---|---|---|---|---|
| km2 | % | km2 | % | km2 | % | km2 | % | |
| LU S0 | 0.12 | 0.20 | 0.42 | 0.86 | 0.64 | 1.34 | 46.9 | 97.6 |
| LU S1 | 10.6 | 22 | - | - | - | - | 37.5 | 78 |
| LU S2 | - | - | 30.8 | 64 | - | - | 17.3 | 36 |
| LU S3 | - | - | - | - | 38 | 79 | 10.1 | 21 |
| LU S4 | 11 | 23 | - | - | 27 | 56 | 10.1 | 21 |
| LU S5 | 10.6 | 22 | 20.2 | 42 | - | - | 17.3 | 36 |
| LU S6 | - | - | 21.5 | 44.6 | 16.0 | 33.3 | 10.6 | 22.1 |
| LU S7 | 11 | 23 | 20.2 | 42 | 6.7 | 14 | 10.1 | 21 |

Table A2.
Land area under different soil erosion severity classes.
Table A2.
Land area under different soil erosion severity classes.
| Land-Use Scenario | Very Low (0–5 t/ha/yr) | Low (5–10 t/ha/yr) | Medium (10–20 t/ha/yr) | High (>20 t/ha/yr) |
|---|---|---|---|---|
| LU S0 | 100% | - | - | - |
| LU S1 | 100% | - | - | - |
| LU S2 | - | 5% | 95% | - |
| LU S3 | 1% | 84% | 15% | - |
| LU S4 | 5% | 83% | 12% | - |
| LU S5 | - | 22% | 78% | - |
| LU S6 | - | 24% | 76% | - |
| LU S7 | - | 7% | 84% | 9% |
Reforestation: Conservation of biodiversity, conservation of soil by preventing erosion, and preserving water quality through sediment and nutrient entrapment are among the most valuable services provided by forested riparian lands. Falling leaves increase the organic content of the soil, leading to an increase in the soil’s water-holding capacity [118]. In this scenario, the entire land use was changed into forest land for simulation.
Filter strips: A filter strip is an area of herbaceous vegetation that removes contaminants from overland flow [95]. The vegetation could be trees, shrubs, or a combination of trees or shrubs established at the edge of the watershed along the stream. The flow from the cropland is passed through these buffer strips with reduced velocity (promoting infiltration), whereas nutrients (nitrogen and phosphorus) and sediments are retained due to the increased roughness cover of the vegetation [58] (filter strips were simulated on both sides of the river with a filter strip width of 10 m). Filter strips were simulated in areas with less than 10% slope, because higher slopes increase gullies and rill erosion [93].
Contouring: Contouring is a practice where farming is done along contours rather than up and down slopes. This practice leads to enhanced infiltration, which reduces surface runoff and, in turn, reduces soil erosion risks [98]. Contouring was simulated in agricultural lands of slopes less than 10% [95]. The SWAT model simulated contouring by changing USLE_P [50] and reducing the curve number (CN) by three units from the calibrated value for a specific land-use type [96]. The USLE_P factors for different slopes for contouring were taken from Wischmeier et al. [119].
Terracing: Terraces divide and shorten a long slope into a series of shorter and relatively more level steps. Terraces reduce sheet and rill erosion in agriculture-dominated areas. The reduced slope steepness and length allow water to soak into the ground and, as a result, reduce surface runoff and thus reduce soil erosion [97]. Terracing is followed in areas of slopes higher than 10%. The SWAT model simulated terracing by adjusting the SLSUBBSN (average slope length of sub-basin), changing the USLE_P, and reducing the CN by six units from the calibrated value for a specific land-use type following the criteria adopted by Arabi et al. [96]. The USLE_P factor to represent terracing under different slope conditions was taken from Wischmeier et al. [119]. The model parameter, SLSUBBSN, was adjusted using the following equation:
where x is a dimensionless variable that varies from 0.12 to 0.24 depending on the rainfall received. A value of 0.21 was assigned to x in this study, following the guidelines set out by Mwangi et al. [97]. The value of y depends on soil erodibility and crop management. It was adjusted based on USDA [120].
Grassed waterways: Grassed waterways are channels of water with grass established along drainage paths to reduce surface runoff velocity and sediment yield. The peak flow rate in the channel segment can be reduced by increasing Manning’s roughness, which thereby reduces sediment transport and yield at the outlet. The value of CH_N2 (Manning’s value for channel roughness) at 0.3 CH_COV (channel cover) and CH_EROD (channel erodibility factor) at 0.01 were used in this study to represent fully covered channel conditions following the guidelines of Arabi et al. [96] and Fiener et al. [98].
References
- Li, Z.; Deng, X.; Yin, F.; Yang, C. Analysis of Climate and Land Use Changes Impacts on Land Degradation in the North China Plain. Adv. Meteorol. 2015, 2015, 1–11. [Google Scholar] [CrossRef]
- Thanapakpawin, P.; Richey, J.; Thomas, D.; Rodda, S.; Campbell, B.; Logsdon, M. Effects of land use change on hydrologic regime of the Mae Chaem river basin, Northwest Thailand. J. Hydrol. 2006, 334, 215–230. [Google Scholar] [CrossRef]
- Ayoubi, S.; Sadeghi, N.; Afshar, F.A.; Abdi, M.R.; Zeraatpisheh, M.; Rodrido-Comino, J. Impacts of oak deforestation and rainfed cultivation on soil redistribution processes across hillslopes using 137Cs techniques. For. Ecosyst. 2021, 8, 1–14. [Google Scholar] [CrossRef]
- Foley, J.A.; DeFries, R.; Asner, G.P.; Barford, C.; Bonan, G.; Carpenter, S.R.; Chapin, F.S.; Coe, M.T.; Daily, G.C.; Gibbs, H.K.; et al. Global consequences of land use. Science 2005, 309, 570–574. [Google Scholar] [CrossRef] [PubMed]
- Gibbs, H.K.; Ruesch, A.S.; Achard, F.; Clayton, M.K.; Holmgren, P.; Ramankutty, N.; Foley, J.A. Tropical forests were the primary sources of new agricultural land in the 1980s and 1990s. Proc. Natl. Acad. Sci. USA 2010, 107, 16732–16737. [Google Scholar] [CrossRef] [PubMed]
- Lambin, E.F.; Gibbs, H.K.; Ferreira, L.; Grau, R.; Mayaux, P.; Meyfroidt, P.; Morton, D.C.; Rudel, T.K.; Gasparri, I.; Munger, J. Estimating the world’s potentially available cropland using a bottom-up 20. Glob. Environ. Chang. 2013, 23, 892–901. [Google Scholar] [CrossRef]
- Lugato, E.; Smith, P.; Borrelli, P.; Panagos, P.; Ballabio, C.; Orgiazzi, A.; Fernandez-Ugalde, O.; Montanarella, L.; Jones, A. Soil erosion is unlikely to drive a future carbon sink in Europe. Sci. Adv. 2018, 4, 1–8. [Google Scholar] [CrossRef]
- Vaezi, A.R.; Abbasi, M.; Keestra, S.; Cerda, A. Assessment of soil particle erodibility and sediment trapping using check dams in small semi-arid catchments. Catena 2017, 157, 227–240. [Google Scholar] [CrossRef]
- Ahmad, N.; Pandey, P. Assessment and monitoring of land degradation using geospatial technology in Bathinda district, Punjab, India. Solid Earth 2018, 9, 75–90. [Google Scholar] [CrossRef]
- Nickerson, C.; Ebel, R.; Borchers, A.; Carriazo, F. Major Uses of Land in the United States; EIB-89; United States Department of Agriculture, Economic Research Service: Washington, DC, USA, 2011. [Google Scholar]
- Panagos, P.; Barcelo, S.; Bourauni, F.; Bosco, C.; Dewitte, O.; Gardi, C.; Erhad, M.; Hervas De Deigo, F.; Hiederer, R.; Jeffery, S.; et al. The State of Soil in Europe—A Contribution of the JRC to the European Environment Agency’s Environment State and Outlook Report—SOER 2010; Office for Official Publications of the European Communities, Publications Office of the European Union: Luxembourg, 2012. [Google Scholar]
- Panagos, P.; Borrelli, P.; Poesen, J.; Ballabio, C.; Lugato, E.; Meusberger, K.; Montanarella, L.; Alewell, C. The new assessment of soil loss by water erosion in Europe. Environ. Sci. Policy 2015, 54, 438–477. [Google Scholar] [CrossRef]
- Abe, S.; Wakatsuki, T. Sawah Ecotechnology—A Trigger for a Rice Green Revolution in Sub-Saharan Africa: Basic Concept and Policy Implications. Outlook Agric. 2011, 40, 221–227. [Google Scholar] [CrossRef][Green Version]
- Ejeta, G. African green revolution needn’t be a mirage. Science 2010, 327, 831–832. [Google Scholar] [CrossRef] [PubMed]
- Aglanu, L.M. Watersheds and rehabilitations measures-A review. Resour. Environ. 2014, 4, 104–114. [Google Scholar]
- Kheereemangkla, Y.; Shrestha, R.; Shrestha, S.; Jourdain, D. Modeling Hydrologic Response to Land Management Scenarios for the Chi River Sub-basin Part-2, Northeast Thailand. Environ. Earth Sci. 2016, 75, 2–16. [Google Scholar] [CrossRef]
- Imai, N.; Furukawa, T.; Tsujino, R.; Kitamura, S.; Yumoto, T. Factors affecting forest area change in Southeast Asia during 1980–2010. PLoS ONE 2018, 13, e0197391. [Google Scholar] [CrossRef] [PubMed]
- Hafner, J.; Apichatvullop, Y.; Subhadhira, S. Northeast Thailand Upland Social Forestry Project. 2016. Human-Forest Interactions in Northeast Thailand: A Summary Report for the Ford Foundation, Thailand; Ford Foundation: Bangkok, Thailand, 1987. [Google Scholar]
- Arfanuzzaman, M.; Dahiya, B. Sustainable urbanization in Southeast Asia and beyond: Challenges of population growth, land use change, and environmental health. Growth Chang. 2019, 50, 725–744. [Google Scholar] [CrossRef]
- Wicke, B.; Sikkema, R.; Dornburg, V.; Faaij, A. Exploring land use changes and the role of palm oil production in Indonesia and Malaysia. Land Use Policy 2011, 28, 193–206. [Google Scholar] [CrossRef]
- Lim, C.L.; Prescott, G.W.; De Alban, J.D.T.; Ziegler, A.D.; Webb, E.L. Untangling the proximate causes and underlying drivers of deforestation and forest degradation in Myanmar. Conserv. Biol. 2017, 31, 1362–1372. [Google Scholar] [CrossRef]
- Herath, G.; Hasanov, A. Climate Change and Threats to Sustainability in South East Asia: Dynamic Modelling Approach for Malaysia. In Regional Growth and Sustainable Development in Asia; New Frontiers in Regional Science: Asian Perspectives, 7; Batabyal, A., Nijkamp, P., Eds.; Springer: Cham, Switzerland, 2017. [Google Scholar]
- Stocker, T.F.; Qin, D.; Plattner, G.-K.; Tignor, M.; Allen, S.K.; Boschung, J.; Nauels, A.; Xia, Y.; Bex, V.; Midgley, P.M. (Eds.) Climate Change 2013: The Physical Science Basis. Contribution of Working Group I to the Fifth Assessment Report of the Intergovernmental Panel on Climate Change; Cambridge University Press: Cambridge, UK; New York, NY, USA, 2013. [Google Scholar]
- Borrelli, P.; Robinson, D.A.; Panagos, P.; Lugato, E.; Yang, J.E.; Alewell, C.; Wuepper, D.; Montanarella, L.; Ballabio, C. Land use and climate change impacts on global soil erosion by water (2015–2070). Proc. Natl. Acad. Sci. USA 2020, 117, 21994–22001. [Google Scholar] [CrossRef]
- Food and Agriculture Organization. World Fertilizer Trends and Outlook to 2018; Food and Agriculture Organization: Rome, Italy, 2015. [Google Scholar]
- Lutz, W.; Butz, W.P.; Samir, K.C. World Population and Human Capital in the Twenty-First Century; IISA: Luxemborg, 2014. [Google Scholar]
- Kayama, M.; Himmapan, W. Improvement of Utilization Techniques of Forest. Resources to Promote Sustainable Forestry in Thailand; JIRCAS Working Report No.85; Japan International Research Center for Agricultural Sciences: Tsukuba, Japan, 2017. [Google Scholar]
- Leblond, J.P. Revisiting forest transition explanations: The role of “push” factors and adaptation strategies in forest expansion in northern Phetchabun, Thailand. Land Use Policy 2019, 83, 195–214. [Google Scholar] [CrossRef]
- Homdee, T.; Pongput, K.; Kanae, S. Impacts of land cover changes on hydrologic responses. A case study of Chi River Basin, Thailand. J. Jpn. Soc. Civ. Eng. Ser. B1 (Hydraul. Eng.) 2011, 67, 31–36. [Google Scholar] [CrossRef]
- Gathagu, J.N.; Sang, J.K.; Maina, C.W. Modelling the Impacts of Structural Conservation Measures on Sediment and water yield in Thika-Chania Catchment, Kenya. Int. Soil Water Conserv. Res. 2018, 6, 165–174. [Google Scholar] [CrossRef]
- Darghouth, S.; Ward, C.; Gambarelli, G.; Styger, C. Roux Watershed Management Approaches, Policies and Operations: Lessons for Scaling Up; Water sector board discussion paper series, Paper no. 11; World Bank: Washington, DC, USA, 2008. [Google Scholar]
- Pansak, W.; Hilger, T.H.; Dercon, G.; Kongkaew, T.; Cadisch, G. Changes in relationship between soil erosion and N loss pathways after establishing soil conservation systems in uplands of Northeast Thailand. Agric. Ecosyst. Environ. 2008, 128, 167–176. [Google Scholar] [CrossRef]
- Cohen-Shacham, E.; Walters, G.; Janzen, C.; Maginnis, S. Nature-Based Solutions to Address Global Societal Challenges; International Union of Conservation Research: Gland, Switzerland, 2016. [Google Scholar]
- Jang, S.; Ahn, S.; Kim, S. Evaluation of executable best management practices in Haean highland agricultural catchment of South Korea using SWAT. Agric. Water Manag. 2017, 180, 224–234. [Google Scholar] [CrossRef]
- Emerton, L. Valuing the Benefits, Costs and Impacts of Ecosystem-Based Adaptation Measures: A Source Book of Methods for Decision-Making; Deutsche Gesellschaft für Internationale Zusammenarbeit (GIZ) GmbH.: Bonn, Germany, 2017. [Google Scholar]
- Jha, M.K. Evaluating Hydrologic Response of an Agricultural Watershed for Watershed analysis. Water 2011, 3, 604–617. [Google Scholar] [CrossRef]
- Amatya, D.M.; Jha, M.K.; Williams, T.M.; Edwards, A.E.; Hitchcock, D.R. SWAT Model Prediction of Phosphorus Loading in South Carolina Karst Watershed with a Downstream Embayment. J. Environ. Prot. 2012, 4, 75–90. [Google Scholar] [CrossRef]
- Schilling, K.E.; Gassman, P.W.; Kling, C.L.; Campbell, T.; Jha, M.K.; Wolter, C.F.; Arnold, J.G. The Potential for Agricultural Land Use Change to Reduce Flood Risk in a Large Watershed. Hydrol. Process. 2014, 28, 3314–3325. [Google Scholar] [CrossRef]
- Burkart, C.S.; Jha, M.K. Site-specific Simulation of Nutrient Control Policies: Integrating Economic and Water quality effects. J. Agric. Resour. Econ. West. Agric. Resour. Organ. 2012, 37, 20–23. [Google Scholar]
- Feng, H.; Jha, M.K.; Gassman, P.W. The Allocation of Nutrient Load Reduction Across a Watershed: Assessing Delivery Coefficients as an Implementation Tool. Rev. Agric. Econ. 2009, 31, 183–204. [Google Scholar] [CrossRef][Green Version]
- Ndomb, P.N.; Mtalo, F.W.; Killingtveit, A. A Guided Swat Model Application On Sediment Yield Modeling In Pangani River Basin: Lessons Learnt. J. Urban Environ. Eng. 2008, 2, 53–62. [Google Scholar] [CrossRef]
- Kling, C.L.; Panagopoulos, I.; Rabotyagov, S.; Valcu, A.; Gassman, P.W.; Campbell, T.; White, M.J.; Arnold, J.G.; Srinivasan, R.; Jha, M.K.; et al. LUMINATE: Linking agricultural land use, local water quality and Gulf of Mexico hypoxia. Eur. Rev. Agric. Econ. 2014, 41, 431–459. [Google Scholar] [CrossRef]
- Jha, M.K.; Pan, Z.; Takle, E.S.; Gu, R. Impacts of Climate Change on Streamflow in the Upper Mississippi River Basin: A Regional Climate Model Perspective. J. Geophys. Res. Atmos. 2004, 109, 1–12. [Google Scholar] [CrossRef]
- Jha, M.K.; Arnold, J.G.; Gassman, P.W.; Giorgi, F.; Gu, R. Climate Change Sensitivity Assessment on Upper Mississippi River Basin Streamflows Using SWAT. J. Am. Water Resour. Assoc. 2007, 42, 997–1015. [Google Scholar] [CrossRef]
- Jha, M.K.; Gassman, P.W.; Panagopoulos, Y. Regional Changes in Nitrogen Loadings in the Upper Mississippi River Basin Under Predicted Mid-century Climate. Reg. Environ. Chang. 2015, 15, 449–460. [Google Scholar] [CrossRef]
- Takle, E.S.; Jha, M.K.; Lu, E.; Arritt, R.W.; Gutowski, W.J. Streamflow in the Upper Mississippi River Basin as simulated by SWAT driven by 20th Century contemporary results of global climate models and NARCCAP regional climate models. Meteorologische Zeitschift 2010, 19, 341–346. [Google Scholar] [CrossRef]
- Lu, E.; Takle, E.S.; Jha, M.K. The Relationships Between Climatic and Hydrological Changes in the Upper Mississippi River Basin: A SWAT and Multi-GCM Study. J. Hydrometeorol. 2010, 11, 437–451. [Google Scholar] [CrossRef]
- Jha, M.K.; Gassman, P.W. Changes in Hydrology and Streamflow as Predicted by Modeling Experiment Forced with Climate Models. Hydrol. Process. 2014, 28, 2772–2781. [Google Scholar] [CrossRef]
- Chattopadhyay, S.; Jha, M.K. Hydrologic Response Due to Projected Climatic Variability in Haw River Watershed, North Carolina, USA. Hydrol. Sci. J. 2016, 61, 495–506. [Google Scholar] [CrossRef]
- Arnold, J.G.; Srinivasan, R.; Muttiah, R.S.; Williams, J.R. Large Area Hydrologic Modeling and Assessment: Part I. Model development. J. Am. Water Resour. Assoc. 1998, 34, 73–89. [Google Scholar] [CrossRef]
- Munoz-Carpena, R.; Parsons, J.; Gilliam, J.W. Modeling Hydrology and Sediment Transport in Vegetative Filter Strips. J. Hydrol. 1999, 214, 111–129. [Google Scholar] [CrossRef]
- Ciou, S.K.; Kuo, J.T.; Hsieh, P.H.; Yu, G.H. Optimization Model for BMP Placement in a Reservoir Watershed. J. Irrig. Drain. Eng. 2012, 138, 736–747. [Google Scholar] [CrossRef]
- Williams, C.O.; Lowrance, R.; Potter, T.; Bosch, D.D.; Strickland, T. Atrazine transport within a coastal zone in Southeastern Puerto Rico: A sensitivity analysis of an agricultural field model and riparian zone management model. Environ. Model. Assess. 2016, 21, 751–761. [Google Scholar] [CrossRef]
- Li, Z.; Luo, C.; Xi, Q.; Li, H.; Pan, J.; Zhou, Q.; Xiong, Z. Assessment of Ann-AGNPS Model in Simulating Runoff and Nutrients in a Typical Small Watershed in the Taihu Lake Basin, China. Catena 2015, 133, 349–361. [Google Scholar] [CrossRef]
- Chen, N.; Hong, H.; Cao, W.; Zhang, Y.; Wang, W. Assessment of Management Practices in a Small Agricultural Watershed in Southeast China. J. Environ. Sci. Health (Part A) 2006, 41, 1257–1269. [Google Scholar] [CrossRef]
- Jha, M.K.; Rabotyagov, S.; Gassman, P.W. Optimal Placement of Conservation Practices Using Genetic Algorithm with SWAT. Int. Agric. Eng. J. 2009, 18, 41–50. [Google Scholar]
- Barnhart, B.; Lu, Z.; Bostian, M.; Sinha, A.; Deb, K.; Kurkalova, L.; Jha, M.K.; Whittaker, G. Handling Practicalities in Agricultural Policy Optimization for Water Quality Improvements. In Proceedings of the Genetic and Evolutionary Computation Conference (GECCO 2017), Berlin, Germany, 15–19 July 2017. [Google Scholar]
- Liu, Y.; Yang, W.; Leon, L.; Wong, I.; McCrimmon, C.; Dove, A.; Fong, P. Hydrologic modeling and evaluation of Best Management Practice scenarios for the Grand River watershed in Southern Ontario. J. Great Lakes Res. 2016, 42, 1289–1301. [Google Scholar] [CrossRef]
- Elci, A. Evaluation of nutrient retention in vegetated filter strips using SWAT model. Water Sci. Technol. 2017, 76, 2742–2752. [Google Scholar] [CrossRef] [PubMed]
- Betrie, G.D.; Mohamed, Y.A.; Van Griensven, A.; Srinivasan, R. Sediment Management Modelling in the Blue Nile Basin Using SWAT Model. Hydrol. Earth Syst. Sci. 2011, 15, 807–818. [Google Scholar] [CrossRef]
- Briak, H.; Mrabet, R.; Moussadek, R.; Aboumaria, K. Use of a calibrated SWAT model to evaluate the effects of agricultural BMPs on sediments of the Kalaya river basin (North of Morocco). Int. Soil Water Conserv. Res. 2019, 7, 176–183. [Google Scholar] [CrossRef]
- Merriman, K.R.; Daggupati, P.; Srinivasan, R.; Hayhurst, B. Assessment of site-specific agricultural Best Management Practices in the Upper East River watershed, Wisconsin, using a field-scale SWAT model. J. Great Lakes Res. 2019, 45, 619–641. [Google Scholar] [CrossRef]
- Graiprab, P.; Pongput, K.; Tangtham, N.; Gassman, P. Hydrologic evaluation and effect of climate change on the At Samat watershed, Northeast Region, Thailand. Int. Agric. Eng. J. 2010, 19, 12–22. [Google Scholar]
- Wangpimool, W.; Pongput, K.; Sukvibool, C.; Sombatpanit, S.; Gassman, P. The Effect of Reforestation on Streamflow in Upper Nan River Basin Using Soil and Water Assessment Tool (SWAT) Model. Int. Soil Water. Conserv. Res. 2013, 1, 53–63. [Google Scholar] [CrossRef]
- Reungsang, P.; Kanwar, R.S.; Jha, M.K.; Gassman, P.W.; Ahmad, K.; Saleh, A. Calibration and Validation of SWAT for the Upper Maquoketa River Watershed; Working Paper 05-WP 396; Center for Agricultural and Rural Development, Iowa State University: Ames, IA, USA, 2005. [Google Scholar]
- Reungsang, P.; Kanwar, R.; Srisuk, K. Application of SWAT model in simulating stream flow for the Chi River Subbasin-2 in Northeast Thailand. Trends Res. Sci. Technol. 2010, 2, 23–28. [Google Scholar]
- Phomcha, P.; Wirojanagud, P.; Vangpaisal, T.; Thaveevouthi, T. Predicting Sediment Discharge in an Agricultural Watershed. A Case Study of the Lam Sonthi Watershd, Thailand. Sci. Asia 2011, 37, 43–50. [Google Scholar] [CrossRef]
- Pandey, A.; Bishal, K.C.; Kalura, P.; Chowdary, V.M.; Jha, C.S.; Cerdà, A. Soil Water Assessment Tool (SWAT) Modeling Approach to Prioritize Soil Conservation Management in River Basin Critical Areas Coupled With Future Climate Scenario Analysis. Air Soil Water Res. 2021, 14, 1–7. [Google Scholar] [CrossRef]
- Arunrat, N.; Kongsurakan, P.; Sereenonchai, S.; Hatano, R. Soil Organic Carbon in Sandy Paddy Fields of Northeast Thailand: A Review. Agronomy 2020, 10, 1061. [Google Scholar] [CrossRef]
- Paiboonvorachat, C.; Oyana, T.J. Land-cover changes and potential impacts on soil erosion in the Nan watershed, Thailand. Int. J. Remote Sens. 2011, 32, 6587–6609. [Google Scholar] [CrossRef]
- Lorsirirat, K.; Maita, H. Soil Erosion Problems in Northeast Thailand: A Case Study from the View of Agricultural Development in a Rural Community Near Khon Kaen in Disaster Mitigation of Debris Flows, Slope Failures and Landslide; Universal Academy Press, Inc.: Tokyo, Japan, 2006. [Google Scholar]
- Nontananandh, S.; Changnoi, B. Internet GIS, Based on USLE Modeling, for Assessment of Soil Erosion in Songkhram Watershed, Northeastern of Thailand. Kasetsart J. Nat. Sci. 2012, 46, 272–282. [Google Scholar]
- Puktlang, W.; Mongkolsawat, C.; Suwanwerakamtorn, R. The Impact of Expanding Rubber Tree Plantation on Soil Erosion in the Mekong-Sub Basin. In In Proceedings of the 34th Asian Conference on Remote Sensing 2013, ACRS, Bali, Indonesia, 20–24 October 2013. [Google Scholar]
- Lohr, H.; Sattler, K. Improved Management of Extreme Events through Ecosystem-Based Adaptation in Watersheds; Deutsche Gesellschaft für Internationale Zusammenarbeit: Hamburg, Germany, 2017. [Google Scholar]
- Yatagi, A.; Kamiguchi, K.; Arakawa, O.; Hamada, A.; Yasutomi, N.; Kitoh, A. Constructing a Long-Term Daily Gridded Precipitation Dataset for Asia Based on a Dense Network of Rain Gauges. Bull. Am. Meteorol. Soc. 2012, 93, 1401–1415. [Google Scholar] [CrossRef]
- Gassman, P.; Arnold, J.G.; Srinivasan, R.; Reyes, M. The Worldwide Use of the SWAT Model: Technological Drivers, Networking Impacts, and Simulation Trends. In Proceedings of the ASABE—21st Century Watershed Technology: Improving Water Quality and Environment, Guacimo, Costa Rica, 21–24 February 2010. [Google Scholar]
- Arnold, J.G.; Moriasi, D.N.; Gassman, P.W.; Abbaspour, K.C.; White, M.J.; Srinivasan, R.; Santhi, C.; Harmel, R.D.; Van Griensven, A.; Van Liew, M.W.; et al. SWAT: Model Use, Calibration and Validation. Trans. ASABE 2012, 55, 1491–1508. [Google Scholar] [CrossRef]
- Neitsch, S.; Arnold, J.; Kiniry, J.; Williams, J. Soil and Water Assessment Tool: Theoretical Documentation Version 2009; Texas Water Resources Institute: College Station, TX, USA, 2011. [Google Scholar]
- Bagnold, R.A. Bed load transport by natural rivers. Water Resour. Res. 1977, 13, 312. [Google Scholar] [CrossRef]
- Paiboonsak, S.; Chanket, U.; Mongkolsawat, C.; Yommaraka, B.; Wattanakit, N. Spatial Modeling for Soil Erosion Risk in Upper Chi Basin, Northeast Thailand. In Proceedings of the 26th Asian Conference on Remote Sensing, Hanoi, Vietnam, 7–11 November 2005. [Unpublished work]. [Google Scholar]
- Jha, M.; Gassman, P.W.; Arnold, J. Water Quality Modeling for the Raccoon River Watershed Using SWAT. Am. Soc. Agric. Biol. Eng. 2007, 50, 479–493. [Google Scholar]
- Abbaspour, K. SWAT-CUP User Manual, SWAT Calibration and Uncertainty Programs; EAWAG: Zurich, Switzerland, 2015. [Google Scholar]
- International Renewable Energy Agency. Renewable Energy Outlook: Thailand; International Renewable Energy Agency: Abu-Dhabi, UAE, 2017. [Google Scholar]
- Pumkaew, W. Joint Management of Biofuel Production and Food Production to Optimize Energy Return to Land Use in Thailand: A Regional Mathematical Programming Approach. Ph.D. Thesis, Clemson University, Clemson, SC, USA, December 2019. [Google Scholar]
- Fox, J.; Castella, J.C. Expansion of rubber (Hevea brasiliensis) in Mainland SoutheastAsia: What are the prospects for smallholders? J. Peasant Stud. 2013, 40, 155–170. [Google Scholar] [CrossRef]
- Rendana, M.; Rahim, S.; Lihan, T. Spatial Modeling Based Analysis of Land Suitability for Rubber Crops in Ranau District, Malaysia. Am. Eurasian J. Agric. Environ. Sci. 2014, 14, 1019–1025. [Google Scholar]
- Ahmed, G.B.; Shariff, A.R.M.; Idrees, M.O.; Balasundram, S.K.; Abdullah, A.F.B. GIS-Based Land Suitability Mapping for Rubber Cultivation in Seremban, Malaysia. Int. J. Appl. Eng. Res. 2017, 12, 9420–9433. [Google Scholar]
- Samarappuli, L.; Wijesuriya, W.; Dissanayake, D.; Karunaratne, S.; Herath, H. Land Suitability for Sustainable Rubber Cultivation in Moneragala District. J. Environ. Prof. 2014, 3, 48–61. [Google Scholar] [CrossRef]
- Jamil, M.; Ahmed, R.; Sajjad, H. Land suitability assessment for sugarcane cultivation in Bijnor district, India using geographic information system and fuzzy analytical hierarchy process. GeoJournal 2018, 83, 595–611. [Google Scholar] [CrossRef]
- Laxmikantam, M. Technology in Sugarcane Growing, 2nd ed.; Oxford and IBH Publication: Culcutta, India, 1983. [Google Scholar]
- Kakade, J.R. Sugarcane Cultivation; Metropolitan Book Company PVT. Ltd.: New Delhi, India, 1985. [Google Scholar]
- Purnamasari, R.; Ahamed, T.; Noguchi, R. Land Suitability Assessment for Cassava Production in Indonesia Using GIS, Remote Sensing and Multi-criteria Analysis. Asia Pac. J. Reg. Sci. 2018, 3, 1–32. [Google Scholar] [CrossRef]
- Grismer, M.; O’Geen, A.; Lewis, D. Vegetative Filter Strips for Non-Point Source Pollution Control in Agriculture; Publication 8195; Division of Agriculture and Natural Resources, University of California: California, CA, USA, 2006. [Google Scholar]
- Department of Environmental Water Quality. Storm Water Best Management Practices Catalog; Department of Environmental Quality (DEQ): Boise, ID, USA, 2005. [Google Scholar]
- United States Department of Agriculture, Manual on Conservation Practice Standard; United States Department of Agriculture: Washington, DC, USA, 2016.
- Arabi, M.; Frankenberger, J.R.; Engel, B.A.; Arnold, J.G. Representation of Agricultural Conservation Practices with SWAT. Hydrol. Process. 2008, 22, 3042–3055. [Google Scholar] [CrossRef]
- Mwangi, J.K.; Shisanya, C.A.; Gathenya, J.M.; Namirembe, S.; Moriasi, D.N. A Modeling Approach to Evaluate the Impact of Conservation Practices on Water and Sediment Yield in Sasumua Watershed, Kenya. J. Soil Water Conserv. 2015, 70, 75–90. [Google Scholar] [CrossRef]
- Fiener, P.; Auerswald, K. Seasonal Variation of Grassed Waterway Effectiveness in Reducing Runoff and Sediment Delivery from Agricultural Watersheds in Temperate Europe. Soil Tillage Res. 2006, 87, 48–58. [Google Scholar] [CrossRef]
- Babel, M.S.; Shrestha, B.; Perret, S. Hydrogical impact of biofuel production: A case study of the Khlong Phlo Watershed in Thailand. Agric. Water Manag. 2011, 101, 8–26. [Google Scholar] [CrossRef]
- Sudjarit, W.; Pukngam, S.; Tangtham, N. Application of SWAT model for assessing effect of main functions of watershed ecosystem in Headwater, Thailand. Proc. Int. Acad. Ecol. Environ. Sci. 2015, 5, 57–69. [Google Scholar]
- Moriasi, D.N.; Arnold, J.G.; Van Liew, M.W.; Bingner, R.L.; Harmel, R.D.; Veith, T.L. Model Evaluation Guidelines for Systematic Quantification of Accuracy in Watershed Simulations. Trans. ASABE 2007, 50, 885–900. [Google Scholar] [CrossRef]
- Gull, S.; Ma, A.; Dar, A. Prediction of streamflow and sediment yield of Lolab Watershed using SWAT model. Hydrol. Curr. Res. 2017, 8, 1–9. [Google Scholar] [CrossRef]
- Yesuf, H.; Assen, M.; Alamirew, T.; Melesse, A. Modeling of sediment yield in Maybar gauged watershed using SWAT, Northeast Ethiopia. Catena 2015, 127, 191–205. [Google Scholar] [CrossRef]
- Moench, M. Soil Erosion Under a Succession Agro Forestry Sequence: A case study from Idukki District, Kerala, India. Agrofor. Syst. 1991, 15, 31–50. [Google Scholar] [CrossRef]
- Vongkasem, W.; Klakhaeng, K.; Hemvijit, S.; Tongglum, A.; Katong, S.; Suparhan, D.; Howeler, R.H. Reducing soil erosion in cassava production systems in Thailand: A farmer participatory approach. In Cassava’s Potential in Asia in the 21st Century: Present Situation and Future Research and Development Needs, Proceedings of the Sixth Regional Workshop, Ho Chi Minh City, Vietnam, 21–25 February 2000; Howeler Reinhardt, H., Tan Swee, L., Eds.; Cassava Office for Asia: Bangkok, Thailand.
- Putthacharoen, S. Nutrient removal by crops and nutrient loss by erosion in cassava in comparison with that of other crops. Master’s Thesis, Kasetsart University, Bangkok, Thailand, 1992. [Google Scholar]
- Putthacharoen, S.; Howeler, R.H.; Jantawat, S.; Vichukit, V. Nutrient uptake and soil erosion losses in cassava and six other crops in a Psamment in Eastern Thailand. Field Crop. Res. 1998, 57, 113–126. [Google Scholar]
- Da Silva, V.S.G.; De Oliveira, M.W.; Oliveira, T.B.A.; Mantovanelli, B.C.; Da Silva, A.C.; Soares, A.N.R.; Clemente, P.R.A. Leaf area of sugarcane varieties and their correlation with biomass productivity in three cycles. Afr. J. Agric. Res. 2017, 12, 459–466. [Google Scholar]
- Cotter, M.; Asch, F.; Hilger, T.; Rajaona, A.; Schappert, A.; Stuerz, S.; Yang, X. Measuring leaf area index in rubber plantations−A challenge. Ecol. Indic. 2017, 82, 357–366. [Google Scholar] [CrossRef]
- Lahai, M.T.; Ekanayake, I.J.; Koroma, J.P.C. Influence of canopy structure on yield of cassava cultivars at various toposequences of an inland valley agro ecosystem. J. Agric. Biotechnol. Sustain. Dev. 2013, 5, 36–47. [Google Scholar] [CrossRef]
- Chanthorn, W.; Ratanapongsai, Y.; Brockelman, W.Y.; Allen, M.A.; Favier, C.; Dubois, M.A. Viewing tropical forest succession as a three-dimensional dynamical system. Theor. Ecol. 2015, 9, 163–172. [Google Scholar] [CrossRef]
- Sharma, A. Integrating Terrain and Vegetation Indices for Identifying Potential Soil Erosion Risk Area. Geo Spat. Inf. Sci. 2010, 13, 201–209. [Google Scholar] [CrossRef]
- Marden, M. Effectiveness of reforestation in erosion mitigation and implications for future sediment yields, East Coast catchments, New Zealand: A review. New Zealand Geogr. 2012, 68, 24–35. [Google Scholar] [CrossRef]
- Gassman, P.W.; Osei, E.; Saleh, A.; Rodecap, J.; Norvell, S.; Williams, J. Alternative Practices for Sediment and Nutrient Loss Control on Livestock Farms in Northeast Iowa. Agric. Ecosyst. Environ. 2006, 117, 135–144. [Google Scholar] [CrossRef]
- Schmidt, E.; Zernadim, B. Expanding Sustainable Land Management in Ethiopia: Scenarios for Improved Agricultural Water Management in the Blue Nile. Agric. Water Manag. 2015, 158, 166–178. [Google Scholar] [CrossRef]
- Arabi, M.; Govindaraju, R.S.; Hantush, M.M.; Engel, B.A. Role of Watershed Subdivision on Modeling the Effectiveness of Best Management Practices. J. Am. Water Resour. Assoc. 2006, 42, 513–528. [Google Scholar] [CrossRef]
- Taffarello, D.; Calijuri, M.D.C.; Viani, R.A.G.; Marengo, J.A.; Mendiondo, E.M. Hydrological services in the Atlantic Forest, Brazil: An ecosystem-based adaptation using eco-hydrological monitoring. Clim. Serv. 2017, 8, 1–16. [Google Scholar] [CrossRef]
- United Nations Environmental Programme. Green Infrastructure. Guide for Water Management: Ecosystem-based Management Approaches for Water-Related Infrastructure projects; United Nations Environmental Program: Nairobi, Kenya, 2014. [Google Scholar]
- Wischmeier, W.H.; Smith, D.D. Predicting Rainfall Erosion Losses: A Guide to Conservation Planning; US Department of Agriculture, Agricultural Handbook No.537; US Government Printing Office: Washington, DC, USA, 1978.
- United States Department of Agriculture. Manual on Natural Resources Conservation Practice Standard: Terraces-Code 600; Natural resources Conservation Services: Washington, DC, USA, 2009. [Google Scholar]
Publisher’s Note: MDPI stays neutral with regard to jurisdictional claims in published maps and institutional affiliations. |
© 2021 by the authors. Licensee MDPI, Basel, Switzerland. This article is an open access article distributed under the terms and conditions of the Creative Commons Attribution (CC BY) license (https://creativecommons.org/licenses/by/4.0/).

