Article

Natural Pans as an Important Surface Water Resource in the Cuvelai Basin—Metrics for Storage Volume Calculations and Identification of Potential Augmentation Sites

1
Institute of Geographical Science, Applied Physical Science–Environmental Hydrology and Resource Management, Freie Universitaet Berlin, 12249 Berlin, Germany
2
Institute of Geography and Geology, Julius-Maximilians-Universitaet Wuerzburg, 97074 Wuerzburg, Germany
3
German Remote Sensing Data Center, German Aerospace Center (DLR), Geo-Risks and Civil Security, Oberpfaffenhofen, 82234 Weßling, Germany
4
Department of Civil and Environmental Engineering, Faculty of Engineering and Information Technology, José Eduardo dos Santos Campus, University of Namibia, Ongwediva P.O. Box 3624, Namibia
*
Author to whom correspondence should be addressed.
Water 2021, 13(2), 177; https://doi.org/10.3390/w13020177
Submission received: 8 December 2020 / Revised: 8 January 2021 / Accepted: 10 January 2021 / Published: 13 January 2021
(This article belongs to the Section Water Resources Management, Policy and Governance)

Abstract

:
Numerous ephemeral rivers and thousands of natural pans characterize the transboundary Iishana-System of the Cuvelai Basin between Namibia and Angola. After the rainy season, surface water stored in pans is often the only affordable water source for many people in rural areas. High inter- and intra-annual rainfall variations in this semiarid environment provoke years of extreme flood events and long periods of droughts. Thus, the issue of water availability is playing an increasingly important role in one of the most densely populated and fastest growing regions in southwestern Africa. Currently, there is no transnational approach to quantifying the potential storage and supply functions of the Iishana-System. To bridge these knowledge gaps and to increase the resilience of the local people’s livelihood, suitable pans for expansion as intermediate storage were identified and their metrics determined. Therefore, a modified Blue Spot Analysis was performed, based on the high-resolution TanDEM-X digital elevation model. Further, surface area–volume ratio calculations were accomplished for finding suitable augmentation sites in a first step. The potential water storage volume of more than 190,000 pans was calculated at 1.9 km3. Over 2200 pans were identified for potential expansion to facilitate increased water supply and flood protection in the future.

1. Introduction

The Iishana-System is part of the western CB (Cuvelai Basin), which crosses the border between southern Angola and northern Namibia. The basin is one of the most densely populated areas in southern Africa; around 40% of all Namibian inhabitants live in this region. The high population density is expected to increase drastically at a growth rate of 1.4% in the next several years [1]. Projections for the year 2041 anticipate a population count 27% higher than what exists today [2]. One factor driving this growth is the presence of slightly more fertile soil than in the rest of the country [3]. The cultivation of rain-fed sorghum and millet and the practice of stock farming are the most important sources of rural income [4,5].
The semiarid climate of the region is characterized by a single rainy season between November and April (annual precipitation of 350–550 mm) and a potential evaporation rate of up to 3200 mm/a. Additionally, high seasonal, inter- and intra-annual climate variability frequently leads to extreme events, such as floods and droughts. These are the major factors controlling and limiting the development and safety of the local people’s livelihood, food security, and water availability [6,7,8,9,10,11].
Severe droughts struck in the late 1980s and mid 1990s. More recently, a longstanding drought has lasted from 2014 to 2019, with normal rainfall in 2017. This has caused a tremendous food insecurity for people in Namibia and Angola. Although the occurrence of droughts in semiarid environments is to be expected, awareness of and preparedness for drought events in the Iishana-System is rather low [5,12].
In addition to these drought events, flood disasters occurred recently in 2008, 2009, 2010, 2011, and 2013. These events caused fatalities and significant damage to property, crop yield, and livestock, as well as damage to the technical infrastructure of the region [7,10,13,14,15,16,17,18]. However, floods are also very important because they replenish the water system, which supports the local people’s livelihood through dry seasons [19]. The episodic surface water supports crop growth, provides fish and water grazing areas for livestock [12].
The Kunene River is an important headwater for the Iishana-System. It flows along a portion of the border for southwestern Angola and northwestern Namibia, respectively. The river water is diverted from Angola to the Namibian part of the Iishana-System by the 155 km Calueque-Oshakati Canal and is purified in a chain of four water works. Water availability strongly depends on the discharge of the northern part of the basin (located in southern Angola) [20], where the annual rainfall is much higher (550–950 mm) than the rainfall in northern Namibia (350–550 mm) [21]. Considering the low income in rural areas, many people are not able to pay for treated water. As such, water distribution conflicts are more than likely in periods of intense droughts and increasing water shortage [5,12]. Some residents interviewed by [10] have even reported that they have no access to piped water and thus depend on ground or surface water. In this context, the term “groundwater” includes not only deep aquifers but also shallow perched aquifers accessed by boreholes and hand-dug wells [22]. In rural areas, people construct small, hand-dug wells, which can be up to 20 m deep [19,23]. However, groundwater in the transboundary Iishana-System is highly mineralized and often not suitable for human consumption [24,25].
Shallow, interconnected ephemeral and endorheic river channels associated with thousands of small pans and natural depressions characterize the landscape in this region [3,5,10,11,13,19,23,25,26,27] (Figure 1 and Figure 2). These pans serve as an important source of water supply for agricultural and domestic use. Since the surface water of the ephemeral Iishana (singular Oshana) does not persist over the dry season, several adaptation strategies have been developed over the decades. For example, shallow artificial depressions are dug in the Iishana by local people to increase water retention. Such depressions are usually 3–5 m deep and collect the local rainfall and the Iishana runoff [19,23] (Figure 1a). Another technique to store water [28] is the use of a Stengel-Dam [29] (Stengel 1963) (Figure 1d). Among all these measures, the common aim is to reduce the population’s drought vulnerability. From an integrative perspective, such adaptation measures are necessary to increase water storage. Simultaneously, they help to prevent widespread devastation caused by floods.
It must be assumed that climate change will lead to more hydro-meteorological events in the near future, which will cause further floods and droughts in the Iishana-System. Therefore, increased pressure on the rural population living in a subsistence economy is to be expected [4,5], highlighting the need for a comprehensive assessment of the water balance for the entire transboundary basin.
Most preceding research on floods and droughts in the Iishana-System focused on the estimation of the flood extents [13,17,18,30], flood modeling [16,27], the description of flood impacts on livelihoods [10], and drought hazard assessment [5]. Thus, most studies concentrated on selected parts of the Iishana-System, but never on the entire region. Additionally, research has been carried out by [31,32,33,34] to analyze the water supply function and quality of hand-dug wells. However, there is no quantitative information on the water storage and supply function of the natural depressions in the Iishana system. Nor does information exist about the types, distribution, connectivity, and storage volume of natural and artificial pans. Thus, this study aims to comprehend the hydrological complexity of the entire Iishana-System by identifying and classifying the pattern, volume, depth, and distribution of its small, natural water pans. These patterns were identified and characterized by using a Blue Spot Analysis, which was based on the high-resolution TanDEM-X DEM (digital elevation model). Further, surface area–volume ratio calculations were undertaken for determining suitable augmentation sites.

2. Materials and Methods

2.1. Study Area

The Iishana-System is located in the western part of the CB [35] (Figure 2). The size of the total CB is about 97,620 km2. The Iishana-System covers about 18,370 km2. Approximately 1.2 million people live in this region (34% in Angola and 66% in Namibia) [3,21,36]. The study area is bounded by the Kunene River and Okavango River (Angola) in the north and by the Etosha Pan (Namibia) in the south.
The topography is characterized by very flat slope angles with average gradients of 1‰ in Angola to 0.5‰ in Namibia. With an elevation of about 1200 to 1100 m, the flat terrain plunges into the Etosha Pan [11]. The Iishana-System is defined as a diffuse network of shallow and ephemeral channels [3,5,10,11,13,23,25,26,27]. Their sizes are highly dynamic with widths reaching from 1.750 to 100 m and depths ranging from 1 to 7 m [11].
Several shallow depressions (natural pans) have formed due to a lack of morphologically well-defined discharge channels. These isolated pans connect to broad, undefined channels once they are filled with local rainwater [3].
Some of these channels have been covered by windblown sand, especially towards the southeast where drier conditions are present. As a result, the southern Iishana-System is characterized by tens of thousands of small pans, which are usually never connected to each other [11] except during heavy flood events.
The elevated areas between the Iishana consist of Kalahari sand. These locations are feasible for crop production and subsistence rain-fed agriculture [3]. In the lower Iishana areas, aeolian and fluvial sediments are present. These are frequently characterized by fine-grained material (clay fraction), calcite and, according to own investigations, also by silicate crusts. This composition supports low infiltration capacities and high surface runoff [24,38,39,40].
In terms of climate, the CB spans between a subtropical north and a semiarid south. The potential evaporation in the Iishana-System increases from west to east from 2600 to 3200 mm/a [7,11]. The annual precipitation increases from about 350 up to 950 mm along the same gradient. The rainy season runs from October to April and the dry season from May to September. The climate is characterized by a high interannual rainfall variability, causing floods and droughts with all their consequences, as mentioned in the preceding section [6,8,9,10].

2.2. DEM Preprocessing

This study was based on the TanDEM-X DEM, which provides a horizontal spatial resolution of around 12 and a vertical resolution of less than 1 m (i.e., information on the surface elevation is stored in floating point precision). The relative vertical accuracy is less than 2 m for regions with subtle topography (slope < 10°) [41]. From a hydrological point of view, the DEM is a great improvement compared to former DEMs (e.g., the SRTM DEM), which provided spatial resolutions of up to 20 m and accuracies of 16 m horizontally and 10 m vertically [42,43].
In using the DEM, two challenges had to be addressed prior to the Blue Spot Analysis. First, the DEM comes with some local inconsistencies and errors, which are due to phase-unwrapping problems caused by water surfaces. This effect typically manifests in locally restricted, highly increased elevation values (up to tens of meters compared to the surrounding terrain). Second, the DEM is a surface model, and the provided information displays the height of the terrain plus the height of man-made objects, vegetation, etc. A removal of these objects (along with the above-mentioned errors) is preferred for the hydrographic modeling. The processing steps, outlined in (Figure 3a), were applied to account for these issues and the Water Indication Mask (Water Mask), which comes along with the DEM [44], was used to remove inconsistencies over water surfaces [45]. The resulting gaps were interpolated with the help of the Image Analyzer Function of ArcGIS, called ‘Eliminate void and fill’ [46].
In the following, the Invert Fill algorithm (Figure 3a) was applied. This method is based on the approach of [47] and the Fill-function algorithm implemented in ArcGIS. First, the previously edited DEM was inverted with the help of the raster calculator by multiplying the DEM raster values by minus one. Second, the ArcMap Fill-function algorithm was used to fill the inverted peaks. Next, the inverted and the filled DEM were retransformed with the raster calculator by multiplying them by minus one again. As a result, the former inconsistencies, which appear as peaks in the DEM, were removed, but natural pans remained.
In the next step, vegetation obstacles were reduced with a 3 × 3 Focal Mean Filter to produce the ADEM (adjusted digital elevation model). Finally, major road dams, culverts and bridges were implemented. Details on the origin of the data used and the specific procedure of implementation can be read in [46].

2.3. Modified Blue Spot Analysis

The following approach is based on the ADEM and aims to identify natural pans [48]. The Blue Spot identification took place in several steps (Figure 3b):
First, the ADEM was filled by the ArcGIS Fill function with a threshold of 10 cm to account for possible artifacts and noises [49]. This means all pans were filled to 10 cm for equalization. Second, the ADEM was entirely filled to the pour point of all pans (not using a limiting threshold). These two results were subtracted to create the Blue Spots in the new raster layer called DEM-BS (digital elevation model–Blue Spots) [50]. In further post-processing, the results of the Blue Spot Analysis were cleaned and separated into unique groups through the use of the Boundary Clean, Majority Filter, and Region Group tools [51].
Finally, the data was transformed into a Feature Layer (i.e., vector geometry). From the resulting polygons, the attributes of area, depth, and sum were calculated amongst other relevant attributes. To calculate the volume values of each Blue Spot (Figure 4), the area was multiplied by the sum of the pixel depth then divided by the count of pixels (Equation (1)).
Volume (m3) = Area (m2) × Sum(pixel·depth)(m)/Count,

2.4. Validation

For validation, a mask was developed in cooperation with the Julius-Maximilians-University of Würzburg and the German Aerospace Center. This mask represents the maximum water coverage in the entire Iishana-System for a specified period. This MWE (Maximum Water Extent Mask) was developed using a multisensor approach [52]. It includes data from 12 different spaceborne remote sensors, which, in turn, are located on seven different satellites. The multispectral satellites used are Landsat-5 and Landsat-8, and the radar satellites are ALOS/PALSAR, ALOS-2/PALSAR-2, Envisat ASAR, Sentinel-1, and TerraSAR-X (Table A1).
All available images for three rainy seasons with floods were examined, covering the months of October to September during the years 2007/2008, 2008/2009, and 2016/2017. Single water masks were extracted for each available image within the three study periods. Detailed methods can be found for Landsat-5 and -8 data in [53], for Sentinel-1 radar data in [54], and for TerraSAR-X in [55]. The remaining data can be found in the RaMaFlood (Rapid Mapping of Flooding) process description of [56]. In addition, these water masks were used to calculate the total duration of annual floods [52] during the three study periods. If one pixel had two consecutive water detections, it was considered to be flooded and was assigned to the annual water mask for its respective study period. This subdivision fueled further investigation, which will be described in another study. Finally, the three individual annual water masks were merged into one mask, the MWE mask. Permanent water surfaces were excluded from the outset. Since one year with 365 days is not completely covered by any of the three study periods, water bodies are defined as permanent if the number of days with water presence within the total duration layer is higher than the maximum possible number of days minus 30 [57].
The validation process took place in two major steps and is outlined by an example in Figure 5.
In total, 11 photos of water-filled pans were taken in the countryside and in the city of Oshakati (Figure 6 and Figure 7(FA 2)) for ground truth control. Ten of these pictures were taken between the 5th and 7th of March 2018, ranging from one to three days after a heavy rain event. This work was done at the same time as the road dam survey and culvert detection study, which were conducted during the field trip in March and April of 2018. Details of the survey can be read in [46]. One photo was taken during the study’s first field trip on the 20th of September 2017 in Iipopo. This exception was included because it is the best-documented site in the study area.
Subsequently, the results of the Blue Spot Analysis (calculated pans) were compared to the onsite pictures. Next, the same calculated pans (Blue Spots) were compared to the MWE validation Mask. In both comparisons, overlapping analysis was performed by visual examination. For each approach, this process determined whether or not a Blue Spot matched both the photo and the MWE.

3. Results

The Iishana-System is typically considered and described as a unified and coherent hydrological system (Figure 6). For better examination, references to individual focus areas are made (Figure 7). At the same time, the landscape is artificially divided based on geopolitical boundaries in order to highlight possible hydrological potentials in a country-specific manner.

3.1. Surface Area

The study location covers an area of 18,370 km2, of which 8726 km2 belong to Angola and 9644 km2 to Namibia. The total area of all pans is about 4021 km2. Thus, the proportion of the total surface area is approximately 22% for Angola and 27% for Namibia.
The total number of all pans is 190,623, making an average of 10.4 pans per square kilometer. There are fewer pans in Angola (84,755) than there are in Namibia (106,089 pans). Likewise, the ratio of pans per square kilometer differs between the two states from 9.7 to 11.0, respectively (Table 1).
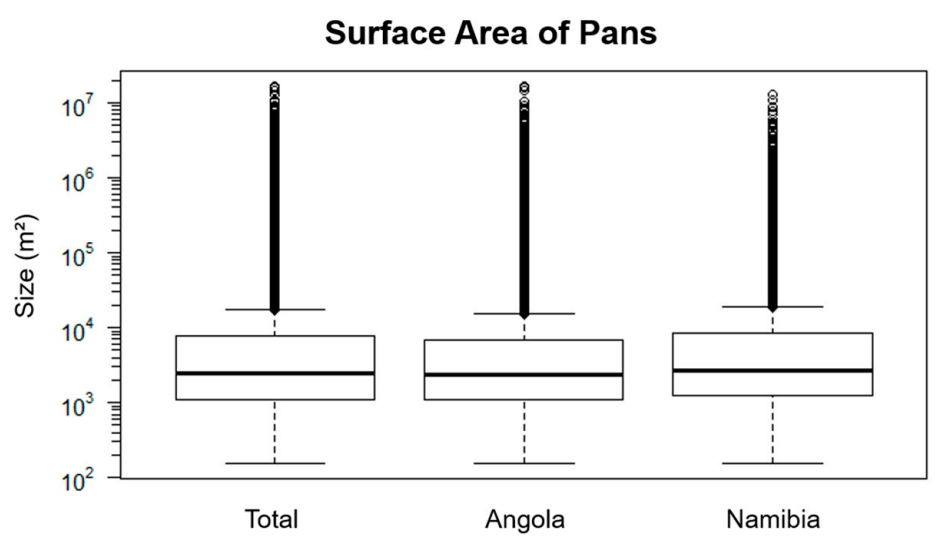
The size of the smallest pan in both states is 156.25 m2 and is valid as the smallest value for the entire study due to the methodological approach (raster resolution 12.5 × 12.5 m). The largest pan, with an area of around 16.8 km2, lies in the Angolan territory. For Namibia, the largest pan is about 13 km2. This size imbalance can be further observed in how the mean values and median values differ considerably, pointing to a skewed distribution. When looking at the entire study area, the mean area of pans is 21,096 m2, while the median is 2500 m2. Similarly, the values of Angola show a mean of 23,978 m2 and a median of 2343 m2 while the Namibian territory shows mean and median values of 18,749 and 2656 m2 (Table 1). These strong divergences between the mean and the median values result from a large number of small pans and a much smaller number of large pans, defined as outliers (Figure 8).
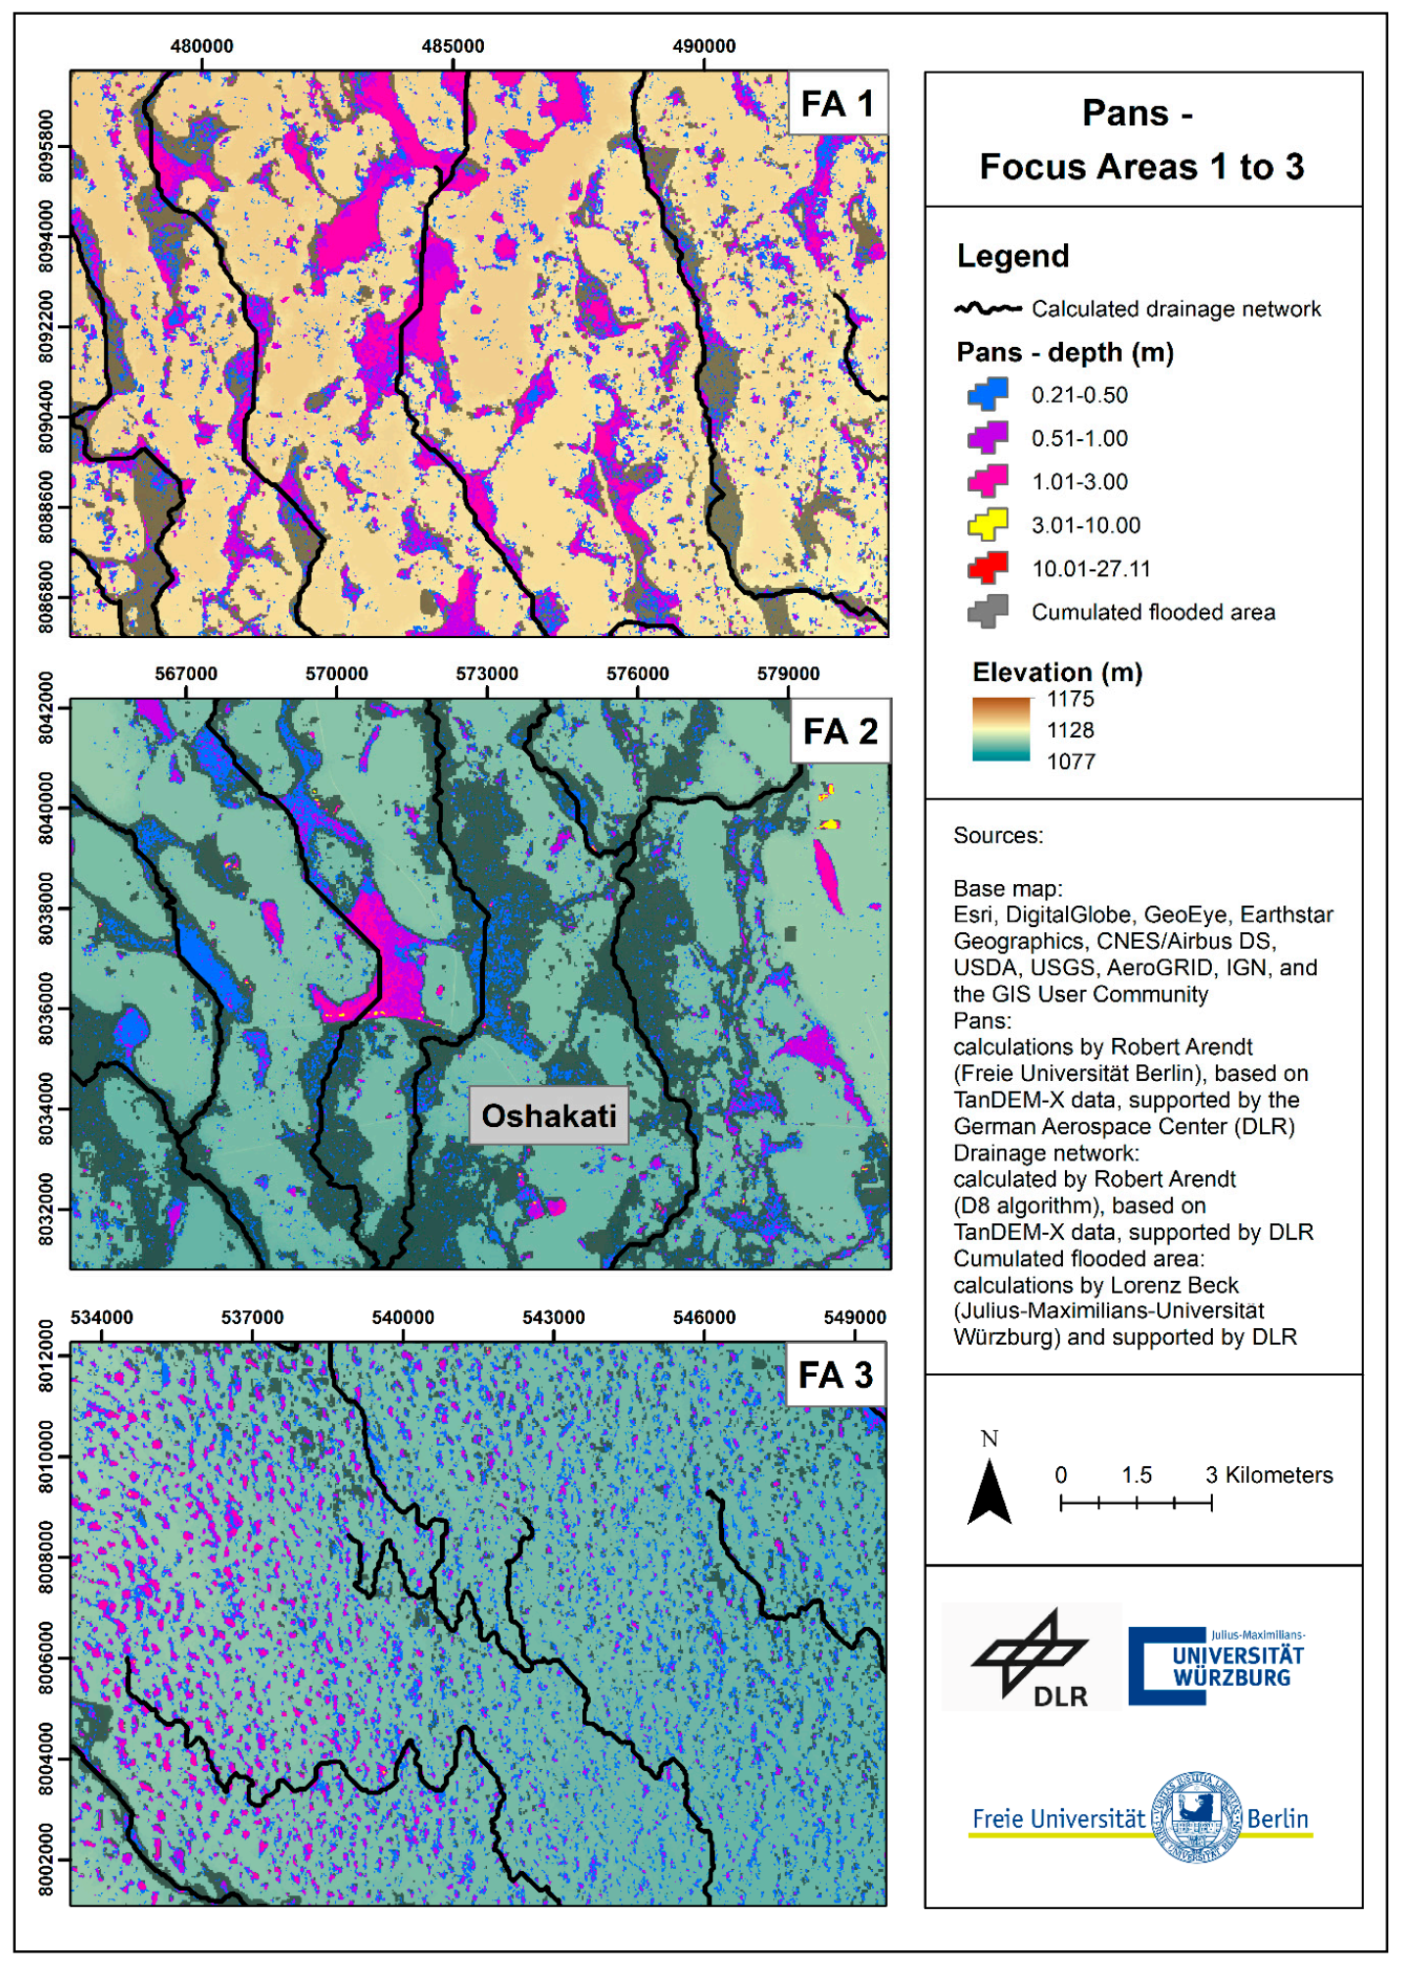
A comparison of the spatial distribution of the pans (Figure 6 and Figure 7) shows that on the Angolan side of the Iishana-System there are fewer pans than there are on the Namibian side. For all three regions (the entire Iishana-System, the Angolan portion, and the Namibian portion), the statistics show unimodal right-skewed distributions (Table 1). These are characterized by strong outliers (e.g., particularly large areas and all areas to be assigned to the right-skewed area are smaller) (Figure 8). Furthermore, there is a lower density of pans in Angola (Table 1). However, pans on the Angolan side are, on average, larger than those on the Namibian side. This is particularly evident along the more elevated areas in the north and west, as well as in the southwest (Figure 6 and Figure 7(FA 1)) and in the northeast portion of the study area, which extends to the city of Oshakati (Figure 7(FA 2)). The southern part of the study area is characterized by numerous, small pans that are not connected to the drainage network (Figure 7(FA 3)).

3.2. Depth

The depths of the pans range from 0.1 to 27.12 m throughout the Iishana-System (Table 1). The lowest depth is limited to 0.1 m according to the methodological approach. It is also the most common value in both subareas, Angola and Namibia. Therefore, in Figure 6 and Figure 7 a fixation to a limit of 0.21 m was made for visual reasons. All values up to a depth 0.20 m were disbanded in order to better identify relevant information. The deepest value of 27.12 m was identified on Namibian territory; the deepest value on the Angolan side is 19.26 m (Table 1).
The median and average depths for the entire area are 0.24 and 0.29 m. In the country-specific calculations, these values differ just slightly, although pans on the Namibian side are often shallower (Table 1). A similar picture emerges when looking at the quartiles: the vast majority of pans are very shallow, with depths of less than half a meter. When looking at the maximum depth values, it must be taken into account that borrow pits (Figure 1c) result in higher depth values (yellow areas in Figure 7(FA 2)).

3.3. Volume

The total volume of all pans was approximately 1.9 km3 and thus, as an example, corresponds to less than 0.1% of the volume of Lake Victoria, which measures 2424 km3. It is striking that about 67% of the total calculated volume is allocated to the Angolan side and only 33% of the total volume is attributable to the Namibian territory. The volumes of individual pans range from 0.1 to 12,642,002 m3, with the largest pan volume being located in Angola. By comparison, the largest Namibian pan has a volume of about 6,055,794 m3 (Table 1).
The median and mean values of the pan volumes also differ from one another. For the entire study area, the median value for volume is 612 m3, whereas the mean value is 9848 m3. A comparison between the pan volumes in Angola and Namibia shows that the median and mean values for Angola (668 and 13,810 m3) are considerably larger than those for Namibia (566 and 6662 m3). From the 75% quartiles, it is obvious that the majority of pan volumes is lower than approximately 2100 m3. Pans with a larger volume span from around 2100 to 12,642,002 m3. The bottom line is that the volume of pans in Angola is about twice as large as the volume in Namibia.

3.4. Surface Area–Volume Ratio

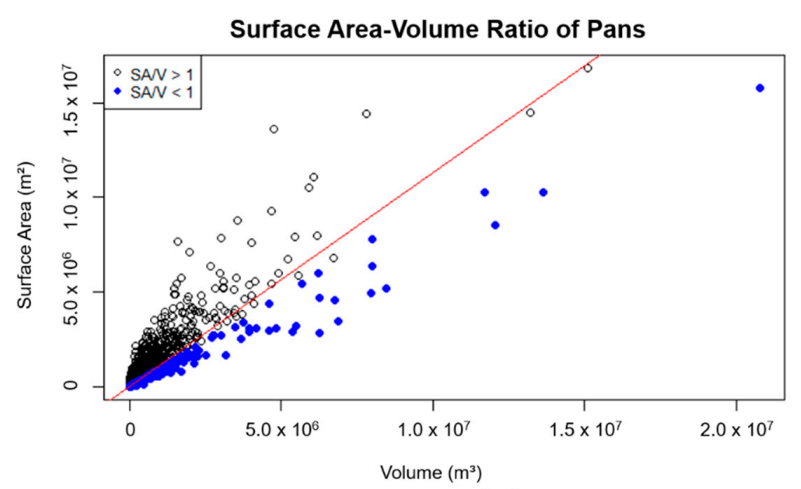
The SA/V value (ratio between the area and the volume of the pans) is an important metric to assess the water storage function of pans (Figure 9 and Figure 10). In deep pans with a small surface area, water loss by evaporation is much slower than in large, shallow depressions. For example, a reduction of 20% of the surface area results in a 20% reduction of evaporation [58].
The lowest SA/V ratio in the Iishana-System is 0.14 m−1 and the highest ratio is 538.95 m−1, both extremes are found on the Namibian side (Table 1). In the Angolan region of the study area, the lowest SA/V ratio is 0.60 m−1 while the highest value is 102.40 m−1.
The overall assessment of the SA/V ratios indicates that the rates for the Angolan side are lower than those for the Namibian side, and so the problem of water loss due to evaporation has a bigger impact in the Namibian region.
Presuming that an optimum SA/V ratio is ≤1 m−1, [58] all values labeled blue in Figure 10 show the most qualified pans for potential artificial enlargement to increase the storage function. Under this condition, 2176 pans were identified as suitable for augmentation.

3.5. Example and Synopsis

As a specific example, the water filled pan of an Oshana next to the small village Iipopo is used as a natural flood water harvesting measure (Figure 5a,b). Water is stored during the rainy season and provides a resource throughout the dry season for irrigating cash crops like tomatoes [14]. The plantation is marked with a black rectangle and the remaining body of water is framed with a red polygon, both visible in Figure 5b,c,e. Picture (a) in Figure 5 was taken at the end of the dry season in September 2017 and shows the remaining water stored in the pan (Figure 5a,b). A few months later in March 2018, after the rainy season, the pan dried out completely (Figure 5d,e). This was the result of little rainfall during the wet season of 2017/2018, which was a continuation of a 3- to 4-year-long drought period. This drought did not end until the rainy season of 2019/20.
The processed drainage network (D8-algorithm) and the cumulative flooded area in Figure 5c shows that the floodwater typically fills all pans and the Iishana up to a certain point, depending on the amount of precipitation that has fallen in Angola and Namibia during the rainy season. This case clearly demonstrates that the priory calculated pans (Figure 5c) match when compared to the water surface area validated in September 2009 (Figure 5a,b). Additionally, the MWE (Maximum Water Extent Mask) verifies that the results are correct.
Regarding the metrics of the pans, about one-third of the total and both the largest and deepest pans are located within potential flood plains and in the ephemeral runoff trajectories of the Iishana-System. There are fewer pans, both by total number and per km2, in Angola than there are in Namibia. In contrast, the Angolan part of the region represents slightly more than two-thirds of the potential total volume of 1.9 km3. This difference is also reflected in lower SA/V rates and, on average, slightly greater depths of the pans on the Angolan side. However, both subregions and the entire study area are similar in having strong outliers in terms of area, size, volume, and depth, and thus they are all characterized by unimodal right-skewed distributions (Table 1).

4. Discussion

4.1. Error Analysis

As noted by [26], currently, no standardized validation procedures exist for the accuracy assessment of extracted discharge networks. Therefore, all methods applied must always consider the specific landscape characteristics of the individual study area, as well as those of the basic data used. This also applies to the current validation methods of pans.
Looking at the DEM data, possible errors can be found in the backscatter behavior of the radar signal. Rizzoli et al. (2017) [41] describes a weak backscatter behavior on sandy surfaces, which could be improved by increasing the angle of the emitting sensor. Thus, the predicted error rate of all pixels for the global model could be reduced from 3% to 0.1%. Furthermore, a vertical accuracy of 2 m with a confidence interval of 90% is given. In the range of 50%, an accuracy of 1 m is given. This accuracy is remarkable, but it still casts a critical light on the results of the volume calculation here; minimal deviations can cause a significant volume change. Currently, a quantification of this potential error is not possible.
Moreover, it must be determined whether very small elements (e.g., pan 156 m2) are true pans or just errors resulting from water-induced interferences. In this study, the DEM preprocessing was based on an approach published in a preliminary work [46] in which algorithms for hydrographic modeling were well established and considered accurate. As such, we believe that an accurate result for the spatial characteristics of pans was derived, especially considering that the topographic setting in the Iishana-System allows for such small pans. Additionally, the ground truth control points, although few in number, confirmed these results.
Mendelsohn et al. (2013) [11] emphasize that the northern Cuvelai Basin (in Angola) consists of broader channels while the southern part of the Iishana-System consists of many smaller pans measuring less than 100 m2, traditional hand-dug wells, surface dams, and smaller ponds. Furthermore, the authors of [39] describe the amount of pans as innumerable, and their size in the southern parts as minor due to the low topography. Additionally, in [23] the authors describe these small ponds as having diameters of 4–5 m and depths of 8–9 m and small SA/V ratios. These smaller ponds would not be detected as natural pans due to the raster resolution. Therefore, the results only show the natural pans described by [11] and [39] and not the small artificial pans. Here the advantages of DEM resolution can be seen.
Other inaccuracies may occur in the generalization of pixel groups. The grouping of pixels (clustering) helped to reduce the enormous number of individual small pans measuring 156 m2 (i.e., area covered by one pixel in the DEM). According to [59], this approach has advantages and disadvantages, which have to be considered during the evaluation of the results. The advantage is the reduction of outliers as well as the connection of pixels that actually belong together, which were separated due to the mixed-pixel effect. On the other hand, pixels that do not belong together may also be erroneously connected. However, since the advantages of this approach outweigh the reduction of outliers, this method was used in preprocessing.
The calculated flow paths and the MWE mask fit well together and have a high level of agreement. Therefore, reliability is high for the flow path analysis (Figure 6 and Figure 7).
The validation of the calculated pans, with the help of the identified flood areas, should also be viewed critically. This method increases the probability of the occurrence of a pan, but it does not show it in detail. Only validation by ground truth control, e.g., with photos, provides security. Nevertheless, the validation procedure shows a high degree of accuracy, as the result in Section 3.5 shows (Figure 7). Additionally, this method provides the best performance in rural areas.

4.2. Function as a Water Resource

The transboundary region suffers simultaneously from a poor socioeconomic performance and a high frequency of natural hazards, namely floods and droughts. Moreover, resilience in regards to climate change is insufficient [5,60]. Studies have shown that Namibia has more pans, in total, than Angola does, but those Namibian pans have less volume. Just one third of the total volume of pans belongs to Namibia. Additionally, individual pans with the largest volumes all appear in Angola. Considering the heightened ecosystem stress due to climate change with less precipitation, higher evapotranspiration and a growing population on the Namibian Iishana-System, efforts should be undertaken to artificially deepen these natural reservoirs to sustain the people’s resilience. However, how to start this approach?
In the past, efforts have been made to push the concept and implementation of rainwater-harvesting techniques, especially rooftop harvesting in rainwater tanks [61,62]. However, these are expensive for a rural population living under subsistence economy conditions. A rainwater-harvesting tank costs anywhere from USD 460 to 870 for a 10 m3 tank, depending on the material [62]. Meanwhile, many older, man-made depressions are no longer in use [23]. Therefore, the answer to the water resource question should be to reactivate the man-made depressions. This approach will be cheaper because no costly material is required for construction. To implement this plan, selected pans would have to be identified and deepened (excavated) as retention measures. The SA/V ratio could be an essential factor in the analysis for identifying suitable pans for enlargement. It is clear that these natural pans play a major role now and in the future in supplying the local population and livestock with water.
Additionally, the differences in the pan depths indicate that the process of linear surface runoff dominates on the Angolan side of the study area. As the distance to the Etosha Pan decreases, the ground slope also decreases, leading to a prevalence of extensive surface runoff.
It can be concluded that the deeper, linear forms in Angola are maintained by flood runoff while the shallow forms in Namibia are, perhaps, mainly filled during flood events. This is a question to be analyzed in future research. Consequently, the fluvial-morphology determines and affects the available water resource in the different parts of the study area.
Furthermore, one third of all pans are located in the inundation zone, making these spots major priority locations for enlargement. The use of the above-mentioned retaining measures on these pans would provide both flood protection and water storage capabilities. These priority locations would be filled by precipitation and floodwater, thus increasing the ability for water storage and enhancing the resilience of the rural population.
Accordingly, enlargement should be performed on pans that meet the following criteria:
(1)
Pan must be close to a location with a high demand for water/flood protection;
(2)
Pan must be primarily connected to the channel network within an inundation zone;
(3)
Pan needs a low SA/V-ratio to counter the problem of high evaporation rates.
For the pans in the southern part of the study area, the situation is different. Here the pans are filled mostly by precipitation. Surface runoff usually finds no entry into the depressions, since these are often geomorphologically encapsulated (Section 2.1). Therefore, it is proposed that these isolated pans be opened and connected via the calculated flow paths to enhance the probability that they will be filled during rainfall and surface runoff events. This can boost the water volume to better meet the increased water demand. Up until this point, this concept has only been applied for smaller, hand-dug pans in the northern regions [23].

5. Conclusions and Outlook

Ephemeral rivers and numerous natural and artificial depressions hydro-morphologically characterize the semiarid and transboundary Iishana-System between southern Angola and northern Namibia. A high inter- and intra-annual variation of precipitation regularly leads to floods and also to severe droughts.
Therefore, the aim of this work is to increase the resilience of the local people’s livelihood by identifying suitable pans for expansion as intermediate storage. These pans will reduce the flood peak and provide water for drier periods.
The identification of the pans in this very topographically flat region was a great challenge. Therefore, a new strategy for processing the TanDEM-X elevation model was developed and applied in combination with a modified Blue Spot analysis.
The validation of the results was done with the help of calculated flood masks. Additionally, photos were taken during a field trip to verify the ground truth. Thanks to the double validation approach, reliable statements could be made despite less available data.
More than 190,000 pans were identified. The total potential volume of these pans was determined to be 1.9 km3, with the Angolan territory accounting for about 2/3 of the volume and the Namibian territory only accounting for about 1/3. The total surface area of all pans is 4021 km2. This means that about one fifth of the entire region is covered by pans. A distinction between artificial and natural pans could be made by calculating the mean depths. It was shown that the pans are very shallow, measuring barely 30 cm deep on average. At the same time, however, there are also numerous outliers with significantly greater depths (Figure 10), which will be the focus of investigation in the following work. Additionally, about one third of all pans are located inside the ephemeral flow paths.
Furthermore, the hydro-morphological differences of the pans between the northern area (Angola) and the southern area (Namibia) described in the literature can be confirmed [11,23,39]. In depth, width and volume, the pans in the northern region are larger than those in the southern part of the Iishana-System. In addition, the hydro-morphological characteristics of numerous small, isolated depressions in the very south can be confirmed.
In order to identify pans as potential water reservoirs, a further parameter was determined. The surface area–volume ratio takes into account the volume coupled with the surface of a pan and thus provides an important indication of the natural storage time of the water in the system with regard to the high evaporation rates in this region. With the help of these calculations, more than 2000 pans were identified and could be considered for potential further enlargement.
A prioritization procedure should be applied for the selection of potential sites. According to the criteria described in Section 4.2, potential sites should first be selected according to their distance from a settlement structure with increased water demand. In addition, the selection of the site should be based on its connection to the channel network in order to increase the probability of filling by flood or precipitation water. Nonconnected pans should at least be as close as possible to a drainage system in order to be artificially connected to it. To make the implementation worthwhile, the surface area of the pan should be large enough and, at the same time, should have a SA/V ratio smaller or equal to one.
Currently, a validation of the calculated volumes is missing. UAV flights were planned for April and September 2020. Using the Structure-from-Motion method, accurate 3D models of selected pans should be created, and the volumes calculated and compared with those derived from the DEM. Due to the COVID-19 pandemic and the resulting travel restrictions, this project has to be realized in the future.
For the first time in the literature to date, this investigation drew a detailed morphometric picture of the pans within the Iishana-System. The relevance of this work is further demonstrated by the key characteristics of distribution and shapes as well as sizes and volumes. Especially with regard to climate change, this work provides initial answers for future work on flood protection and water storage for years of drought, which should be a priority task to protect the local people’s livelihood and enhance their resilience.

Author Contributions

Conceptualization, R.A. and C.R.-I.; methodology, R.A., C.R.-I.; software, R.A.; validation, R.A., T.U. and L.B., S.M.; formal analysis, R.A.; investigation, R.A.; resources, A.S.; data curation, R.A., T.U., L.B., S.M.; writing—original draft preparation, R.A.; writing—review and editing, L.F., J.L., P.J., T.U., C.R.-I., R.A., A.S.; visualization, R.A.; supervision, A.S., C.R.-I., T.U.; project administration, A.S., L.F., R.A.; funding acquisition, A.S. All authors have read and agreed to the published version of the manuscript.

Funding

This project was cofounded by the Geo.X-plattform and the Deutsche Hydrologische Gesellschaft.

Institutional Review Board Statement

Not applicable.

Informed Consent Statement

Not applicable.

Data Availability Statement

The data presented in this study are available on request from the corresponding author.

Acknowledgments

We thank the German Aerospace Centre (© DLR 2017) for their delivery and support with the TanDEM-X data (Proposal ID: DEM_HYDR1285). ALOS/PALSAR and ALOS-2/PALSAR-2 data are kindly provided by JAXA (Proposal number MTH 1153, PI number 3043). We are grateful for the collaboration with the University of Namibia (Campus Ongwediva). The publication of this article was funded by Freie Universität Berlin.

Conflicts of Interest

The authors declare no conflict of interest. The cofounders had no role in the design of the study; in the collection, analyses, or interpretation of data; in the writing of the manuscript, or in the decision to publish the results.

Appendix A

Table A1. Satellite data used for validation and its properties.
SensorProduct NameFinal Pixel Spacing (m)Coverage (km: Range × Azimuth)Polarizations/Bands
RadarALOS PALSAR–FBS GEC *6.2570 × 90SinglePol HH
ALOS PALSAR–FBD GEC *1370 × 90DualPol HH + HV
ALOS PALSAR–PLR GEC *12.530 × 90QuadPol HH + HV + VH + VV
ALOS2 PALSAR–SM3 FBD 1.1 *1070 × 70DualPol HH + HV
Envisat ASAR–IMP12.570–90 × 110–130SinglePol (VV|HH)
Envisat ASAR–WSM75400–450 × variableSinglePol (VV|HH)
Sentinel-1B GRD10250 × 175DualPol VV + VH
TSX-ScanSAR7.5100 × 150SinglePol HH
TSX-Stripmap2.515–30 × 50–75SinglePol HH
TSX-Spotlight210 × 10SinglePol HH
OpticalLandsat 5 L130 (bands 1–5, 7)170 × 1837
Landsat 8 L130 (bands 1–7, 9–11)170 × 18511
* Product Level: ESA GEC = JAXA 1.5, ESA SLC = JAXA 1.1.

References

  1. Namibia Statistics Agency. Namibia 2011 Population and Housing Census Atlas; Namibia Statistics Agency: Windhoek, Namibia, 2013. [Google Scholar]
  2. Namibia Statistics Agency. Namibia 2011 Census Population Projections 2011 to 2041; Namibia Statistics Agency: Windhoek, Namibia, 2014. [Google Scholar]
  3. Persendt, F.C.; Gomez, C. Assessment of drainage network extractions in a low-relief area of the Cuvelai Basin (Namibia) from multiple sources: LiDAR, topographic maps, and digital aerial orthophotographs. Geomorphology 2016, 260, 32–50. [Google Scholar] [CrossRef] [Green Version]
  4. Luetkemeier, R.; Liehr, S. Integrated responses to drought risk in Namibia and Angola. Water Solut. 2019, 3, 56–60. [Google Scholar]
  5. Luetkemeier, R.; Stein, L.; Drees, L.; Liehr, S. Blended Drought Index: Integrated Drought Hazard Assessment in the Cuvelai-Basin. Climate 2017, 5, 51. [Google Scholar] [CrossRef] [Green Version]
  6. Gaughan, A.E.; Staub, C.G.; Hoell, A.; Weaver, A.; Waylen, P.R. Inter- and Intra-annual precipitation variability and associated relationships to ENSO and the IOD in southern Africa. Int. J. Climatol. 2016, 36, 1643–1656. [Google Scholar] [CrossRef]
  7. Persendt, F.C.; Gomez, C.; Zawar-Reza, P. Identifying hydro-meteorological events from precipitation extremes indices and other sources over northern Namibia, Cuvelai Basin. Jàmbá 2015, 7, 177. [Google Scholar] [CrossRef]
  8. Reason, C.J.C.; Smart, S. Tropical south east Atlantic warm events and associated rainfall anomalies over southern Africa. Front. Environ. Sci. 2015, 3, 24. [Google Scholar] [CrossRef]
  9. Kundzewicz, Z.W.; Kanae, S.; Seneviratne, S.I.; Handmer, J.; Nicholls, N.; Peduzzi, P.; Mechler, R.; Bouwer, L.M.; Arnell, N.; Mach, K.; et al. Flood risk and climate change: Global and regional perspectives. Hydrol. Sci. J. 2014, 59, 1–28. [Google Scholar] [CrossRef] [Green Version]
  10. Shifidi, V.T. Impact of flooding on rural livelihoods of the Cuvelai Basin in Northern Namibia. J. Geogr. Reg. Plan. 2016, 9, 104–121. [Google Scholar] [CrossRef] [Green Version]
  11. Mendelsohn, J.M.; Jarvis, A.; Robertson, T. A Profile and Atlas of the Cuvelai-Etosha Basin; RAISON and Gondwana Collection: Windhoek, Namibia, 2013; ISBN 978-99916-780-7-8. [Google Scholar]
  12. Seely, M.; Henderson, J.; Heyns, P.; Jacobson, P.; Nakale, T.; Nantanga, K.; Schachtschneider, K. Ephemeral and endoreic river systems: Relevance and management challenges. In Transboundary Rivers, Sovereignty and Development: Hydropolitical Drivers in the Okavango River Basin; Turton, A., Ashton, P., Cloete, E., Eds.; AWIRU: Pretoria, South Africa, 2003; pp. 187–212. [Google Scholar]
  13. Awadallah, A.G.; Tabet, D. Estimating flooding extent at high return period for ungauged braided systems using remote sensing: A case study of Cuvelai Basin, Angola. Nat. Hazards 2015, 77, 255–272. [Google Scholar] [CrossRef]
  14. Bischofberger, J.; Schuldt-Baumgart, N.; Lenzen, E. Omeya Ogo Omwenyo—Water is Life; CuveWaters Report; ISOE: Frankfurt/Main, Germany, 2016. [Google Scholar] [CrossRef]
  15. Filali-Meknassi, Y.; Ouarda, T.B.M.J.; Wilcox, C. Data Access, Availability and Quality Assessment for the Development of a Flood Forecasting Model for Namibia; UNESCO: Windhoek, Namibia, 2014. [Google Scholar]
  16. Mufeti, P.; Rientjes, T.; Mabande, P.; Maathuis, B. Application of a satellite based rainfall-runoff model: A case study of the Trans Boundary Cuvelai Basin in Southern Africa. In Proceedings of the European Space Agency Living Planet Symposium, Edinburgh, UK, 9–13 September 2013; Ouwehand, L., Ed.; ESA Communications: Noordwijk, The Netherlands, 2013. SP-722. ISBN 978-92-9221-286-5. [Google Scholar]
  17. Mandl, D.; Frye, S.; Sohlberg, R.; Cappelaere, P.; Handy, M.; Grossman, R. The Namibia Early Flood Warning System, a CEOS pilot project. In Proceedings of the 2012 IEEE International Geoscience and Remote Sensing Symposium, Munich, Germany, 22–27 July 2012; IEEE: Starkville, MS, USA, 2013; pp. 3521–3524. [Google Scholar]
  18. Skakun, S.; Kussul, N.; Shelestov, A.; Kussul, O. Flood Hazard and Flood Risk Assessment Using a Time Series of Satellite Images: A Case Study in Namibia: Flood Hazard and Flood Risk Assessment. Risk Anal. 2014, 34, 1521–1537. [Google Scholar] [CrossRef] [PubMed]
  19. Cunningham, T.; Auino, E.; Marsh, A.; Seely, M. Oshanas: Sustaining People, Environment, and Development in Central Owambo, Namibia; DRFN: Windhoek, Namibia, 1992; ISBN 978-99916-709-0-4. [Google Scholar]
  20. Klintenberg, P.; Mazambani, C.; Nantanga, K. Integrated Water Resources Management in the Namibian Part of the Cuvelai Basin, Central Northern Namibia, CuveWaters Papers No. 2; ISEO: Frankfurt/Main, Germany, 2007. [Google Scholar]
  21. Mendelsohn, J.; Weber, B. Cuvelai: The Cuvelai Basin, its Water and People in Angola and Namibia = Povos e águas da bacia do Cuvelai em Angola e Namibia; Occasional Paper; Development Workshop Angola: Luanda, Angola, 2011; ISBN 978-99916-780-6-1. [Google Scholar]
  22. Kluge, T.; Polak, M. Water supply infrastructure and sanitation in central-northern Namibia. In Integrated Water Resources Management in Water-Scarce Regions; Kramm, J., Jokisch, A., Müller, K., Eds.; IWA Publishing: London, UK, 2018; pp. 19–22. ISBN 978-1-78040-790-6. [Google Scholar]
  23. Zimmermann, M. Sustainable Transformations of Water Supply Regimes. The Cuvelai-Etosha Basin in Central Northern Namibia, Schriftenreihe IWAR; Inst. IWAR: Darmstadt, Germany, 2013; ISBN 978-3-940897-22-0. [Google Scholar]
  24. Faulstich, L.; Schulte, A.; Arendt, R.; Kavishe, F.; Lengricht, J. Die Qualität der intensiv genutzten Oberflächengewässer im Cuvelai-Becken (Nord-Namibia) zum Ende der Trockenzeit 2017. In Proceedings of the Beiträge zum 49. Jahrestreffen des Arbeitskreises Hydrologie, Göttingen, Germany, 23–25 November 2017; Chifflard, P., Karthe, D., Möller, S., Eds.; Universität Augsburg: Augsburg, Germany, 2018; pp. 9–21. [Google Scholar]
  25. Kluge, T.; Liehr, S.; Lux, A.; Moser, P.; Niemann, S.; Umlauf, N.; Urban, W. IWRM concept for the Cuvelai Basin in northern Namibia. Phys. Chem. Earth Parts ABC 2008, 33, 48–55. [Google Scholar] [CrossRef]
  26. Ngula Niipele, J.; Chen, J. The usefulness of alos-palsar dem data for drainage extraction in semi-arid environments in The Iishana sub-basin. J. Hydrol. Reg. Stud. 2019, 21, 57–67. [Google Scholar] [CrossRef]
  27. Goormans, T.; Van Looveren, R.; Mufeti, P.; Wynants, J. Building a Hydrological and Hydrodynamic Model while facing Challenges in Data availability in the Oshana Region of Central Northern Namibia. In Proceedings of the E-Proceedings of the 36th IAHR World Congress, The Hague, The Netherlands, 28 June–3 July 2015; Mynett, A., Ed.; IAHR: Madrid, Spain, 2015; pp. 5222–5233, ISBN 978-1-5108-2434-8. [Google Scholar]
  28. Beyer, M.; Hipondoka, M.; Hamutoko, J.; Wanke, H. Water resources in the Cuvelai-Etosha Basin. Biodivers. Ecol. 2018, 6, 84–85. [Google Scholar] [CrossRef]
  29. Stengel, H.W.; Wipplinger, O.; Lempp, F. Wasserwirtschaft in S. W. A. Waterwese in S. W. A. Water affairs in S. W. A.; Afrika-Verlag Der Kreis: Windhoek, Namibia, 1963. [Google Scholar]
  30. Müller, I.; Hipondoka, M.; Winkler, K.; Geßner, U.; Martinis, S.; Taubenböck, H. Monitoring flood and drought events—Earth observation for multiscale assessment of water-related hazards and exposed elements. Biodivers. Ecol. 2018, 6, 136–143. [Google Scholar] [CrossRef]
  31. McBenedict, B.; Hauwanga, W.N.; Wanke, H.; Chimwamurombe, P.M.; Hang’ombe, B.M. Seasonal Health Risks Due to Zoonotic Pathogens from Hand-dug Well Water in Ohangwena and Omusati Regions of Namibia. J. Pure Appl. Microbiol. 2019, 13, 1583–1593. [Google Scholar] [CrossRef] [Green Version]
  32. Wanke, H.; Beyer, M.; Hipondoka, M.; Hamutoko, J.; Gaj, M.; Koeniger, P.; Himmelsbach, T. The long road to sustainability: Integrated water quality and quantity assessments in the Cuvelai-Etosha Basin, Namibia. Biodivers. Ecol. 2018, 6, 75–83. [Google Scholar] [CrossRef] [Green Version]
  33. Wanke, H.; Nakwafila, A.; Hamutoko, J.T.; Lohe, C.; Neumbo, F.; Petrus, I.; David, A.; Beukes, H.; Masule, N.; Quinger, M. Hand dug wells in Namibia: An underestimated water source or a threat to human health? Phys. Chem. Earth Parts ABC 2014, 76–78, 104–113. [Google Scholar] [CrossRef]
  34. Zimmermann, M. The coexistence of traditional and large-scale water supply systems in central northern Namibia. J. Namib. Stud. 2010, 7, 55–84. [Google Scholar]
  35. Miller, R.M.; Pickford, M.; Senut, B. The geoglogy, paleontology and evolution of the Etosha Pan, Namibia: Implications for terminal Kalahari deposition. South Afr. J. Geol. 2010, 113, 307–334. [Google Scholar] [CrossRef]
  36. Digital Atlas of Namibia. Available online: https://www.uni-koeln.de/sfb389/e/e1/download/atlas_namibia/haupt_namibia_atlas.html (accessed on 26 October 2016).
  37. United Nations Office for Coordination of Humanitarian Affairs Regional Office for South Africa. Available online: https://data.humdata.org/dataset/hotosm_nam_roads (accessed on 16 February 2018).
  38. Goudie, A.; Viles, H.A. Landscapes and Landforms of Namibia; World Geomorphological Landscapes; Springer: Dordrecht, The Netherlands, 2015; ISBN 978-94-017-8020-9. [Google Scholar]
  39. Hipondoka, M.H.T. TThe Development and Evolution of Etosha Pan. Ph.D. Thesis, Julius-Maximilians-Universität, Würzburg, Germany, 2005. [Google Scholar]
  40. Hüser, K.; Besler, H.; Blümel, W.D.; Heine, K.; Leser, H.; Rust, U. Namibia: Eine Landschaftskunde in Bildern; Klaus Hess Verlag: Göttingen, Germany, 2001; ISBN 978-3-933117-14-4. [Google Scholar]
  41. Rizzoli, P.; Martone, M.; Gonzalez, C.; Wecklich, C.; Borla Tridon, D.; Bräutigam, B.; Bachmann, M.; Schulze, D.; Fritz, T.; Huber, M.; et al. Generation and performance assessment of the global TanDEM-X digital elevation model. ISPRS J. Photogramm. Remote Sens. 2017, 132, 119–139. [Google Scholar] [CrossRef] [Green Version]
  42. Mukul, M.; Srivastava, V.; Jade, S.; Mukul, M. Uncertainties in the Shuttle Radar Topography Mission (SRTM) Heights: Insights from the Indian Himalaya and Peninsula. Sci. Rep. 2017, 7, 41672. [Google Scholar] [CrossRef] [PubMed] [Green Version]
  43. Smith, B.; Sandwell, D. Accuracy and resolution of shuttle radar topography mission data. Geophys. Res. Lett. 2003, 30, 20. [Google Scholar] [CrossRef] [Green Version]
  44. Wessel, B. TanDEM-X Ground Segment—DEM Products Specification Document; Public Document TD-GS-PS-0021, Issue 3.1; EOC, DLR: Oberpfaffenhofen, Germany, 2016. [Google Scholar]
  45. Wendleder, A.; Wessel, B.; Roth, A.; Breunig, M.; Martin, K.; Wagenbrenner, S. TanDEM-X Water Indication Mask: Generation and First Evaluation Results. IEEE J. Sel. Top. Appl. Earth Obs. Remote Sens. 2013, 6, 171–179. [Google Scholar] [CrossRef] [Green Version]
  46. Arendt, R.; Faulstich, L.; Jüpner, R.; Assmann, A.; Lengricht, J.; Kavishe, F.; Schulte, A. GNSS mobile road dam surveying for TanDEM-X correction to improve the database for floodwater modeling in northern Namibia. Environ. Earth Sci. 2020, 79, 333. [Google Scholar] [CrossRef]
  47. Rutzinger, M.; Höfle, B.; Geist, T.; Stötter, J. Object-based building detection based on airborne laser scanning data within GRASS GIS environment. In Proceedings of the UDMS 2006: Urban Data Management Symposium, Aalborg, Denmark, 15–17 May 2006; Bodum, L., Ed.; UDMS: Delft, The Netherlands, 2006; pp. 7.37–7.48. [Google Scholar]
  48. Nielsen, N.H.; Larsen, M.R.A.; Rasmussen, S.F. Development of a screening method to assess flood risk on Danish national roads and highway systems. Water Sci. Technol. 2011, 63, 2957–2966. [Google Scholar] [CrossRef]
  49. Jenson, S.K.; Domingue, J.O. Extracting topographic structure from digital elevation data for geographic information-system analysis. Photogramm. Eng. Remote Sens. 1988, 54, 1593–1600. [Google Scholar]
  50. Balstrøm, T. Assessment of Flood Risks for Residential Areas Caused by Cloudbursts. In Proceedings of the ESRI User Conference, San Diego, CA, USA, 20–24 July 2015. [Google Scholar]
  51. Grim, S. Abflusslose Senken—Instrumente in der Landschaftsanalyse und Indikatoren Rezenter Krustenbewegungen. Ph.D. Thesis, Johannes-Gutenberg-Universität, Mainz, Germany, 2012. [Google Scholar] [CrossRef]
  52. Rättich, M.; Martinis, S.; Wieland, M. Automatic Flood Duration Estimation Based on Multi-Sensor Satellite Data. Remote Sens. 2020, 12, 643. [Google Scholar] [CrossRef] [Green Version]
  53. Wieland, M.; Martinis, S. A Modular Processing Chain for Automated Flood Monitoring from Multi-Spectral Satellite Data. Remote Sens. 2019, 11, 2330. [Google Scholar] [CrossRef] [Green Version]
  54. Twele, A.; Cao, W.; Plank, S.; Martinis, S. Sentinel-1-based flood mapping: A fully automated processing chain. Int. J. Remote Sens. 2016, 37, 2990–3004. [Google Scholar] [CrossRef]
  55. Martinis, S.; Kersten, J.; Twele, A. A fully automated TerraSAR-X based flood service. ISPRS J. Photogramm. Remote Sens. 2015, 104, 203–212. [Google Scholar] [CrossRef]
  56. Martinis, S.; Kuenzer, C.; Wendleder, A.; Huth, J.; Twele, A.; Roth, A.; Dech, S. Comparing four operational SAR-based water and flood detection approaches. Int. J. Remote Sens. 2015, 36, 3519–3543. [Google Scholar] [CrossRef]
  57. Pekel, J.-F.; Cottam, A.; Gorelick, N.; Belward, A.S. High-resolution mapping of global surface water and its long-term changes. Nature 2016, 540, 418–422. [Google Scholar] [CrossRef] [PubMed]
  58. McJannet, D.; Cook, F.; Burn, S. Evaporataion Reduction by Manipulation of Surface Area to Volume Ratios: Overview, Analysis and Effectiveness; Urban Water Security Research Alliance Technical Report No. 8; CSIRO: Canberra, Australia, 2008. [Google Scholar]
  59. Mitchell, A. The ESRI Guide to GIS Analysis; ESRI: Redlands, CA, USA, 1999; ISBN 978-1-879102-06-4. [Google Scholar]
  60. Kapuka, A.; Hlásny, T. Social Vulnerability to Natural Hazards in Namibia: A District-Based Analysis. Sustainability 2020, 12, 4910. [Google Scholar] [CrossRef]
  61. Woltersdorf, L.; Liehr, S.; Döll, P. Rainwater Harvesting for Small-Holder Horticulture in Namibia: Design of Garden Variants and Assessment of Climate Change Impacts and Adaptation. Water 2015, 7, 1402–1421. [Google Scholar] [CrossRef] [Green Version]
  62. Sturm, M.; Zimmermann, M.; Schütz, K.; Urban, W.; Hartung, H. Rainwater harvesting as an alternative water resource in rural sites in central northern Namibia. Phys. Chem. Earth Parts ABC 2009, 34, 776–785. [Google Scholar] [CrossRef]
Figure 1. Typical hydrological landforms in the Iishana-System: (a) man-made deepened pan in an Oshana, (b) large pan in an Oshana, (c) borrow pit filled with groundwater, (d) artificial Stengel dam for water harvesting, and (e) typical Oshana with water filled pan, Sources: All photos by R. A. 2017.
Water 13 00177 g001
Figure 2. Overview of the Cuvelai Basin and the study area of the Iishana-System, database: [36,37].
Water 13 00177 g002
Figure 3. The TanDEM-X DEM preprocessing chain connected with the Modified Blue Spot Analysis. (a): A DEM preprocessing is necessary before any further analysis; (b): The affiliated modified Blue Spot analysis after the preprocessing.
Water 13 00177 g003
Figure 4. Schematic representation of a Blue Spot.
Water 13 00177 g004
Figure 5. Validation process of pan detection. Example also represents focus area 4, annotated in Figure 7. Subfigure (a) shows the situation and water extend on site in 2017. The red shape in subfigure (b) determines the surface water area of (a) and corresponds to the water surface area detected via the satellite data in 2017 (b). Subfigure (c) shows the result of the calculated depths and extent of the pans. Additionally, the gray areas show the maximum flood water extent detected in the past. In subfigure (d) the appearance of the depression in a dried out state is illustrated. This condition was documented by photo in 2018 after a drought event. Subfigure (e) shows the same dry pan by a satellite image including the former red shape of the water extend of 2017. Here, the dark area does not represent water, but dry sediments.
Water 13 00177 g005
Figure 6. Pans and their depths in meters for the entire transboundary Iishana-System. Detailed information for focus areas 1–3 can be found in Figure 7. Focus area 4 represents the example for validation and is shown in Figure 5.
Water 13 00177 g006
Figure 7. Pans in focus areas 1–3 in Angola and Namibia as shown in Figure 6. (FA 1): Large and deep pans in the southwestern part of the Angolan Iishana-System; (FA 2): Fewer but still large pans around the town of Oshakati in the southeastern part of the Namibian part of the Iishana-System, pans highlighted in yellow represent borrow pits; (FA 3): Thousands of small and isolated pans in the southern part of the Iishana-System in Namibia.
Water 13 00177 g007
Figure 8. Surface area of pans in total, for Angola, and for Namibia, indicating the enormous number of outliers.
Water 13 00177 g008
Figure 9. Surface area–volume ratio (after [58]).
Water 13 00177 g009
Figure 10. Surface area–volume ratio (SA/V) of all pans. Blue dots indicate the most suitable pans for enlargement.
Water 13 00177 g010
Table 1. Pan statistics listed by region: total Iishana-System, Namibian territory, and Angolan territory.
Surface Area (m2)Volume (m3)SA/V (m−1)Depth (m)
Iishana-SystemSum4,021,400,4691,877,297,618
Min15610.140.10
Max16,846,56320,776,981538.9527.12
Median25006124.160.24
Mean21,09698485.200.29
25%/Quartil10942542.750.16
75%/Quartil765620736.430.36
sd172,681135,5744.840.14
Skew386329.4962.65
pans count: 190,623pans/km2 = 10.4
AngolaSum2,355,694,2191,259,943,689
Min15650.600.10
Max462,969120,579102.4019.26
Median18755683.480.28
Mean620718794.840.33
25%/Quartil7811882.020.17
75%/Quartil609421535.470.43
sd154,864129,93446.840.15
Skew2744143.5347.92
pans count: 84,755pans/km2 = 9.7
NamibiaSum1,989,113,125706,824,881
Min156<10.140.10
Max13,075,3136,055,795538.9527.12
Median26565674.550.22
Mean18,74966635.600.25
25%/Quartil12502363.120.15
75%/Quartil843820486.840.32
sd126,19558,9095.130.13
Skew404332.5843.47
pans count: 106,089pans/km2 = 11.0
Publisher’s Note: MDPI stays neutral with regard to jurisdictional claims in published maps and institutional affiliations.