
Temporal Changes in Flow Regime along the River Vistula


Abstract
:1. Introduction
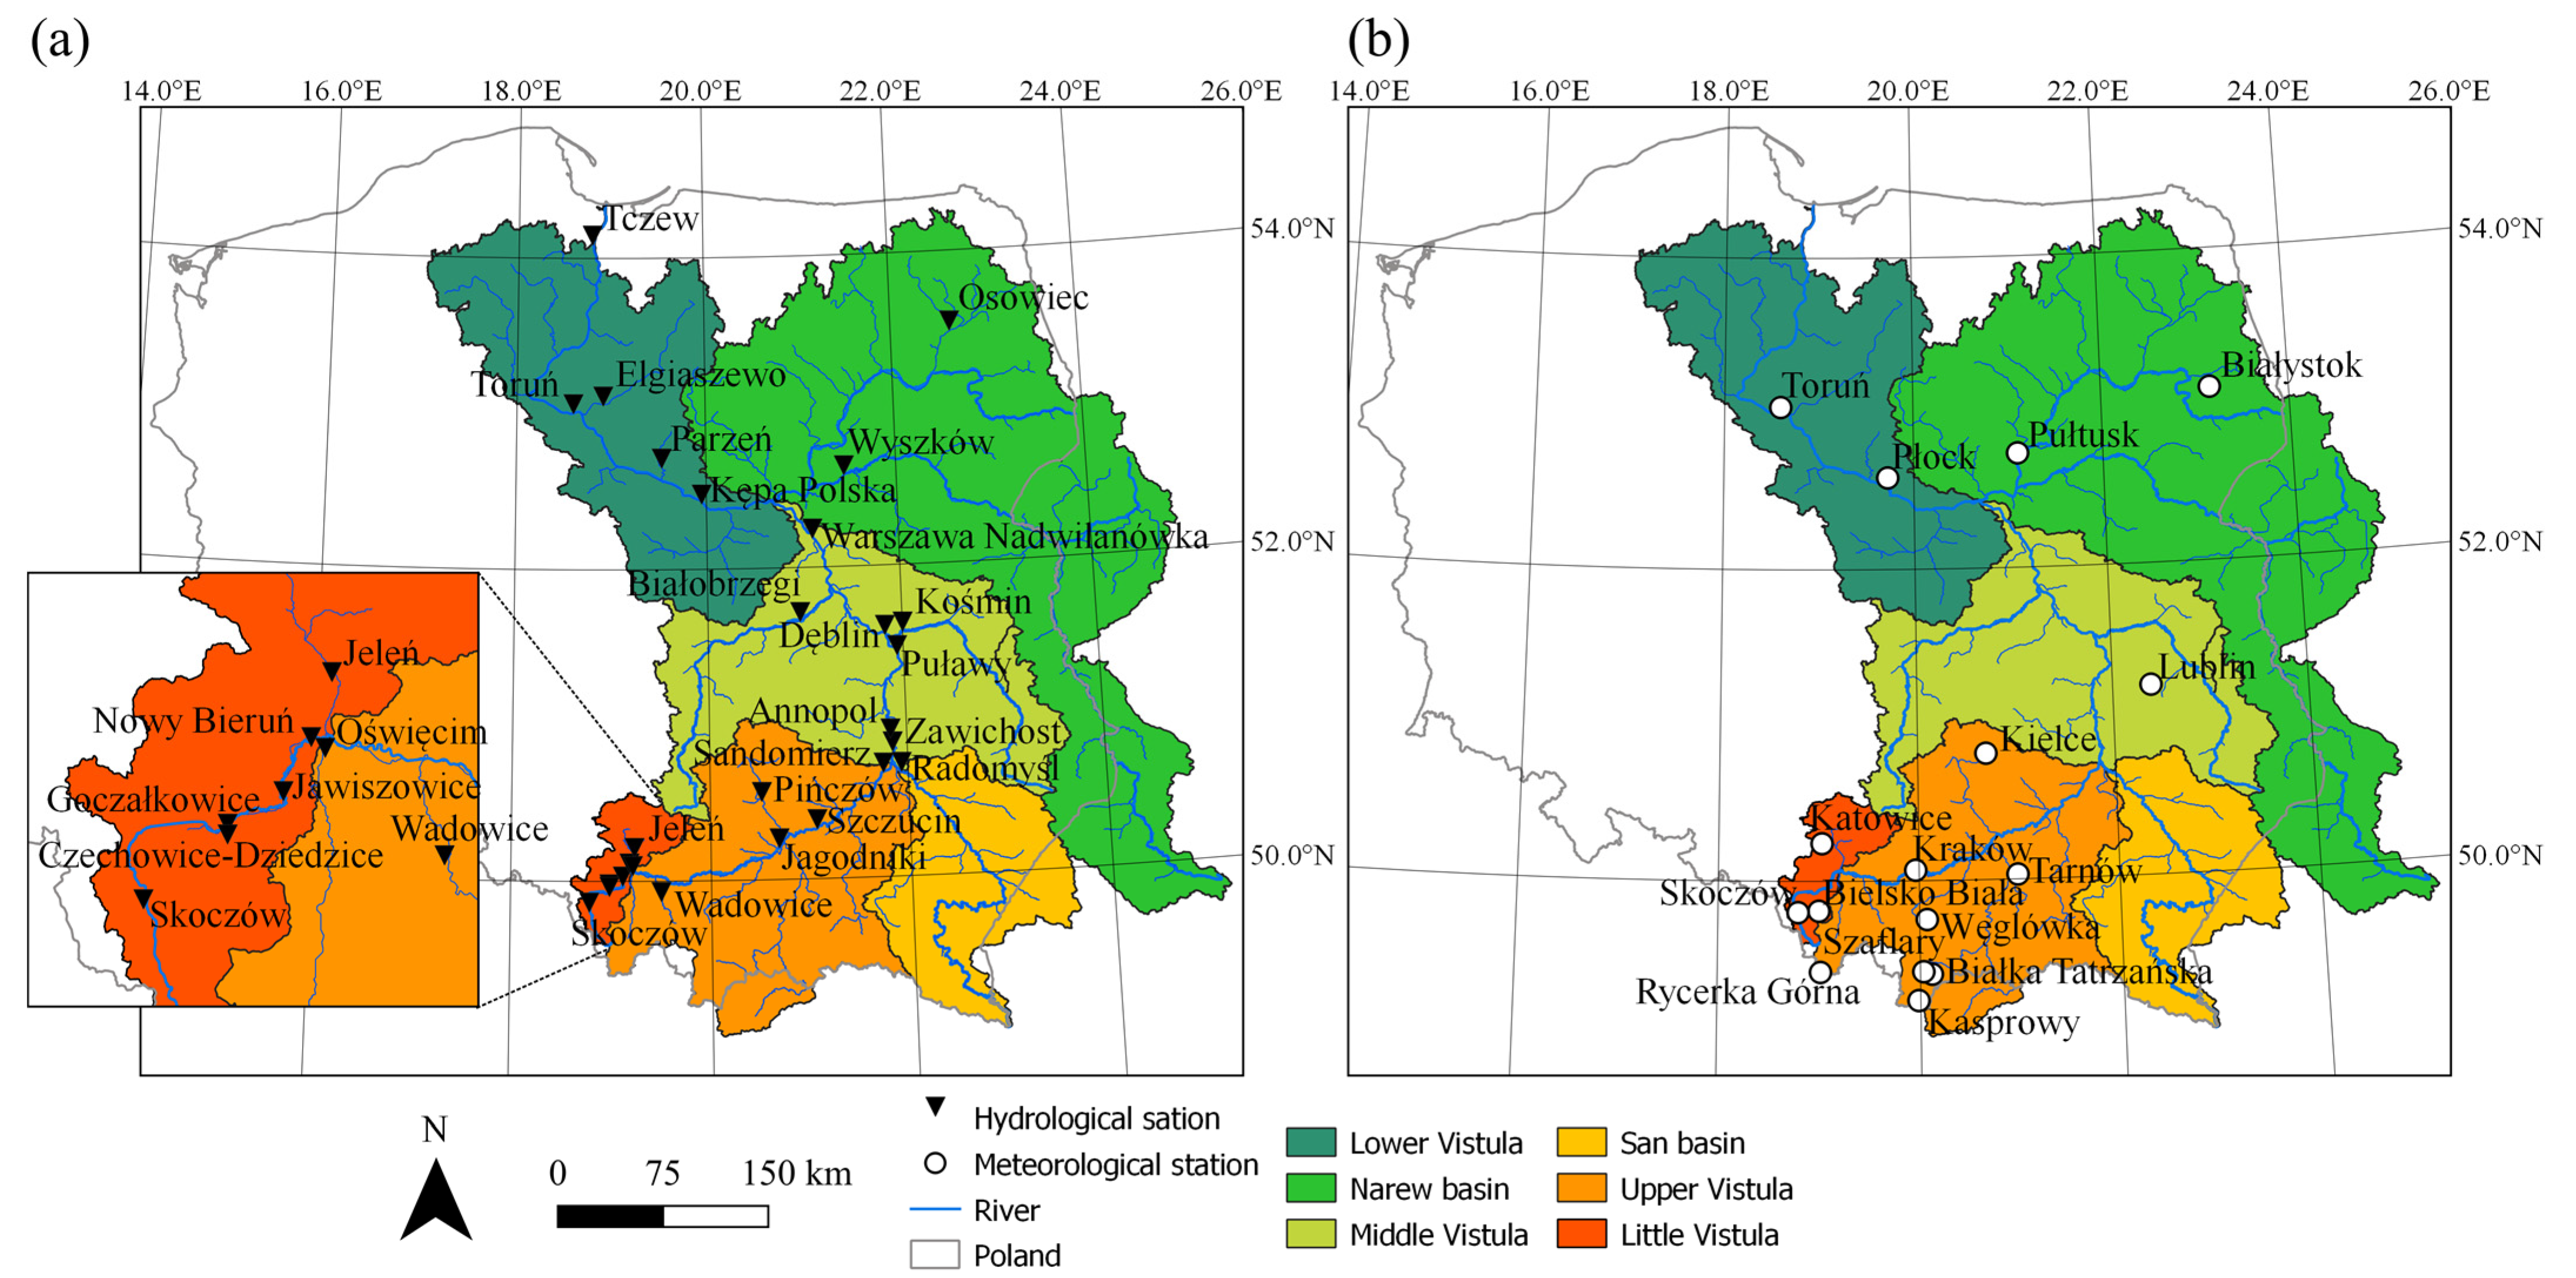
2. Study Area and Runoff and Precipitation Data
3. Methodology
3.1. Characteristics of Daily Flow and Precipitation Processes
3.2. Methods of Analyses
4. Results
5. Discussion
5.1. Runoff Characteristics
5.2. Possible Reasons of Changes
5.3. Precipitation Characteristics
5.4. Comparison with Other Research Results
5.5. General Remarks
6. Conclusions
- The hydrological regime of the River Vistula controlled and assessed at 15 gauging stations along its course forms a complex hybrid natural–human system, with insufficiently documented data and history of change. The observed runoff synthesizes this mosaic of processes and pressures. Hence, the accumulated tendencies can be read from different characteristics of runoff data. In contrast to a wide range of standardized indices such as SPI, SRI, and others that have become a common approach to analysis of riverine regimes in recent years, introducing some distortion of observation data, especially in the tails, the direct analyses of different runoff characteristics conserve their physical meaning and interpretation.
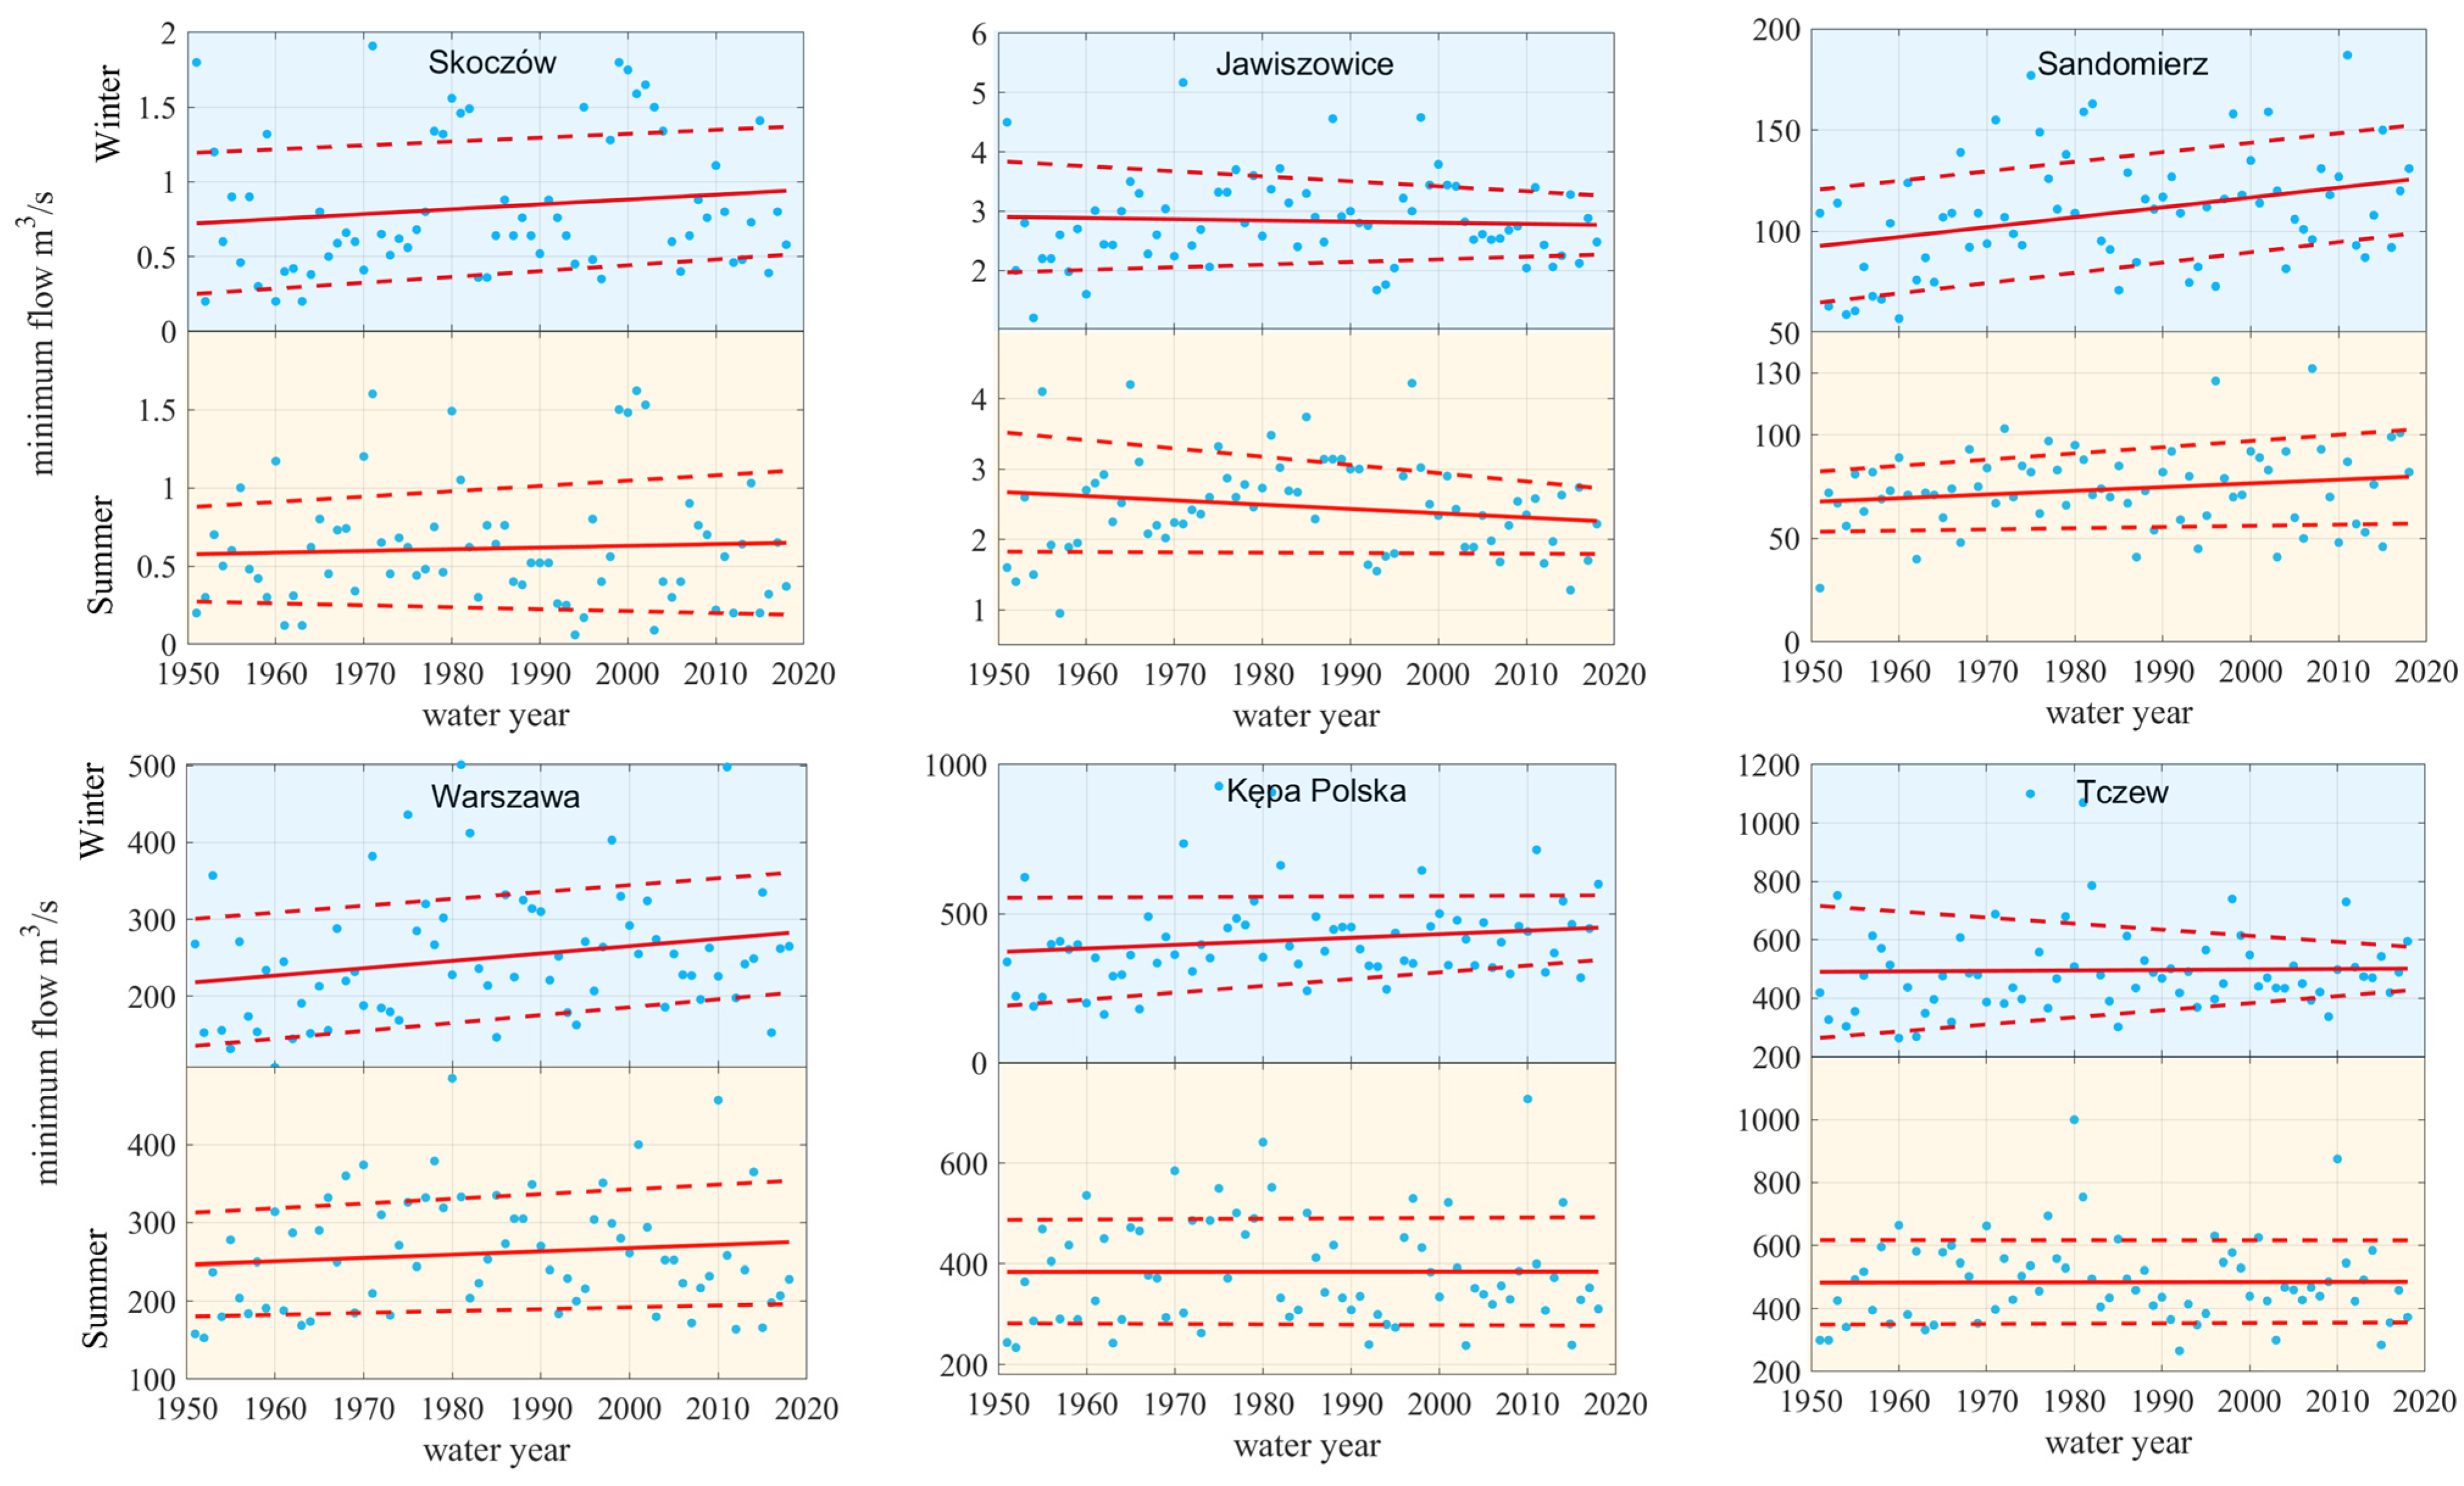
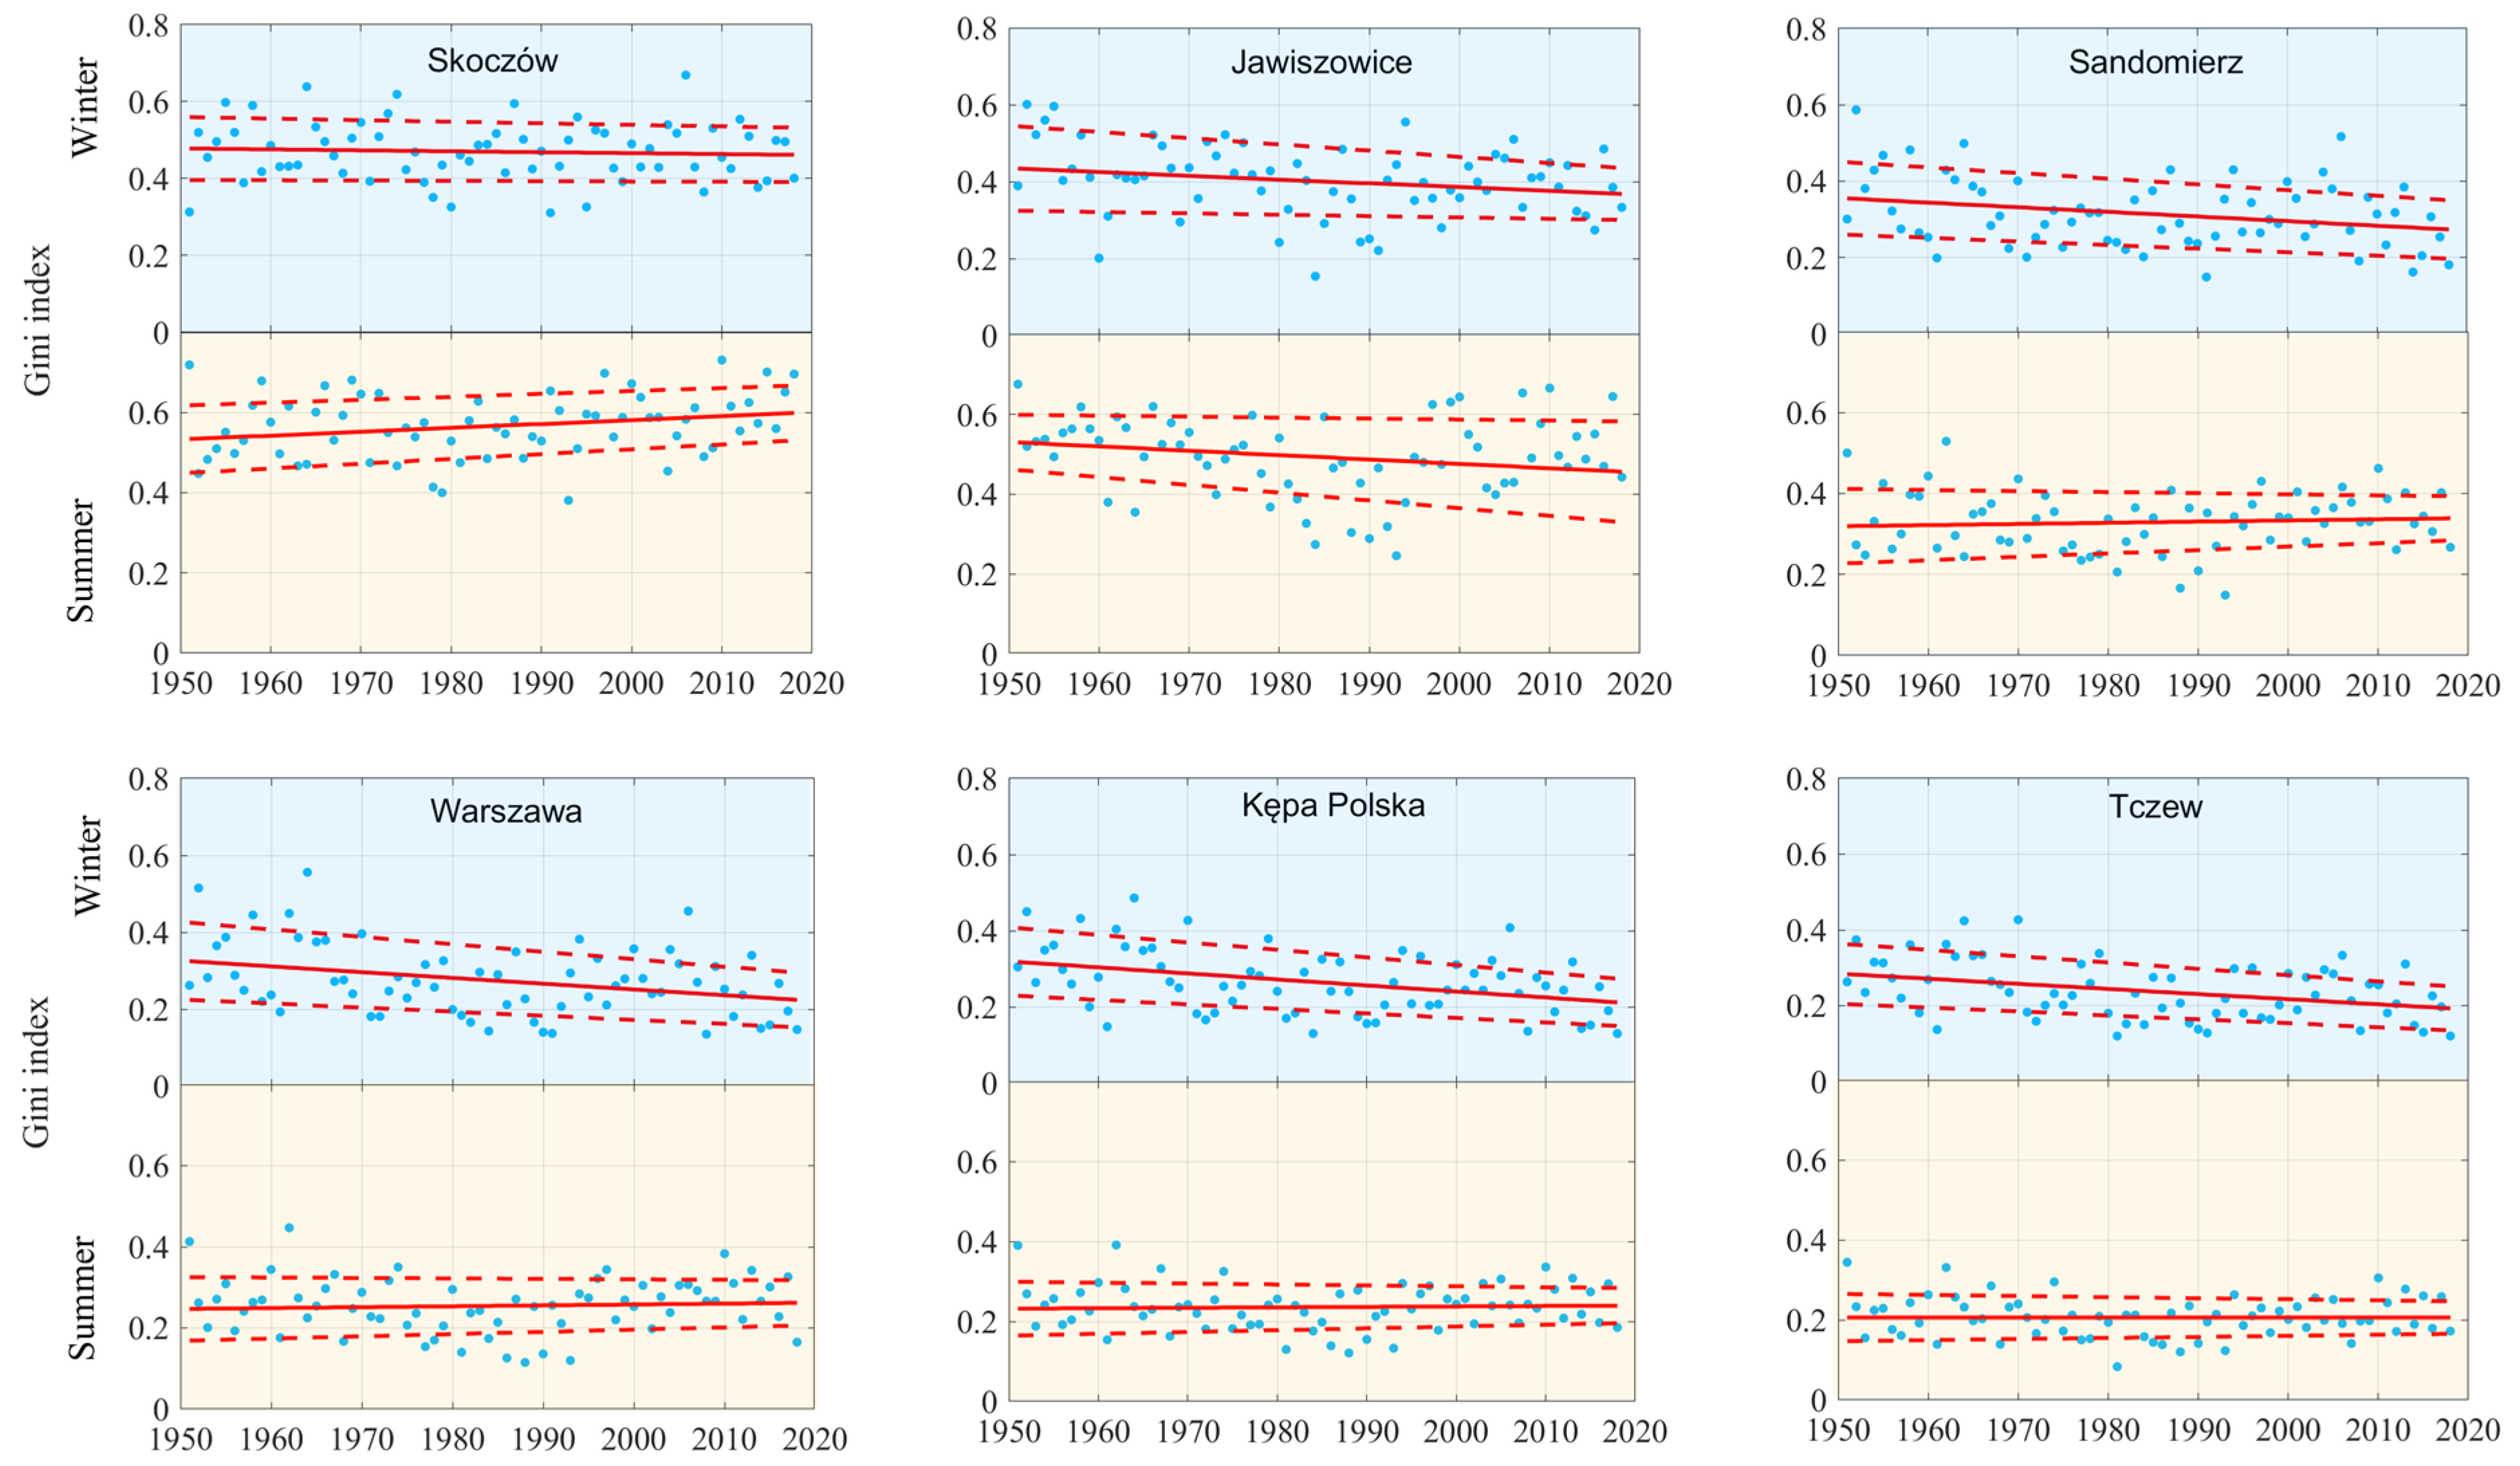
- The main tendencies found in this research is the increase of daily instantaneous minimum flow and growing uniformity of daily discharge in the winter season, significant in big part of observation series. Surprising scores for summer minima show that there is no important changes in low flows on the Vistula which denies the common opinions of an intensification of hydrological droughts in the vegetation season.
- Significant trends in snowfall and snow cover characteristics (the number of days with snow cover) were found, which is obviously the result of global warming.
- No significant trends in seasonal and annual precipitation totals and flow volumes were found. Changes in the seasonal precipitation structure revealed upward trends in the number of days with precipitation less than 1 mm in big parts of stations.
- The longest dry spell shows a weak decreasing tendency and the precipitation monthly totals in September and in October a weak increasing one. These tendencies can give the illusion of summer–autumn drought threat reduction if they continue. However, with increasing temperatures, which will result in an increase in field evaporation, the risk may increase significantly if the total rainfall remains unchanged.
Author Contributions
Funding
Institutional Review Board Statement
Informed Consent Statement
Data Availability Statement
Acknowledgments
Conflicts of Interest
References
- Dynowska, I.; Maciejewski, M. (Eds.) Dorzecze Górnej Wisły; Cz. I i II; PWN, Warszawa: Kraków, Poland, 1991. [Google Scholar]
- Tuszko, A. Wisła; Wyd. II rozszerz; Książka i Wiedza: Warszawa, Poland, 1984. [Google Scholar]
- Piskozuba, A. Wisła: Monografia Rzeki; Pr. zbior. pod red; WKiŁ: Warszawa, Poland, 1982; p. 447. [Google Scholar]
- Fal, B.; Dąbrowski, P. Dwieście lat obserwacji i pomiarów hydrologicznych Wisły w Warszawie. Część I. Gospod. Wodna 2001, 11, 461–467. [Google Scholar]
- Fal, B.; Dąbrowski, P. Dwieście lat obserwacji i pomiarów hydrologicznych Wisły w Warszawie. Część II. Gospod. Wodna 2001, 12, 503–510. [Google Scholar]
- Fal, B. Niżówki na górnej i środkowej Wiśle. Gospod. Wodna 2007, 2, 72–81. [Google Scholar]
- Svensson, C.; Kundzewicz, Z.W.; Maurer, T. Trend detection in river flow series: 2. Flood and low-flow index series/Détection de tendance dans des séries de débit fluvial: 2. Séries d’indices de crue et d’étiage. Hydrol. Sci. J. 2005, 50, 811–824. [Google Scholar] [CrossRef] [Green Version]
- Hanel, M.; Rakovec, O.; Markonis, Y.; Máca, P.; Samaniego, L.; Kyselý, J.; Kumar, R. Revisiting the recent European droughts from a long-term perspective. Sci. Rep. 2018, 8, 1–11. [Google Scholar] [CrossRef]
- Van Lanen, H.A.J.; Laaha, G.; Kingston, D.G.; Gauster, T.; Ionita, M.; Vidal, J.P.; Vlnas, R.; Tallaksen, L.M.; Stahl, K.; Hannaford, J.; et al. Hydrology needed to manage droughts: The 2015 European case. Hydrol. Process. 2016, 30, 3097–3104. [Google Scholar] [CrossRef] [Green Version]
- Laaha, G.; Gauster, T.; Tallaksen, L.M.; Vidal, J.P.; Stahl, K.; Prudhomme, C.; Heudorfer, B.; Vlnas, R.; Ionita, M.; Van Lanen, H.A.J.; et al. The European 2015 drought from a hydrological perspective. Hydrol. Earth Syst. Sci. 2017, 21, 3001–3024. [Google Scholar] [CrossRef] [Green Version]
- Somorowska, U. Changes in drought conditions in Poland over the past 60 years evaluated by the standardized precipitation-evapotranspiration index. Acta Geophys. 2016, 64, 2530–2549. [Google Scholar] [CrossRef] [Green Version]
- Hansel, S.; Ustrnul, Z.; Lupikasza, E.; Skalak, P. Assessing seasonal drought variations and trends over Central Europe. Adv. Water Resour. 2019, 127, 53–75. [Google Scholar] [CrossRef]
- Osuch, M.; Romanowicz, R.J.; Lawrence, D.; Wong, W.K. Trends in projections of Standardized Precipitation Indices in a future climate in Poland. Hydrol. Earth Syst. Sci. 2016, 20, 1947–1969. [Google Scholar] [CrossRef] [Green Version]
- Tokarczyk, T. Wskaźniki oceny suszy stosowane w Polsce i na świecie. Infrastrukt. I Ekol. Teren. Wiej. PAN Oddział w Krakowie 2008, 7, 167–182. [Google Scholar]
- Karamuz, E.; Bogdanowicz, E.; Senbeta, T.B.; Napiórkowski, J.J.; Romanowicz, R.J. Is it a drought or only a fluctuation in precipitation patterns?—Drought reconnaissance in Poland. Water 2021, 13, 807. [Google Scholar] [CrossRef]
- Karamuz, E.; Romanowicz, R.J. Temperature changes and their impact on drought conditions in winter and spring in the Vistula Basin. Water 2021, 13, 1973. [Google Scholar] [CrossRef]
- Maciejewski, M.; Majewski, W. Aktualny stan i zagospodarowanie Wisły oraz jej dorzecza. Wiadomości Meteorol. Hydrol. Gospod. Wodnej 2011, 5, 3–21. [Google Scholar]
- Dynowska, I. Typy Reżimów Rzecznych w Polsce; Zeszyty Naukowe Uniwersytetu Jagiellońskiego, Prace Geograficzne; Uniwersytet Jagielloński: Kraków, Poland, 1971; p. 37. [Google Scholar]
- Stachý, J. Występowanie lat mokrych i posusznych w Polsce (1951–2008). Gospod. Wodna 2011, 8, 313–321. [Google Scholar]
- Jokiel, P. Sezonowa struktura odpływu rzecznego w środkowej Polsce i jej zmiany w wieloleciu w świetle krzywych sumowych i terminów połowy odpływu. Przegląd Geogr. 2016, 88, 53–74. [Google Scholar] [CrossRef]
- Tomalski, P.; Tomaszewski, E.; Wrzesiński, D.; Sobkowiak, L. Relationships of hydrological seasons in rivers and groundwaters in selected catchments in selected catchments in Poland. Water 2021, 13, 250. [Google Scholar] [CrossRef]
- Gini, C. Measurement of inequality of incomes. Econ. J. 1921, 31, 124–126. [Google Scholar] [CrossRef]
- Cortesi, N.; Gonzalez-Hidalgo, J.C.; Brunetti, M.; Martin-Vide, J. Daily precipitation concentration across Europe 1971–2010. Nat. Hazards Earth Syst. Sci. 2012, 12, 2799–2810. [Google Scholar] [CrossRef] [Green Version]
- Gastwirth, J. The estimation of the Lorenz curve and Gini index. Rev. Econ. 1972, 54, 3,306–316. [Google Scholar] [CrossRef]
- Available online: https://worldpopulationreview.com/country-rankings/wealth-inequality-by-country (accessed on 15 September 2021).
- Sneyers, R. On the Statistical Analysis of Series of Observation; WMO-No 415; WMO: Geneva, Switzerland, 1975. [Google Scholar]
- Seniraldi, F.; Kilsby, C.G. The importance of prewhitening in change point analysis under persistent. Stoch. Environ. Res. Risk Assess. 2015, 30, 763–777. [Google Scholar]
- Bayazit, M.; Önöz, B. To prewhiten or not to prewhiten in trend analysis. Hydrol. Sci. J. 2007, 52, 611–624. [Google Scholar]
- Yue, S.; Wang, C. The Mann-Kendall test modified by effective sample size to detect trend in serially correlated hydrological series. Water Resour. Manag. 2004, 18, 201–218. [Google Scholar] [CrossRef]
- Hamed, K.H.; Rao, A.R. A modified Mann-Kendall trend test for autocorrelated data. J. Hydrol. 1998, 204, 182–196. [Google Scholar] [CrossRef]
- Khaliq, M.N.; Ouarda, T.B.M.J.; Gachon, P.; Sushama, L.; St-Hilaire, A. Identification of hydrological trends in the presence of serial correlation and cross correlation: A review of selected methods and their application to annual flow regimes of Canadian rivers. J. Hydrol. 2009, 368, 117–130. [Google Scholar] [CrossRef]
- Strupczewski, W.G.; Kaczmarek, Z. Non-stationary approach to at-site flood-frequency modelling. Part II. Weighted least squares estimation. J. Hydrol. 2001, 248, 143–151. [Google Scholar] [CrossRef]
- Strupczewski, W.G.; Kochanek, K.; Bogdanowicz, E.; Feluch, W.; Markiewicz, I. Dwuetapowa metoda estymacji kwantyli powodziowych w warunkach niestacjonarności. Two-stage method of flood quantile estimation under non-stationary conditions. Monogr. Kom. Gospod. Wodnej PAN 2013, 35, 109–124. [Google Scholar]
- Strupczewski, W.G.; Kochanek, K.; Bogdanowicz, E.; Markiewicz, I.; Feluch, W. Comparison of two nonstationary flood frequency analysis methods within the context of the variable regime in the representative Polish rivers. Acta Geophys. 2016, 64, 206–236. [Google Scholar] [CrossRef] [Green Version]
- Wilson, D.; Hisdal, H.; Lawrence, D. Has streamflow changed in the Nordic countries? Recent trends and comparisons to hydrological projection. J. Hydrol. 2010, 394, 334–346. [Google Scholar] [CrossRef]
- Ghaderpour, E.; Vujadinovic, T.; Hassan, Q.K. Application of the least-squares wavelet software in hydrology: Athabasca River basin. J. Hydrol. Reg. Stud. 2021, 36, 1000847. [Google Scholar]
- Matysik, M. Wpływ Zrzutów Wód Kopalnianych na Odpływ rzek Górnośląskiego Zagłębia Węglowego. (The Impact of Mine Water Discharge on the Runoff of the Rivers of the upper Silesian Coal Basin); Wydawnictwo Uniwersytetu Ślaskiego: Katowice, Poland, 2018. [Google Scholar]
- Żelaziński, J. Identyfikacja I Opis Zmian Morfologii Koryta Wisły Wywołanych Obwałowaniem I Regulacją Wraz z Ocean ich Wpływu na Ryzyko Powodziowe. Raport z Projektu pt. Rewitalizacja i Ochrona Bioróżnorodności i Wykorzystanie Walorów Starorzeczy Wisły, Zatrzymanie Degradacji Doliny Górnej Wisły Jako Korytarza Ekologicznego; Fundacja Dzika Polska: Warsaw, Poland, 2014. [Google Scholar]
- Wierzbicki, G.; Ostrowski, P.; Bartold, P.; Bujakowski, F.; Falkowski, T.; Osiński, P. Urban geomorphology of the Vistula River valley in Warsaw. J. Maps 2021. [Google Scholar] [CrossRef]
- Kaznowska, E.; Wasilewicz, M. Historyczne niżówki na Wiśle w Warszawie na tle aktualnych stanów i przepływów niskich. Acta Sci. Pol. Form. Circumiectus 2020, 19, 53–81. [Google Scholar]
- Kowalski, H.; Magnuszewski, A.; Radecki-Pawlik, A. The application of two-dimensional hydrodynamic models for underwater archaeological finds from the Vistula River in Warsaw, Poland. Hydrol. Process. 2018, 32, 2888–2900. [Google Scholar] [CrossRef]
- Pinter, N.; Jemberie, A.A.; Remo, J.W.; Heine, R.A.; Ickes, B.S. Flood trends and river engineering on the Mississippi River system. Geophys. Res. Lett. 2008, 35. [Google Scholar] [CrossRef]
- Kundzewicz, Z.W.; Robson, A. Change detection in hydrological records—A review of the methodology. Hydrol. Sci. J. Des Sci. Hydrol. 2004, 49, 7–19. [Google Scholar] [CrossRef]
- Bogdanowicz, E.; Chudy, Ł.; Jaworski, W.; Marcinkowski, M. Koncepcja Nowego Atlasu Hydrologicznego Polski; Materiały Badawcze, Seria: Hydrologia i oceanologia; IMGW: Warsaw, Poland, 2008; Volume 34. [Google Scholar]
- Szwed, M. Variability of precipitation in Poland under climate change. Theor. Appl. Climatol. 2019, 135, 1003–1015. [Google Scholar] [CrossRef] [Green Version]
- Wybig, J. The variability of daily precipitation totals in Poland. (1951–2000). Geogr. Pol. 2009, 82, 21–32. [Google Scholar] [CrossRef] [Green Version]
- Kożuchowski, K. (Ed.) Zmienność opadów atmosferycznych w Polsce w XX i XXI wieku. (The variability of precipitation totals in Poland in twentieth and twentieth first century). In Skala, Uwarunkowania i Perspektywy Współczesnych zmian Klimatycznych w Polsce; Wydawnictwo Biblioteka: Łódź, Poland, 2004; pp. 47–58. [Google Scholar]
- Czarnecka, M.; Nidzgorska-Lencewicz, J. Wieloletnia zmienność sezonowych opadów w Polsce (multiannual variability of seasonal precipitation in Poland). Woda Sr. Obsz. Wiej. 2012, 122, 45–60. [Google Scholar]
- Spinoni, J.; Naumann, G.; Vogt, J.; Barbosa, P. Meteorological Droughts in Europe: Events and Impacts—Past Trends and Future Projections; EUR 27748 EN; Publications Office of the European Union: Luxembourg, 2016. [Google Scholar] [CrossRef]


| No. | Station | Type 1 | Elevation (m a. s. l.) | Observation Period | Mean Precipitation Total (mm) | Mean Share of Winter in the Annual Total (%) | Mean Share of Snowfall in the Annual Total (%) | ||
|---|---|---|---|---|---|---|---|---|---|
| Winter (Nov–Apr) | Summer (May–Oct) | Year (Nov–Oct) | |||||||
| 1 | Skoczów | SHM | 296 * | 1952–2018 | 330.8 | 600.5 | 931.3 | 35.5 | N/A |
| 2 | Bielsko-Biała | SHM | 398.89 | 1952–2018 | 325.7 | 663.5 | 989.2 | 32.9 | 20.8 |
| 3 | Katowice | P | 279.92 | 1952–2018 | 261.9 | 454.2 | 716.1 | 36.6 | 20.7 |
| 4 | Rycerka Górna | P | 668 * | 1952–2018 | 503.2 | 723.5 | 1226.7 | 41.0 | 31.0 |
| 5 | Węglówka | K | 490 * | 1952–2018 | 361.0 | 649.3 | 1010.3 | 35.7 | 24.9 |
| 6 | Kraków | WOM | 302 * | 1952–2018 | 231.6 | 454.3 | 685.9 | 33.8 | 17.6 |
| 7 | Kasprowy | WOM | 1988.75 | 1952–2018 | 718.3 | 1046.9 | 1764.9 | 40.7 | 61.9 |
| 8 | Szaflary | P | 652 * | 1952–2018 | 287.8 | 583.5 | 871.3 | 33.0 | 26.8 |
| 9 | Białka Tatrzańska | P | 733 * | 1952–2018 | 284.9 | 560.8 | 845.7 | 33.7 | 26.4 |
| 10 | Tarnów | K | 205 * | 1952–2014 | 234.3 | 474.5 | 708.8 | 33.1 | 18.7 |
| 11 | Kielce | SHM | 661.11 | 1952–2018 | 238.3 | 392.7 | 631.0 | 37.8 | 21.8 |
| 12 | Lublin | SHM | 339.7 | 1952–2018 | 216.0 | 373.6 | 589.6 | 36.6 | 21.9 |
| 13 | Białystok | SHM | 152.05 | 1952–2018 | 215.4 | 380.0 | 595.4 | 36.2 | 21.9 |
| 14 | Pułtusk | K | 88 * | 1952–2018 | 205.8 | 354.5 | 560.3 | 36.7 | 17.0 |
| 15 | Płock | SHM | 99 * | 1952–2014 | 195.4 | 336.6 | 532.0 | 36.7 | 17.4 |
| 16 | Toruń | SHM | 70.22 | 1952–2018 | 184.7 | 350.2 | 534.9 | 34.5 | 16.1 |
| No. | Station | Classes of Daily Precipitation (mm) | |||||||
|---|---|---|---|---|---|---|---|---|---|
| 0.0 | 0.1 | (0.1;0.5> | (0.5;1.0> | (1.0;5.0> | (5.0;10.0> | (10.0;20.0> | >20.0 | ||
| 1 | Skoczów | N/A | 8.3 | 29.8 | 18.6 | 70.2 | 29.9 | 17.0 | 8.8 |
| 2 | Bielsko-Biała | 35.8 | 10.6 | 26.3 | 20.2 | 67.6 | 28.2 | 18.9 | 9.7 |
| 3 | Katowice | 43.1 | 14.4 | 29.8 | 22.0 | 67.2 | 24.8 | 13.8 | 4.9 |
| 4 | Rycerka Górna | 5.3 | 4.5 | 21.9 | 16.9 | 69.6 | 36.6 | 28.1 | 12.0 |
| 5 | Węglówka | 2.5 | 7.0 | 23.3 | 15.4 | 67.1 | 31.8 | 19.7 | 9.6 |
| 6 | Kraków | 42.5 | 13.4 | 31.8 | 20.7 | 65.1 | 23.0 | 13.1 | 4.8 |
| 7 | Kasprowy | 20.7 | 7.7 | 23.6 | 19.4 | 77.5 | 42.5 | 34.6 | 21.5 |
| 8 | Szaflary | 7.3 | 1.5 | 19.7 | 18.1 | 71.1 | 28.7 | 16.7 | 6.7 |
| 9 | Białka Tatrzańska | 14.6 | 10.4 | 22.6 | 15.9 | 73.0 | 29.0 | 17.3 | 6.3 |
| 10 | Tarnów | 35.3 | 13.3 | 29.7 | 21.9 | 64.1 | 23.4 | 12.9 | 5.7 |
| 11 | Kielce | 52.6 | 16.7 | 31.4 | 20.4 | 67.1 | 24.1 | 11.2 | 3.6 |
| 12 | Lublin | 49.7 | 16.6 | 32.5 | 21.2 | 64.7 | 21.9 | 9.7 | 3.6 |
| 13 | Białystok | 52.6 | 14.7 | 29.4 | 20.4 | 65.6 | 23.6 | 10.0 | 3,1 |
| 14 | Pułtusk | 15.1 | 6.9 | 23.7 | 19.3 | 59.1 | 20.5 | 9.9 | 3.3 |
| 15 | Płock | 52.0 | 15.2 | 30.5 | 20.7 | 63.6 | 20.2 | 9.2 | 2.6 |
| 16 | Toruń | 51.1 | 15.9 | 29.7 | 20.8 | 63.4 | 19.8 | 8.3 | 3.1 |
| No. | Hydrological Station on the Vistula | RIVER REACH/River | Hydrological Station on the Tributary | Total Area of the Tributary Basin | Tributary Side | Km | Area (km2) | Human Pressure on Natural Regime | Precipitation Stations | ||
|---|---|---|---|---|---|---|---|---|---|---|---|
| 1 | Skoczów | LITTLE VISTULA | 71.1 | 296.7 | Quasi-natural | Skoczów | |||||
| Iłownica | Czechowice-Dziedzice | 201.1 | Right | 1.5 | 193.9 | Altered | |||||
| 2 | Goczałkowice | LITTLE VISTULA | 37.8 | 738.1 | Totally altered | ||||||
| Biała | 139.1 | Right | Totally altered | Bielsko-Biała | |||||||
| 3 | Jawiszowice | 23.7 | 970.6 | Altered | |||||||
| 4 | Nowy Bieruń | LITTLE VISTULA | 3.6 | 1747.7 | Altered | ||||||
| Przemsza | Jeleń | 2121.5 | Left | 12.8 | 1995.9 | Totally altered | Katowice | ||||
| Soła | Oświęcim | 1390.6 | Right | 3.0 | 1386.0 | Totally altered | Rycerka Górna | ||||
| Skawa | Wadowice | 1160.1 | Right | 21.1 | 835.4 | Quasi-natural | |||||
| Raba | 1537.1 | Right | Altered | Węglówka | |||||||
| 5 | Jagodniki | UPPER VISTULA | 153.1 | 12,058.2 | Altered | Kraków | |||||
| Dunajec | 6804.0 | Right | Altered | Kasprowy Wierch. Szaflary. Białka. Tarnów | |||||||
| Nida | Pińczów | 3862.0 | Left | 56.8 | 3352.5 | Natural | Kielce | ||||
| 6 | Szczucin | UPPER VISTULA | 194.1 | 23,900.6 | Altered | ||||||
| Wisłoka | 4110.2 | Right | Quasi-natural | ||||||||
| 7 | Sandomierz | UPPER VISTULA | 268.4 | 31,846.5 | Altered | ||||||
| San | Radomyśl | 16,861.3 | Right | 10.3 | 16,823.8 | Altered | |||||
| 8 | Zawichost | MIDDLE VISTULA | 287.6 | 50,731.8 | Altered | ||||||
| 9 | Annopol | MIDDLE VISTULA | 298.4 | 51,518.1 | Natural | ||||||
| 10 | Puławy 1 | MIDDLE VISTULA | 372.5 | 57,263.6 | Natural | ||||||
| Wieprz | Kośmin | 10,415.2 | Right | 17.9 | 10,230.6 | Quasi-natural | Lublin | ||||
| 11 | Dęblin | MIDDLE VISTULA | 393.7 | 68,234.3 | Natural | ||||||
| Pilica | Białobrzegi | 9273.0 | Left | 45.3 | 8664.2 | Quasi-natural | |||||
| 12 | Warszawa Nadwilanówka 2 | MIDDLE VISTULA | 503.5 | 84,539.5 | Natural | ||||||
| Narew | 75,175.2 | Right | Totaly altered | Białystok Pułtusk | |||||||
| Osowiec/ Biebrza | 7057.4 | Right | 50.3 | 4365.1 | Natural | ||||||
| Wyszków/ Bug | 39,420.3 | Left | 33.8 | 39,119.4 | Natural | ||||||
| Bzura | 7787.5 | Left | Quasi-natural | ||||||||
| 13 | Kępa Polska 3 | LOWER VISTULA | 606.5 | 168,956.1 | Natural | Płock | |||||
| Skrwa (right) | Parzeń | 1704.0 | Right | 20.8 | 1534.2 | Quasi-natural | |||||
| 14 | Toruń | LOWER VISTULA | 734.7 | 181,033.4 | Altered | Toruń | |||||
| Drwęca | Elgiszewo | 5343.5 | Right | 25.8 | 4959.4 | Natural | |||||
| 15 | Tczew | LOWER VISTULA | 908.6 | 194,376.0 | Altered | ||||||
| Aspect | Index | Description | Unit |
|---|---|---|---|
| High flows | Max | Magnitude of seasonal daily maximum flow | [m3/s] |
| Duration | Number of days with the flow over a threshold | [days] | |
| Low flows | Min | Magnitude of seasonal daily minimum flow | [m3/s] |
| Duration | Number of days with the flow below a threshold. | [days] | |
| Timing | T of max | Number of the day when the highest flow occurred | - |
| T of min | Number of the day when the lowest flow occurred | - | |
| Centr. (Centroid) | Centroid of seasonal hydrograph with respect to time | [days] | |
| Median | Number of the day when the half of seasonal runoff is achieved | [days] | |
| Runoff | Volume | Volume of the seasonal runoff | [m3] |
| Concentration of daily flows | Inertia | Moment of inertia of dimensionless seasonal hydrograph with respect to the time coordinate of the centroid | [day2] |
| Gini | Gini index calculated for seasonal daily flows | - | |
| Precipitation amount | Seasonal and annual total precipitation amount | Sum of precipitation in seasonal and annual time scales | [mm] |
| Annual totals of rainfall and snowfall | Annual rainfall and snowfall sum of precipitation | [mm] | |
| Precipitation totals in September and October | Monthly sums of precipitation in September and October | [mm] | |
| Share of snowfall in the annual total | Fraction of snowfall in annual total | [%] | |
| Number of days with precipitation | Number of days with precipitation | Seasonal and annual number of days with precipitation | [days] |
| Annual number of days with rain and with snow | Number of days with precipitation in seasonal and annual time scales | [days] | |
| Concentration of daily precipitation | Gini | Gini index calculated for seasonal daily precipitation (zero values included) | - |
| Snow cover | Maximum thickness of snow cover | Annual maximum thickness of snow cover | [cm] |
| Number of days with snow cover | Annual number of days with snow cover | [days] | |
| Dry periods | Maximum dry spell length | Maximum number of consecutive days with precipitation not greater than 0.1 mm, i.e., without precipitation, precipitation trace or precipitation equal to 0.1 mm. Due to the importance of summer–autumn low flow, the maximum is determined in the annual periods starting from April 1st to March 31st | [days] |
| Daily precipitation structure | - | Number of days with precipitation in class intervals in a seasonal time frame | - |
 |
 |
 |
 |
| No. | Station | Total Precipitation Amount | Number of Days with Precipitation | Annual Total Amount | |||||
|---|---|---|---|---|---|---|---|---|---|
| Winter | Summer | Year | Winter | Summer | Year | Rainfall | Snowfall | ||
| 1 | Skoczów | 0.27 | 0.07 | −0.16 | 0.91 | 2.03 | 2.28 | N/A | N/A |
| 2 | Bielsko-Biała | −1.10 | 0.16 | −0.87 | 0.75 | 0.01 | 0.46 | 0.35 | −2.86 |
| 3 | Katowice | 0.92 | −0.16 | 0.18 | 1.79 | 1.90 | 2.37 | −0.06 | −0.44 |
| 4 | Rycerka Górna | 0.24 | −0.55 | −0.58 | 3.53 | 3.71 | 3.70 | −0.38 | −0.54 |
| 5 | Węglówka | 1.07 | 1.08 | 1.27 | 3.98 | 3.89 | 4.41 | 0.71 | 0.47 |
| 6 | Kraków | 0.04 | 0.55 | 0.08 | 1.59 | −0.53 | 0.50 | 0.92 | −1.96 |
| 7 | Kasprowy | −1.78 | 1.62 | 0.29 | −2.13 | −1.38 | −3.07 | 1.46 | −1.06 |
| 8 | Szaflary | 0.14 | 1.64 | 0.56 | −0.40 | 1.60 | 0.29 | 1.43 | −1.59 |
| 9 | Białka Tatrzańska | −0.86 | 0.48 | 0.04 | 0.35 | 2.14 | 1.26 | 1.13 | −2.19 |
| 10 | Tarnów | 0.01 | 1.52 | 0.88 | 3.46 | 1.77 | −0.75 | 1.78 | 1.76 |
| 11 | Kielce | −1.25 | 0.81 | −0.35 | 2.14 | 2.50 | 2.42 | 0.55 | −3.32 |
| 12 | Lublin | 0.41 | 0.93 | 0.66 | 1.31 | 0.13 | 0.49 | 0.81 | −0.68 |
| 13 | Białystok | 0.07 | 1.97 | 0.82 | 1.24 | 0.80 | 1.33 | 1.91 | −2.65 |
| 14 | Pułtusk | 2.02 | 2.26 | 2.28 | −2.42 | −1.31 | −3.16 | 2.77 | −1.63 |
| 15 | Płock | 0.26 | −0.39 | −0.36 | 3.39 | 2.17 | 3.38 | 0.39 | −2.85 |
| 16 | Toruń | 1.88 | 0.90 | 1.01 | 0.85 | 0.52 | 0.29 | 1.34 | −0.56 |
| No. | Station | Annual Number of Days | Share of Snowfall in the Annual Total | Maximum Thickness of Snow Cover | Number of Days with Snow Cover | |
|---|---|---|---|---|---|---|
| with Rain | with Snow | |||||
| 1 | Skoczów | N/A | N/A | N/A | N/A | N/A |
| 2 | Bielsko-Biała | 0.77 | −0.55 | −2.26 | −1.31 | −3.09 |
| 3 | Katowice | 2.00 | 0.39 | −0.07 | −0.94 | −2.22 |
| 4 | Rycerka Górna | 5.04 | −0.08 | −0.14 | N/A | N/A |
| 5 | Węglówka | 3.98 | 1.30 | 0.31 | N/A | N/A |
| 6 | Kraków | 2.38 | −2.07 | −1.84 | −1.15 | −1.99 |
| 7 | Kasprowy | −0.94 | −1.69 | −1.65 | −1.19 | −2.17 |
| 8 | Szaflary | 2.32 | −2.73 | −1.68 | N/A | N/A |
| 9 | Białka Tatrzańska | 3.07 | −2.22 | −2.20 | N/A | N/A |
| 10 | Tarnów | −1.61 | −0.52 | 0.50 | 0.07 | −0.58 |
| 11 | Kielce | 0.94 | 1.83 | −2.77 | −1.28 | −3.40 |
| 12 | Lublin | −1.72 | 1.90 | −0.89 | −0.01 | −1.30 |
| 13 | Białystok | −0.33 | 1.63 | −3.30 | −0.99 | −2.89 |
| 14 | Pułtusk | 0.98 | −5.05 | −2.74 | −0.54 | −3.00 |
| 15 | Płock | 0.26 | 2.08 | −2.64 | 0.46 | −0.74 |
| 16 | Toruń | −0.59 | 1.63 | −1.73 | −0.39 | −2.64 |
| No. | Station | Gini Index | Maximum Dry Spell Length | Precipitation Total in September | Precipitation Total in October | |
|---|---|---|---|---|---|---|
| Winter | Summer | |||||
| 1 | Skoczów | −0.08 | 0.61 | −1.91 | 1.85 | 1.17 |
| 2 | Bielsko-Biała | 0.98 | 1.78 | −1.46 | 1.98 | 1.05 |
| 3 | Katowice | 0.96 | −1.30 | −0.07 | 1.31 | 1.05 |
| 4 | Rycerka Górna | −0.47 | 0.38 | −2.64 | 0.51 | 1.13 |
| 5 | Węglówka | −2.09 | 1.31 | −2.14 | 1.50 | 1.19 |
| 6 | Kraków | 0.54 | −0.48 | −1.07 | 1.28 | 1.14 |
| 7 | Kasprowy | 2.90 | −0.27 | −0.56 | 2.35 | 1.76 |
| 8 | Szaflary | −2.40 | 0.10 | −1.14 | 1.62 | 1.58 |
| 9 | Białka Tatrzańska | −0.35 | −0.51 | −1.51 | 0.73 | 1.13 |
| 10 | Tarnów | −0.47 | 0.14 | -0.17 | 1.60 | 0.55 |
| 11 | Kielce | 1.62 | 0.23 | −0.74 | 0.60 | 1.16 |
| 12 | Lublin | −0.17 | −0.47 | −1.28 | 2.45 | 0.91 |
| 13 | Białystok | 1.49 | −0.25 | −1.04 | 0.43 | 0.28 |
| 14 | Pułtusk | 0.57 | −0.88 | −0.29 | 0.54 | 1.10 |
| 15 | Płock | 1.65 | 0.71 | 0.74 | −0.67 | 0.73 |
| 16 | Toruń | −0.43 | 1.31 | −1.26 | 1.07 | 0.47 |
| No. | Station | Classes of Daily Precipitation (mm) | |||||||
|---|---|---|---|---|---|---|---|---|---|
| 0.0 | 0.1 | (0.1;0.5> | (0.5;1.0> | (1.0;5.0> | (5.0;10.0> | (10.0;20.0> | >20.0 | ||
| 1 | Skoczów | NA | 3.18 | 0.20 | 0.87 | 0.57 | −0.69 | −0.41 | 0.32 |
| 2 | Bielsko-Biała | 1.41 | 4.41 | −0.84 | −0.79 | −0.87 | −1.29 | −1.00 | 0.16 |
| 3 | Katowice | 4.12 | 0.50 | −2.58 | −0.11 | −1.31 | −1.27 | 1.32 | 1.53 |
| 4 | Rycerka Górna | 4.74 | 5.03 | 4.12 | 0.06 | 0.19 | −1.29 | 0.34 | 1.02 |
| 5 | Węglówka | 2.60 | 4.49 | 1.74 | 4.46 | 1.74 | −1.29 | 0.93 | 0.08 |
| 6 | Kraków | 1.59 | 1.97 | 0.58 | −0.33 | 0.26 | −1.27 | 0.35 | 0.27 |
| 7 | Kasprowy | 0.03 | 2.22 | 2.19 | −0.24 | −1.87 | −1.39 | 0.92 | −0.75 |
| 8 | Szaflary | −1.52 | 2.30 | 2.11 | 0.77 | −0.04 | −1.29 | 0.60 | −1.20 |
| 9 | Białka Tatrzańska | −4.83 | 2.50 | 3.32 | 3.22 | −0.83 | −1.39 | 0.14 | −0.07 |
| 10 | Tarnów | 1.17 | 2.78 | 0.86 | 0.48 | 0.23 | 0.64 | −0.94 | −0.15 |
| 11 | Kielce | 3.77 | 1.21 | 0.53 | 0.96 | −2.01 | −1.35 | −1.11 | 0.59 |
| 12 | Lublin | 2.22 | 0.76 | −1.76 | −1.21 | 1.63 | −0.83 | −0.09 | 0.15 |
| 13 | Białystok | 1.96 | 1.31 | −1.14 | −0.31 | −0.96 | −0.68 | 0.51 | 1.36 |
| 14 | Pułtusk | −0.36 | −3.80 | −4.02 | −0.01 | −0.07 | −0.89 | 2.26 | 0.41 |
| 15 | Płock | 2.25 | 4.96 | 0.64 | 1.26 | −1.26 | −0.51 | 1.15 | 0.33 |
| 16 | Toruń | −1.65 | 1.85 | 0.41 | 1.76 | 0.19 | 0.24 | 1.01 | 1.67 |
| No. | Station | Classes of Daily Precipitation (mm) | |||||||
|---|---|---|---|---|---|---|---|---|---|
| 0.0 | 0.1 | (0.1;0.5> | (0.5;1.0> | (1.0;5.0> | (5.0;10.0> | (10.0;20.0> | >20.0 | ||
| 1 | Skoczów | NA | 3.59 | 2.53 | 2.33 | 0.17 | −1.03 | 0.52 | −0.09 |
| 2 | Bielsko-Biała | −1.04 | 4.40 | 0.58 | 0.10 | −1.72 | 0.22 | 0.22 | 0.65 |
| 3 | Katowice | 2.08 | 1.84 | 1.58 | −0.76 | 0.41 | 0.65 | −0.84 | −0.18 |
| 4 | Rycerka Górna | 2.46 | 4.01 | 4.39 | 2.63 | 0.94 | 0.83 | −1.45 | 0.00 |
| 5 | Węglówka | 1.05 | 3.34 | 2.81 | 4.17 | 1.34 | −0.67 | 0.58 | −0.82 |
| 6 | Kraków | −1.04 | −0.25 | −2.24 | 2.80 | −1.27 | 0.40 | 2.03 | −0.88 |
| 7 | Kasprowy | −1.89 | 0.65 | −0.88 | −1.49 | −1.96 | −0.09 | 1.40 | 1.76 |
| 8 | Szaflary | −0.29 | 1.37 | 1.02 | 1.54 | −0.11 | 1.40 | −0.03 | 1.40 |
| 9 | Białka Tatrzańska | −1.37 | 2.03 | 1.76 | 4.77 | 0.66 | −1.00 | 0.37 | 0.50 |
| 10 | Tarnów | 0.13 | 3.42 | 0.96 | 1.54 | −1.43 | 0.52 | 0.40 | 1.66 |
| 11 | Kielce | 2.56 | 3.45 | 0.36 | 0.38 | 0.09 | −1.27 | 1.61 | 0.28 |
| 12 | Lublin | −0.63 | 0.74 | −1.17 | 0.48 | −0.27 | 0.32 | 1.90 | −0.27 |
| 13 | Białystok | −0.44 | 3.66 | −1.08 | 0.25 | −0.38 | −0.19 | 1.88 | 1.49 |
| 14 | Pułtusk | −4.07 | −2.08 | −0.15 | 0.02 | 0.42 | 0.12 | 1.89 | 0.56 |
| 15 | Płock | 3.37 | 3.73 | 0.29 | 1.24 | −2.33 | 0.59 | 0.90 | −0.68 |
| 16 | Toruń | −0.79 | 2.65 | 1.46 | 2.05 | −1.48 | 0.68 | −0.19 | 1.13 |
| No. | Station | Winter Minima | Summer Minima | ||||||
|---|---|---|---|---|---|---|---|---|---|
| Mean | Standard Deviation | Mean | Standard Deviation | ||||||
| Slope | Intercept | Slope | Intercept | Slope | Intercept | Slope | Intercept | ||
| 1 | Skoczów | 0.003 | 0.720 | −0.001 | 0.473 | 0.001 | 0.575 | 0.002 | 0.301 |
| 2 | Goczałkowice | −0.001 | 1.379 | −0.007 | 0.725 | 0.000 | 1.122 | −0.001 | 0.526 |
| 3 | Jawiszowice | −0.002 | 2.904 | −0.006 | 0.939 | −0.006 | 2.678 | −0.006 | 0.85 |
| 4 | Nowy Bieruń | 0.059 | 4.708 | 0.014 | 1.481 | 0.074 | 3.05 | 0.032 | 0.795 |
| 5 | Jagodniki | 0.087 | 50.095 | −0.019 | 12.139 | −0.129 | 51.343 | −0.105 | 13.94 |
| 6 | Szczucin | 0.349 | 77.855 | 0.011 | 22.539 | 0.311 | 78.547 | 0.172 | 16.063 |
| 7 | Sandomierz | 0.488 | 92.356 | −0.018 | 27.942 | 0.325 | 97.955 | 0.183 | 20.43 |
| 8 | Zawichost | 0.261 | 145.14 | −0.147 | 50.306 | 0.315 | 146.47 | 0.127 | 37.184 |
| 9 | Annopol | 0.338 | 150.87 | −0.005 | 48.181 | 0.233 | 155.153 | 0.181 | 38.038 |
| 10 | Puławy | 0.440 | 161.727 | 0.105 | 47.518 | 0.211 | 174.376 | 0.121 | 45.324 |
| 11 | Dęblin | 0.435 | 187.928 | −0.075 | 62.094 | 0.434 | 194.359 | 0.226 | 48.613 |
| 12 | Warszawa | 0.957 | 217.349 | −0.065 | 82.518 | 0.422 | 246.312 | 0.185 | 66.026 |
| 13 | Kępa Polska | 1.199 | 371.148 | −1.081 | 182.192 | 0.008 | 384.614 | 0.072 | 102.466 |
| 14 | Toruń | 0.141 | 400.539 | −0.711 | 130.009 | −0.325 | 399.589 | −0.316 | 123.544 |
| 15 | Tczew | 1.166 | 490.227 | −2.247 | 227.814 | 0.042 | 483.294 | −0.055 | 133.636 |
| No. | Station | Winter Minima | Summer Minima | ||||||
|---|---|---|---|---|---|---|---|---|---|
| Mean | Standard Deviation | Mean | Standard Deviation | ||||||
| Slope | Intercept | Slope | Intercept | Slope | Intercept | Slope | Intercept | ||
| 1 | Skoczów | −0.0002 | 0.4782 | −0.0002 | 0.0818 | 0.0010 | 0.5328 | −0.0002 | 0.0845 |
| 2 | Goczałkowice | −0.0008 | 0.4856 | −0.0002 | 0.0966 | −0.0003 | 0.5711 | 0.0002 | 0.0962 |
| 3 | Jawiszowice | −0.0010 | 0.4350 | −0.0006 | 0.1104 | −0.0011 | 0.5310 | 0.0009 | 0.0685 |
| 4 | Nowy Bieruń | −0.0013 | 0.3838 | −0.0004 | 0.094 | −0.0022 | 0.4892 | 0.0011 | 0.0709 |
| 5 | Jagodniki | −0.0012 | 0.3482 | −0.0003 | 0.088 | −0.0002 | 0.3428 | 0.0000 | 0.0885 |
| 6 | Szczucin | −0.0010 | 0.3378 | −0.0003 | 0.0927 | 0.0001 | 0.3248 | −0.0005 | 0.0918 |
| 7 | Sandomierz | −0.0012 | 0.3561 | −0.0003 | 0.0951 | 0.0003 | 0.319 | −0.0006 | 0.0923 |
| 8 | Zawichost | −0.0014 | 0.3725 | −0.0004 | 0.0995 | 0.0001 | 0.3183 | −0.0006 | 0.0915 |
| 9 | Annopol | −0.0012 | 0.3592 | −0.0002 | 0.0916 | 0.0002 | 0.3084 | −0.0004 | 0.0826 |
| 10 | Puławy | −0.0012 | 0.3426 | −0.0003 | 0.0972 | 0.0003 | 0.2866 | −0.0004 | 0.0813 |
| 11 | Dęblin | −0.0013 | 0.3404 | −0.0003 | 0.9048 | 0.0000 | 0.2863 | −0.0001 | 0.0750 |
| 12 | Warszawa | −0.0015 | 0.3262 | −0.0004 | 0.1007 | 0.0002 | 0.2469 | −0.0003 | 0.0785 |
| 13 | Kępa Polska | −0.0016 | 0.3196 | −0.0004 | 0.0896 | 0.0001 | 0.2319 | −0.0003 | 0.0674 |
| 14 | Toruń | −0.0016 | 0.3116 | −0.0004 | 0.0867 | 0.0001 | 0.2201 | −0.0003 | 0.0647 |
| 15 | Tczew | −0.0013 | 0.2847 | −0.0003 | 0.0792 | 0.0000 | 0.2059 | −0.0003 | 0.0590 |
Publisher’s Note: MDPI stays neutral with regard to jurisdictional claims in published maps and institutional affiliations. |
© 2021 by the authors. Licensee MDPI, Basel, Switzerland. This article is an open access article distributed under the terms and conditions of the Creative Commons Attribution (CC BY) license (https://creativecommons.org/licenses/by/4.0/).
Share and Cite
Bogdanowicz, E.; Karamuz, E.; Romanowicz, R.J. Temporal Changes in Flow Regime along the River Vistula. Water 2021, 13, 2840. https://doi.org/10.3390/w13202840
Bogdanowicz E, Karamuz E, Romanowicz RJ. Temporal Changes in Flow Regime along the River Vistula. Water. 2021; 13(20):2840. https://doi.org/10.3390/w13202840
Chicago/Turabian StyleBogdanowicz, Ewa, Emilia Karamuz, and Renata Julita Romanowicz. 2021. "Temporal Changes in Flow Regime along the River Vistula" Water 13, no. 20: 2840. https://doi.org/10.3390/w13202840
APA StyleBogdanowicz, E., Karamuz, E., & Romanowicz, R. J. (2021). Temporal Changes in Flow Regime along the River Vistula. Water, 13(20), 2840. https://doi.org/10.3390/w13202840