
Pumping Well Layout Scheme Design and Sensitivity Analysis of Total Critical Pumping Rates in Coral Island Based on Numerical Model


Abstract
:1. Introduction
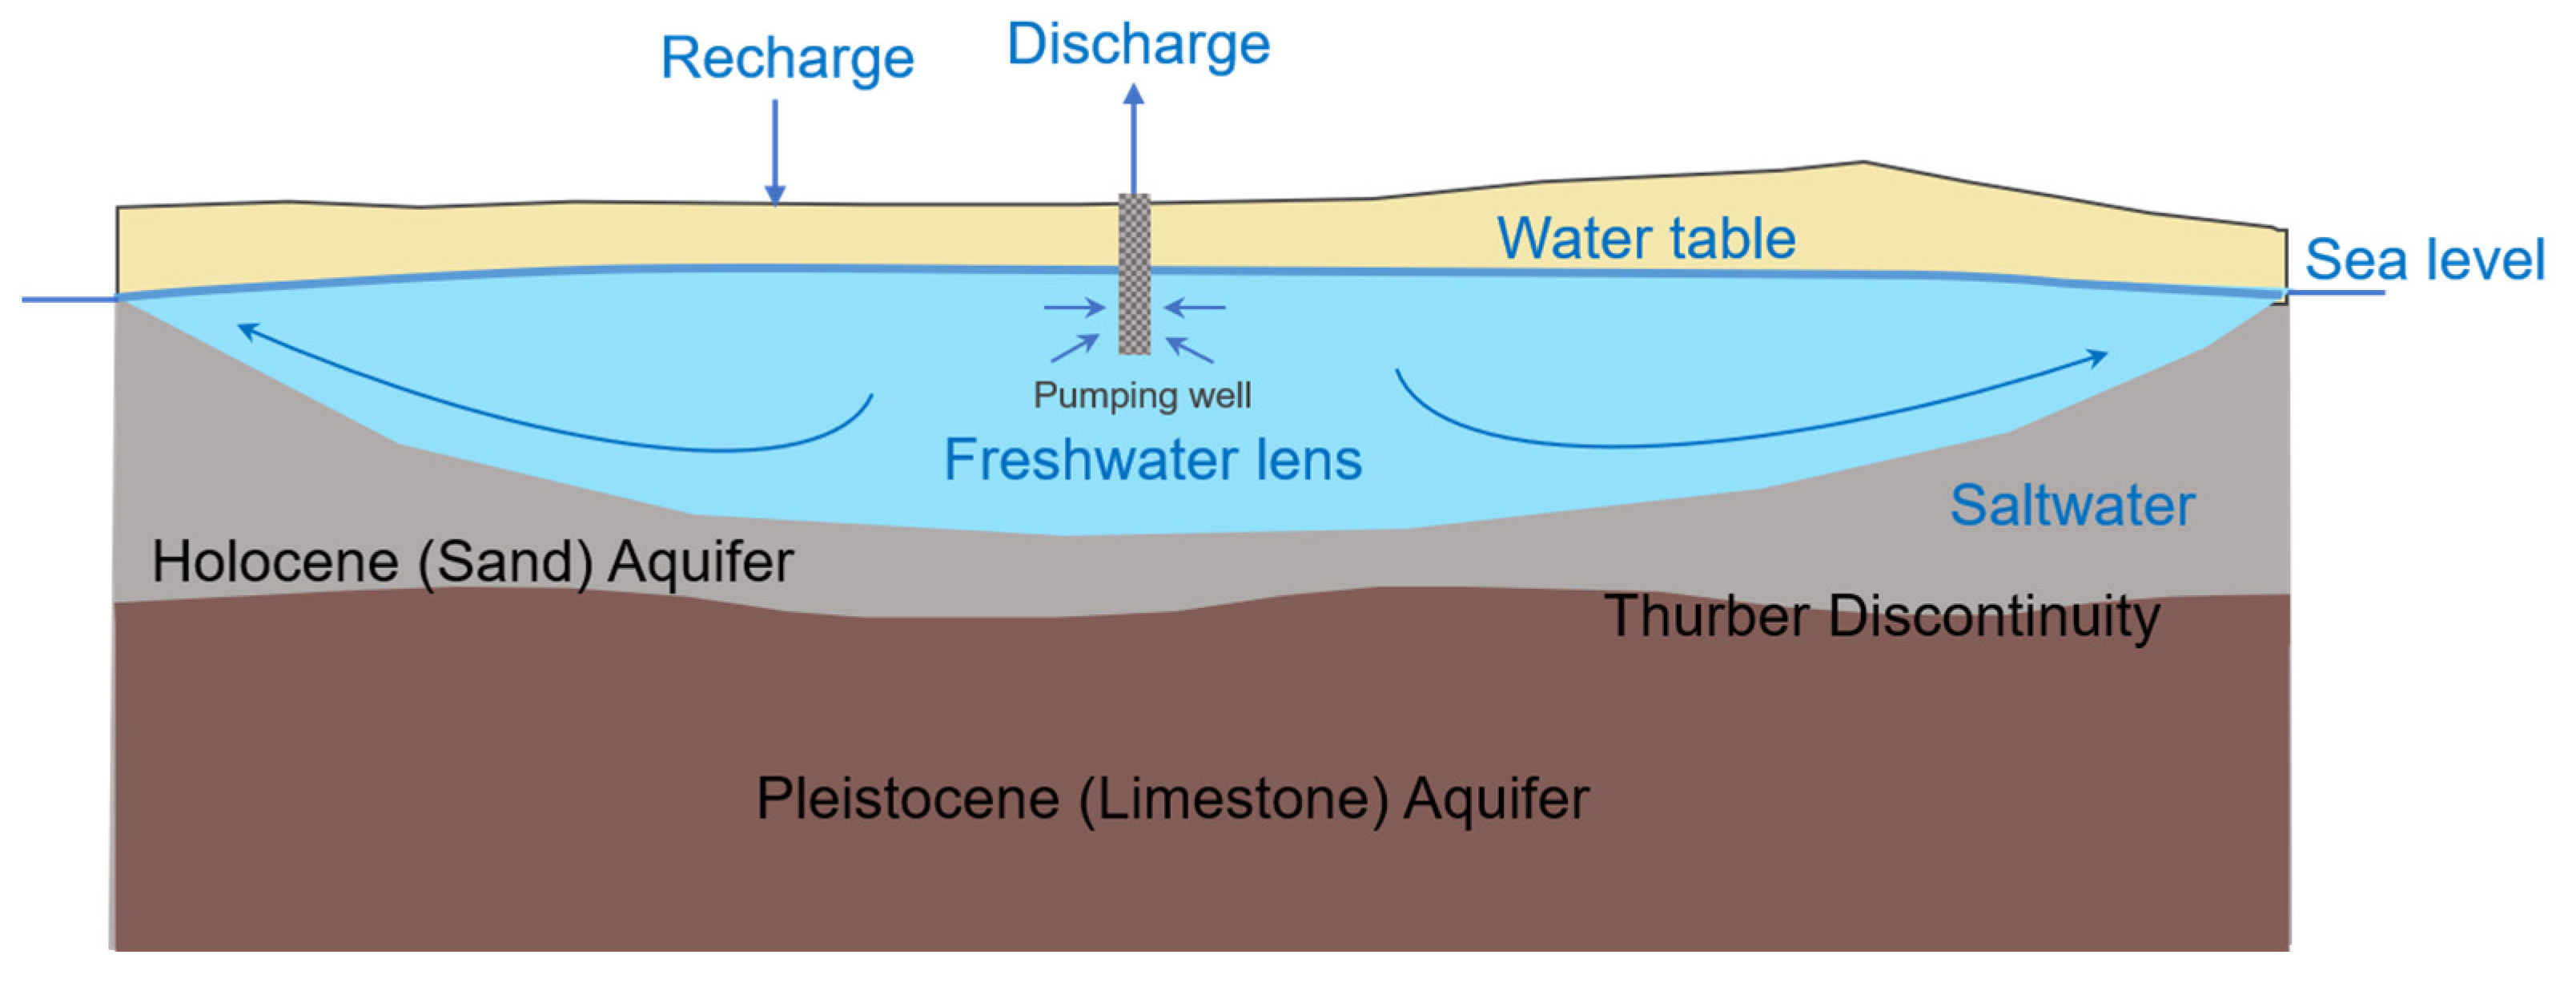
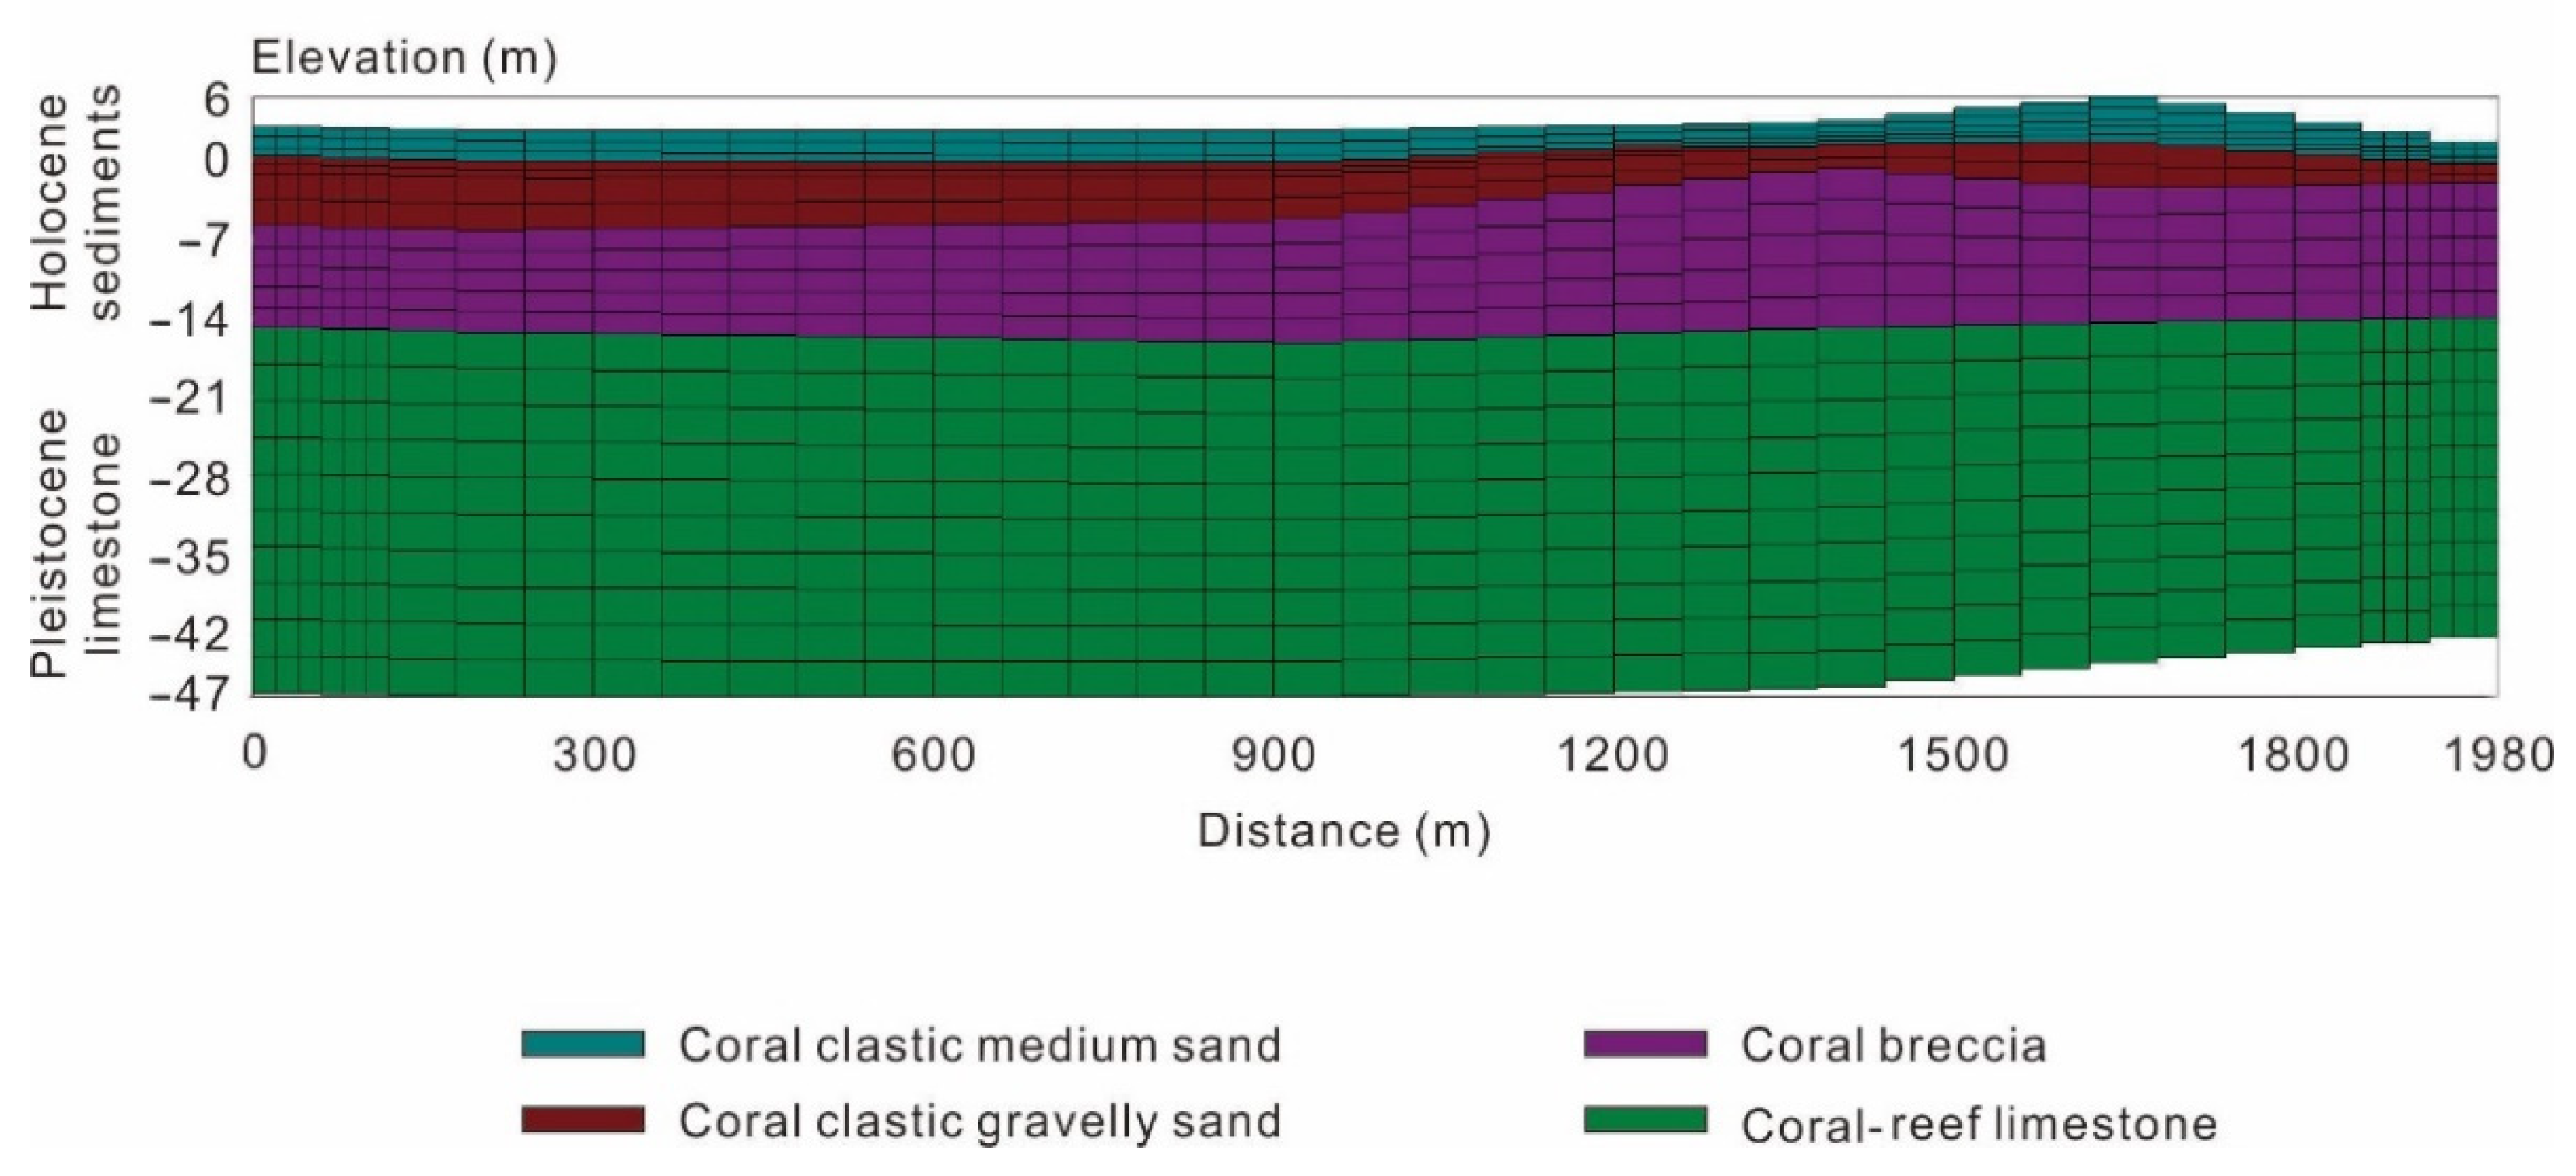
2. Study Area
3. Materials and Methods
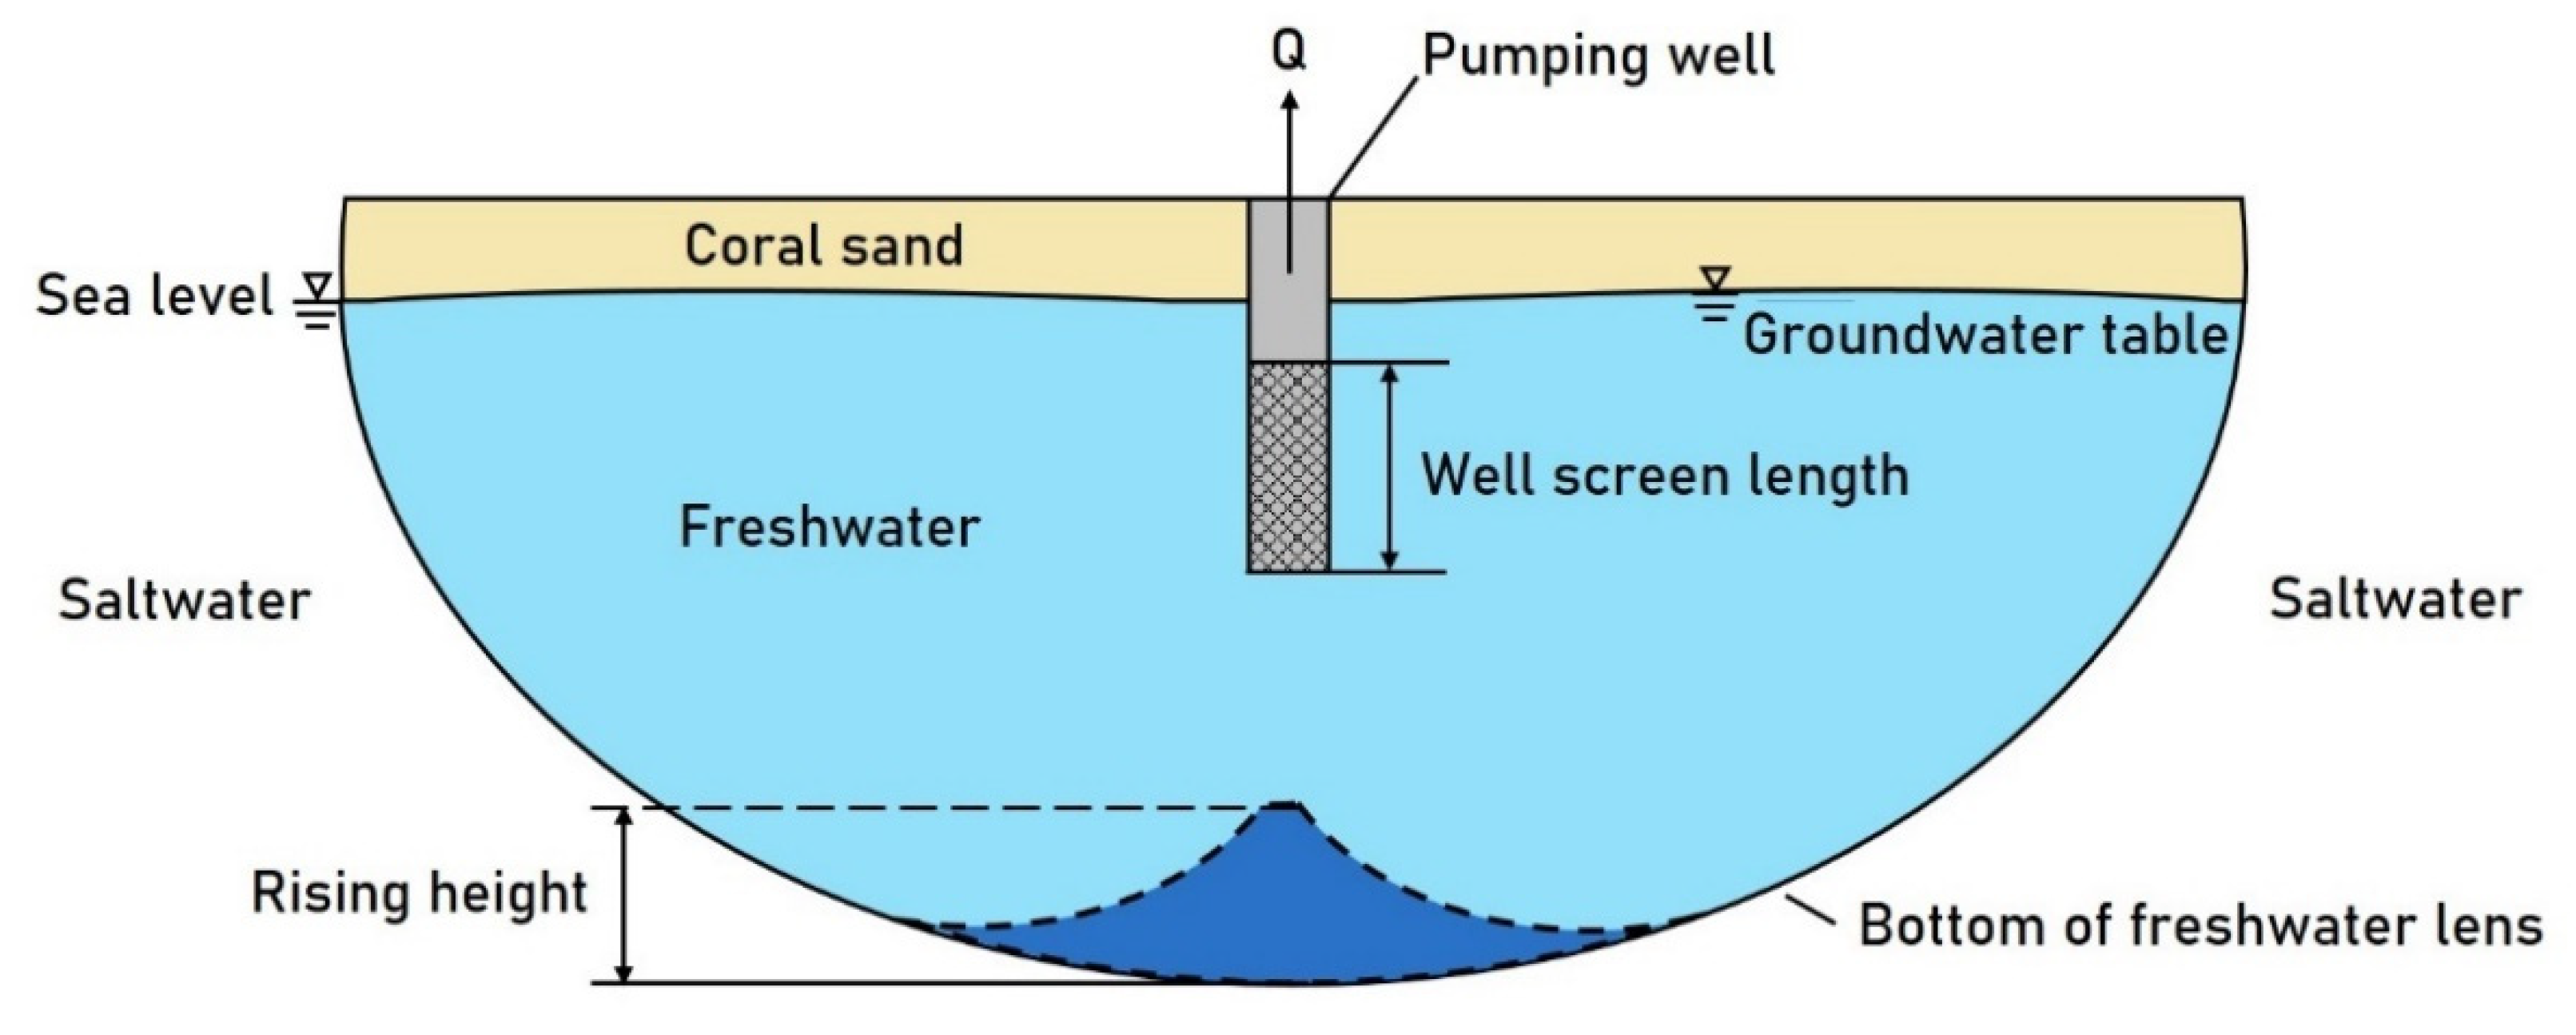
3.1. Numerical Model
3.2. Orthogonal Experimental Design
3.2.1. Orthogonal Table
- Different numbers in each column appear at the same time. For example, in the three factors and three levels orthogonal table, any column has 1, 2, and 3, and the number of occurrences in each column is equal.
- The arrangement of numbers in any two columns is comprehensive and balanced. For example, in the case of three levels, there are nine kinds of ordered number pairs in any two columns (in the same row), “1,1”, “1,2”, “1,3”, “2,1”, “2,2”, “2,3”, “3,1”, “3,2”, “3,3”, and each pair appears the same times.
3.2.2. Multi-index Range Analysis
3.2.3. Comprehensive Balance Analysis
4. Results and Discussion
4.1. Pumping Wells Layout Scheme Design of the Freshwater Lens
4.2. Uncertainty Analysis of QT and Main Influence Factors
5. Summary and Concluding Remarks
- (1)
- The determination of QT should be based on the specific well layout, with consideration of the length of well screens, the number of wells, and the distance between wells, because the calculation results of QT corresponding to different well layouts can differ by three times.
- (2)
- The orthogonal experimental design is adopted to analyze the important elements of well layout, and thereby the results based on multi-index extremum range analysis and comprehensive balance analysis show that the number of wells and the length of well screens are the most critical factors in the design of well layout scheme, followed by the distance between wells.
- (3)
- In this study, the optimal well layout is selected from nine schemes. The length of the well screen of the scheme is 3 m, the number of wells is two and the distance between wells is 200 m, which accounts for about 10% of the island width. For the optimal scheme, QT is 0.33 m3/d, TC is 4.6 m, which accounts for 60% of the original thickness, and Tm is 9.8 m, which accounts for 86% of the original thickness.
- (4)
- The sensitivities of the hydrogeological parameters with respect to QT are significant.
Author Contributions
Funding
Data Availability Statement
Acknowledgments
Conflicts of Interest
References
- Ghyben, B.W. Nota in Verband met de Voorgenomen Putboring nabij Amsterdam. Tijdschr. K. Inst. Ing. 1889, 21, 8–22. [Google Scholar]
- Herzberg, A. Die Wasserversorgung einiger Nordseebader. J. Gasbeleucht. Wasserversorg. 1901, 44, 842–844. [Google Scholar]
- Bryan, E.H. Check List of Atolls. Atoll Research Bulletin No. 19; The Pacific Science Board: Washington, DC, USA, 1953. [Google Scholar]
- Ayers, J.F.; Vacher, H.L. Hydrogeology of an atoll island: A conceptual model from a detailed study of a Micronesian example. Ground Water 1986, 24, 185–198. [Google Scholar] [CrossRef]
- White, I.; Falkland, T. Management of freshwater lenses on small Pacific islands. Hydrogeol. J. 2010, 18, 227–246. [Google Scholar] [CrossRef]
- Pauw, P.S.; van der Zee, S.E.; Leijnse, A.; Essink, G.H.O. Saltwater Upconing Due to Cyclic Pumping by Horizontal Wells in Freshwater Lenses. Ground Water 2015, 54, 521–531. [Google Scholar] [CrossRef]
- Sheng, C.; Xu, H.H.; Zhang, Y.F.; Zhang, W.T.; Rem, Z.Q. Hydrological properties of calcareous sands and its influence on formation of underground freshwater lens on islands. J. Jilin Univ. (Earth Sci. Ed.) 2020, 50, 1127–1138. (In Chinese) [Google Scholar]
- Bailey, R.T.; Jenson, J.W.; Olsen, A.E. Numerical modeling of atoll island hydrogeology. Ground Water. 2009, 47, 184–196. [Google Scholar] [CrossRef] [PubMed]
- Chui, T.F.M.; Terry, J.P. Modeling freshwater lens damage and recovery on atolls after storm-wave washover. Ground Water. 2012, 50, 412–420. [Google Scholar] [CrossRef] [PubMed]
- Mahmoodzadeh, D.; Ketabchi, H.; Ataie-Ashtiani, B.; Simmons, C.T. Conceptualization of a fresh groundwater lens influenced by climate change: A modeling study of an arid-region island in the Persian Gulf, Iran. J. Hydrol. 2014, 519, 399–413. [Google Scholar] [CrossRef]
- Stofberg, S.F.; Essink, G.H.P.O.; Pauw, P.S.; de Louw, P.G.B.; Leijnse, A.; van der Zee, S.E.A.T.M. Fresh Water Lens Persistence and Root Zone Salinization Hazard Under Temperate Climate. Water Resour. Manag. 2017, 31, 689–702. [Google Scholar] [CrossRef] [Green Version]
- Post, V.E.; Galvis, S.C.; Sinclair, P.J.; Werner, A.D. Evaluation of management scenarios for potable water supply using script-based numerical groundwater models of a freshwater lens. J. Hydrol. 2019, 571, 843–855. [Google Scholar] [CrossRef]
- Briggs, M.A.; Cantelon, J.A.; Kurylyk, B.L.; Kulongoski, J.T.; Mills, A.; Lane, J.W. Small atoll fresh groundwater lenses respond to a combination of natural climatic cycles and human modified geology. Sci. Total Environ. 2021, 756, 143838. [Google Scholar] [CrossRef]
- Fang, Z.D.; Zhou, C.Z.; Liang, H.G.; Huang, X.W.; Long, X.Y. Research on influential factors upon the up-cone of the freshwater lens in a coral island. J. Logist. Eng. Univ. 2012. (In Chinese) [Google Scholar] [CrossRef]
- Sheng, C.; Xu, H.H.; Zhang, W.T. Numerical simulation of the effect of geomorphologic changes on freshwater lens in the Yongxing Island. Q. J. Eng. Geol. Hydrogeol. 2018, 45, 7–14. (In Chinese) [Google Scholar]
- Han, D.M.; Cao, G.L.; Song, X.F. Formation processes and influencing factors of freshwater lens in artificial island of coral reef in South China Sea. Acta Geogr. Sin. 2020, 75, 167–178. (In Chinese) [Google Scholar]
- Stoeckl, L.; Houben, G. Flow dynamics and age stratification of freshwater lenses: Experiments and modeling. J. Hydrol. 2012, 458, 9–15. [Google Scholar] [CrossRef]
- Lu, C.; Cao, H.; Ma, J.; Shi, W.; Rathore, S.S.; Wu, J.; Luo, J. A Proof-of-Concept Study of Using a Less Permeable Slice along the Shoreline to Increase Fresh Groundwater Storage of Oceanic Islands: Analytical and Experimental Validation. Water Resour. Res. 2019, 55, 6450–6463. [Google Scholar] [CrossRef]
- Li, Y.; Shu, L.; Zhen, L.; Li, H.; Wang, R.; Opoku, P. Laboratory Physical Experiments on the Saltwater Upconing and Recovery of Island Freshwater Lenses: Case Study of a Coral Island, China. Water 2021, 13, 1137. [Google Scholar] [CrossRef]
- Banerjee, P.; Singh, V.S. Optimization of pumping rate and recharge through numerical modeling with special reference to small coral island aquifer. Phys. Chem. Earth Parts A/B/C 2011, 36, 1363–1372. [Google Scholar] [CrossRef]
- Comte, J.-C.; Cassidy, R.; Obando, J.; Robins, N.; Ibrahim, K.; Melchioly, S.; Mjemah, I.; Shauri, H.; Bourhane, A.; Mohamed, I.; et al. Challenges in groundwater resource management in coastal aquifers of East Africa: Investigations and lessons learnt in the Comoros Islands, Kenya and Tanzania. J. Hydrol. Reg. Stud. 2016, 5, 179–199. [Google Scholar] [CrossRef]
- Bourhane, A.; Comte, J.C.; Join, J.L.; Ibrahim, K. Groundwater prospection in Grande Comore Island—Joint contribution of geophysical methods, hydrogeological time-series analysis and groundwater modelling. In Active Volcanoes of the Southwest Indian Ocean; Bachelery, P., Lenat, J.-F., Di Muro, A., Michon, L., Eds.; Springer: Berlin, Germany, 2016; pp. 385–401. [Google Scholar] [CrossRef]
- Werner, A.; Sharp, H.K.; Galvis, S.C.; Post, V.E.; Sinclair, P. Hydrogeology and management of freshwater lenses on atoll islands: Review of current knowledge and research needs. J. Hydrol. 2017, 551, 819–844. [Google Scholar] [CrossRef]
- Barkey, B.; Bailey, R. Estimating the Impact of Drought on Groundwater Resources of the Marshall Islands. Water 2017, 9, 41. [Google Scholar] [CrossRef] [Green Version]
- Langevin, C.D.; Shoemaker, W.B.; Guo, W. MODFLOW-2000. The US Geological Survey Modular Ground-Water Model–Documentation of the SEAWAT-2000 Version with the Variable-Density Flow Process (VDF) and the Integrated MT3DMS Transport Process (IMT); US Geological Survey: Reston, VA, USA, 2003.
- Oberdorfer, J.A.; Hogan, P.J.; Buddemeier, R.W. Atoll Island Hydrogeology: Flow and Freshwater Occurrence in a Tidally Dominated System. J. Hydrol. 1990, 120, 327–340. [Google Scholar] [CrossRef]
- Holding, S.; Allen, D.M. From days to decades: Numerical modeling of freshwater lens response to climate change stressors on small islands. Hydrol. Earth Syst. Sci. 2015, 11, 933–949. [Google Scholar] [CrossRef] [Green Version]
- Dargahi, M.; Kazemian, H.; Soltanieh, M.; Hosseinpour, M.; Rohani, S. High temperature synthesus of SAPO-34: Applying an L9 Taguchi orthogonal design to investigate the effects of experimentalparameters. Power Technol. 2012, 217, 223–230. [Google Scholar] [CrossRef]
- Lee, Y.; Filliben, J.J.; Micheals, R.J.; Phillips, P.J. Sensitivity analysis for biometric systems: Amethodology based on orthogonal experiment designs. Comput. Vis. Image Underst. 2013, 117, 532–550. [Google Scholar] [CrossRef]
- Ji, L.; Si, Y.; Liu, H.; Song, X.; Zhu, W.; Zhu, A. Application of orthogonal experimental design in synthesis of mesoporous bioactive glass. Microporous Mesoporous Mater. 2014, 184, 122–126. [Google Scholar] [CrossRef]
- Lekivetz, R.; Tang, B. Multi-level orthogonal arrays for estimating main effects and specified interactions. J. Stat. Plan. Inference 2014, 144, 123–132. [Google Scholar] [CrossRef]
- Madeley, J. The United Nations Conference on Environment and Development (UNCED): Rio de Janeiro, Brazil, 3–14 June 1992. Land Use Policy 1992, 9, 300–302. [Google Scholar] [CrossRef]
- Alley, W.M.; Reilly, T.E.; Franke, O.L. Sustainsbility of Groundwater Resources; U.S. Geological Survey: Reston, VA, USA, 1999.
- Reilly, T.E.; Goodman, A.S. Analysis of saltwater upconing beneath a pumping well. J. Hydrol. 1987, 89, 169–204. [Google Scholar] [CrossRef]
- WHO. Who Guidelines for Drinking Water Quality: Training Pack; World Health Organization—WHO: Geneva, Switzerland, 2000. [Google Scholar]
- Lloyd, J.W.; Miles, J.C.; Chessman, G.R.; Bugg, S.F. A ground water resources study of a Pacific Ocean atoll: Tarawa, Gilbert Islands. Water Resour. 1980, 16, 646–653. [Google Scholar] [CrossRef]
- Bailey, R.T.; Jenson, J.W.; Olsen, A.E. Estimating the ground water resources of atoll islands. Water 2010, 2, 1–27. [Google Scholar] [CrossRef]
- Yao, Y.; Andrews, C.; Zheng, Y.; He, X.; Babovic, V.; Zheng, C. Development of fresh groundwater lens in coastal reclaimed islands. J. Hydrol. 2019, 573, 365–375. [Google Scholar] [CrossRef]
- Morris, M.D. Factorial sampling plans for preliminary computational experiments. Technometrics 1991, 33, 161–174. [Google Scholar] [CrossRef]


| Settings | Parameter | Units | Value |
|---|---|---|---|
| Basic setup | Island width | m | 1980 |
| Thickness | m | 50 | |
| Grid | \ | 41 × 22 | |
| Simulated time step | d | 36,525 | |
| Flow model | Recharge | mm/y | Monthly average recharge |
| Effective porosity | \ | 0.25–0.45 | |
| Holocene K | m/d | 60–150 | |
| Pleistocene K | m/d | 1000 | |
| Specific yield | \ | 0.1–0.2 | |
| Transport model | Longitudinal dispersivity | m | 5 |
| Density-dependent model | Reference fluid density (Freshwater) | kg/m3 | 1000 |
| Seawater density | kg/m3 | 1025 |
| Factors | Levels | ||
|---|---|---|---|
| 1 | 2 | 3 | |
| Factor A | Value 1 | Value 2 | Value 3 |
| Factor B | Value 5 | Value 6 | Value 7 |
| Factor C | Value 8 | Value 9 | Value 10 |
| Test Number | Levels | ||
|---|---|---|---|
| A | B | C | |
| 1 | 1 | 1 | 1 |
| 2 | 1 | 2 | 3 |
| 3 | 1 | 3 | 2 |
| 4 | 2 | 1 | 3 |
| 5 | 2 | 2 | 2 |
| 6 | 2 | 3 | 1 |
| 7 | 3 | 1 | 2 |
| 8 | 3 | 2 | 1 |
| 9 | 3 | 3 | 3 |
| Items | Factors | |||
|---|---|---|---|---|
| A | B | C | ||
| Indicator | K1 | Value A1 | Value B2 | Value C3 |
| K2 | Value A2 | Value B2 | Value C2 | |
| K3 | Value A3 | Value B3 | Value C3 | |
| Value A1/3 | Value B1/3 | Value C1/3 | ||
| Value A2/3 | Value B2/3 | Value C2/3 | ||
| Value A3/3 | Value B3/3 | Value C3/3 | ||
| optimization level of factors | A1 | B3 | C3 | |
| R | max-min | max-min | max-min | |
| Importance ranking | BAC | |||
| Factors | Levels | ||
|---|---|---|---|
| 1 | 2 | 3 | |
| A: Screen length | 2 m | 3 m | 4 m |
| B: Number of wells | 2 | 4 | 6 |
| C: Distance between wells | 100 m | 150 m | 200 m |
| Test Number | Levels | Test Results | ||||
|---|---|---|---|---|---|---|
| A | B | C | QT (m3/d) | TC (m) | Tm (m) | |
| 1 | 3 | 2 | 1 | 0.407 | 4.30 | 9.20 |
| 2 | 1 | 2 | 3 | 0.730 | 1.10 | 7.40 |
| 3 | 1 | 3 | 2 | 0.907 | 0.50 | 6.10 |
| 4 | 2 | 2 | 2 | 0.555 | 2.30 | 8.20 |
| 5 | 1 | 1 | 1 | 0.330 | 2.20 | 9.80 |
| 6 | 3 | 3 | 3 | 0.735 | 1.70 | 7.00 |
| 7 | 2 | 3 | 1 | 0.562 | 2.80 | 7.50 |
| 8 | 3 | 1 | 2 | 0.215 | 3.30 | 10.00 |
| 9 | 2 | 1 | 3 | 0.330 | 4.60 | 9.80 |
| Items | Factors | |||
|---|---|---|---|---|
| A | B | C | ||
| QT | K1 | 1.97 | 0.88 | 1.30 |
| K2 | 1.45 | 1.69 | 1.68 | |
| K3 | 1.36 | 2.20 | 1.80 | |
| 0.66 | 0.29 | 0.43 | ||
| 0.48 | 0.56 | 0.56 | ||
| 0.45 | 0.73 | 0.60 | ||
| Optimization level of various factors | A1 | B3 | C3 | |
| R | 0.20 | 0.44 | 0.17 | |
| Primary and secondary order | BAC | |||
| Tc | K1 | 3.80 | 10.10 | 9.30 |
| K2 | 9.70 | 7.70 | 6.10 | |
| K3 | 9.30 | 5.00 | 7.40 | |
| 1.27 | 3.37 | 3.10 | ||
| 3.23 | 2.57 | 2.03 | ||
| 3.10 | 1.67 | 2.47 | ||
| Optimization level of various factors | A2 | B1 | C1 | |
| R | 1.97 | 1.70 | 1.07 | |
| Primary and secondary order | ABC | |||
| Tm | K1 | 23.30 | 29.60 | 26.50 |
| K2 | 25.50 | 24.80 | 24.30 | |
| K3 | 26.20 | 20.60 | 24.20 | |
| 7.77 | 9.87 | 8.83 | ||
| 8.50 | 8.27 | 8.10 | ||
| 8.73 | 6.87 | 8.07 | ||
| Optimization level of various factors | A3 | B1 | C1 | |
| R | 0.97 | 3.00 | 0.77 | |
| Importance ranking | BAC | |||
| Percentage of Parameters Changes Parameters | −30% | −15% | 0% | 15% | 30% |
|---|---|---|---|---|---|
| |Si| | |||||
| DI | 0.202 | 0.364 | 0.000 | 0.323 | 0.192 |
| Sy | 0.172 | 0.343 | 0.000 | 0.343 | 0.182 |
| ne | 0.101 | 0.364 | 0.000 | 0.566 | 0.293 |
| α | 1.202 | 0.869 | 0.000 | 2.020 | 1.667 |
| K | 0.717 | 0.949 | 0.000 | 0.202 | 0.313 |
| α–K | 0.788 | 0.485 | 0.000 | 1.616 | 1.222 |
| α–ne | 1.242 | 0.970 | 0.000 | 2.182 | 1.828 |
| K–ne | 0.523 | 0.395 | 0.000 | 0.028 | 0.046 |
| α–K–ne | 0.899 | 0.566 | 0.000 | 1.717 | 1.354 |
Publisher’s Note: MDPI stays neutral with regard to jurisdictional claims in published maps and institutional affiliations. |
© 2021 by the authors. Licensee MDPI, Basel, Switzerland. This article is an open access article distributed under the terms and conditions of the Creative Commons Attribution (CC BY) license (https://creativecommons.org/licenses/by/4.0/).
Share and Cite
Wang, R.; Shu, L.; Li, Y.; Opoku, P.A. Pumping Well Layout Scheme Design and Sensitivity Analysis of Total Critical Pumping Rates in Coral Island Based on Numerical Model. Water 2021, 13, 3215. https://doi.org/10.3390/w13223215
Wang R, Shu L, Li Y, Opoku PA. Pumping Well Layout Scheme Design and Sensitivity Analysis of Total Critical Pumping Rates in Coral Island Based on Numerical Model. Water. 2021; 13(22):3215. https://doi.org/10.3390/w13223215
Chicago/Turabian StyleWang, Ran, Longcang Shu, Yuxi Li, and Portia Annabelle Opoku. 2021. "Pumping Well Layout Scheme Design and Sensitivity Analysis of Total Critical Pumping Rates in Coral Island Based on Numerical Model" Water 13, no. 22: 3215. https://doi.org/10.3390/w13223215
APA StyleWang, R., Shu, L., Li, Y., & Opoku, P. A. (2021). Pumping Well Layout Scheme Design and Sensitivity Analysis of Total Critical Pumping Rates in Coral Island Based on Numerical Model. Water, 13(22), 3215. https://doi.org/10.3390/w13223215