Article

The Effect of Temporal Characteristics on Developing a Practical Rainfall-Induced Landslide Potential Evaluation Model Using Random Forest Method

1
Department of Civil Engineering, Feng Chia University, Taichung 407, Taiwan
2
True Dreams Construction Company, Taichung 403, Taiwan
*
Author to whom correspondence should be addressed.
Water 2021, 13(23), 3348; https://doi.org/10.3390/w13233348
Submission received: 22 October 2021 / Revised: 19 November 2021 / Accepted: 23 November 2021 / Published: 25 November 2021

Abstract

:
With the unique rainfall patterns of typhoons, plum rains, and short-term heavy rainfalls, the frequent landslide and debris flow disasters have caused severe loss to people in Taiwan. In the studies of landslide susceptibility, the information of factors used for analysis was usually annual-based content, and it was assumed that the same elements from different years were independent between each year. However, the occurrence of landslides was usually not simply due to the changes within a year. Instead, landslides were triggered because the factors that affected the potential of landslides reached critical conditions after a cumulative change with time. Therefore, this study had well evaluated the influence of temporal characteristics and the ratios of antecedent landslide areas in the past five years in the landslide potential evaluation model. The analysis was conducted through the random forest (RF) algorithm. Additional rainfall events of 2017 were used to test the proposed model’s performance to understand its practicality. The analysis results show that in the study area, the RF model had considerably acceptable performance. The results have also demonstrated that the antecedent landslide ratios in the past five years were essential to describe the significance of cumulative change with time when conducting potential landslide evaluation.

1. Introduction

Taiwan is an island located in the hot zone of the Circurm-Pacific Earthquake Belt, typhoons, and subtropics monsoon climatic region. About 70% or more of the island’s area is hillsides and mountains. Because of the steep topography and geological vulnerability, two or more natural disasters are common in Taiwan. Landslide disasters have become a critical issue in recent years due to their increasing frequency of occurrence caused by extreme weather and climate change.
To better understand and deal with the increase in landslide disasters, researchers conducted studies on the potential for landslide and occurrence probability by considering environmental conditions. Most researchers used the landslide susceptibility analysis (LSA) to develop landslide evaluation models. Factors that describe the environmental conditions and triggering behavior of landslides were usually used in the LSA method. The LSA-based models can be divided into qualitative and quantitative methods [1,2]. The approaches of statistical analysis, geotechnical engineering analysis (deterministic and probability), artificial intelligence [3,4,5,6,7,8,9], and data mining were commonly used for quantitative LSA modeling. Artificial intelligence has become a popular data analysis method in recent years [8] utilizing machine learning, and deep learning algorithms have become more efficient and reliable in recent years. The machine learning algorithm, Random Forest (RF), was often used for landslide potential evaluation [9,10,11,12,13,14,15] and was the study focus of this paper.
Landslide risk analysis (LRA) is another approach to study the landslide disaster. The concept of the risk triangle, proposed by Crichton [16], including hazard, vulnerability, and exposure, is usually used to develop an LRA model, in which probability assessment is performed to describe the risk level. A recently developed landslide evaluation model using the landslide fragility curves (LFC) was a model of LRA [1,2,17]. LFC model used spatial statistics and GIS for data processing on the grid base. Rainfall data over the study areas and landslide cases were obtained and analyzed by constructing a fragility curve to describe the exceeding probability of landslide for given environmental conditions. Fragility curves were built for each combination of factors in the model. With the fragility curves, the critical hazard potential and critical fragility potential were determined to express the probability of exceeding a damage state of landslides under certain conditions of rainfall intensity and accumulated rainfall [2].
Both LSA and LRA models use factors to describe the potential of landslides. These factors, such as rainfall intensity, accumulated rainfall, slope degree, etc., were categorized as environmental factors and triggering factors. The development of the landslide potential evaluation model was usually conducted by considering the effectiveness of each chosen factor for a given period, e.g., the accumulated rainfall of each heavy rainfall event used for developing the model. Among the rainfall-induced researches, the rainfall thresholds are usually the main factor when evaluating the landslide susceptibility [18], and the temporal resolution of rainfall affects the thresholds significantly [19]. In these studies, the rainfall factors were included in the evaluation procedure by yearly-based input, not considering the consecutive influence from previous years.
In addition to rainfall factors, previous studies [1,2,20,21] on landslides usually used other annual factors of each year to establish a potential evaluation model. The variation of the same factors between each year was typically assumed to be independent and uncorrelated. However, landslides were usually caused not simply due to the change that occurred within a year. The cumulative impacts of the factors had affected the landslide potential over time, and the landslide was triggered when the critical condition was reached. Therefore, not only the spatial factors but the temporal consecutive characteristics should be considered in the model. For this purpose, a novelty attempt was made by including the consecutive changes of landslide areas in this study. The antecedent landslide area was adopted as a temporal characteristic factor in the proposed model, and its effect was discussed in this paper.
Finally, the performance of the proposed RF model was evaluated, and two events of heavy rainfalls in 2017 were used for specific event-driven performance tests. The insights from the newly developed RF model were also included in this paper.

2. Study Areas and Environmental Factor Database

2.1. Study Areas

In the middle south of Taiwan, the watershed areas of the ChenYuLan River, the Lao- nong River, and the Qishan River (Figure 1) were chosen to develop the landslide potential evaluation model. The ChenYuLan River watershed is located in the mountainous area of Nantou County. The mainstream ChenYuLan River is one of the important tributaries of the Zhuoshui River, with a total length of about 42 km. The terrain of the ChenYuLan River is characterized by a significant height difference and steep slope. The watershed area of ChenYuLan River is about 448 km2, and the average gradient is over 55%. Most of the Laonong River watershed area is located in Kaohsiung City. The mainstream of the Laonong River is the first tributary of the Gaoping River basin, with a total length of about 137 km. The terrain of the Laonong River is characterized as the valley topography, and the downstream is a suddenly widened sediment area. The watershed area of the Laonong River is extensive, with an area of 1408.71 km2 and an average slope of over 65%. The Qishan River watershed area is located in Kaohsiung City and Chiayi County. The mainstream Qishan River is a tributary of the Gaoping River, with a total length of about 117 km. The terrain of the Qishan River is characterized as the terraces valley. The river is suddenly widened at the downstream section. The watershed of Qishan River is about 750.79 km2 and with an average slope of more than 55%.
To better understand what has occurred in the region, satellite images from 2011 to 2016 were used to build the model factor for this study. The images had undergone a radiometric correction and orthorectification process. The satellite images of 2011 and 2016 are shown as examples in Figure 2.

2.2. Slope Units

To develop the RF models, the area impacted by landslides was first calculated based on slope units. A slope unit is defined as one slope part or the left/right part of a watershed. Slope units can be topologically divided by the watershed divide and drainage line (Figure 3) with the help of the GIS tool [22]. We used the slope unit as the analysis basis to physically and adequately represent the local conditions. Then, the environmental database was applied in accordance with the slope units at the site of interest. The ChenYuLan River, Laonong River, and Qishan River watersheds are 6651, 21,279, and 10,985 units, respectively (Figure 4).

2.3. Environmental Database and Model Factors

From research and studies, the landslide factor used for analysis included slope, lithology, aspect, elevation, land use, river system-related (including distance, density, etc.), vegetation-related (including species, density, age, etc.), geology (including distance, type, geological structure, etc.), soil-related (including type, thickness, content, etc.), slope shape, curvature (including horizontal, vertical, etc.), rainfall (including accumulated rainfall, rainfall intensity), and many more.
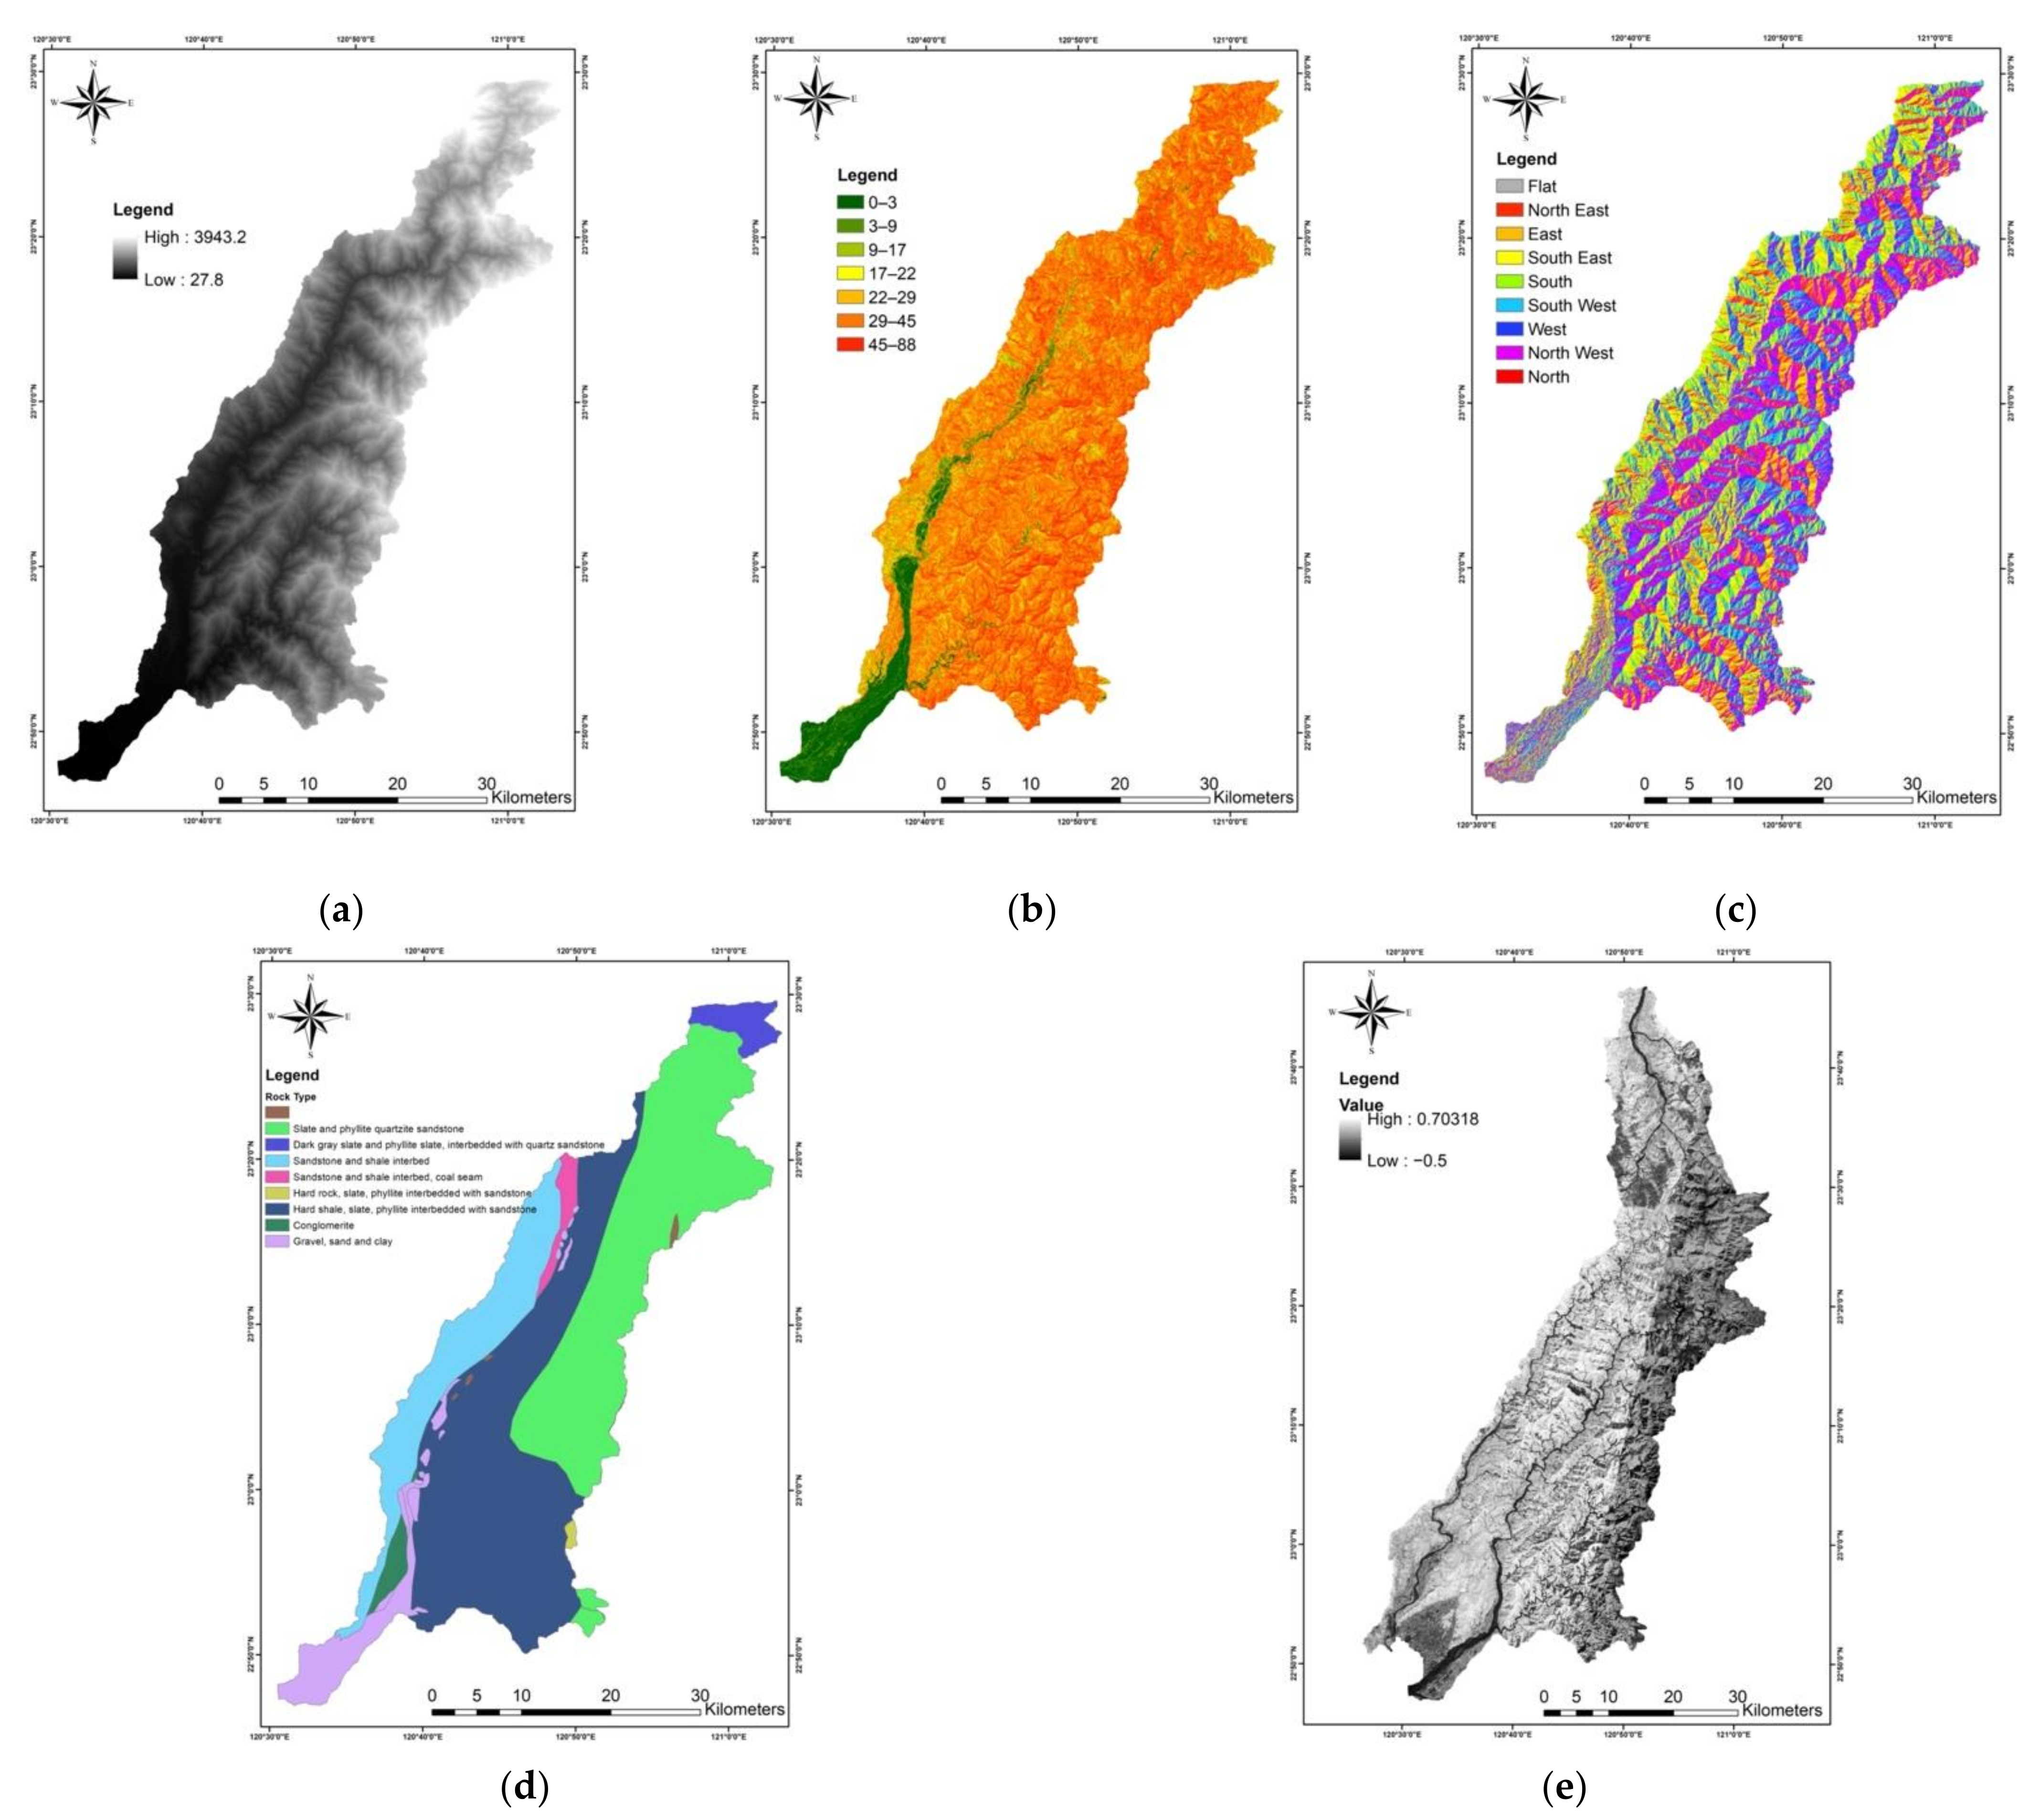
Factors directly or indirectly related to landslide occurrence were analyzed by their importance to establish the model for landslide potential evaluation. These factors were generally classified as environmental and triggering factors [23,24,25]. The rainfall was the primary concern, and the rainfall intensity (maximum hourly precipitation, Imax) and effective accumulated rainfall (Rte) were used as triggering factors in this study. In addition, elevation, slopes, slope aspects, normalized difference vegetation index (NDVI), distance to the river (stream), geology type, and the ratio of incremental landslide area were used as environmental factors of hillside slope in the study. These factors (Table 1) were collected from satellite images, digital elevation model (DEM), and monitoring records, and a GIS database was created to obtain and process the necessary content of factors. The basic statistical information of the database is shown in Table 2.
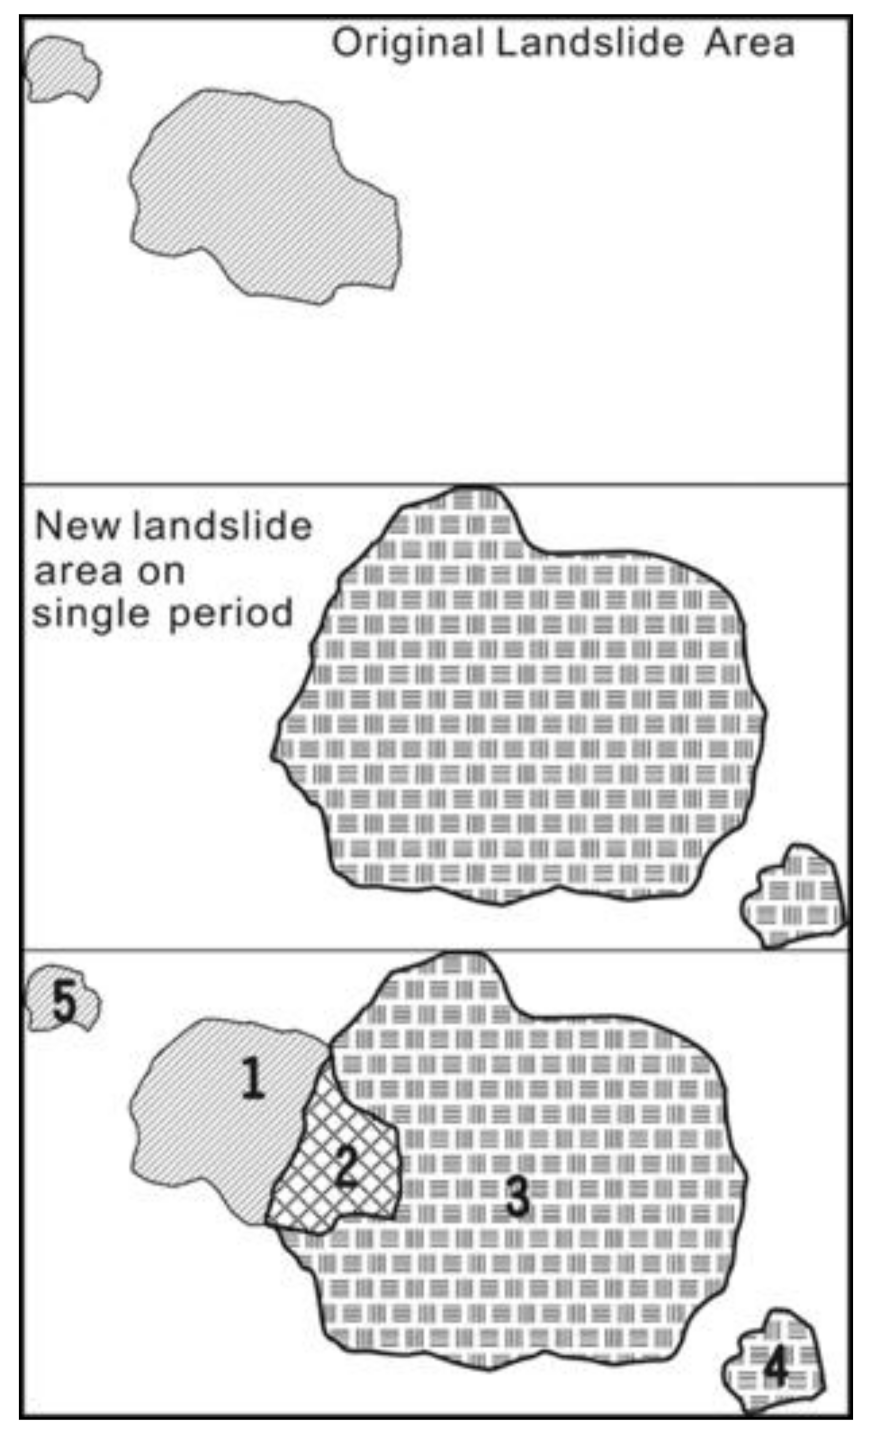
In the database, the landslide area, especially the incremental landslide area, was considered significant when describing the landslide situation in each target area. Figure 5 illustrates the difference of landslide areas between two periods of SPOT image. The total area, labeled as No. 3 and No. 4 in the figure, was treated as the new landslide areas during a single period. The ratios related to landslide areas, i.e., the proportions of No. 1, No. 2, No. 3, No.4, and No. 5 in Figure 5 were calculated for each slope unit after satellite image processing and interpretation. The condition of a slope unit would be classified as landslide when the ratio of incremental landslide area (No. 3 + No. 4) was greater or equal to 5%. The landslide ratios on each period from 2006 to 2016 were estimated and used in the proposed model.
According to the Soil and Water Conservation Bureau (SWCB), Taiwan, a rainfall event starts when the hourly rainfall is greater than 4 mm. The event ends when the accumulated rainfall of continuous 6 h does not exceed 24 mm, and any hourly rain is less than 10 mm during the 6-h period (Figure 6).
The factor, effective accumulated rainfall, Rte, was calculated by the expression as follows.
R t e = R 0 + i = 1 7 0.7 i R i
where the R0 is the current daily rainfall, and Ri represents the daily rainfall i-th day before.
The maximum hourly rainfall, Imax, was used to label the timing of landslides by assuming that the landslide occurred when the hourly precipitation reached Imax. First, for a given rainfall event, each grid’s Imax and Rte were calculated by applying Kriging interpolation based on the data of reference weather stations. Then, the Imax and Rte of a slope unit were determined by averaging the values of grids within the slope unit. Figure 7 shows the processed results of factors in the study areas, and Figure 8 shows an example of the interpolation of rainfall of given rainfall events in 2011.

3. Development of Landslide Potential Evaluation Model

Machine learning, a branch of artificial intelligence (AI), has become popular in various fields. Computer algorithms are necessary and essential in machine learning to robustly analyze and predict information based on learning from training data [22]. Among its applications, the use of machine learning has increased in landslide susceptibility analysis [10]. The methods of artificial neural network (ANN) [26,27], logistic regression [28], support vector machine (SVM) [29], and random forest [11,12] have been popular for landslide-related analysis.
The random forest is a classifier based on the ensemble method and consists of many decision trees. Each tree must meet the basic classification ability and certain accuracy conditions. The built-in classifier performance will eventually be better than the result predicted by a single classifier. The random forest will randomly take the data for training, and the output will be based on the voting in each decision tree. At present, random forests are also widely used due to the advantages of accurate classification, the capability of large amounts of data processing, multi-variable data, and fast calculations.
In the analysis of landslide prediction, rainfalls and landslides in the past years may cause the current site condition to be unstable in the investigated areas. Therefore, the impacts of temporal characteristics should be taken into account in the analysis. Thus, the antecedent rainfalls and landslides were used as the temporal characteristics in the proposed random forest model. The data of the past five years were considered to represent the previous environmental impacts related to current landslide conditions.
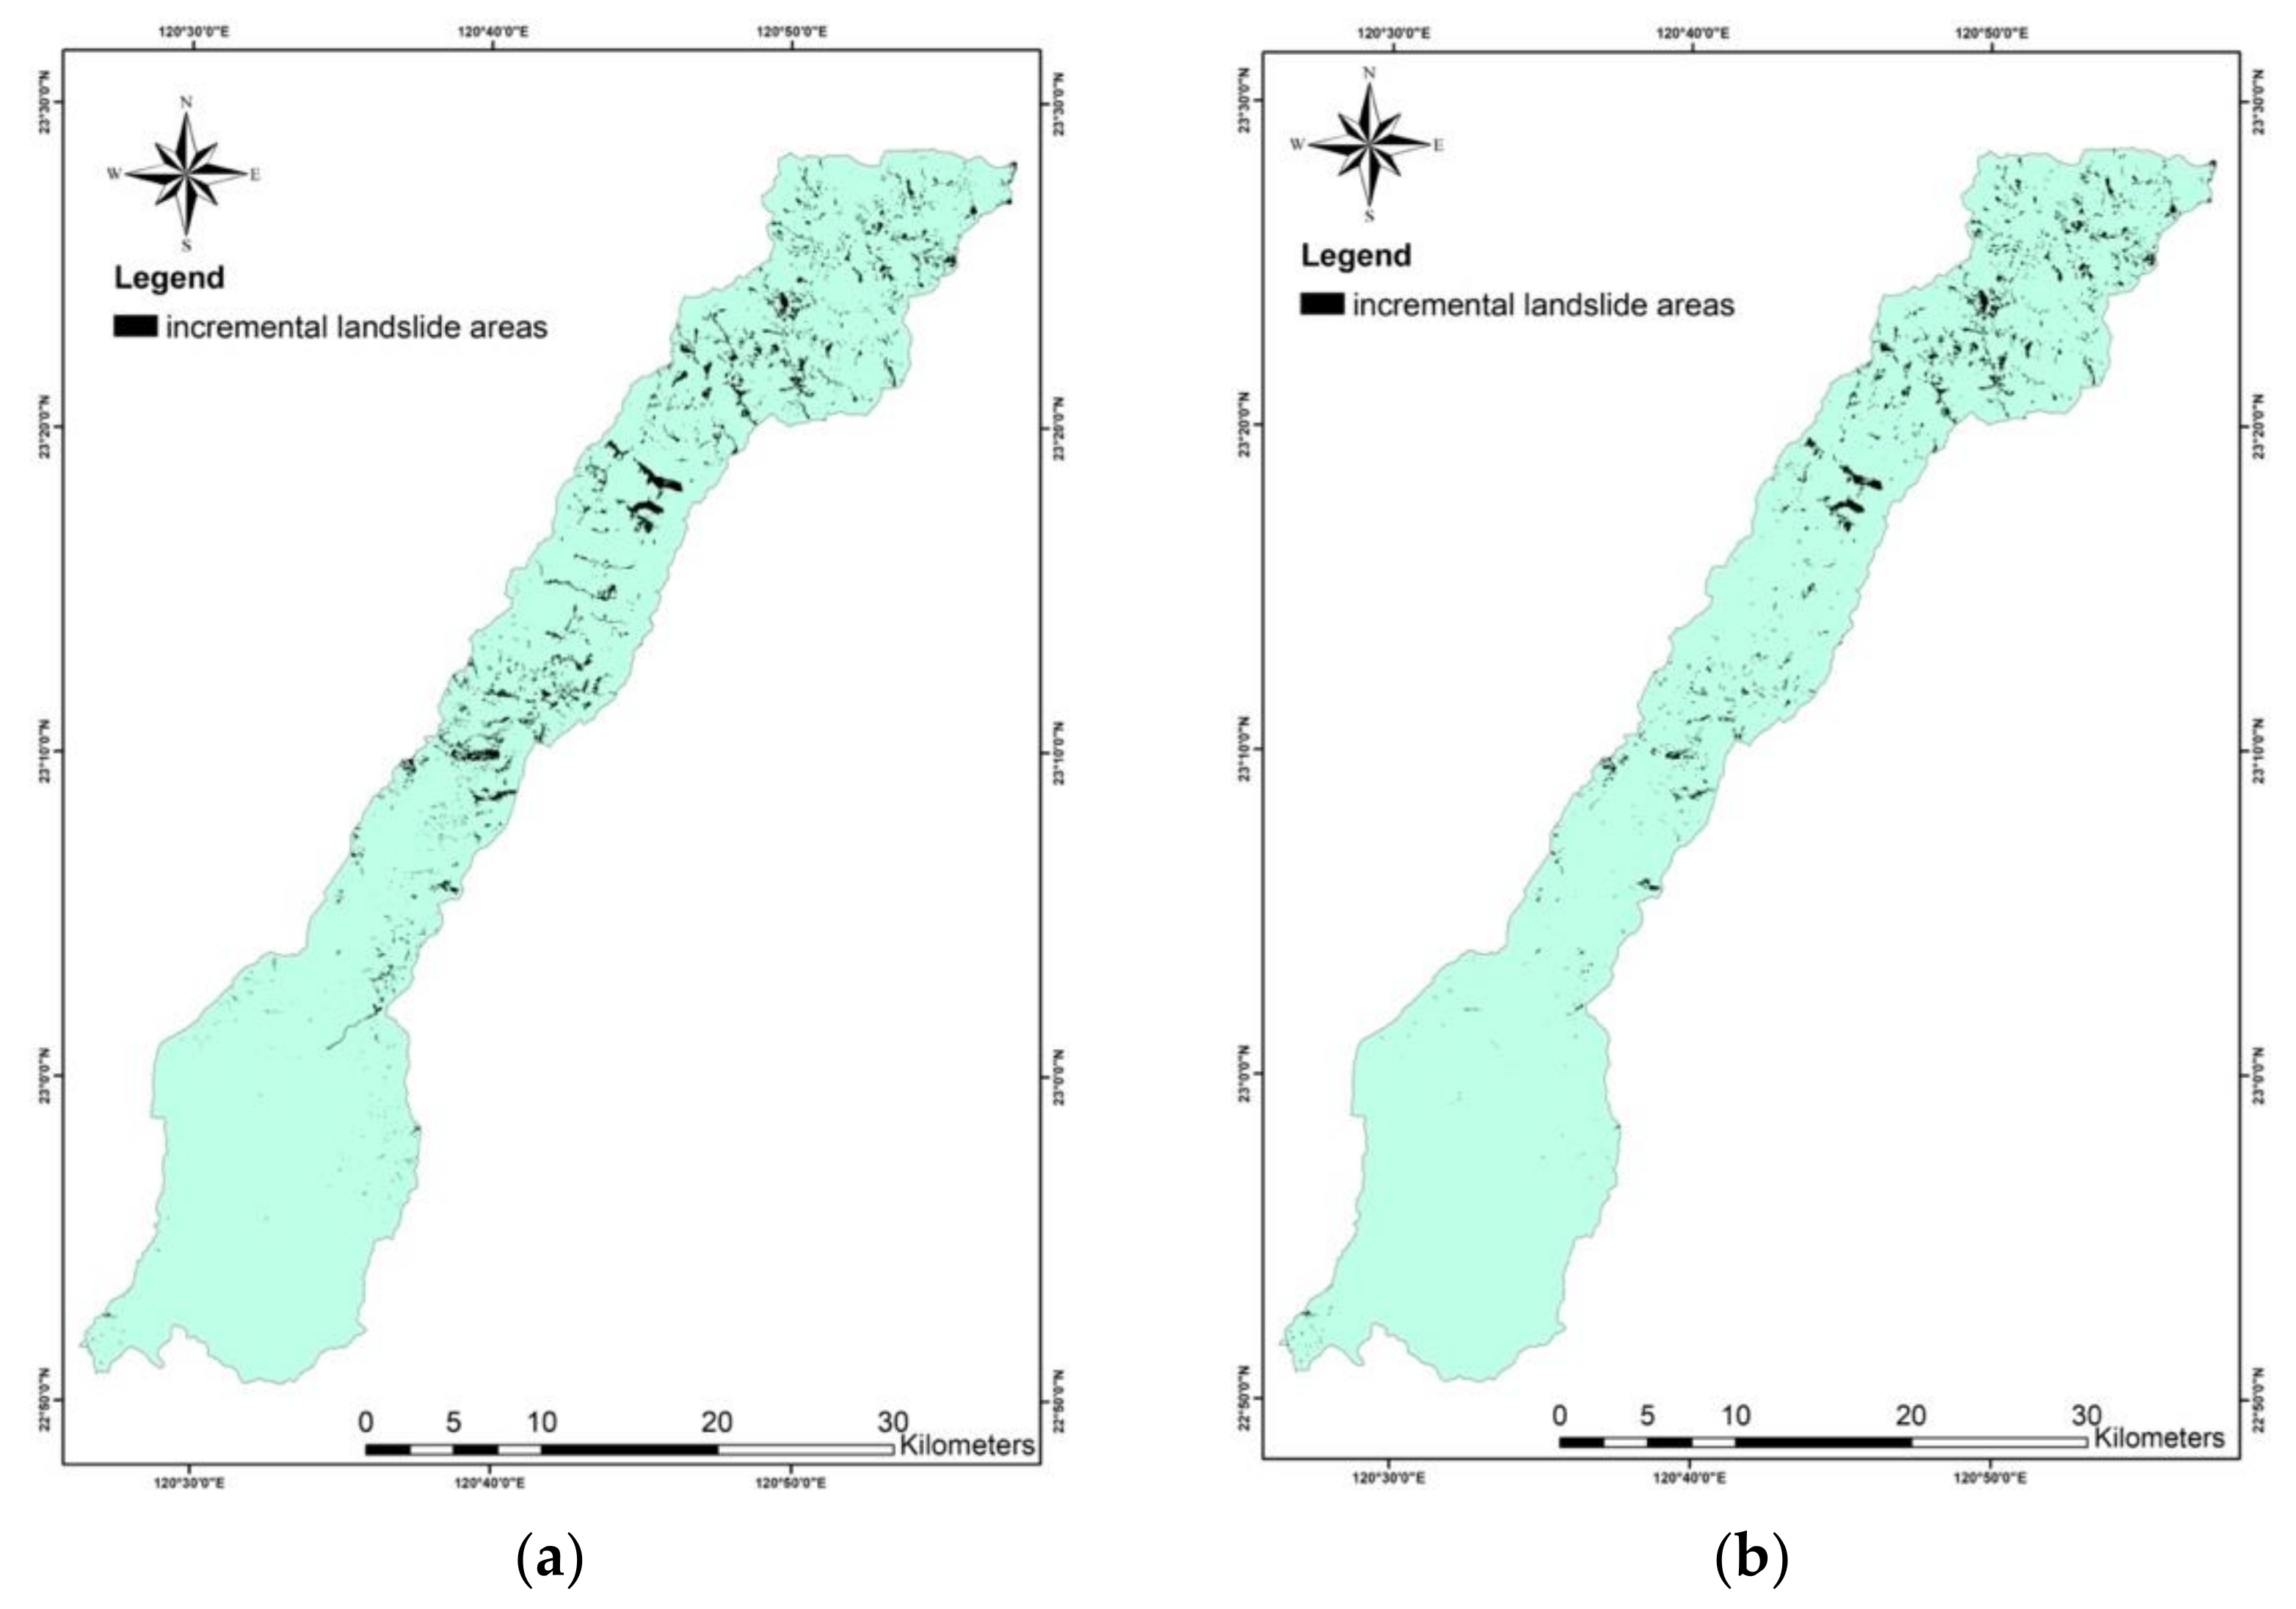
In addition to the six environmental factors of elevation, slope, slope aspects, geology type, distance to the river, and NDVI, the temporal factors of annual landslide areas in the past five years were also considered. Therefore, these temporal factors were included in the model in annual area ratios of five-type landslides (Figure 5) in a slope unit. Furthermore, the triggering factors of annual Imax and annual Rte of a slope unit in the past five years were also treated as temporal characteristics in the model. Therefore, there was a total of 43 factors (6 environmental factors, 25 annual landslide area ratios in the past five years, ten annual factors of Imax and Rte in the past five years, and current yearly Imax and Rte) in the model database. The examples of annual landslide areas are shown in Figure 9.
The program WEKA (Waikato Environment for Knowledge Analysis) was used to develop the random forest model. The data were processed by standardization method, Z-Score, and normalization procedure (values of 0 to 1). From a total of 38,915 slope units, 10,000 units were randomly selected for model development, with a landslide to a non-landslide ratio of 1:1. In total, 50% of data were used for training during the development, and the 50% left were used for internal validation. The supervised classification algorithm was applied in training.
Validation indices are usually used to evaluate the performance of a model. In machine learning, the validation indices can be divided into classification metrics and regression metrics. The proposed model was mainly a binary case. Thus, the confusion matrix of classification metrics (Table 3) was used to validate the model performance.
The validation indices from Table 2 include accuracy (ACC), precision, sensitivity (or recall), Kappa (kappa index of agreement, KIA), and receiver operating characteristic curve (ROC) and area under the curve (AUC). These indices were used to validate the performance of the proposed model.
The random forest model was trained using data from 2006 to 2010 to obtain the 5-year temporal factors (rainfall factors of Imax and Rte, and ratios of antecedent landslides) and the data from 2011 as the input to represent the current state. After establishing the RF model, the landslide area data from 2012 to 2016 and the annual Imax and Rte were used as the external validation to analyze the model performance of prediction. In addition to the confirmation of the 43-factor model, the version of the model using only eight factors (elevation, slope, slope aspects, geology type, distance to river, and NDVI, and Imax and Rte) in 2011, i.e., without factors of antecedent landslide ratios, was also evaluated. The training and validation results were represented by the indices of the confusion matrix, as shown in Table 4. The examples of training and validation results are shown in Figure 10 and Figure 11.
From Table 4, the analysis showed that the accuracy and sensitivity (recall) of the RF model had been greatly improved after adding factors of antecedent landslide ratios, which indicated a noticeable improvement in the model’s capability of classification. Although the overall ACC of the model was improved due to a large amount of TN, the lower missing rate, i.e., 1-recall, from the RF model, was critical to denote more landslide samples. The Kappa value showed fair to good accuracy [30], within an acceptable range (0.4~0.74).
It was also noted that the precision values from 2012 to 2014 were at the same level of around 80% as 2011, and the precision from 2015 and 2016 was slightly lower than the level of the trained model. The precision variation from the tests had indicated that the proposed RF model was valuable and referential when applied to predict future landslide potential without re-training the RF model. However, it was also noted that the model might need to update every three years if precision performance was a concern.
In any subsequent year (2012 to 2016), the AUC value of the temporal-factor-added RF model was higher than that of the model that did not include factors of antecedent landslide ratios. The validation results show that the RF model with temporal characteristics had better performance than the model without those temporal factors.

4. Model Performance Evaluation for Individual Rainfall Events

Instead of using annual Imax and Rte for analysis, the selected rainfall events in 2017 (Table 5) were used to test the model’s ability of landslide potential prediction if only short-period data were available. The test results would help to understand the capability of the RF model in practical applications during disaster response operations.
Based on the data from the 73 rainfall stations surrounding the study area, the Imax and Rte of each event (Table 5) were determined and inputted into the model as the factors of current annual rainfall indices. The in-situ rainfall conditions, I and R, disaster overview, and disaster scale were available from the disaster case reports, as shown in Table 5. The proposed RF model obtained the predicted landslide areas using events’ rainfall conditions, and the result of the ChenYuLan River watershed was shown in Figure 12. The local government reported the landslide disasters, and three locations were in the study areas. Figure 13 shows the predicted landslide locations and observed ones from the disaster reports of events. It is noted that the reported three locations of landslides are not precisely at the expected locations by the proposed RF model. The model did not capture the two landslide locations at the northern ChenYuLan River watershed. However, the third landslide location at Tongfu Village was close to the predicted area by the model. The results imply that the “hit rate” of the RF model might not perform well when targeting event-based predictions. A rational inference was that the rainfall conditions used in the model input were different from the actual local rainfall conditions since the maximum rainfall intensity was determined from the surrounding rainfall stations, which might not be suitable to represent the local conditions. Another possible explanation of the model’s miss-hit was the lack of past five years’ data of landslides at the two northern locations in the ChenYuLan River watershed. Nevertheless, the proposed RF model had a promising performance for landslide potential evaluation when applied to rainfall events.

5. Conclusions

Based on the analysis results from the study, the importance of antecedent landslide areas in the past five years has been emphasized and discussed. Furthermore, the performance of the proposed RF model was also highlighted by conducting annual validation from 2011 to 2016. As a result, the following conclusions were derived.
  • According to the analysis results, adding temporal characteristics had significantly improved the performance of landslide potential prediction by the proposed random forest model.
  • The contribution of antecedent landslide ratios was significant in improving the model performance. The performance improvement of the model indicated that the time-dependent factors should be taken into consideration, in terms of a series of inputs within a period, such as the five years in this study.
  • The results of better model performance had shown the significance of cumulative change with time. Therefore, a relevant factor, e.g., the antecedent landslide ratios of the past five years, to describe the time effects was significant in landslide potential evaluation.
  • The trained model by considering annual temporal factors provided an angle to estimate the landslide potential in event-type disaster responses.

Author Contributions

Conceptualization, Y.-M.H.; methodology, Y.-M.H.; software, S.-W.L.; validation, Y.-M.H. and S.-W.L.; formal analysis, Y.-M.H. and S.-W.L.; investigation, Y.-M.H.; resources, Y.-M.H.; data curation, Y.-M.H. and S.-W.L.; writing—original draft preparation, Y.-M.H.; writing—review and editing, Y.-M.H.; visualization, Y.-M.H. and S.-W.L.; supervision, Y.-M.H. Huang; project administration, Y.-M.H.; funding acquisition, Y.-M.H. All authors have read and agreed to the published version of the manuscript.

Funding

This research was funded by Soil and Water Conservation Bureau, Council of Agriculture, Executive Yuan, Taiwan, grant number 109AS-10.7.1-SB-S3.

Institutional Review Board Statement

Not applicable.

Informed Consent Statement

Not applicable.

Data Availability Statement

No new data were created or analyzed in this study. Data sharing is not applicable to this article.

Acknowledgments

The authors would like to express their gratitude to research assistant Hsin-Ping Wang, for technical support in generating figures and GIS operations. Authors would also like to thank the editor and anonymous reviewers for the careful review of the original manuscript.

Conflicts of Interest

The authors declare no conflict of interest. The funders had no role in the design of the study; in the collection, analyses, or interpretation of data; in the writing of the manuscript, or in the decision to publish the results.

References

  1. Lei, T.C.; Huang, Y.M.; Lee, B.J.; Hsieh, M.H.; Lin, K.T. Development of an empirical model for rainfall-induced hillside vulnerability assessment: A case study on Chen-Yu-Lan watershed, Nantou, Taiwan. Nat. Hazards 2014, 74, 341–373. [Google Scholar] [CrossRef]
  2. Huang, Y.M.; Lei, T.C.; Lee, B.J.; Hsieh, M.H. Landslide Potential Evaluation Using Fragility Curve Model. In Landslides—Investigation and Monitoring, 1st ed.; Ray, R., Lazzari, M., Eds.; IntechOpen: London, UK, 2019. [Google Scholar] [CrossRef] [Green Version]
  3. Chang, F.J.; Lee, S.P. A study of the intelligent control theory for the debris flow warning system. In Proceedings of the First International Conference on Debris Flow Hazards Mitigation, San Francisco, CA, USA, 7–9 August; Philip Chen, C.L., Ed.; American Society of Civil Engineers: Reston, VA, USA, 1997; pp. 109–123. [Google Scholar]
  4. Lee, C.T.; Cheng, C.T.; Liao, C.W.; Tsai, Y.B. Site classification of Taiwan free-field strong-motion stations. Bull. Seismol. Soc. Am. 2001, 91, 1283–1297. [Google Scholar]
  5. Lee, S.; Choi, J. Landslide susceptibility mapping using GIS and the weight-of-evidence model. Int. J. Geogr. Inf. Sci. 2004, 18, 789–814. [Google Scholar]
  6. Ermini, L.; Catani, F.; Casagli, N. Artificial neural networks applied to landslide susceptibility assessment. Geomorphology 2005, 66, 327–343. [Google Scholar]
  7. Wang, H.B.; Sassa, K. Rainfall-induced landslide hazard assessment using artificial neural networks. Earth Surf. Proc. Land. 2006, 31, 235–247. [Google Scholar]
  8. Tan, L.; Guo, J.; Mohanarajah, S.; Zhou, K. Can we detect trends in natural disaster management with artificial intelligence? A review of modeling practices. Nat. Hazards 2021, 107, 2389–2417. [Google Scholar] [CrossRef]
  9. Dikshit, A.; Sarkar, R.; Pradhan, B.; Segoni, S.; Alamri, A.M. Rainfall Induced Landslide Studies in Indian Himalayan Region: A Critical Review. Appl. Sci. 2020, 10, 2466. [Google Scholar]
  10. Park, S.; Kim, J. Landslide Susceptibility Mapping Based on Random Forest and Boosted Regression Tree Models, and a Comparison of Their Performance. Appl. Sci. 2019, 9, 942. [Google Scholar] [CrossRef] [Green Version]
  11. Pourghasemi, H.R.; Kerle, N. Random forests and evidential belief function-based landslide susceptibility assessment in Western Mazandaran Province, Iran. Environ. Earth Sci. 2016, 75, 1–17. [Google Scholar]
  12. Youssef, A.M.; Pourghasemi, H.R.; Pourtaghi, Z.S.; Al-Katheeri, M.M. Landslide susceptibility mapping using random forest, boosted regression tree, classification and regression tree, and general linear models and comparison of their performance at Wadi Tayyah Basin, Asir Region, Saudi Arabia. Landslides 2015, 13, 1–18. [Google Scholar]
  13. Di Napoli, M.; Carotenuto, F.; Cevasco, A.; Confuorto, P.; Di Martire, D.; Firpo, M.; Pepe, G.; Raso, E.; Calcaterra, D. Machine learning ensemble modelling as a tool to improve landslide susceptibility mapping reliability. Landslides 2020, 17, 1897–1914. [Google Scholar] [CrossRef]
  14. Catani, F.; Lagomarsino, D.; Segoni, S.; Tofani, V. Landslide susceptibility estimation by random forests technique: Sensitivity and scaling issues. Nat. Hazards Earth Syst. Sci. 2013, 13, 2815–2831. [Google Scholar] [CrossRef] [Green Version]
  15. Chen, W.; Xie, X.; Wang, J.; Pradhan, B.; Hong, H.; Bui, D.T.; Duan, Z.; Ma, J. A comparative study of logistic model tree, random forest, and classification and regression tree models for spatial prediction of landslide susceptibility. CATENA 2017, 151, 147–160. [Google Scholar]
  16. Crichton, D. The risk triangle. In Natural Disaster Management; Ingleton, J., Ed.; Tudor Rose: London, UK, 1999; pp. 102–103. [Google Scholar]
  17. Lee, C.Y.; Lee, B.J.; Huang, Y.M.; Lei, T.C.; Hsieh, M.H.; Wang, H.P.; Fang, Y.M.; Yin, H.Y. Risk Assessment of Landslide by using Fragility Curves—A Case Study in Shenmu, Taiwan. In Geotechnical Hazard Mitigations: Experiment, Theory and Practice, Proceedings of the 5th International Conference on Geotechnical Engineering for Disaster Mitigation and Rehabilitation; Taipei, Taiwan, 13–14 September 2017, Lin, M.L., Ed.; Chinese Taipei Geotechnical Society and Ainosco Press Taiwan: Taipei, Taiwan, 2017; pp. 137–148. [Google Scholar] [CrossRef]
  18. Segoni, S.; Piciullo, L.; Gariano, S.L. A review of the recent literature on rainfall thresholds for landslide occurrence. Landslides 2018, 15, 1483–1501. [Google Scholar]
  19. Gariano, S.L.; Melillo, M.; Peruccacci, S.; Brunetti, M.T. How much does the rainfall temporal resolution affect rainfall thresholds for landslide triggering? Nat. Hazards 2020, 100, 655–670. [Google Scholar]
  20. Fookes, P.G.; Sweeney, M.; Manby, C.N.D.; Martin, R.P. Geological and Geotechnical Engineering Aspects of Low-cost Roads in Mountainous Terrain. Eng. Geol. 1985, 21, 1–152. [Google Scholar]
  21. Koukis, G.; Ziourkas, C. Slope Instability Phenomena in Greece: A Statistical Analysis. Bull. Int. Assoc. Eng. Geol. 1991, 43, 47–60. [Google Scholar]
  22. Xie, M.; Esaki, T.; Zhou, G. GIS-based probabilistic mapping of landslide hazard using a three-dimensional deterministic model. Nat. Hazards 2004, 33, 265–282. [Google Scholar] [CrossRef]
  23. Pradhan, B.; Lee, S. Delineation of landslide hazard areas on Penang Island, Malaysia, by using frequency ratio, logistic regression, and artificial neural network models. Environ. Erath Sci. 2009, 60, 1037–1054. [Google Scholar]
  24. Lei, T.C.; Wan, S.; Chou, T.Y.; Pai, H.C. The knowledge expression on debris flow potential analysis through PCA + LDA and rough sets theory: A case study of Chen-Yu-Lan Watershed, Nantou, Taiwan. Environ. Earth Sci. 2011, 63, 981–997. [Google Scholar]
  25. Wan, S.; Lei, T.C.; Chou, T.Y. A landslide expert system: Image classification through integration of data mining approaches for multi-category analysis. Int. J. Geogr. Inf. Sci. 2012, 26, 747–770. [Google Scholar]
  26. Gomez, H.; Kavzoglu, T. Assessment of shallow landslide susceptibility using artificial neural networks in Jabonosa River Basin, Venezuela. Eng. Geol. 2005, 78, 11–27. [Google Scholar]
  27. Nefeslioglu, H.A.; Gokceoglu, C.; Sonmez, H. An assessment on the use of logistic regression and artificial neural networks with different sampling strategies for the preparation of landslide susceptibility maps. Eng. Geol. 2008, 97, 171–191. [Google Scholar]
  28. Shahabi, H.; Hashim, M.; Ahmad, B.B. Remote sensing and GIS-based landslide susceptibility mapping using frequency ratio, logistic regression, and fuzzy logic methods at the central Zab basin, Iran. Environ. Earth Sci. 2015, 73, 8647–8668. [Google Scholar]
  29. Kavzoglu, T.; Sahin, E.K.; Colkesen, I. An assessment of multivariate and bivariate approaches in landslide susceptibility mapping: A case study of Duzkoy district. Nat. Hazards 2015, 76, 471–496. [Google Scholar]
  30. Fleiss, J.L.; Levin, B.; Paik, M.C. Statistical Methods for Rates and Proportions, 3rd ed.; Wiley-Interscience: Hoboken, NJ, USA, 2003. [Google Scholar]
  31. Debris Flow Disaster Prevention Information: Major Disaster Events. Available online: https://246.swcb.gov.tw/Achievement/MajorDisasters (accessed on 21 July 2021).
  32. Global Disaster Event Book. Available online: https://den.ncdr.nat.gov.tw/ (accessed on 21 July 2021). (In Chinese)
Figure 1. Watersheds of ChenYuLan River, Laonong River, and Qishan River in Taiwan.
Water 13 03348 g001
Figure 2. Satellite images of the ChenYuLan River watershed in (a) 2011, (b) 2016.
Water 13 03348 g002
Figure 3. Slope unit delineation, the (a) and (b) slope units of a watershed.
Water 13 03348 g003
Figure 4. The slope units of watersheds (a) ChenYuLan River, (b) Laonong River, (c) Qishan River.
Water 13 03348 g004
Figure 5. Illustration of landslide area between two periods of a satellite image.
Water 13 03348 g005
Figure 6. The definition of a rainfall event and rainfall factors.
Water 13 03348 g006
Figure 7. The factors of (a) elevation; (b) slope; (c) slope aspects; (d) geology type; (e) NDVI (2011) of study areas.
Water 13 03348 g007
Figure 8. Examples of Imax and Rte in the study area in 2011. From left to right are events of 0719 Heavy Rainfall, Typhoon Nanmadol, and 1001 Heavy Rainfall.
Water 13 03348 g008
Figure 9. Annual incremental landslide areas of the Qishan River Watershed in (a) 2011 and (b) 2016.
Water 13 03348 g009
Figure 10. The results of model training and validations of Laonong River watershed (a) 2011; (b) 2012; (c) 2014; (d) 2016.
Water 13 03348 g010
Figure 11. The comparison of model training between 43 and 8 factors using 2011 database of the Qishan River watershed.
Water 13 03348 g011
Figure 12. The predicted landslide areas of ChenYuLan River watershed: (a) 0601 Heavy Rainfall; (b) Typhoons Nesat and Haitang in 2017.
Water 13 03348 g012
Figure 13. The predicted and observed landslide locations of events in 2017.
Water 13 03348 g013
Table 1. Environmental database of factors.
TypeSourceFactorsData Format
GridDEMElevation
Slope (degree)
Aspect
Raster, 5 m
SPOT satellite imagesNDVI (from 2011 to 2016)Raster, 20 m
RainfallMaximum hourly rainfall (Imax) of events from 2006 to 2016
Effective accumulated rainfall (Rte) of events from 2006 to 2016
Raster, 20 m
VectorRiver systemRiver system
Distance to river (stream)
Shapefile, Polygon
Geology MapGeology type
Landslide 1Incremental landslide areas, from 2011 to 2016
1 the source of satellite images was from Taiwan’s government open data platform (https://data.gov.tw accessed on: 27 August 2021).
Table 2. Statistical information of database.
WatershedsYearImax (mm)
(Mean, SD)
Rte (mm)
(Mean, SD)
NDVI
(Average)
Slope (Degree)
(Average)
Elevation (m)
(Average)
Distance to the River (m)
(Average)
ChenYuLan River2011(46.7, 14.2)(289, 84)0.126133.71591.2287.3
2012(40.1, 9.9)(223, 46)−0.1072
2013(53.2, 23.1)(166, 39)0.0344
2014(21.4, 4.0)(202, 75)0.0497
2015(31.7, 3.5)(139, 28)0.0055
2016(55.4, 6.8)(509, 58)0.0893
Laonong River2011(50.4, 11.8)(509, 152)0.101632.21508.0265
2012(49.5, 10.7)(248, 85)−0.1372
2013(62.9, 18.7)(289, 73)0.0225
2014(41.4, 13.4)(322, 74)−0.0051
2015(53.7, 13.9)(347, 179)0.0235
2016(58.8, 9.8)(421, 161)−0.0010
Qishan River2011(49.8, 12.1)(322, 117)0.095624.7926.8190.6
2012(49.0, 8.2)(187, 58)−0.0376
2013(56.1, 15.1)(311, 130)−0.2053
2014(40.9, 6.9)(278, 74)0.0799
2015(50.3, 9.9)(287, 103)0.0997
2016(64.1, 8.8)(473, 70)−0.0062
Table 3. The confusion matrix of landslide evaluation.
Predicted\ActualLandslide (1)Non-Landslide (0)
Landslide (1)True Positive (TP)False Positive (FP)
Non-Landslide (0)False Positive (FP)True Negative (TN)
Table 4. RF Model training and validation results.
Training/Validation YearAccuracyPrecisionRecallKappaAUC
2011 (model training)0.8080.7910.8330.6160.889
20120.7160.8600.5150.4310.839
20130.7060.8700.4850.4120.844
20140.8390.7730.7080.6220.901
20150.8330.6640.8280.6160.898
20160.8340.6190.8190.5920.897
2011 (8 factors)0.7020.6800.7580.4060.776
Table 5. Selected landslide disaster cases in 2017 [31,32].
EventImax/Rte
(mm) 1
Disaster Location 2Time & DateRainfalls at Occurrence 3Disaster OverviewDisaster ScaleHazard Type
0601 Heavy Rainfall
(2017/06/02 ~ 2017/06/04)
76.7/749.0Shuili Township/Xinshan Village
(X:236472 Y:2628694)
8:00 on 3 JuneI = 43 mm/h
R = 270 mm
(Rainfall Sta.: XiLuan 01H47)
During the 0601 Heavy Rainfall, the landslide of Renlun Forest Road had caused blockage of about 10 m on Taiwan Provincial Highways 21.The landslide scale was about 20 m in length, 10 m in width, and 2 m in depth. The landslide area was 200 m2, and the amount of debris accumulated was about 400 m3.landslide
Xinyi Township/Mingde Village
(X:235029 Y: 2622652)
15:00 on 3 JuneI = 17 mm/h
R = 430 mm
(Rainfall Sta.: Xinyi C0I080)
During the heavy rainfall, the slopes on both sides of potential debris flow torrent DF187 collapsed. As a result, existing rivers were piled up with soil and rocks, and a large amount of debris could not be discharged in time, resulting in blockage of 87 k~88 k of Taiwan Provincial Highways 21.The landslide was about 10 m long, 5 m wide, 2 m deep and covered an area of 100 m2.
The accumulation of debris was about 600 m3, with the length about 100 m, the width about 3 m, and the depth about 2 m.
landslide
Typhoons Nesat and Haitang62.2/307.8Xinyi Township/Tongfu Village
(X:239004 Y:2607456)
7:50 on 30 JulyI = 0 mm/h
R = 150 mm
(Rainfall Sta.: Heshe C1I070)
During Typhoons Nesat and Haitang, the slope at 115 k+540 of Taiwan Provincial Highways 21 collapsed and caused road blockage.The landslide was about 15 m long, 10 m wide, and 2 m deep. The area of soil and debris was 150 m2, and the accumulated earth volume was about 3500 m3.rock-fall, landslide
1 Reference rainfall station: Nan Tian Chih (0601 event); San Di Men (Typh. Nesat and Haitang). 2 at Nantou County, coordinate using TWD97. 3 The recorded rainfalls when the landslide occurred. R: accumulated rainfall; I: hourly rainfall.
Publisher’s Note: MDPI stays neutral with regard to jurisdictional claims in published maps and institutional affiliations.