Article

A New Model Ice for Wave-Ice Interaction

by
Franz von Bock und Polach
1,2,*,
Marco Klein
3 and
Moritz Hartmann
1
1
Ship Structural Design and Analysis, Hamburg University of Technology, 21073 Hamburg, Germany
2
Institut für Meereskunde, Universität Hamburg, 20146 Hamburg, Germany
3
Offshore Dynamics Group, Hamburg University of Technology, 21073 Hamburg, Germany
*
Author to whom correspondence should be addressed.
Water 2021, 13(23), 3397; https://doi.org/10.3390/w13233397
Submission received: 22 October 2021 / Revised: 26 November 2021 / Accepted: 28 November 2021 / Published: 1 December 2021
(This article belongs to the Special Issue The Occurrence, Physics and Impact of Wave–Ice Interaction)

Abstract

:
The interaction of waves and ice is of significant relevance for engineers, oceanographers and climate scientists. In-situ measurements are costly and bear uncertainties due to unknown boundary conditions. Therefore, physical laboratory experiments in ice tanks are an important alternative to validate theories or investigate particular effects of interest. Ice tanks use model ice which has down-scaled sea ice properties. This model ice in ice tanks holds disadvantages due to its low stiffness and non-linear behavior which is not in scale to sea ice, but is of particular relevance in wave-ice interactions. With decreasing stiffness steeper waves are required to reach critical stresses for ice breaking, while the non-linear, respectively non-elastic, deformation behavior is associated with high wave damping. Both are scale effects and do not allow the direct transfer of model scale test results to scenarios with sea ice. Therefore, the alternative modeling approach of Model Ice of Virtual Equivalent Thickness (MIVET) is introduced. Its performance is tested in physical experiments and compared to conventional model ice. The results show that the excessive damping of conventional model ice can be reduced successfully, while the scaling of the wave induced ice break-up still requires research and testing. In conclusion, the results obtained are considered a proof of concept of MIVET for wave-ice interaction problems.

1. Introduction

The interaction of waves and ice is of significance for the forecast of wave propagation through ice and its possible break-up. Consequently, better insights on wave-ice interaction serves oceanographers and climate scientists to increase the predictability of changes in the sea ice coverage and related effects [1,2]. Also safe operations of shipping traffic and fixed structures require reliable prediction of the oceanic conditions and especially the ice conditions as well as the combination of waves and ice [3]. Furthermore, the ice induced attenuation of wave amplitude and wave energy plays a role in coastal protection and near shore sediment transport [4].
The investigation of certain phenomena or the validation of theories and models in wave-ice interaction can be done in refrigerated wave tanks [5]. This however requires an appropriate modeling of the governing properties and parameters. We emphasize here that the focus of this work is the physical modeling of continuous solid level ice sheets and related wave-ice interactions. In order to provide a holistic overview also the effect of broken ice in waves is briefly reviewed to highlight differences to solid level ice sheets.
A continuous level ice sheet can be modeled or represented with a thin elastic plate while broken floes smaller than the wavelength can be represented with the mass loading model and the viscous layer model is suitable for grease ice [6,7,8]. Flexure dominates the interaction between solid ice and waves requiring a well modeled flexural rigidity [9]. Furthermore, Fox [9] stated that the scaling of the characteristic length would allow a flexural response equivalent to field tests. The proposed scaling approach by Fox [9] applies to long waves, with the relationship of the wave number, k , and the wave frequency, ω , being k ω 2 which means no dependency of the ice mass or its thickness on the dispersion relation. For short periods and wavelengths k ω 2 / 5 / h 3 / 5 , while the ice thickness dependency can be added through the flexural rigidity. A dependency on the mass density ρ h is not significant and therefore the impact of the correctly modeled thickness appears small compared to the flexural rigidity [9]. Also in a numerical exercise with zero mass the encountered error is found small [9].
Dispersion relations for waves in level ice do not account for attenuation see e.g., Fox [9] or Liu and Mollo-Christensen [10] (see also Appendix A). In order to account for wave attenuation in the Marginal Ice Zone (MIZ) Kohout and Meylan [11] presented a model based on elastic plates combined with an energy related attenuation obtained from full-scale measurements. Broström and Christensen [12] stated that the propagation of waves in solid ice is subjected to little disturbances meaning that waves can travel over long distances in solid ice. The latter is a possible explanation for observed long period waves induced breakup in significant distances (≈300 km from the ice edge [1]). The observations of Prinsenberg and Petersen [1] refer to dense pack ice. However, it needs to be acknowledged that a solid ice cover is a rather theoretical consideration as irregularities such as open leads or ridges occur over long ranges, but cause relatively small dissipation of wave energy [12]. Independently of the occurrence of the ice additional energy dissipation is caused by viscous energy dissipation at the water-ice interface and irreversible deformation (e.g., creep) of the ice [10,12,13]. The reflection of waves at the ice edge may be another sink of wave energy, but is considered of minor significance when the wavelengths is much greater than the ice thickness [6]. As the latter applies to the work presented in this paper and is therefore not further addressed ( wavelength / ice thickness O ( 2 ) O ( 3 ) ) .
The damping of waves is of little significance, when air represents the upper boundary. However, already the presence of a thin visco-elastic boundary layer on top of the water such as a film of oil enforces the damping of waves [14]. The implication of visco-elasticity is that the wave introduces strain energy into the ice, which is not fully returned as the restoring of the ice is slower than the propagation of the wave. Consequently, wave energy is dissipated leading to wave damping respectively an attenuation of the wave amplitude. If the ice would deform plastically no energy would be returned to the wave attenuation is increased. The application of a visco-elastic layer to model the wave-ice interaction described by Wang and Shen [15] serves the purpose to model the global interaction between ice and waves including the attenuation. This approach models an average behavior, as the model of Wang and Shen [15] embraces the elastic behavior of ice floes larger than the wavelength and the viscous effect originating from frazil or ice floes that are much smaller than the wavelength. In non-scaled experiments [16] with relatively small waves, i.e., an open water amplitude of max 5 mm and a 10 mm thick fresh water ice sheet, it is found that the continuous ice sheet attenuates waves more than broken floes. However, the findings are very limited as ice properties are not scaled and stands against the previously stated low attenuation of waves in solid ice. This however, highlights the importance of conducting scaled experiments to verify such findings.
Squire [6] furthermore reported a number of experiments using other materials than ice with viscous properties. The latter might also be due to a lack of experimental facilities that can combine waves and actual ice as only two large ice tanks have a wave maker, which are Aalto University and the Hamburg Ship Model Basin (HSVA), while the University of Melbourne has a smaller refrigerated wave flume. Despite all experiments conducted have their validity, it is strongly emphasized that only the usage of model ice respectively scaled ice in experiments allows investigating the influence of actual ice specific properties on the waves.
Model ice has been developed in various ice tanks to scale the ice-breaking forces acting on a ships and therewith their resistance in ice [17,18,19]. Consequently, the emphasis is to scale the stresses at failure correctly as those directly reflect the loading required to break the ice. The maintenance of Froude and Cauchy similitude [20] is established as state of the art for the scaling of ice properties for ship-ice interaction with emphesis of ice failing in downward flexure. In order to scale the elastic stiffness it is postulated that the non-dimensional ratio E σ f 2000 [17,21] is maintained in any scale. More recent data available in Timco and Weeks [22] indicate that even values in the range of E σ f 8000 seem realistic.
A detailed investigation of a fine-grained (FG) model ice indicated that the ice holds a significant plastic regime reducing the global stiffness considerably [23,24] and limits therewith the scalability of the ice [25,26]. In von Bock und Polach et al. [27] it is indicated that a highly non-linear deformation behavior of the model ice and its low stiffness seem to be inherent properties of model ice and appear to be independent of crystal structure or added chemicals. In consequence, the target ratio E σ f 2000 is usually not even met for the stiffness in the linear elastic regime 1 (Figure 1) and the average stiffness (regime 3, Figure 1) is even one order of magnitude lower. Regime 2 is the non-linear or plastic part. If the model ice was fully linear elastic regime 1 and 3 would be identical, while regime 2 vanishes. Regime 2 increases with the increase of the difference between regime 1 and regime 3. The relationship of the two slopes of regime 1 and regime 3, the degree of non-linearity or plasticity p r can be determined according to Equation (1) [27].
p r = 1 r e g i m e 3 r e g i m e 1 · 100 % .
The slopes are directly determined from the measured force displacement curves as the determination of the actual stiffness requires detailed a specimen geometry and a model to re-calculate the stiffness. However, both are usually not available in daily ice tank operations and therewith the usage of the force displacement curve is the most practical approach.
Model ice with a compliance much higher than the scaled target value allows more deformation prior to failure which in terms of wave-ice interaction means that a critical wave steepness at ice break-up is not reflected correctly. Voermans et al. [28] defined a non-dimensional ice break-up parameter I b r being a function of elastic strain, relative thickness and wave steepness showing reasonable agreement with full-scale observations. This highlights the significance of the correctly modeled elastic stiffness. The plasticity model ice reduces elastic restoring forces which can lead to significant damping [29] that is not in scale.
A series of wave-ice experiments in model ice was presented in Passerotti et al. [30], where the stiffness respectively the elastic modulus of the waves were around one to two orders of magnitude below target with a significant non-linearity of the model ice being around p r = 80 % . The encountered wave damping was significant resulting in damping of around 50 % after five wave-length. Furthermore, it was found that the frequency dependent exponential attenuation in level model ice is similar to observations in the MIZ [31,32]. However, the attenuation in pack ice or the MIZ is in nature more pronounced than in level ice, which is why broken ice floes are modeled with viscous-elastic models, while level ice is usually represented with elastic models.
As the compiled state of the art reflects, the attenuation of waves under solid ice has not received much attention in comparison to other processes such as the wave ice-floe scattering process in the MIZ [12]. However, it appears established that wave scattering processes lead to an increased wave attenuation in broken ice fields such as the MIZ [31,32], compared to solid level ice. Therefore, the strong attenuation observed in level ice model tests [30] that appears comparable to that in the MIZ [32] is considered a scale effect. This is likely to be triggered by the inherent plasticity or therewith associated properties of the model ice [27]. In consequence, it is deemed necessary to provide an alternative model ice that allows the physical modeling and the investigation of complex wave-ice interaction phenomena as in Hartmann et al. [5].

2. The Governing Parameters in Wave-Ice Interaction

2.1. Critical Stresses Induced by Waves

Ice that is deformed by a wave responds with elastic restoring forces to return to the original equilibrium condition. This deformation causes flexural stresses within the ice sheet. The occurring flexural stress, σ x , in longitudinal direction (x) is defined according to the Kirchhoff-plate theory by Equation (2), with the elastic modulus, E, the Poisson ratio, ν , the distance from the neutral axis, z, and the curvatures, κ , reflected by the second derivatives of the plate deflection, w, with respect to the two coordinate directions.
σ x = E ( 1 ν 2 ) z 2 w x 2 + ν 2 w y 2 κ
For long crested waves, the curvature with respect to the y-coordinate can be neglected, i.e., 2 w / y 2 = 0 , and the curvature is re-defined according to Equation (3).
κ = 2 w ( x ) x 2
In wave-ice interaction, the curvature of the ice sheet is defined by the shape of the wave, ζ , as a function of space, x, and time, t, in dependence of its maximum amplitude, ζ a , the wave number, k, and the angular wave frequency, ω , defined in Equation (4).
ζ ( x , t ) = ζ a sin ( k x ω t )
For simplicity, the elevation of the wave is treated as stationary problem and therefore time independent with t = 0 . During the wave-ice interaction the ice takes the shape of the wave leading to w ( x ) = ζ ( x ) . Consequently, the curvature of the ice plate, κ , in Equation (3) is expressed by using the wave shape at t = 0 from Equation (4). The highest stresses are considered critical which occurs when the sine contribution in Equation (5) equals 1 at k x = π / 2 as in Equation (5).
κ = k 2 ζ a sin ( k x ) with : k x = π / 2 κ = k 2 ζ a
Combining the curvature of the wave shape (Equation (5)) with the plate equation (Equation (2)) provides the relationship between the ice properties and the critical wave steepness, k a , in Equation (6). The critical stress, σ x in Equation (2), causing ice break-up is the flexural strength, σ f , that occurs in the outer fiber of the ice at z = h / 2 , with h being the ice thickness.
Equation (6) represents the critical wave steepness, k a , containing the critical strain as the reverse ratio of E σ f , and reflects the significance of the ice stiffness for wave induced break-up. A similar procedure is used by Dumont et al. [33] to determine the floe size caused by wave induced break up of level ice.
k a = σ f E 2 ( 1 ν 2 ) h k

2.2. Scaling

As a reminder, the presented scaling approach aims towards the physical modeling of the wave propagation through level ice with low damping as well as wave-induced break-up of level ice. This section develops non-dimensional scaling numbers relevant for wave-ice interaction. As these are dimensionless their values in full scale and model scale need to be identical. Consequently, these dimensionless numbers serve two purposes: first they allow formulating target values for parameters contained in the dimensionless numbers and secondly they allow assessing the quality of the produced model ice sheet.
It is identified that the elasticity respectively the stiffness plays an eminent role for the propagation of waves in ice. Therefore, regarding the ice properties and the definition of the ice properties the Ice Stiffness Number, I s n , is defined as non-dimensional parameter by applying the Buckingham- Π Theorem [34]. The parameter is considered as a function of the elastic modulus, E, the gravitational acceleration, g, the ice density, ρ and the ice thickness, h. According to the Buckingham- Π Theorem, the properties can be reflected by one dimensionless parameter and I s n is defined in Equation (7).
I s n = E ρ g h
I s n represents an equivalent to the ratio of the characteristic length and the ice thickness [35]. The characteristic length is also proposed by Fox [9] as parameter to be scaled. However, the interpretation of the characteristic length seems to vary in literature and furthermore it contains the plate stiffness modulus, which requires the Poisson’s ratio of the ice. The numerical value of the latter still requires clarity [22] and therefore I s n is considered to be more straight forward for experimental applications.
With respect to the break-up of ice due to waves, the maximum sustainable flexural stress, the flexural strength, σ f , plays a significant role. With respect to earlier work [17,20,21], it is emphasized to maintain the inverse critical strain (Equation (8)) for which a value greater 2000 is proposed. The numerical value of this ratio may however be replaced by a more appropriate value if applicable.
E σ f 2000
Regarding the wave induced break-up, Voermans et al. [28] introduced the parameter, I b r , (Equation (9)) for a linear elastic problem with the wavelength, λ . On the basis of a comparison with full-scale data a critical value of I b r 0.014 is proposed.
I b r = ζ a h E σ f λ 2
The scaling of wave related problems requires also the maintenance of the long established Froude similitude which is the ratio of inertia and gravity forces [36]. The latter is especially important for the scaling of time as this information cannot be derived from the earlier proposed relationships in Equations (7)–(9).

2.3. Additional Scaling and Virtual Thickness

The basis of this consideration is the actual behavior of model ice meaning its non-linear behavior in bending [27]. This behavior is not intended, but inherent due to physical constrains in the production process.
On the basis of geometrical scaling while maintaining the non-dimensional numbers stated above it is proposed to produce thinner, but stronger ice. In the production process of conventional model ice significant tempering is applied to reduce its strength. It is considered that this process contributes significantly to the non-linear behavior. An increase in flexural strength also increases the elastic modulus. The strength of ice can be increased by additional refrigeration which reduces the size of brine pockets or in case of other model ice the size of chemical liquid pockets. This reduction consequently allows an increase and strengthening of freeze bonds within the ice. This effect is seen in the compiled regression formulas for various strength parameters and the elastic modulus of sea ice [22,37].
In von Bock und Polach [24] it was shown that the top layer of conventional model ice, where the thickness is geometrically scaled, carries most of the strength. The presumed cause is that thicker ice has an even stronger and thicker top-layer which contain limited instituted liquid voids due to the small thermal insulation as low ice layers [29]. This top layer is the main modeling objective as the contribution to strength or elasticity of the lower layers is relatively small [24], but its exact contribution requires a significant effort which is not practical [23,24,38]. The approach of generating a Model Ice of Virtual Equivalent Thickness, MIVET, is the modeling of thin strong ice with a high elastic modulus that satisfies I s n in Equation (7). In order to ensure that the thinner MIVET model ice breaks at the same external load as the commonly scaled model ice [39] requires the scaling of the critical bending moment, M b . The latter is based on the cantilever beam tests for determining the flexural strength, σ f , as this is the practical instance to be tested (Equation (10)), with the cantilever beam width, b, and the ice thickness, h.
σ f = 6 M b b h 2
In order to maintain M b , when the thickness of MIVET is altered by the factor a, h M I V E T = h / a , the measured strength of the ice is to be increased by the square of factor a, as shown in Equation (11).
σ f · a 2 = 6 M b b h M I V E T 2
Apart from the altercation in Equation (11) geometric modeling is maintained. The reduction of thickness is directly affecting the mass of the ice which is not scaled correctly anymore. However, it is shown in Fox [9] that even with a mass equal zero the encountered error is small for waves propagating in solid ice sheet. It needs to be emphasized again that the proposed scaling approach of MIVET is valid for waves propagating in solid ice sheets following the idea of case based scaling [29] and is not considered as universally applicable approach.

3. Experiments

The experiments are conducted at the large ice tank of the Hamburg Ship Model Basin (HSVA). The experiments consisted of two series, whereas series 1000 (S1000) used conventional model ice [19] and series 2000 (S2000) a model ice that is close towards the proposed modeling approach. It must be acknowledged that production of conventional model ice required a significant amount of development and testing over decades. A similar learning was not available for S2000 and hence its properties were not entirely as desired, i.e., thin and no plasticity, but nevertheless significantly improved compared to S1000.

3.1. Model Ice Production and Properties

The initial steps of the ice sheet production is identical for both ice sheets. A fine water fog acts as seed for crystals from which small crystals grew into the water. In the process small air bubbles have been added from the bottom to become part of the ice matrix. In S2000 the freezing and growth phase is stopped earlier as the target thickness was 5 mm–7 mm instead of 24 mm in S1000. In S1000, the flexural strength is adjusted by tempering to a common value of σ f 40 kPa . The objective is not to scale a certain full-scale scenario, but to compare the performance of conventional model ice with the new MIVET ice. However, for reference the flexural strength of sea ice is around 600 kPa leading to a scaling factor of λ = 15 and a corresponding ice thickness in full scale of around 40 cm reflecting first year ice properties. Figure 2 shows the temperature history of the production of both ice sheets. The process starts with seeding followed by strong cooling to grow the ice. Both phases are in case of MIVET significantly shorter and also the temperature during the tempering phase is much lower. The tempering phase weakens the ice to adjust the strength to target values. The latter is not intended for MIVET, where the objective was to make the ice as hard and stiff as possible and to reduce plasticity. However, the temperature needs to be risen to prevent further ice growth which did not fully succeed as some growth after cooling is encountered. The temperature histories are aligned at the beginning to the experiments (Figure 2) to visually distinguish the differences between both. The temperature in the tank is stratified and therewith the temperature measurements provide only a relative comparison as the temperature on ice sheet level is lower.
The flexural strength is determined according to the procedures of the International Towing Tank Conference (ITTC) [39]. Figure 3 and Figure 4 show a representative flexural strength measurement of both series. The plotted line S 1 reflects the assumed linear elastic domain and S 3 the global reference stiffness corresponding to the illustration in Figure 1.
The stiffness and corresponding strength values found in Table 1 are determined with a linear elastic finite element model as the analytical model of a clamped cantilever beam discards the deflection of the adjacent ice sheet (Figure 5) which can introduce a significant error in the elastic modulus calculation. For this reason models including the adjacent ice sheet have already been used before [24,25].
The geometry of the finite element model accounts for the adjacent ice sheet as displayed in Figure 6. The finite element model consists of 8-node solids with 4 mm edge length which refers to a converged mesh refinement. The model includes the root radius and the intact ice sheet behind the cantilever beam to represent the experimental setting adequately (see also [24,25]). The boundary conditions at the bottom are represented by non-linear springs that apply a linear buoyancy force until the top side of the beam is submerged at which point the buoyancy force stops increasing. The mesh is not refined at the corner-radii, at the transition between beam and ice sheet (Figure 6), and therefore the maximum stresses contain limited information.
Table 1 displays the properties of the two generated ice sheets. A comparison of the determined properties of MIVET (S2000) with target values reveals that those properties are not fully met.
The ice properties compiled in Table 1 show the desired effect that the non-linearity of the MIVET ice (S2000) is significantly reduced compared to the conventional model ice (S1000) while the stiffness of the MIVET is significantly increased as well as σ 1 (see also Figure 3 and Figure 4).
The density of the model ice in S1000 is 860 kg / m 3 and for MIVET 822 kg / m 3 which is feed into the ice stiffness number in Table 1.

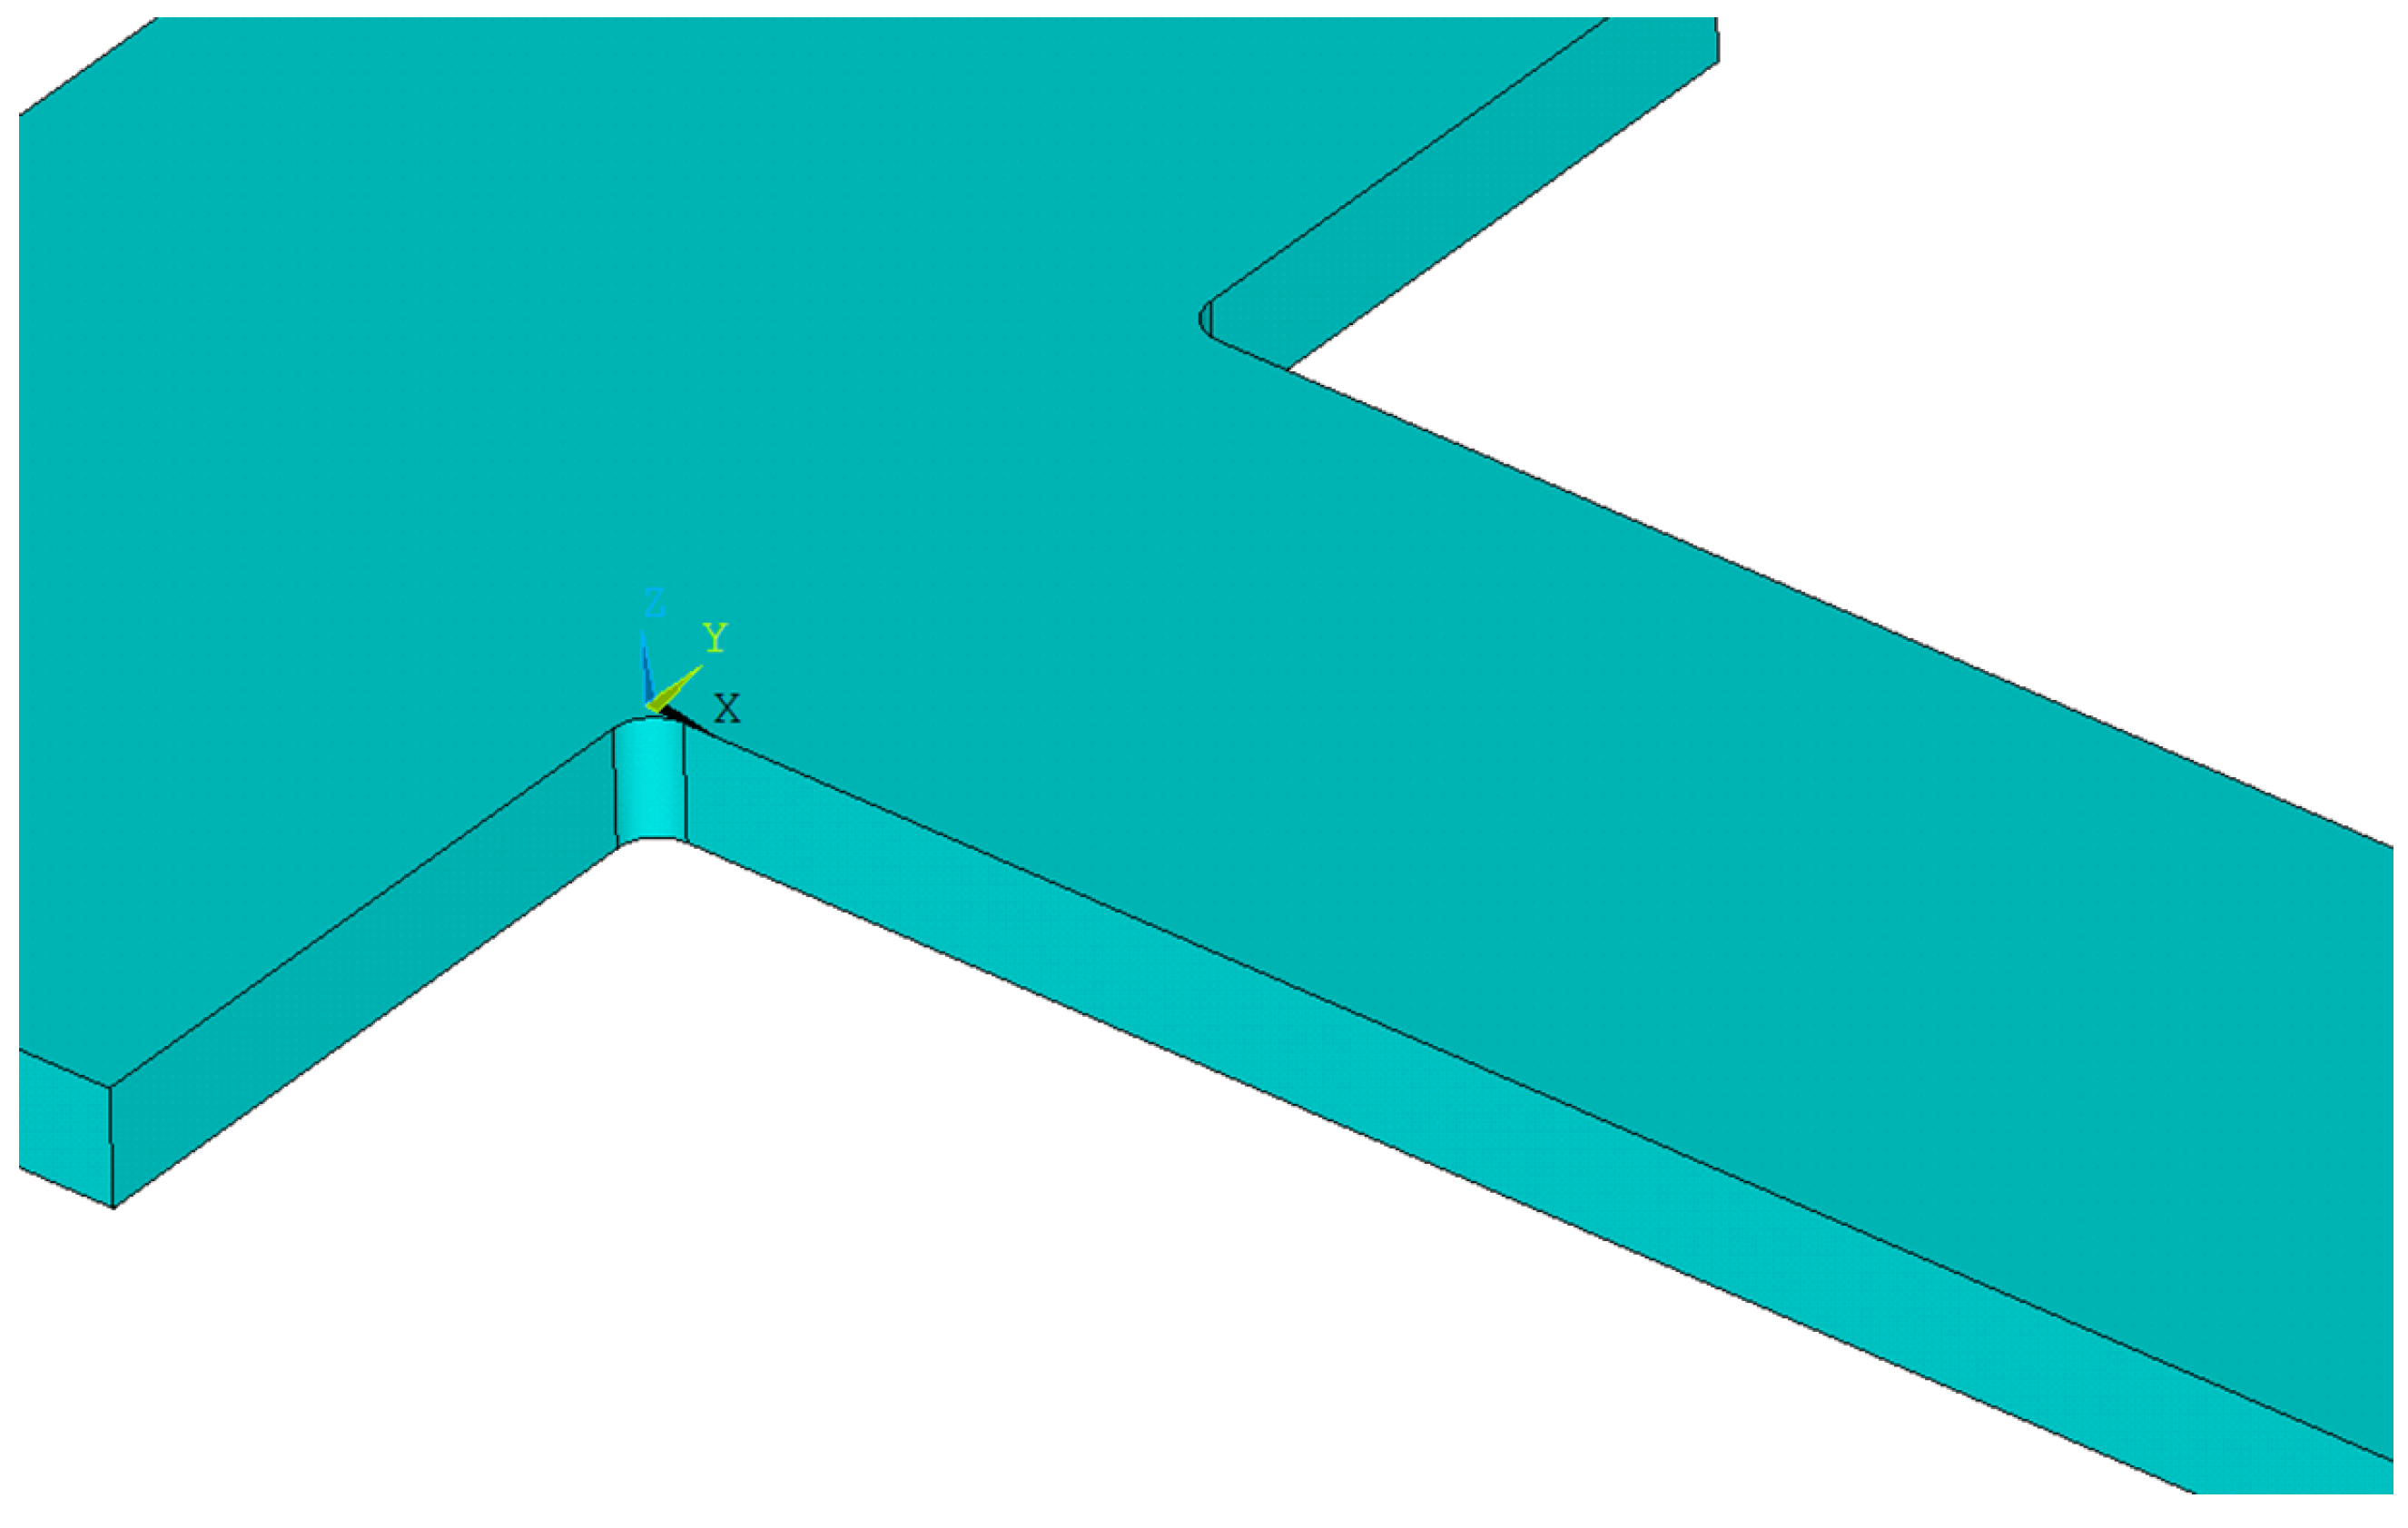
3.2. Set-Up of Wave-Ice Interaction Experiments

Figure 7 presents the schematic side-view of the ice tank set-up for both test campaigns. The ice tank features a length of 78 m , a width of 10 m and the water depth was set to 2.47 m of constant depth. The waves were generated by a fully computer controlled electrically driven flap-type wave generator. The control software of the wave generator enables the generation of regular waves, irregular sea states as well as tailored wave sequences to be defined at the wave board. On the opposite side of the ice tank, a wave absorbing beach is installed consisting of several crossbars with space in between. Nevertheless, the length of the wave signals at the wave generator and the measuring duration as well as the subsequent evaluation, respectively, were selected in such a way that the influence of reflecting waves can be excluded.
The free floating ice sheet was cut free at the tank wall and moved towards the wave board to have only a small open water area of x w = 1.95 m in front of the ice sheet. The length of the ice sheet was x i = 51 m .
In order to detect the vertical displacement of the ice, the set-up consisted of several active as well as passive measuring devices. As active devices, 12 ultrasonic sensors (us) were installed along the tank. Table A1 in Appendix B provides the technical details about the us sensors from Ultralab (eight sensors of type 2001300 and four of type 30250). In addition, 50 passive markers (pm) were placed in the middle of the ice sheet with an equidistant distance of d x = 0.1 m . As pm, spheres with a diameter of 19 mm were used being able to reflect the invisible infrared light. The pm were positioned frozen solid on the ice sheet, so that the pm motion follows the surface elevation of the ice sheet. The established motion capture system Qualisys were used to record the motion of the pm.

3.3. Experimental Program and Generated Waves

For the efficient determination of ice characteristics in terms of wave-ice interaction, the transient wave package (TWP) technique was applied. TWP’s are deterministic wave groups, where both the amplitude spectrum and the associated phases are tailor-made manipulated. One major benefit of TWP’s is the possibility to determine the response amplitude operator (RAO) of a structure in a single test run being well established in ocean engineering e.g., [40,41,42,43,44,45,46]. In the context of wave-ice interaction investigations, RAO denotes the determination of ice characteristics in terms of wave damping between two locations (measuring points) over a wide frequency range. Furthermore, the dispersion relation of the underlying wave components of the TWP are also obtained via one test run over a wide frequency range. Klein et al. [47] have introduced the TWP technique to wave-ice interaction model test. They have shown that TWP’s are not only suitable but very efficient for wave-ice interaction investigations. An overview over the TWP concept used in our experiments is found in Figure 8 and for further reading we refer to Klein et al. [47].
The experimental program comprised the generation of one TWP and regular wave groups of short duration. The TWP parameters were chosen in such a way that a significant ice sheet deflection or even breaking of the ice was excluded and read
ζ m a x = 0.02 m , ω m i n = 2 rad s , ω m a x = 8 rad s and x c p = 70 m .
The investigated regular wave groups (RWG) comprised varying wave periods and wave steepness ϵ = k w ζ a . For this study, only three are relevant, namely those breaking the ice, which are presented in Table 2.

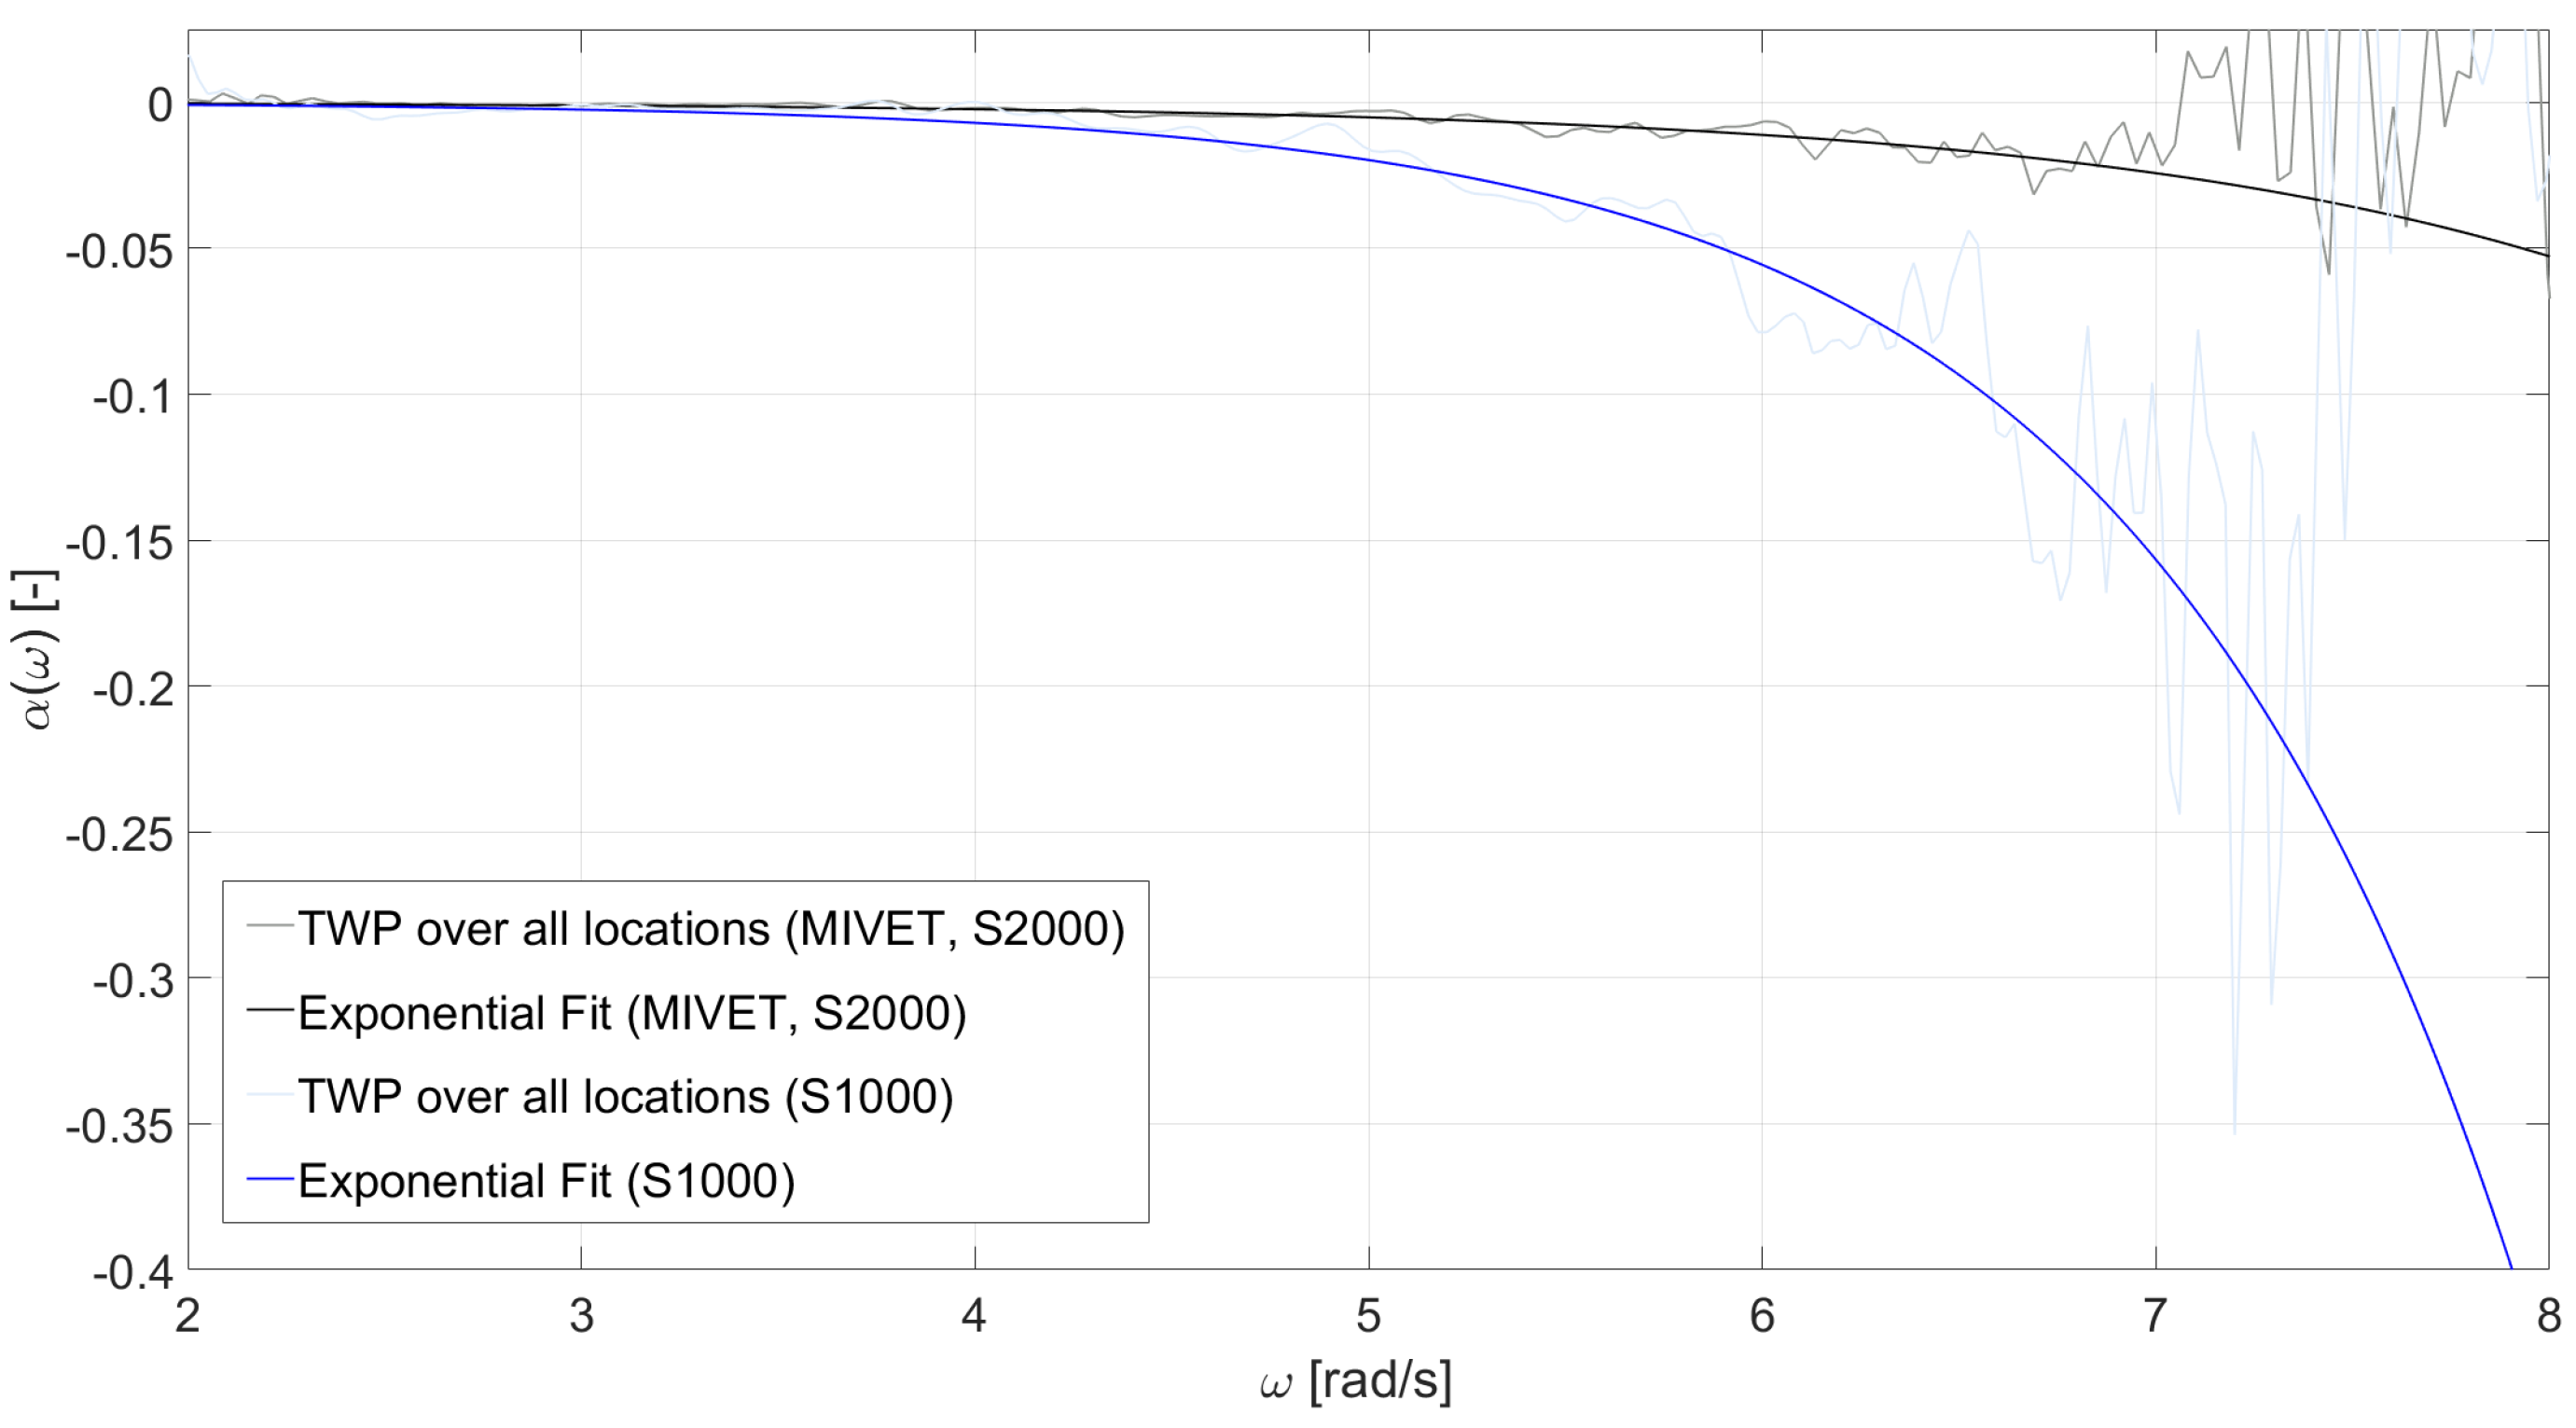
3.4. Experimental Results

The wave spectrum of the TWP, determined at four locations along the tank length, is compared for conventional model ice (blue curves) and MIVET (red curves) in Figure 9. For the conventional model ice, a significant change of the spectrum is evident. In this ice, a significant damping evolution is observed that basically damps out waves with frequency components with ω 6 rad / s . Some damping also occurs for MIVET, but significantly less pronounced.
For ice-covered waves, the damping follows a frequency dependent exponential decay
α ( ω n ) = ln ( a n ( ω n ) ) d x .
The attenuation coefficient a n ( ω n ) describes the decay of the wave amplitude between two measuring points in space and d x represents the distance along wave propagation between these two points. For ice-covered wave spectra S ζ , the attenuation coefficient reads
a n ( ω n ) = S ζ d x ( ω n ) S ζ ( ω n ) ,
the index d x indicates the second measuring point downstream the wave propagation and the frequency-dependent attenuation coefficient also depends on the distance d x of the two signals. Equation (14) depicts a classical response amplitude operator (RAO). The application of TWP enables the determination of the attenuation coefficient with one test run over a wide frequency range and the Fourier transform depicts the analytical basis for this approach.
Figure 10 illustrates the results of this calculation, the blue curves present the results for the model ice (S1000) and the gray curves for MIVET (S2000). The light grey and light blue curve, respectively, present the results of the damping calculation (Equations (13) and (14)) showing that scattering starts at approximately ω 6 rad / s and leads to unusable results at approximately ω 7 rad / s . The reasons for this are to be found in the measurement inaccuracies at the boundaries of the TWP spectrum resulting in unrealistic values for the attenuation coefficients for ω 7 rad / s , which consequently causes also incorrect results for the frequency-dependent attenuation coefficient for ω 7 rad / s . However, the application of an exponential fit function (grey and blue curve) between 2 rad / s ω 7 rad / s provides also appropriate results outside this range as shown in Figure 10.
The damping coefficients for both ice sheets are approximately zero up to ω = 3 rad / s , which denotes that the respective amplitudes did not changed, i.e., these wave frequencies require a significant longer ice sheet in order to measure damping. From there on, the damping coefficients in both ice types start to deviate significantly. While the damping in the conventional model ice (S1000) increases strongly (Figure 10) and frequencies ω 6 rad / s are damped out completely at the end of the run length (Figure 9). In comparison the damping coefficient in MIVET (S2000) is significantly reduced and the wave spectrum undergo relatively small changes over the run length (Figure 9).
Subsequently, after the TWP experiment, the wave properties of the RWG are continuously changed until ice breaking is observed. The compiled data is found in Table 2 which includes the ice breaking number I b r , Equation (9) [28]. The wave stress, σ w , is the flexural stress applied onto the ice sheet by the wave following Equations (2) and (6).
The measurements of the wave spectra run through the ice sheets of S1000 and S2000 show that the damping in S2000 is significantly reduced.

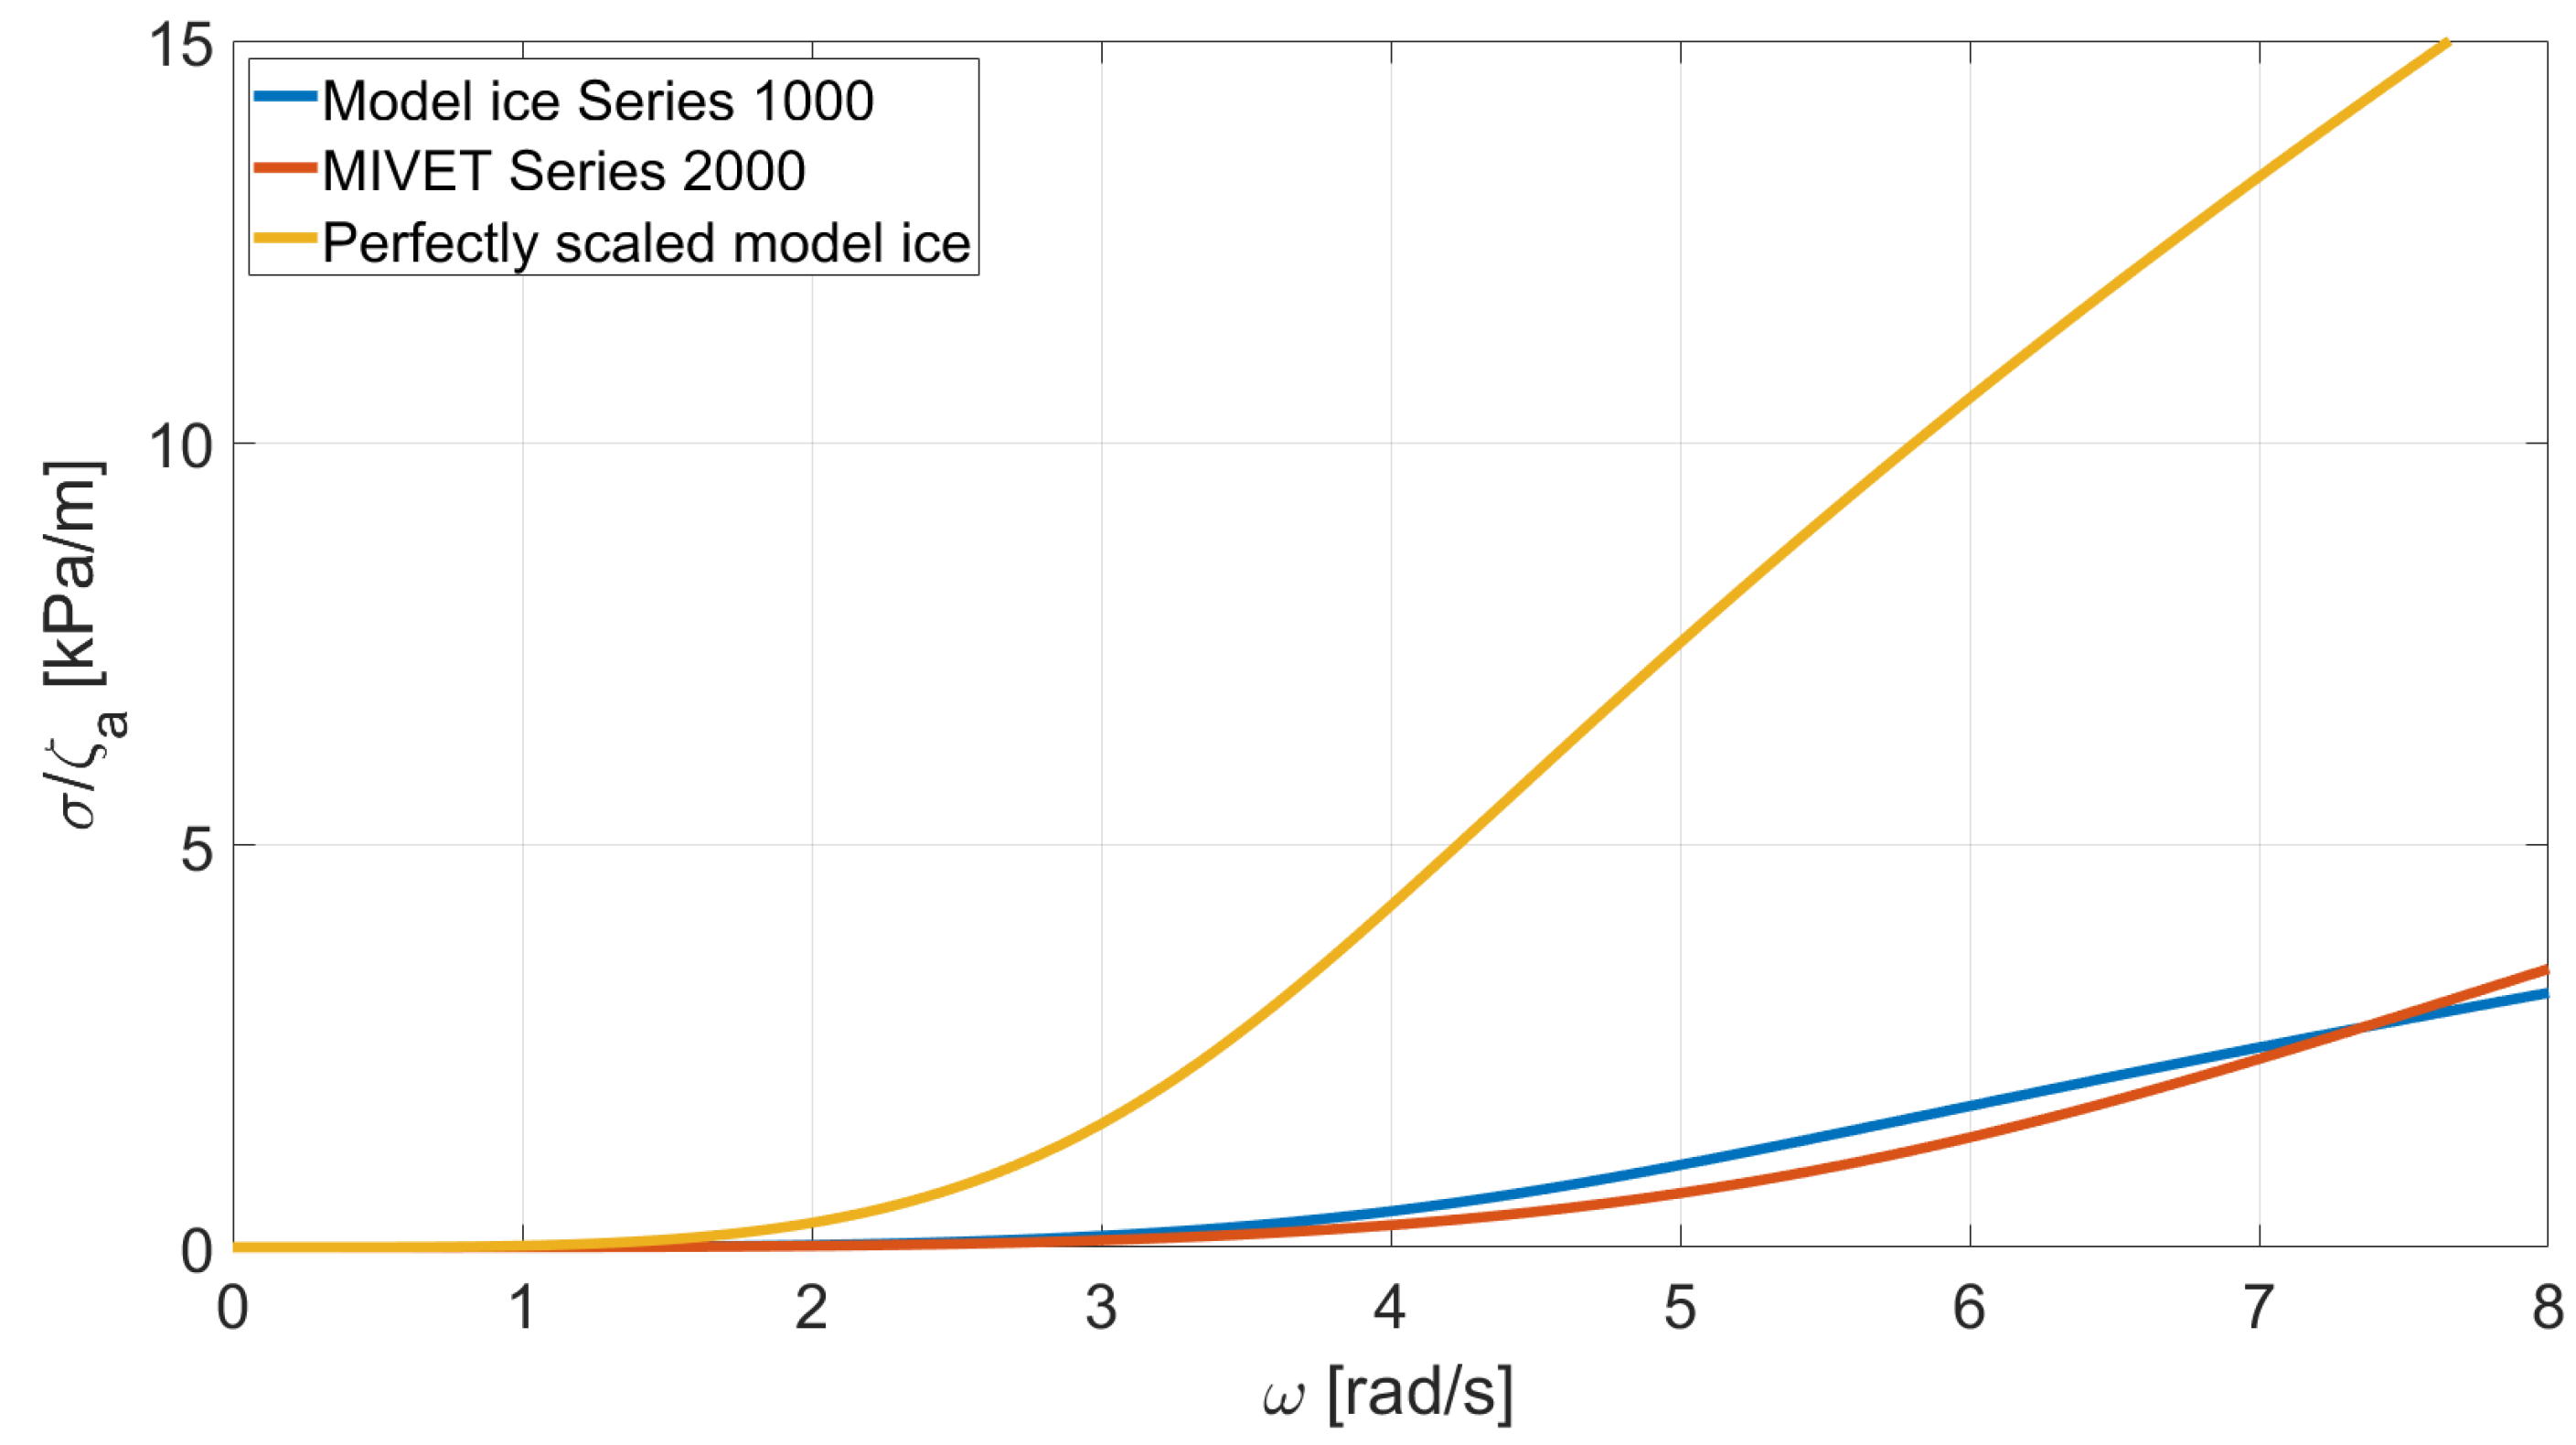
4. Analysis and Discussion

A new approach is presented establishing physical model ice for wave-ice interaction. The approach connects theoretical considerations combined with practical facilities, respectively limitations, implied by the production process and the resulting ice properties. The method is based on the high significance of an elastic modulus correctly scaled and the relatively low relevance of the correctly scaled mass of the ice thickness [9]. The presented approach sacrifices the correct scaling of thickness and mass in order to establish a better scaling of waves in ice. It is to be noted that model ice and its production is a process between art and engineering requiring experience, research and development. Consequently, the MIVET produced in S2000 did not meet the properties as the strength was still lower and the thickness higher than intended due to the growth after cooling was stopped.
Two dimensionless numbers are introduced for scaling, whereas I s n is newly introduced to account for the required stiffness and I b r is introduced by Voermans et al. [28] to define the critical combination of wave properties and ice properties that cause breaking. The I s n of the MIVET is one order of magnitude greater than of the conventional model ice (S1000). A comparison with actual sea ice values is made with the following parameters: elastic modulus of 2 GPa , a density of 917 kg / m 3 with a thickness range of 0.5 m–1.5 m. This results in an I s n = 4.4 × 10 5 1.5 × 10 5 which is the same order of magnitude as for MIVET and suggests reasonable agreement with the obtained properties.
The comparison of ice properties of MIVET and conventional model ice (Figure 3 and Figure 4, and Table 1) indicates that it succeeded to significantly increase both initial and global stiffness, while reducing the non-linearity or plasticity of the ice. It also succeeded to reduce the wave damping significantly compared to conventional model ice (Figure 9 and Figure 10) and is therewith considered as a proof of concept of the method. The non-linearity is reduced from nearly 70% to 30% for MIVET, while the difference in damping between the conventional model ice and MIVET ranges from 0–100% depending on the wave frequency. As observed in earlier experiments with granular conventional model ice ( p r = 80 % [30]), the damping in conventional model ice is high and it also acts as a low pass filter as in S1000 where angular wave frequencies above 6 rad / s are filtered out. Some damping in MIVET is present, but it is less pronounced and it remains to be investigated whether the remaining damping refers to the present non-linearity or the wave-ice interface which is identical for S1000 and S2000.
The stresses at failure (Table 2) are well below the flexural strength and in the range of what is considered the elastic limit. Consequently, the damped waves occur within the elastic stress regime and therewith the ice plasticity is no direct explanation for the strong damping. However, there seems to be a strong correlation between non-linearity and damping which possibly correlates with the visco-elastic properties and is to be addressed in future research. Despite the MIVET ice has not met the target properties the difference in damping compared to the regular model ice in S1000, it is shown that the method allows the adjustment of damping already at this stage, while full scale values for solid ice are still pending.
The break-up of the ice occurred at stresses below the flexural strength and it remains to be clarified whether fatigue effects degenerated the strength or if the strain rate effects play a role. The flexural strength is tested at strain rates 10 3 s 1 , while the strain rates at wave-ice interaction are two orders of magnitude higher in the range 10 1 s 1 according to Equation (15) [33]. Equation (15) is derived based on the strain in Equation (2) in combination with the wave frequency. The strain rates at failure for model ice in S1000 is 0.3 s 1 and 0.8 s 1 for MIVET.
ϵ ˙ = k 2 a 1 ν 2 z k g π
The breaking of the modeled ice sheets occurred at I b r at the same order of magnitude, but around three times higher than the critical value derived from full scale [28] with I b r 0.014 . The transfer-function of the flexural stress in the ice sheet relative to wave amplitude, σ / ζ a , (Figure 11) shows a relatively small difference between the two modeled ice sheets regarding the elastic stress states, but a significant difference to a model ice of 24   mm thickness with perfectly scaled material properties, i.e., complying with Froude similitude and complying with Equation (8). The transfer function is defined with the data in Table 1 and more details are found in Appendix A.
The introduced MIVET model ice fulfills its purpose by increasing the elastic modulus and reducing both significantly, the non-linearity of the ice and its induced wave damping. The break-up of the ice sheet by waves does not yet comply with the targets and requires future work. The production of MIVET has additionally the favorable economic component that it requires less production time while one day of tank time is required instead of two days. Consequently, a more experiments can be conducted in less tank time while reducing costs per ice sheet.

5. Conclusions

The new physical modeling approach of the Model Ice of Virtual Equivalent Thickness (MIVET) is presented and tested in wave-ice interaction. In this approach the objective is to obtain an elastic stiffness which is in scale. On the basis of ice physics and the relationships between mechanical properties the elastic modulus is increased with an increase of the flexural strength. Therefore, the target is to scale the critical bending moment at which failure occurs by increasing the flexural strength while decreasing the thickness. This method allows the reduction of the strong damping in solid level ice which is considered a scale effect of conventional model ice. The compliance of model ice and its high non-linearity when the thickness is scaled correctly refers to the constraints in the production process. Despite the MIVET did not exactly reach target properties it succeeded to increase the stiffness (elastic modulus) while reducing both non-linearity and wave damping. The experiments are considered a proof of concept that MIVET is capable to reflect wave-ice interaction in a level ice sheet. The results are considered satisfying given the constraint that no experience with the production of MIVET is available and we had only one attempt to produce MIVET, while the development of conventional model ice took decades. The modeling of ice breaking requires future research as some questions regarding the critical failure strength remain open. The latter might be solved when MIVET with target properties is produced which however also requires more research, practice and experience.

6. Patents

The production of MIVET is defined in patent P C T / E P 2019 / 061545 [48].

Author Contributions

Conceptualization, F.v.B.u.P.; methodology, F.v.B.u.P.; software, F.v.B.u.P. and M.K.; validation, F.v.B.u.P., M.K. and M.H.; formal analysis, F.v.B.u.P.; investigation, F.v.B.u.P.; resources, F.v.B.u.P., M.K. and M.H.; data curation, F.v.B.u.P., M.K. and M.H.; writing—original preparation, F.v.B.u.P., M.K. and M.H.; writing—review and editing, F.v.B.u.P., M.K. and M.H.; visualization, F.v.B.u.P. and M.K.; supervision, F.v.B.u.P.; project administration, M.K.; funding acquisition, M.K. All authors have read and agreed to the published version of the manuscript.

Funding

This paper is published as a contribution to the research project “Nonlinear wave-ice interaction” funded by the Deutsche Forschungsgemeinschaft (DFG, German Research Foundation)—407532845.

Institutional Review Board Statement

Not applicable.

Informed Consent Statement

Not applicable.

Data Availability Statement

Not applicable.

Conflicts of Interest

The authors declare no conflict of interest. The funders had no role in the design of the study; in the collection, analyses, or interpretation of data; in the writing of the manuscript, or in the decision to publish the results.

Appendix A. Transfer Function for Wave Induced Stresses

The transfer function for the wave induced stresses is determined from the combination of the dispersion relationship (Equation (A2)) for waves in ice [10] and the re-arranged plate curvature definition in Equation (6) ( k a = k · ζ a = σ f E 2 ( 1 ν 2 ) h k ). Note that the flexural stress, σ , replaces the flexural strength, σ f . The dispersion relation is derived based on the modified dynamic boundary condition due to the presence of the ice. In the following, the compression term in the original derivation from Liu and Mollo-Christensen [10] is set to zero as effects as compression due to wind forcing is not relevant for model testing and compressive stresses due to wave action are considered small and cannot be quantified.
The stiffness term B contains the plate modulus (see also Equation (2)) with the ice thickness h and normalized by the water density ρ w . The inertia term I contains the density ratio of ice and water and the ice thickness Equation (A1)
B = E h 3 12 ( 1 ν 2 ) ρ w , I = ρ i ρ w h
The corresponding dispersion equation with the angular wave frequency ω , the gravitational acceleration, g, and the wave number k is defined following Equation (A2). The combination of Equation (6) and Equation (A2) to obtain the transfer function ( σ / ζ a over ω ) in Figure 11 is solved numerically.
ω = g k + B k 5 1 + k I

Appendix B

Table A1 presents the relevant technical details of the applied ultrasonic sensors.
Table A1. Technical details of the applied ultrasonic (us) sensors.
Ultralab USS 30250Ultralab USS 2001300
Blind area 30 mm 200 mm
Working range 250 mm 1300 mm
Techn. resolution 0.18 mm 0.36 mm
Reproducibility ± 0.15 % ± 1 mm

References

  1. Prinsenberg, S.J.; Peterson, I.K. Observing regional-scale pack-ice decay processes with helicopter-borne sensors and moored upward-looking sonars. Ann. Glaciol. 2011, 52, 35–42. [Google Scholar] [CrossRef] [Green Version]
  2. Ardhuin, F.; Otero, M.; Merrifield, S.; Grouazel, A.; Terrill, E. Ice Breakup Controls Dissipation of Wind Waves Across Southern Ocean Sea Ice. Geophys. Res. Lett. 2020, 47. [Google Scholar] [CrossRef]
  3. von Bock und Polach, R.U.F.; Klein, M.; Kubiczek, J.; Kellner, L.; Braun, M.; Herrnring, H. State of the Art and Knowledge Gaps on Modelling Structures in Cold Regions. In Polar and Arctic Sciences and Technology; American Society of Mechanical Engineers: New York, NY, USA, 2019; Volume 8. [Google Scholar] [CrossRef]
  4. Manson, G.K.; Davidson-Arnott, R.G.D.; Ollerhead, J. Attenuation of Wave Energy by Nearshore Sea Ice: Prince Edward Island, Canada. J. Coast. Res. 2015, 32, 253–263. [Google Scholar] [CrossRef]
  5. Hartmann, M.C.N.; von Bock und Polach, F.; Ehlers, S.; Hoffmann, N.; Onorato, M.; Klein, M. Investigation of Nonlinear Wave–Ice Interaction Using Parameter Study and Numerical Simulation. J. Offshore Mech. Arct. Eng. 2020, 142. [Google Scholar] [CrossRef]
  6. Squire, V. Of ocean waves and sea-ice revisited. Cold Reg. Sci. Technol. 2007, 49, 110–133. [Google Scholar] [CrossRef]
  7. Zhao, X.; Shen, H.H.; Cheng, S. Modeling ocean wave propagation under sea ice covers. Acta Mech. Sin. 2015, 31, 1–15. [Google Scholar] [CrossRef]
  8. Sree, D.K.K.; Law, A.W.K.; Shen, H.H. An experimental study on gravity waves through a floating viscoelastic cover. Cold Reg. Sci. Technol. 2018, 155, 289–299. [Google Scholar] [CrossRef]
  9. Fox, C. A Scaling Law for the Flexural Motion of Floating Ice. In IUTAM Symposium on Scaling Laws in Ice Mechanics and Ice Dynamics; Springer: Amsterdam, The Netherlands, 2001; pp. 135–148. [Google Scholar] [CrossRef]
  10. Liu, A.K.; Mollo-Christensen, E. Wave Propagation in a Solid Ice Pack. J. Phys. Oceanogr. 1988, 18, 1702–1712. [Google Scholar] [CrossRef]
  11. Kohout, A.L.; Meylan, M.H. An elastic plate model for wave attenuation and ice floe breaking in the marginal ice zone. J. Geophys. Res. Ocean. 2008, 113. [Google Scholar] [CrossRef]
  12. Broström, G.; Christensen, K. Waves in Sea Ice; Technical Report; Niels Henrik Abelsvei: Oslo, Norway, 2008. [Google Scholar]
  13. Wadhams, P. Attenuation of swell by sea ice. J. Geophys. Res. (1896–1977) 1973, 78, 3552–3563. [Google Scholar] [CrossRef]
  14. Alpers, W.; Hühnerfuss, H. The damping of ocean waves by surface films: A new look at an old problem. J. Geophys. Res. 1989, 94, 6251. [Google Scholar] [CrossRef]
  15. Wang, R.; Shen, H.H. Gravity waves propagating into an ice-covered ocean: A viscoelastic model. J. Geophys. Res. Ocean. 2010, 115. [Google Scholar] [CrossRef]
  16. Dolatshah, A.; Nelli, F.; Alberello, A.; Bruneau, L.; Bennetts, L.G.; Meylan, M.H.; Monty, J.P.; Toffoli, A. Wave Attenuation due to Ice Cover: An Experimental Model in a Wave-Ice Flume. In Polar and Arctic Sciences and Technology Petroleum Technology; American Society of Mechanical Engineers: New York, NY, USA, 2017; Volume 8. [Google Scholar] [CrossRef]
  17. Schwarz, J. New developments in modeling ice problems. In Proceedings of the 4th International Conference on Port and Ocean Engineering Under Arctic Conditions, POAC 77, Conference on Port and Ocean Engineering under Arctic Conditions (POAC), St. John’s, NL, Canada, 26–30 September 1977; pp. 45–61. [Google Scholar]
  18. Jalonen, R.; Ilves, L. Experience with a Chemically-Doped Fine-Grained Model Ice. In Proceedings of the International Association for Hydro-Environment Engineering and Research (IAHR) Ice Symposium, Espoo, Finland, 20–23 August 1990; Volume 2, pp. 639–651. [Google Scholar]
  19. Evers, K.U.; Jochmann, P. An Advanced Technique to Improve the Mechanical Properties of Model Ice Developed at the HSVA Ice Tank. In Proceedings of the POAC93, Hamburg, Germany, 17–20 August 1993. [Google Scholar]
  20. Vance, G.P. A Scaling System for Vessels Modelled in Ice. In Proceedings of the Ice Tech 75, SNAME-Ice Symposium. The Society of Naval Architects and Marine Engineers (SNAME) Ice Tech Symposium, Montreal, QC, Canada, 9–11 April 1975. [Google Scholar]
  21. Zufelt, J.E.; Ettema, R. Model Ice Properties. In Technical Report CRREL Report 96-1; U.S. Army Corps of Engineers, Cold Regions Research and Engineering Laboratory (CRREL): Hanover, NH, USA, 1996. [Google Scholar]
  22. Timco, G.; Weeks, W. A review of the engineering properties of sea ice. Cold Reg. Sci. Technol. 2010, 60, 107–129. [Google Scholar] [CrossRef]
  23. von Bock und Polach, R.; Ehlers, S. Model scale ice—Part B: Numerical model. Cold Reg. Sci. Technol. 2013, 94, 53–60. [Google Scholar] [CrossRef]
  24. von Bock und Polach, R. Numerical analysis of the bending strength of model-scale ice. Cold Reg. Sci. Technol. 2015, 118, 91–104. [Google Scholar] [CrossRef]
  25. von Bock Und Polach, R.F.; Ehlers, S. On the scalability of model- scale ice experiments. J. Offshore Mech. Arct. Eng. 2015, 137, 051502. [Google Scholar] [CrossRef] [Green Version]
  26. Von Bock Und Polach, R.; Molyneux, D. Model ice: A review of its capacity and identification of knowledge gaps. In Proceedings of the International Conference on Offshore Mechanics and Arctic Engineering—OMAE, Trondheim, Norway, 25–30 June 2017; Volume 8. [Google Scholar] [CrossRef]
  27. von Bock und Polach, R.U.F.; Gralher, S.; Ettema, R.; Kellner, L.; Stender, M. The non-linear behavior of aqueous model ice in downward flexure. Cold Reg. Sci. Technol. 2019. [Google Scholar] [CrossRef] [Green Version]
  28. Voermans, J.J.; Rabault, J.; Filchuk, K.; Ryzhov, I.; Heil, P.; Marchenko, A.; Collins, C.O., III; Dabboor, M.; Sutherland, G.; Babanin, A.V. Experimental evidence for a universal threshold characterizing wave-induced sea ice break-up. Cryosphere 2020, 14, 4265–4278. [Google Scholar] [CrossRef]
  29. von Bock und Polach, R.U.F.; Ziemer, G.; Klein, M.; Hartmann, M.C.N.; Toffoli, A.; Monty, J. Case Based Scaling: Recent Developments in Ice Model Testing Technology. In Polar and Arctic Sciences and Technology; American Society of Mechanical Engineers: New York, NY, USA, 2020; Volume 7. [Google Scholar] [CrossRef]
  30. Passerotti, G.; Alberello, A.; Dolatshah, A.; Bennetts, L.; Puolakka, O.; von Bock und Polach, F.; Klein, M.; Hartmann, M.; Monbaliu, J.; Toffoli, A. Wave Propagation in Continuous Sea Ice: An Experimental Perspective. In Polar and Arctic Sciences and Technology; American Society of Mechanical Engineers: New York, NY, USA, 2020; Volume 7. [Google Scholar] [CrossRef]
  31. Collins, C.O.; Rogers, W.E.; Lund, B. An investigation into the dispersion of ocean surface waves in sea ice. Ocean Dyn. 2016, 67, 263–280. [Google Scholar] [CrossRef]
  32. Meylan, M.H.; Bennetts, L.G.; Mosig, J.E.M.; Rogers, W.E.; Doble, M.J.; Peter, M.A. Dispersion Relations, Power Laws, and Energy Loss for Waves in the Marginal Ice Zone. J. Geophys. Res. Ocean. 2018, 123, 3322–3335. [Google Scholar] [CrossRef]
  33. Dumont, D.; Kohout, A.; Bertino, L. A wave-based model for the marginal ice zone including a floe breaking parameterization. J. Geophys. Res. 2011, 116. [Google Scholar] [CrossRef] [Green Version]
  34. Palmer, A.C. Dimensional Analysis and Intelligent Experimentation; World Scientific: Singapore, 2008. [Google Scholar] [CrossRef] [Green Version]
  35. Feng, L.; Qianjin, Y.; Shkhinek, K.; Kärnä, T. A qualitative analysis of breaking length of sheet ice against conical structures. In Proceedings of the 17th POAC Ice Symposium, Busan, Korea, 16–19 June 2003. [Google Scholar]
  36. Newman, J.N. Marine Hydrodynamics; MIT Press: Cambridge, MA, USA, 1977; p. 402. [Google Scholar]
  37. Timco, G.; O.’Brien, S. Flexural strength equation for sea ice. Cold Reg. Sci. Technol. 1994, 22, 285–298. [Google Scholar] [CrossRef]
  38. von Bock und Polach, R.; Ehlers, S.; Kujala, P. Model-scale ice—Part A: Experiments. Cold Reg. Sci. Technol. 2013, 94, 74–81. [Google Scholar] [CrossRef]
  39. ITTC. Ice Property Measurements, 7.5-02-04-02. 2014. Available online: https://www.ittc.info/media/8061/75-02-04-02.pdf (accessed on 27 November 2021).
  40. Clauss, G.; Kühnlein, W. Seakeeping Tests in Transient Wave Packets. In Proceedings of the Discussion on the Report of Seakeeping Committee—21st International Towing Tank Conference, Trondheim, Norway, 15–21 September 1996. [Google Scholar]
  41. Clauss, G.; Kühnlein, W. A new tool for seakeeping tests—Nonlinear transient wave packets. In Proceedings of the 8th International Conference on the Behaviour of Offshore Structures (BOSS), Delft, The Netherlands, 7–10 July 1997; pp. 269–285. [Google Scholar]
  42. Clauss, G.F.; Steinhagen, U. Numerical simulation of nonlinear transient waves and its validation by Laboratory data. In Proceedings of the 9th International Offshore and Polar Engineering Conference (ISOPE), Brest, France, 30 May–4 June 1999; Volume III, pp. 368–375. [Google Scholar]
  43. Kühnlein, W.L.; Clauss, G.F.; Hennig, J. Tailor made freak waves within irregular seas. In Proceedings of the International Conference on Offshore Mechanics and Arctic Engineering, Oslo, Norway, 23–28 June 2002; Volume 36142, pp. 759–768. [Google Scholar]
  44. Clauss, G.F.; Klein, M.; Dudek, M. Influence of the Bow Shape on Loads in High and Steep Waves. In Proceedings of the 29th International Conference on Ocean, Offshore and Arctic Engineering, Shanghai, China, 6–11 June 2010; Volume 2, pp. 159–170. [Google Scholar] [CrossRef]
  45. Hennig, J. Generation and Analysis of Harsh Wave Environments. In Dissertation; (D 83); Technische Universität Berlin: Berlin, Germany, 2005. [Google Scholar]
  46. Clauss, G.F.; Stuppe, S.; Dudek, M. Transient Wave Packets: New Application in CFD-Methods. In Proceedings of the International Conference on Offshore Mechanics and Arctic Engineering, San Francisco, CA, USA, 8–13 August 2014; Volume 8B. [Google Scholar] [CrossRef] [Green Version]
  47. Klein, M.; Hartmann, M.; von Bock und Polach, F. Note on the Application of Transient Wave Packets for Wave–Ice Interaction Experiments. Water 2021, 13, 1699. [Google Scholar] [CrossRef]
  48. von Bock und Polach, F. Method for Producing Model Ice. European PCT/EP2019/061545, 5 June 2019. [Google Scholar]
Figure 1. The idealized actual deformation behavior of model ice (regimes 1,2) and the deformation behavior with an average stiffness (regime 3). Note: this is an idealization and regime 2 is usually very non-linear.
Water 13 03397 g001
Figure 2. Temperature history of the ice production process. The temperature rise in the tempering phase of both ice sheets is aligned for a better comparison. The temperature is measured 2 m above the ice sheet. The gaps in the measurement history are caused by the retraction of the thermometer for operational reasons.
Water 13 03397 g002
Figure 3. Force-displacement signal of a flexural strength measurement with conventional model ice (S1000). The slope S1 marks the initial linear deformation behavior and S3 the representative average linear deformation behavior.
Water 13 03397 g003
Figure 4. Force-displacement signal of a flexural strength measurement with MIVET model ice (S2000). The slope S1 marks the initial linear deformation behavior and S3 the representative average linear deformation behavior.
Water 13 03397 g004
Figure 5. Qualitative illustration of the deflecting ice beam in the experiments and its accurate representation in the finite element model (left) versus an analytical cantilever beam model (right).
Water 13 03397 g005
Figure 6. Geometry of the FE model which includes a part of the adjacent ice sheet.
Water 13 03397 g006
Figure 7. Experimental test set-up.
Water 13 03397 g007
Figure 8. Overview of the TWP concept [47].
Water 13 03397 g008
Figure 9. Change of the wave spectra in the two ice sheets over four measurement locations along the length of the tank. The attenuation of the conventional model ice, S1000, is more pronounced than for MIVET.
Water 13 03397 g009
Figure 10. Damping coefficient for MIVET (S2000) and conventional model ice (S1000) together with an exponential fit.
Water 13 03397 g010
Figure 11. Stress RAO for the two tested ice sheets and a model ice with properties perfectly in scale.
Water 13 03397 g011
Table 1. Measured and simulated ice properties of S1000 and S2000, with S2000 MIVET. S2000 MIVET is set into relationship to S1000 and represents target properties based on Equation (11) and a = 2.7 .
ThicknessFlexuralE_Mod S1E_Mod S3Elastic StressNon-LinearityE1/ ρ g h
Strength, σ f Nom σ 1 Max σ 1 I sn
[mm][kPa][MPa][MPa][kPa][kPa][%]
S10002439.3123.611.119.467.8 6.0 × 10 4
S2000955.52011.428.346.835.0 2.8 × 10 5
(MIVET)
MIVET target9286.1 80140
Table 2. Wave properties at which ice breaking is observed.
TypeWave Number
k [rad/m]
Steepness
ka [rad]
Stress
σ w [kPa]
I br
Model ice (S1000)RWG3.90.025 & 0.03515.6 & 21.80.0456 & 0.0457
MIVET (S2000)RWG3.80.138.40.0451
Publisher’s Note: MDPI stays neutral with regard to jurisdictional claims in published maps and institutional affiliations.

