Abstract
The creation of reservoirs in water streams leads to significant changes in the hydrological regime of water bodies: it allows smoothing the peaks of maximum water discharge during a flood period and regulating low-water flow. The creation of reservoirs with significant storage capacity makes it possible to solve a wide range of water-management problems, including the use of falling water energy for hydropower purposes, and maintenance of the uninterrupted water supply and navigation. Since constructed dams are usually operated by hydropower companies, the regulatory regime for the discharge of water into the lower pool is often determined by the daily electricity consumption regime. Intra-day variations in the volume of water discharges through hydroelectric power stations generate multidirectional streams in the upper pool, which can affect the operation of other water withdrawal systems. This paper considers the effect of intraday variations in water discharges into the lower pool on the dynamic and physical properties of the water mass in the region of the location of drinking water-intake heads of Perm city and the quality of the withdrawn water.
1. Introduction
Nowadays the necessity of providing the population with drinking water of the required quality has become a high-priority problem in many regions of the world. A search for a solution is an urgent but daunting task. Water quality is influenced by the natural composition of water, anthropogenic pollutants, eutrophication and algal blooms [1,2]. In the literature, there are many works on the development of water quality models and an integrated algorithm for optimal water management to improve the environment [3,4,5,6]). For more effective pollution control, 2-D and 3-D hydrodynamic models have been developed in combination with water quality models, which serve as a scientifically based and effective tool for the operation of reservoirs and water quality in rivers. The works of [3,6] presented a study of hydrodynamics, water quality and their impact on aquatic species, a change in dissolved oxygen and temperature which is observed under various operating conditions of water bodies. In [4], the three-dimensional hydrodynamic model and the water quality model were used to study the dependencies of the distribution of water quality on time in a stratified lake and the influence of hydrodynamics on the response of phytoplankton. Ref. [5] developed a two-dimensional water quality model to support the programs of optimization of water ecosystem restoration and assess their effectiveness. Ref. [7] performed a simulation of the flow circulation and transport of pollutants using a three-dimensional hydrodynamic model and a water quality model. In addition, some studies analyzed the effects of tides on water quality [8,9,10].
At present, changes in water quality caused by regulation of water flow in tidal rivers have been little studied. The Dongshen water supply project aimed at studying the hydrodynamic flow regime of the Dongjiang River, responsible for Hong Kong’s drinking water supply, is presented in [11]. To evaluate the impact of reservoir regulation on water quality, a two-dimensional hydrodynamic model was developed in combination with a water quality model. Under various scenarios of the Shima River flooding and different flow rates of the Dongjiang hydroelectric station, a change in water quality is simulated. The paper by [12] presents an assessment of the optimal alternative for shifting the existing surface water intake facility in Dhaka city (capital of Bangladesh) using a geographic information system (GIS) tool. This study demonstrates the value of GIS as a tool for spatial analysis of water quality parameters along the peripheral rivers of Dhaka, which makes it possible to find the optimal solution for shifting the water intake facility for withdrawal of surface water in severe pollution conditions. A comprehensive analysis of changes in water quality in the volatile Murray River (Australia), which is prone to droughts and floods, was done by [13].
The construction of new hydraulic structures is inevitably accompanied by the processes of changing the environmental characteristics of a reservoir and reducing water quality. In this regard, of considerable interest is the work of [14], who highlighted the problems caused by the construction of the Three Gorges Dam in the Yangtze River Basin.
Previous studies have mainly focused on the methods of managing the hydrodynamic regimes of reservoirs to allow assessment and improvement of water quality, as well as changing the properties of pollutants at various spatio-temporal scales. Many studies provide effective tools for studying these pollution problems. In large water bodies, a significant stable inhomogeneity in the depth-wise distribution of hydrochemical and hydrophysical properties of water is a commonly observed feature. This inhomogeneity can be used to improve the consumer properties of the withdrawn water [15,16]. These problems can be solved by constructing selective water intakes, allowing selective water withdrawal with the required properties. The most important factor that impedes the implementation and use of selective water intakes is the significant intra-annual and inter-annual variability of the hydrological and hydrochemical regimes of water bodies. The most effective way to “neutralize” this variability is to create an option of water withdrawal at different depths. However, the construction of such large-capacity water intakes is a very complex and expensive task.
In the case when water masses with the required consumer properties are located in the near-surface layer, the simplest design allowing an effective separation of the water withdrawal from the lower bottom horizons is the construction of bottom barriers at the heads of water intakes. Their sizes should, on the one hand, guarantee effective cutting off of water intake from the bottom horizons, and, on the other hand, not impede water withdrawal at minimum flow rates and maximum ice phenomena.
The characteristic feature of large hydro power stations is their technological capabilities to rapidly and effectively change the turbine output. This is the fundamental difference between hydroelectric power stations and thermal and nuclear power plants, which are oriented towards stable operations. Since consumption of electric power by population and industrial plants of big cities within 14 h is non-uniform (minimum consumption at night and maximum consumption in the morning and in the afternoon), it is convenient to use HPSs to eliminate this power-consumption non-uniformity. The non-uniformity of power generation at these power stations is determined by the non-uniformity of water discharge from upper to lower pool waters. Accordingly, abrupt changes in the discharge of water through the dam of hydroelectric power stations can affect the hydrodynamic regime of both the upper and lower pools.
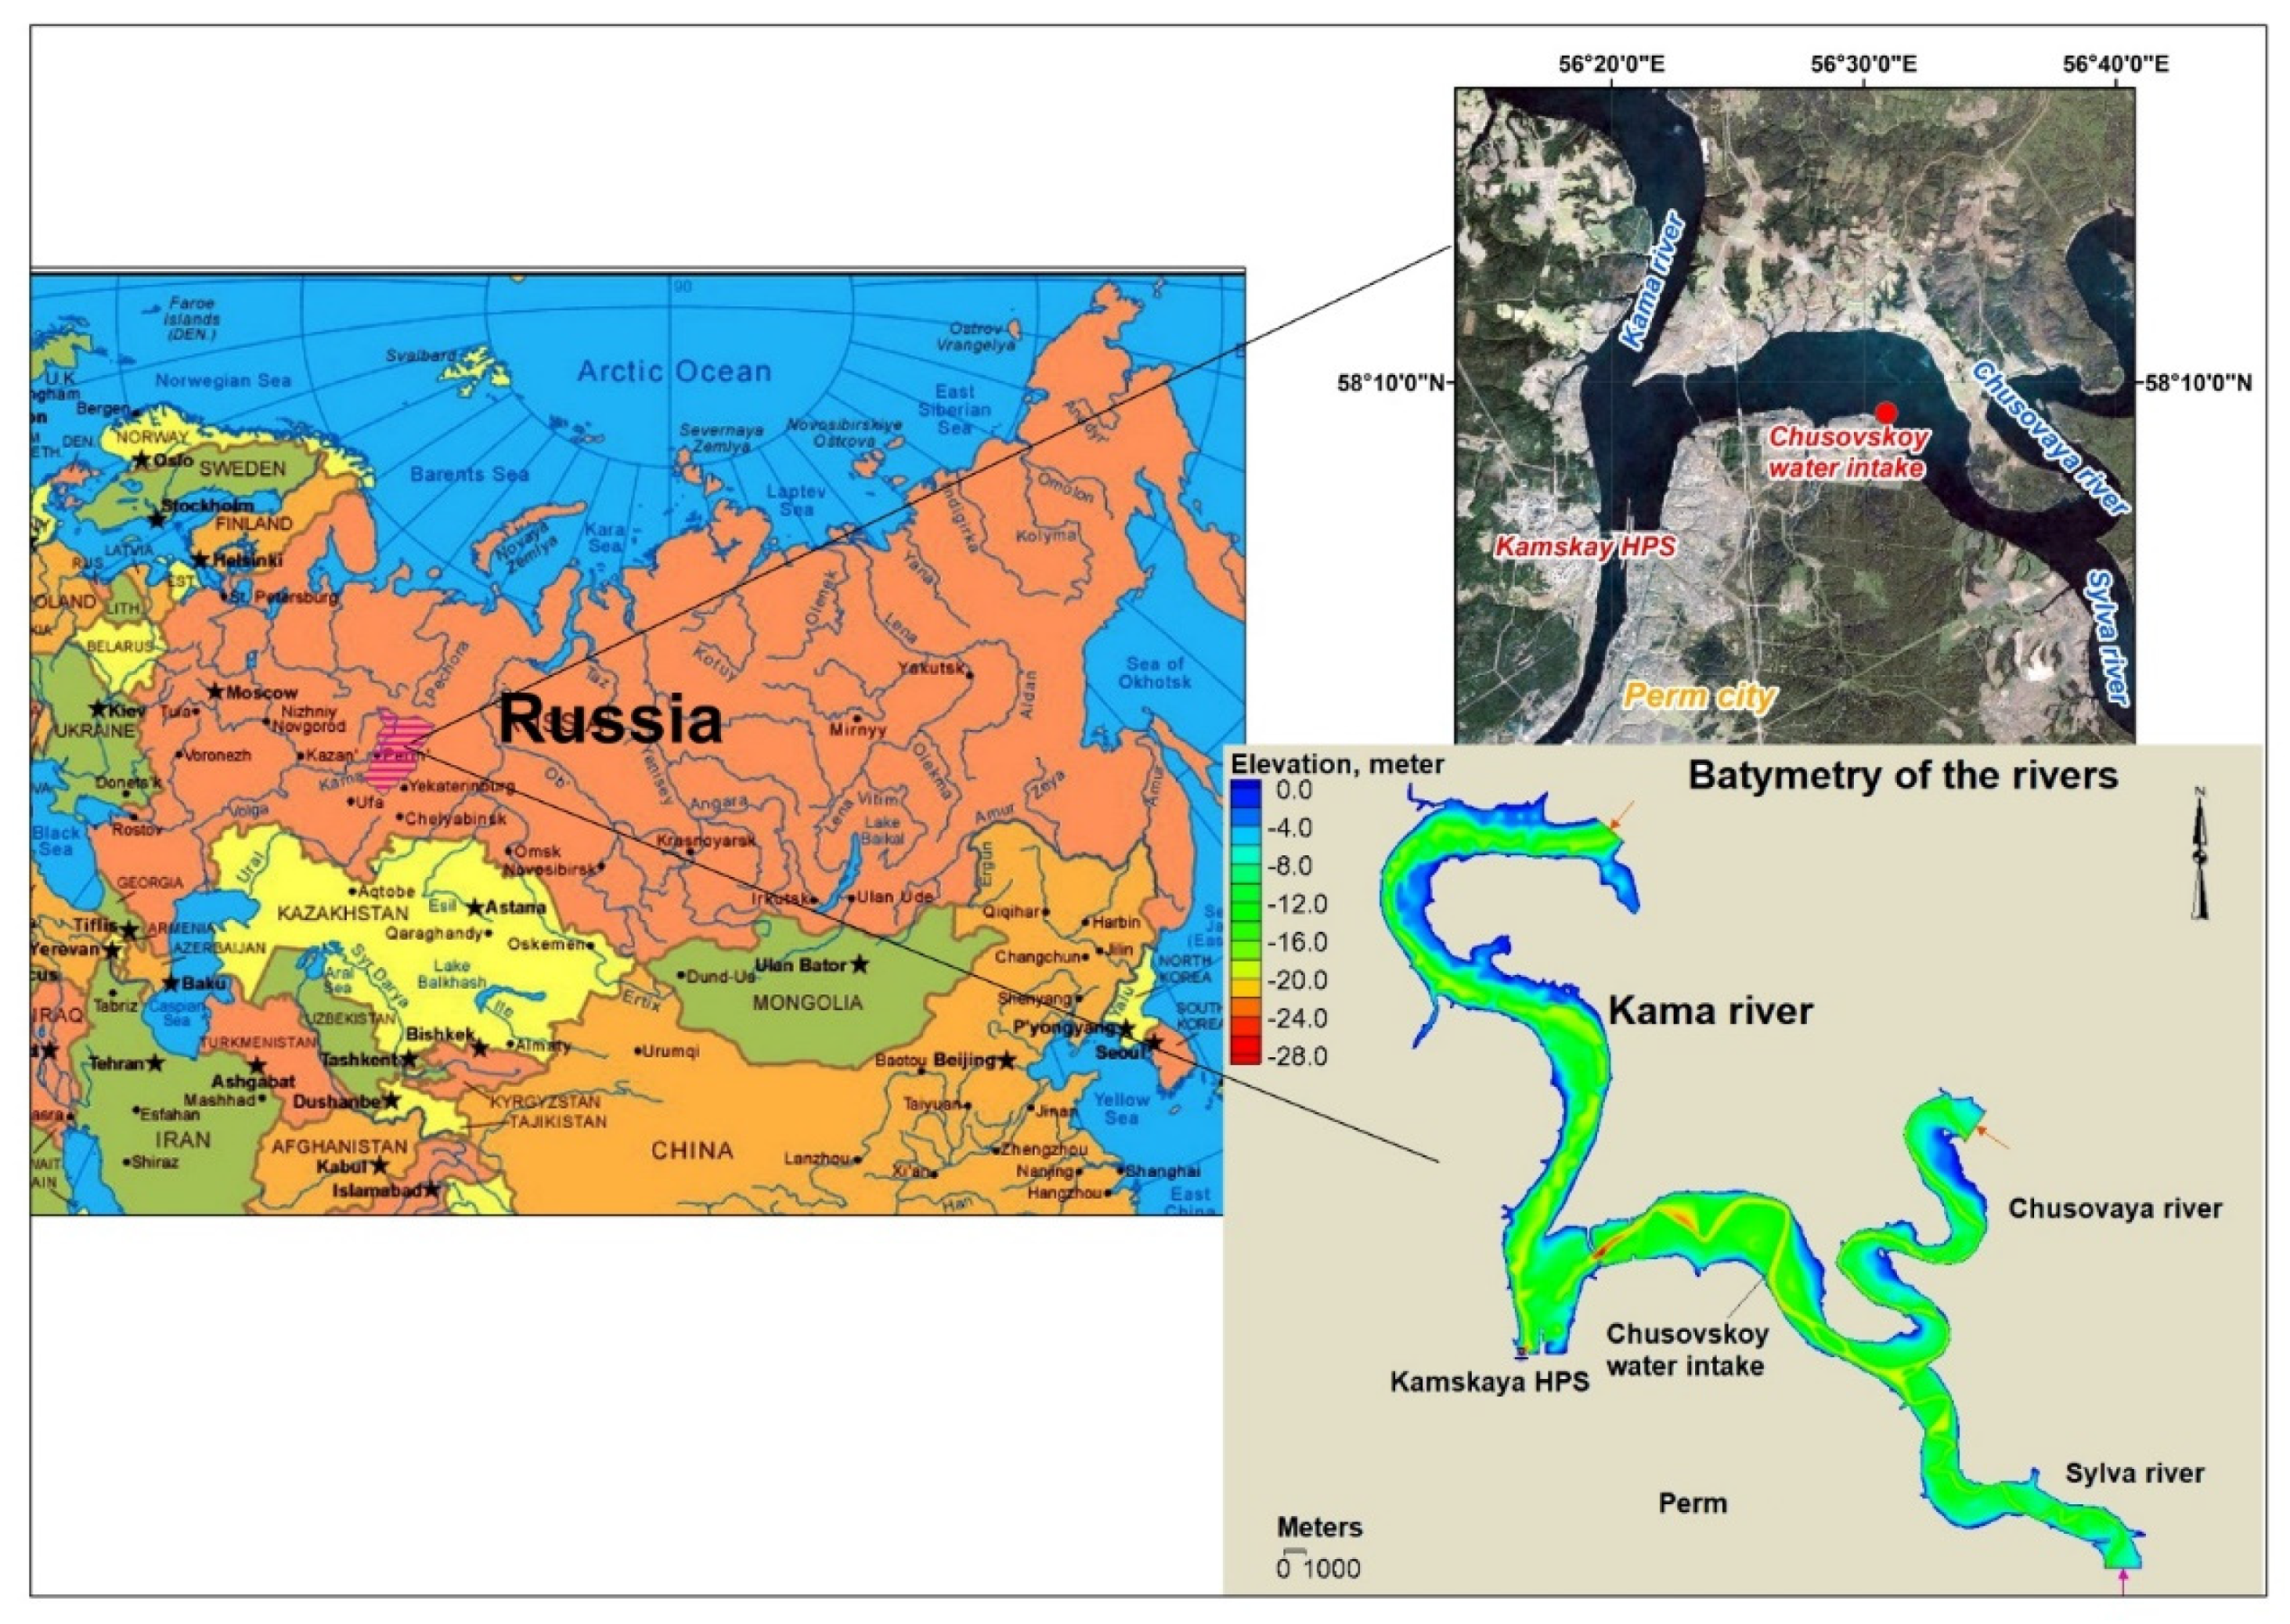
For the city of Perm, the hydrodynamics of the upper pool of the Kamskaya HPS is of particular importance because the main intake of potable water in Perm (the Chusovskoy water intake) is located just in this region (Figure 1). For the first time, the peculiarities of the structure of flows and hydrochemical fields formed in the upper pool of the Kamskaya hydroelectric complex were considered in the framework of computational experiments by [15]. The influence of non-uniformity of water discharge regime on the hydrodynamic regime of reservoirs was also studied by [17].
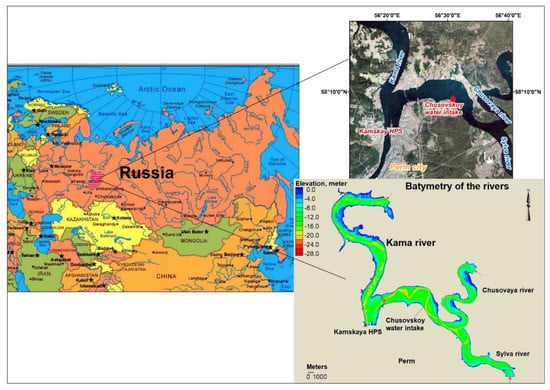
Figure 1.
Study area location.
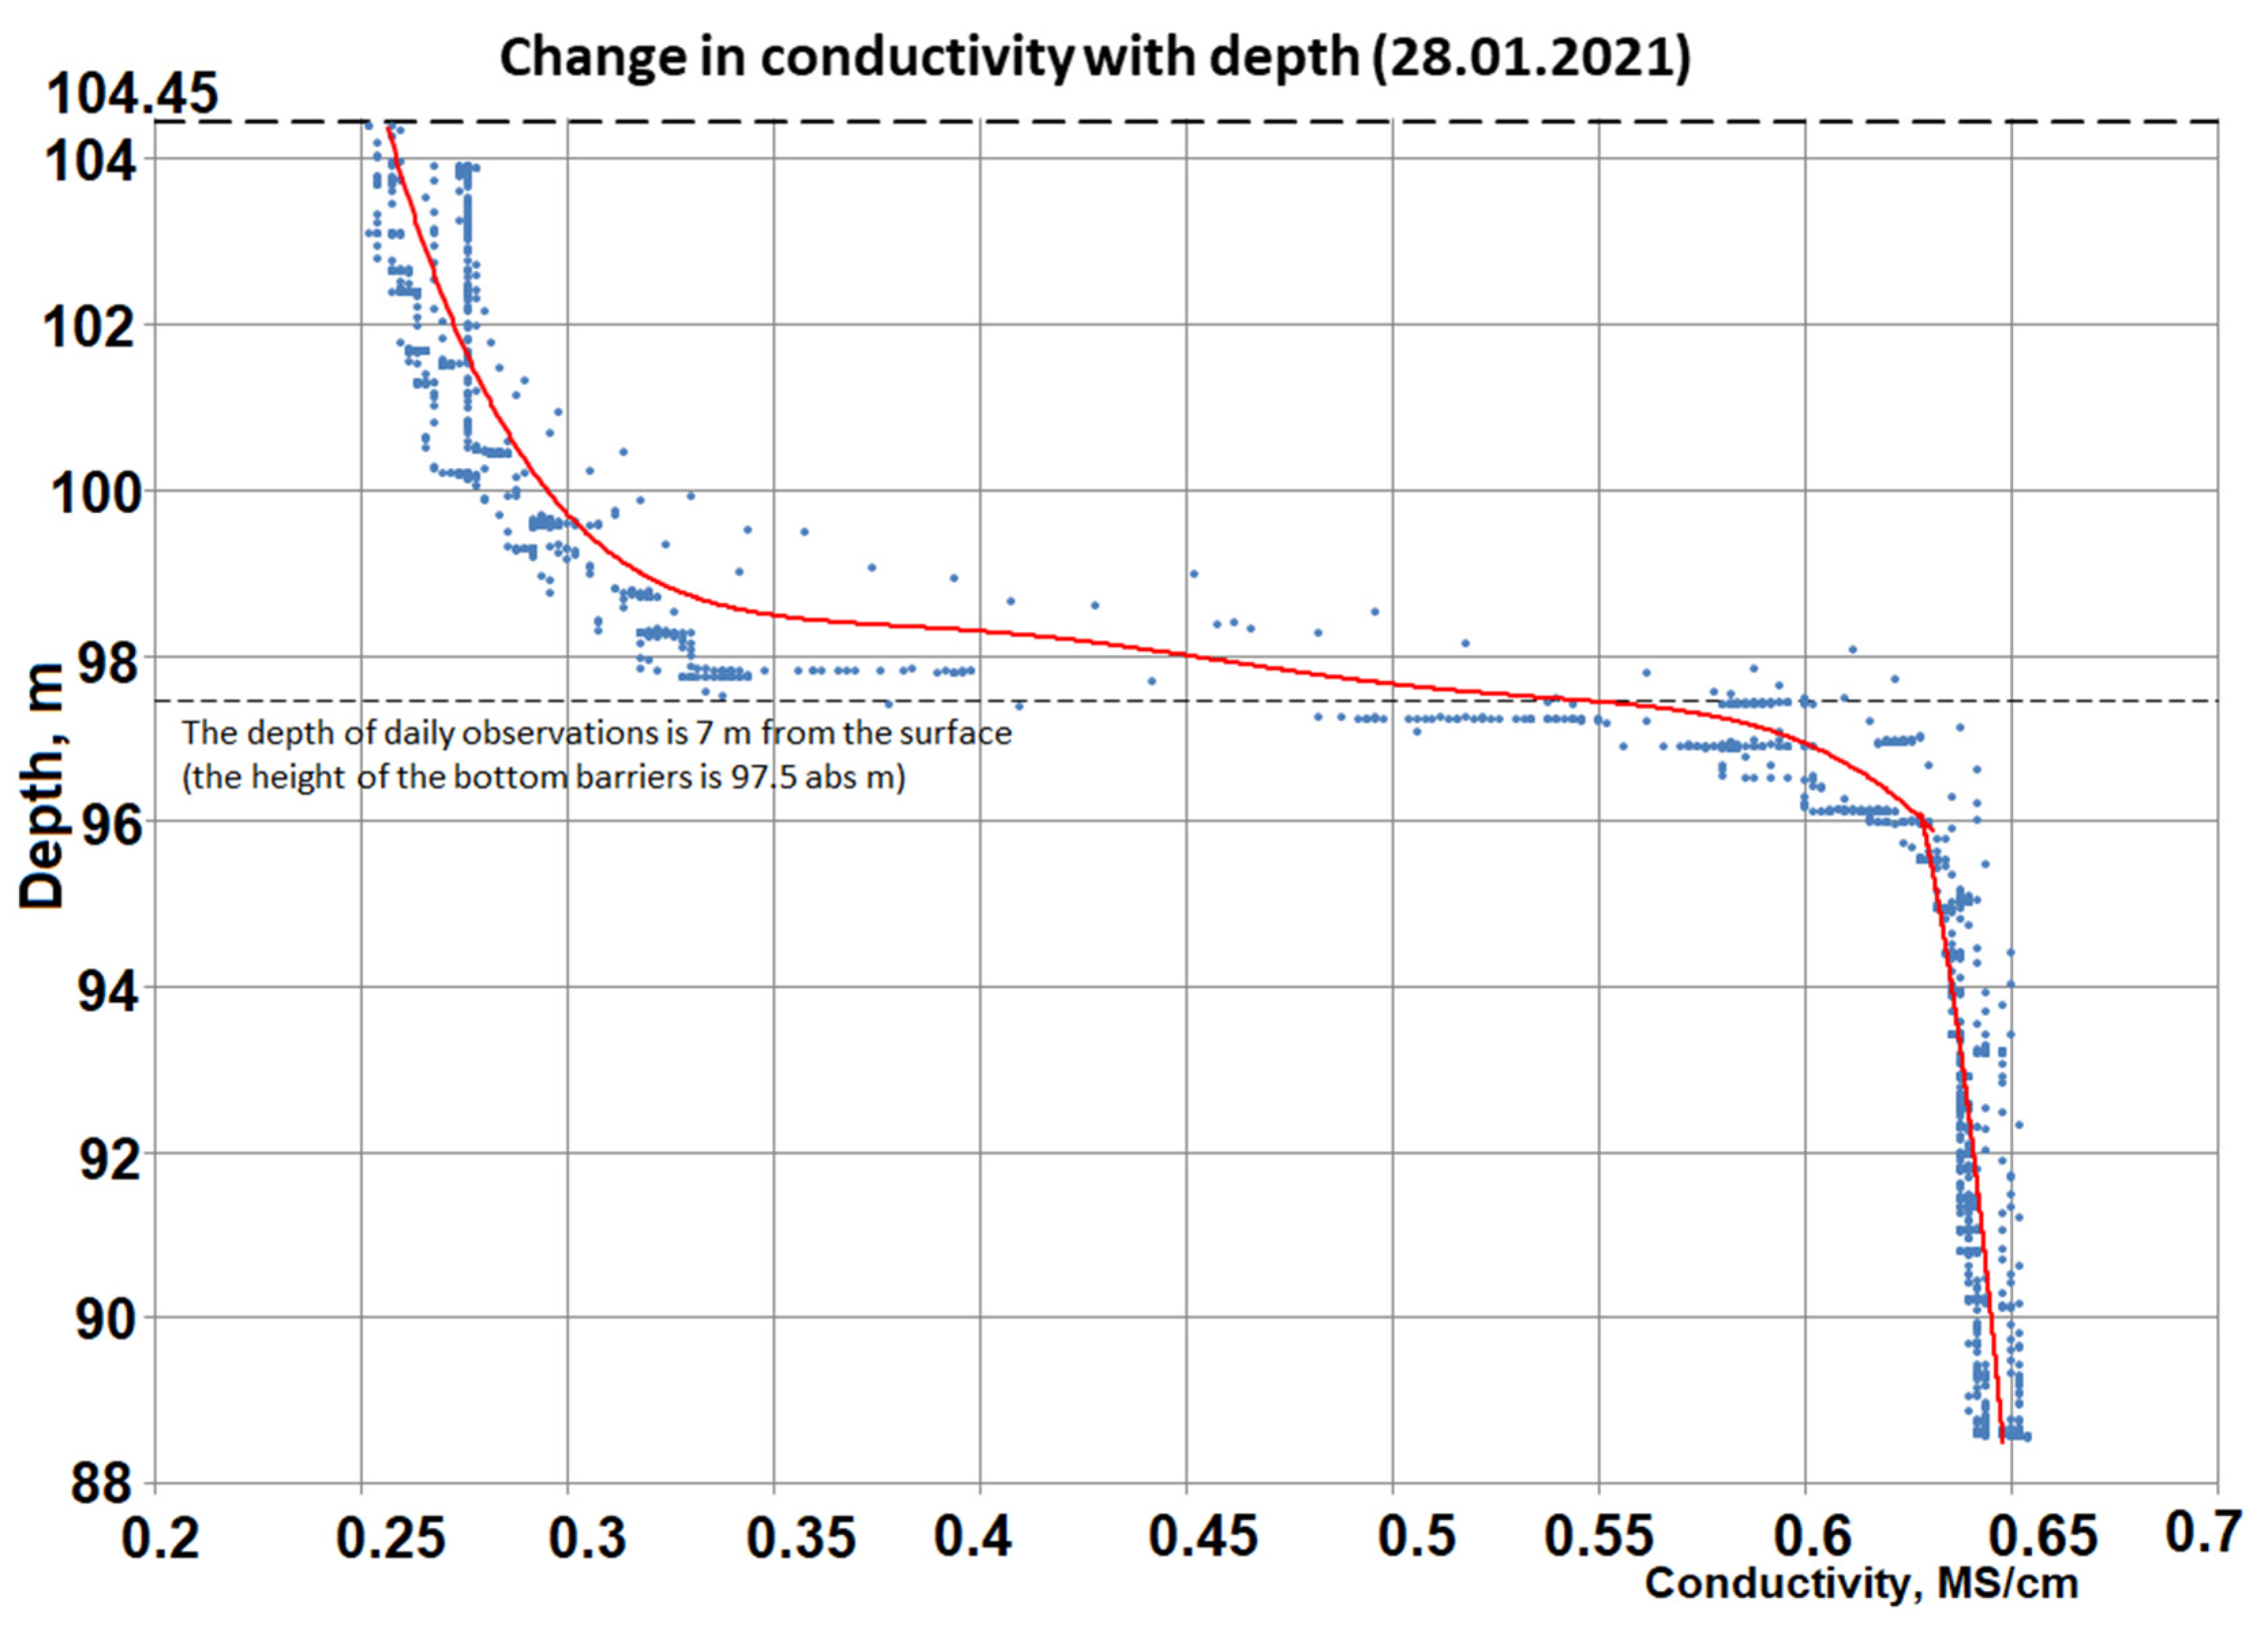
Significant sensitivity of water quality taken at the Chusovskoy water intake to the hydrodynamic regime of the upper pool of Kamskaya hydroelectric power station is due to the fact that (according to [15]) the hardness of water withdrawn during winter period is largely determined by the specific features of the confluence of the Chusovaya and Sylva rivers (Figure 1). It was proposed to construct bottom barriers around the intake heads, which made it possible to ensure sustainable selective withdrawal of less mineralized (and of lower hardness) water from the Chusovaya River (Figure 2).
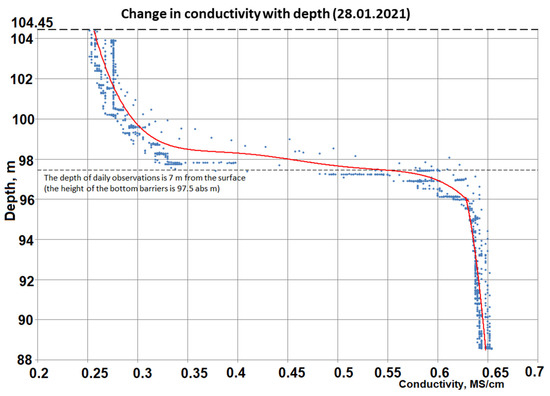
Figure 2.
Change of conductivity with depth (28 January 2021).
The specific features of the hydrochemical regimes of the Sylva and Chusovaya rivers are determined by a significant difference in the soil−geochemical characteristics of their catchment areas. A significant part of the catchment area of the Sylva river. is occupied by soluble karst rocks. The total distance from the confluence of the Sylva and Chusovaya rivers to the Kamskaya HES dam is 24 km, and the distance to the considered water intake is ~6 km. The formation of a significant vertical stratification of water masses below the confluence of the Sylva and Chusovaya rivers in winter season is confirmed by the materials of long−term regular observations. The formation of a stable vertical stratification of water masses is discussed in our paper [15].
The limiting indicator of water quality at the considered water intake is the water hardness, determined by the content of calcium and magnesium ions. The density of water, which determines the vertical stratification of water masses, is determined by its mineralization—the total amount of macrocomponents dissolved in it. At the same time, it should be emphasized that, in the case under consideration, the water hardness and its mineralization are very closely statistically related to each other, the correlation coefficient is very high and amounts to ~0.95–0.98.
In view of the operating characteristics of the Kama reservoir, the upper mark of these barriers has been set at the level of 98 m abs. In this regard, the hydrodynamic regime in the Chusovskoy water intake area is one of the main factors determining the stability of the operation of this water intake. Since 2020—the year of putting into operation the 3rd stage of the Chusovskoy water intake and the bottom barriers—the study of the structure of flows generated due to the significant intraday variability of water discharge regime at Kamskaya HPP (Figure 3) and its impact on the quality of the withdrawn water has become a matter of urgency.
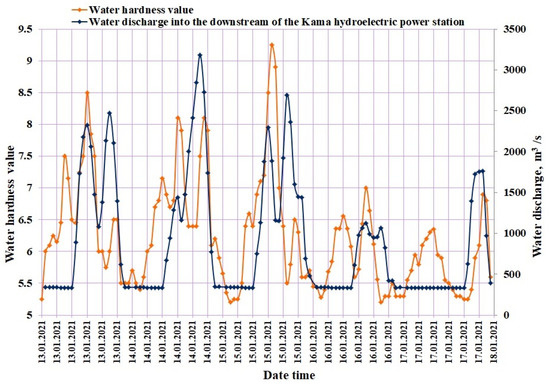
Figure 3.
Superimposed graphs of the flow rate of water discharge through the Kamskaya HPS and the values of electrical conductivity in the intake chamber of the Chusovskoy water intake of Perm city (for the period of 13 January 2021–18 January 2021).
The focus of this article is on the study of the abovementioned problems. It consists of two closely related sections:
- -
- Assessment of the intraday non−uniformity in the operation of the Kamskaya HPS and its influence on the hydrodynamic regime of the upper pool;
- -
- Development of the model and performance of numerical computation in the 3D formulation in order to evaluate the influence of intraday non−uniformity of hydrodynamic characteristics on the quality of withdrawn water.
2. Material and Methods
The use of modern measuring devices makes it possible to perform the required set of hydrometric measurements with high reliability and in greater detail. In this study, the MIDAS ECM flow velocity meter manufactured by the Valeport company was used as the main working instrument for making such measurements [18]. This instrument is a universal point−wise flow meter designed for continuous operation in an automatic mode. The Valeport’s electronics architecture allows for the connection of many additional sensors, as well as various communication options. This makes it one of the few multi−parameter flow velocity meters which, owing to its long cable (up to several thousand meters), can operate in real time and can be used independently. The flow velocity range of this instrument is 0.001 m/s to 5 m/s. The instrument is an electromagnetic flow velocity meter that is based on the Faraday principle. It can also determine physical properties of the water mass: electrical conductivity, temperature, pressure, and turbidity.
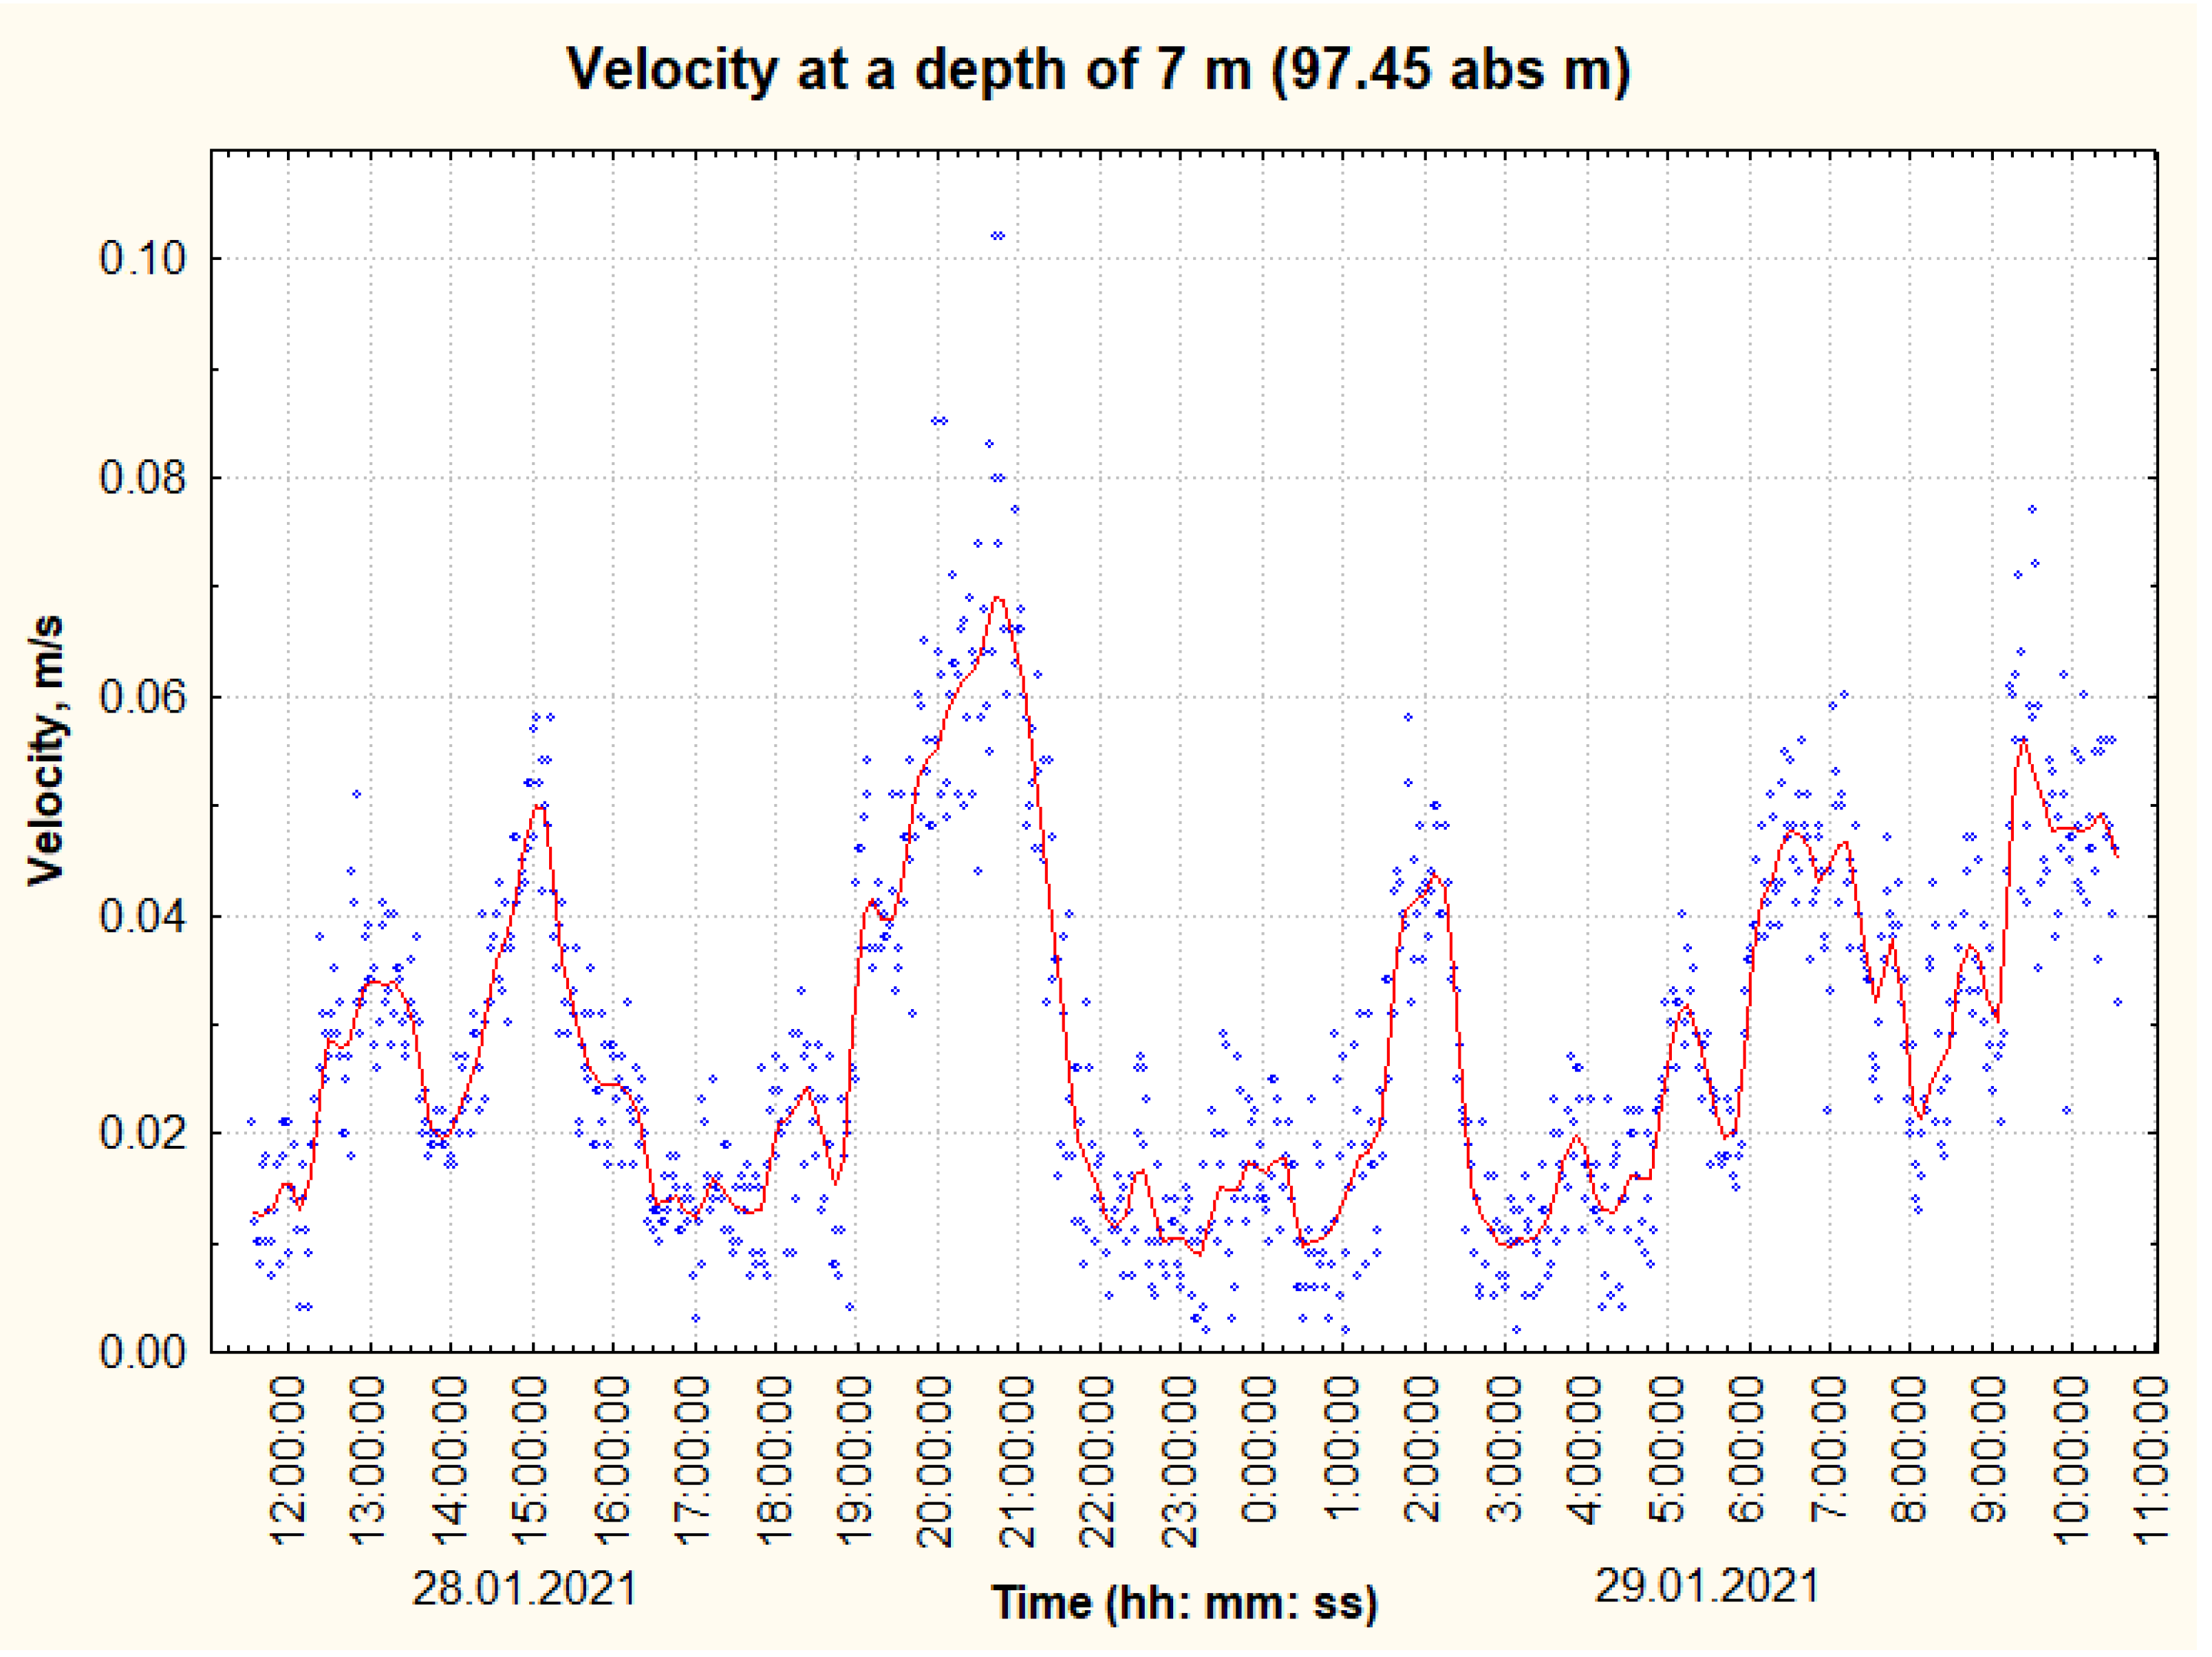
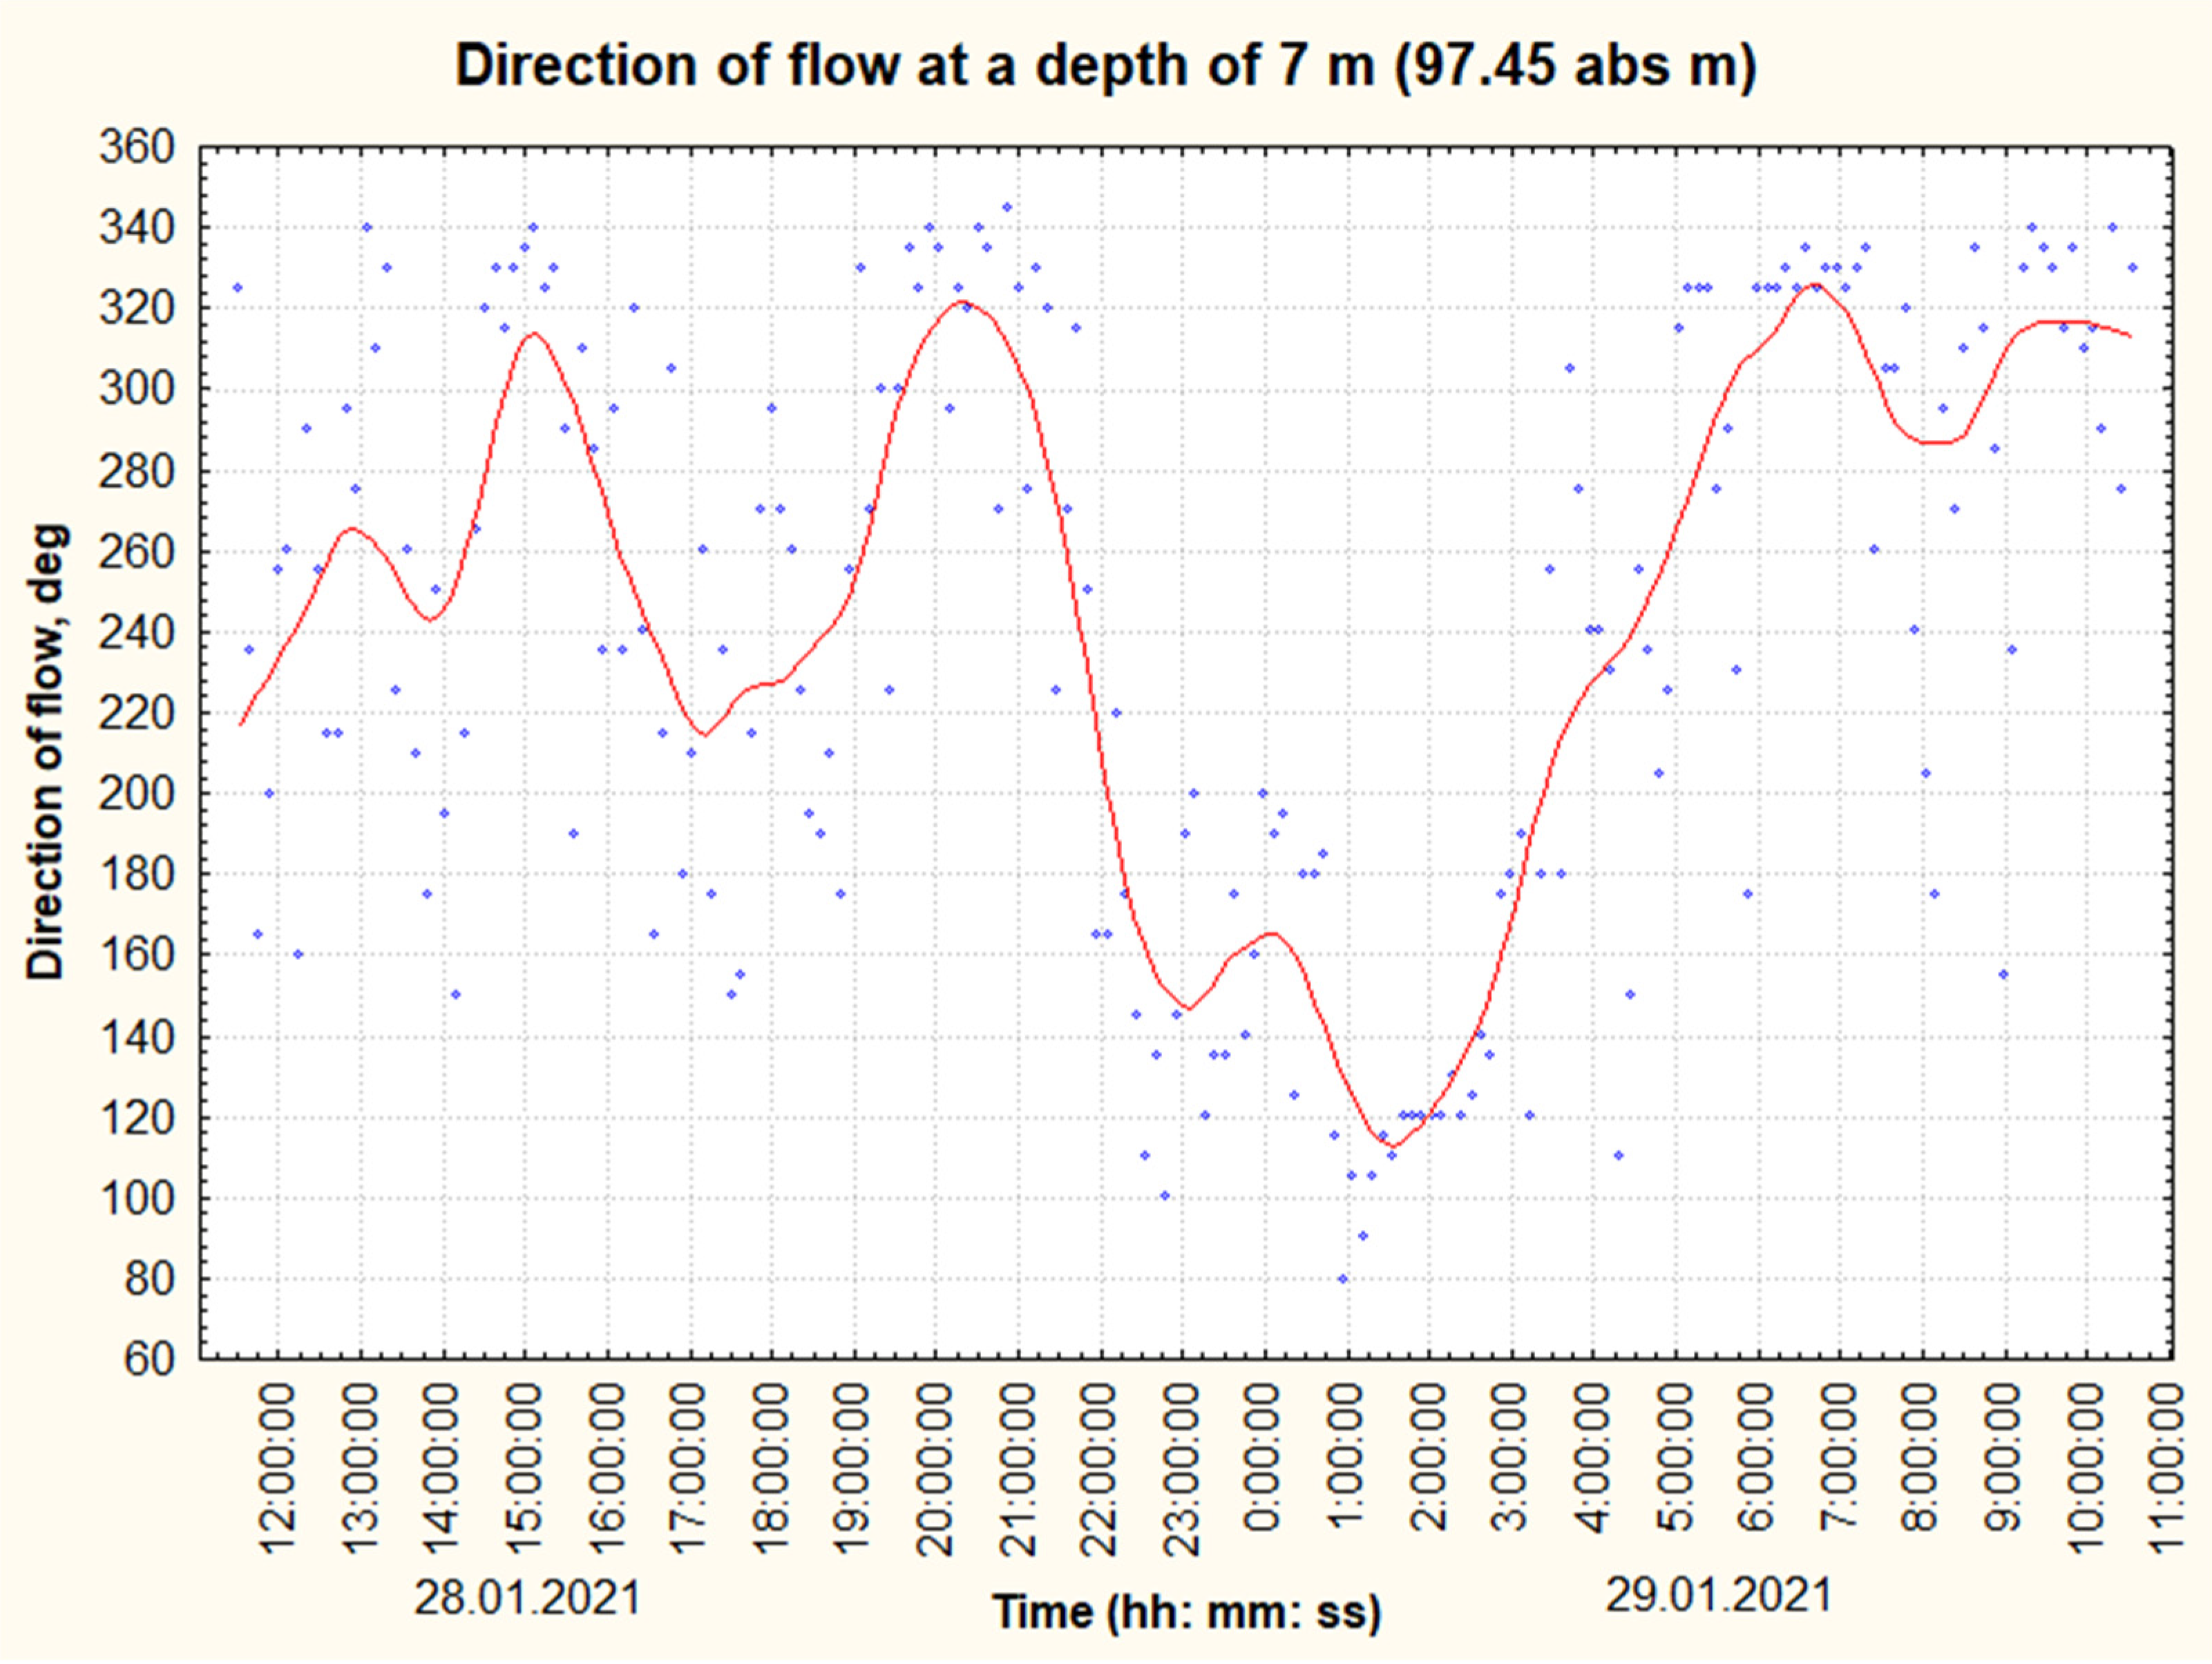
In order to achieve the goal, namely, to estimate changes in dynamic (velocity and direction of flows) and physical (electric conductivity of water) characteristics of the flow in the location area of the head of the Chusovskoy water intake, we conducted a series of field observations. The first stage of this work involved the study of changes in the specific electrical conductivity along the depth of the reservoir at the location of the heads of water intake system. The results of the measurements are presented in Figure 2. It is seen that water masses in this section of the Kama reservoir area exhibit considerable vertical inhomogeneity, which is caused by the confluence of the Sylva and Chusovaya rivers, about 25 km upstream from the dam of the Kama reservoir. Further, the instrument was adjusted to autonomous operation and submersed to a depth of 7 m—the depth of water intake by the heads of the Chusovskoy water intake. The autonomous operation time of the device was 23 h. The results of these measurements were used to construct time dependences of velocities and directions of flows, as well as the specific conductivity (Figure 4 and Figure 5). The formation of stable vertical stratification of water masses in the Kama reservoir in winter season were considered and described by [15]. The main reason for the observed stratification being a large difference in the water salinities (and, accordingly, in the hardness) of the Sylva and Chusovaya rivers in winter season. The position of the density jump layer at a depth of 7 m was determined first by the water level maintained in the reservoir, and second, by the ratio of the flow rates in the Sylva and Chusovaya rivers. Long−term observations have shown that this position is quite stable.
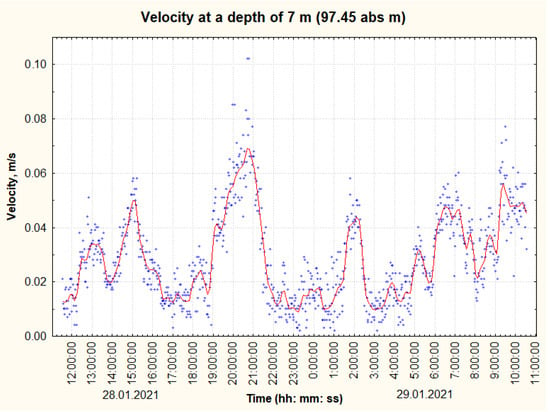
Figure 4.
Changes in the flow velocity modulus (m/s).
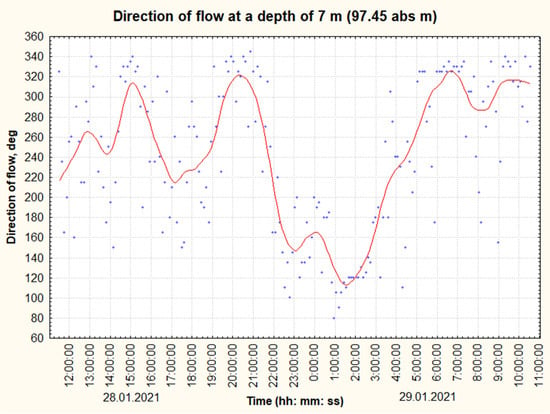
Figure 5.
Changes in the flow direction (degrees).
Figure 4 shows the variation of the velocity modulus over a 24-h period. Fluctuations in the range of 0.01–0.08 m/s are associated with certain phases of forward and backward waves generated due to the intraday non−uniformity of water discharge by the Kamskaya HPS. The presence of the above−mentioned waves is substantiated by the flow direction measurements. As can be seen from Figure 4, the main fluctuations are in the range of 120–340 degrees, i.e., within 24 h the flow direction at the point of measurement changed up to the opposite one.
Thus, the characteristic feature of this region of the Kama reservoir, including the confluence area of the Chusovaya and Sylva rivers, is the significant vertical density heterogeneity of water masses. The formation of inhomogeneity of vertical water masses and the behavior of their interface can be correctly investigated by the numerical simulation using a three−dimensional approach.
3. Methods of Numerical Investigation
A series of computational experiments was carried out to study the effect of the flow rate of water withdrawal on the quality of water taken through a separate water intake head. Computational experiments were carried out in a three−dimensional formulation in the framework of the ANSYS Fluent computational fluid dynamics package, in which the k − ε model is used to describe turbulent pulsations. The problem was solved within the framework of an unsteady approach.
The flow was considered as isothermal, the density was considered dependent on the salinity of the water. The calculations were carried out using the supercomputer of the Ural Branch of the Russian Academy of Sciences (IMM UB RAS).
The three−dimensional calculations were based on the Reynolds−averaged Navier–Stokes equations:
where is the density, are the coordinates (we used a Cartesian coordinate system), are the velocity components, is the kinematic viscosity, and is the turbulent viscosity.
Turbulence kinetic energy and the rate of its dissipation, , were obtained from the following transport equations:
In these equations, represents the generation of turbulence kinetic energy due to the mean velocity gradients , where is the modulus of the mean strain rate tensor, defined as , , is the turbulence kinetic energy due to buoyancy, where is calculated as , (which takes into account the dependence of the density on the concentration), is the thermal expansion coefficient, is the parameter of density stratification due to the concentration, is the turbulent Prandtl number, is the component of the gravitational vector in the i−th direction; , , and are constants, and and are the turbulent Prandtl numbers for and , respectively.
The turbulent viscosity is computed as follows: , where is a constant. The model constants , , ,, and were assumed to have the following values: , , , , , .
The equation of mass transfer is:
where , is the mass flux, is the turbulent Schmidt number, and turbulent diffusion parameter describes the turbulent mass transfer.
The dependence of density on the concentration is defined according to the linear law , where and are the density and concentration of the water, respectively.
We set the no−slip condition and zero mass flux condition on the rigid boundaries:
At the entrance of the computational domain we imposed the velocity of the river, in which a component (perpendicular to the outfall axis) is the only non−zero constant, , and the concentration was set equal to the background concentration of pollutants in the river water.
The boundary conditions at the entrance were specified using the hydrodynamic data on the flow obtained in two−dimensional calculations.
The upper boundary of the computational domain was considered to be a non-deformable and stress−free surface; the conditions of vanishing normal component of the velocity and tangential stress and zero mass flux were set at this boundary:
The conditions at the outlet of the computational domain were overall mass balance correction (fully developed flow assumption):
and zero mass flux:
The intake head was located 1.5 m from the bottom, it had six windows of 3.5 m in height and 1.65 m in width with a total surface of 34.65 m2. The bottom barrier was square-shaped with dimensions of 8 m × 8 m and a height of 8 m. The lower boundary of the density jump layer was located 9 m from the bottom, the mineralization above the jump was 350 mg/L, and below the jump 900 mg/L. The depth of the river around the bottom barrier was 20 m.
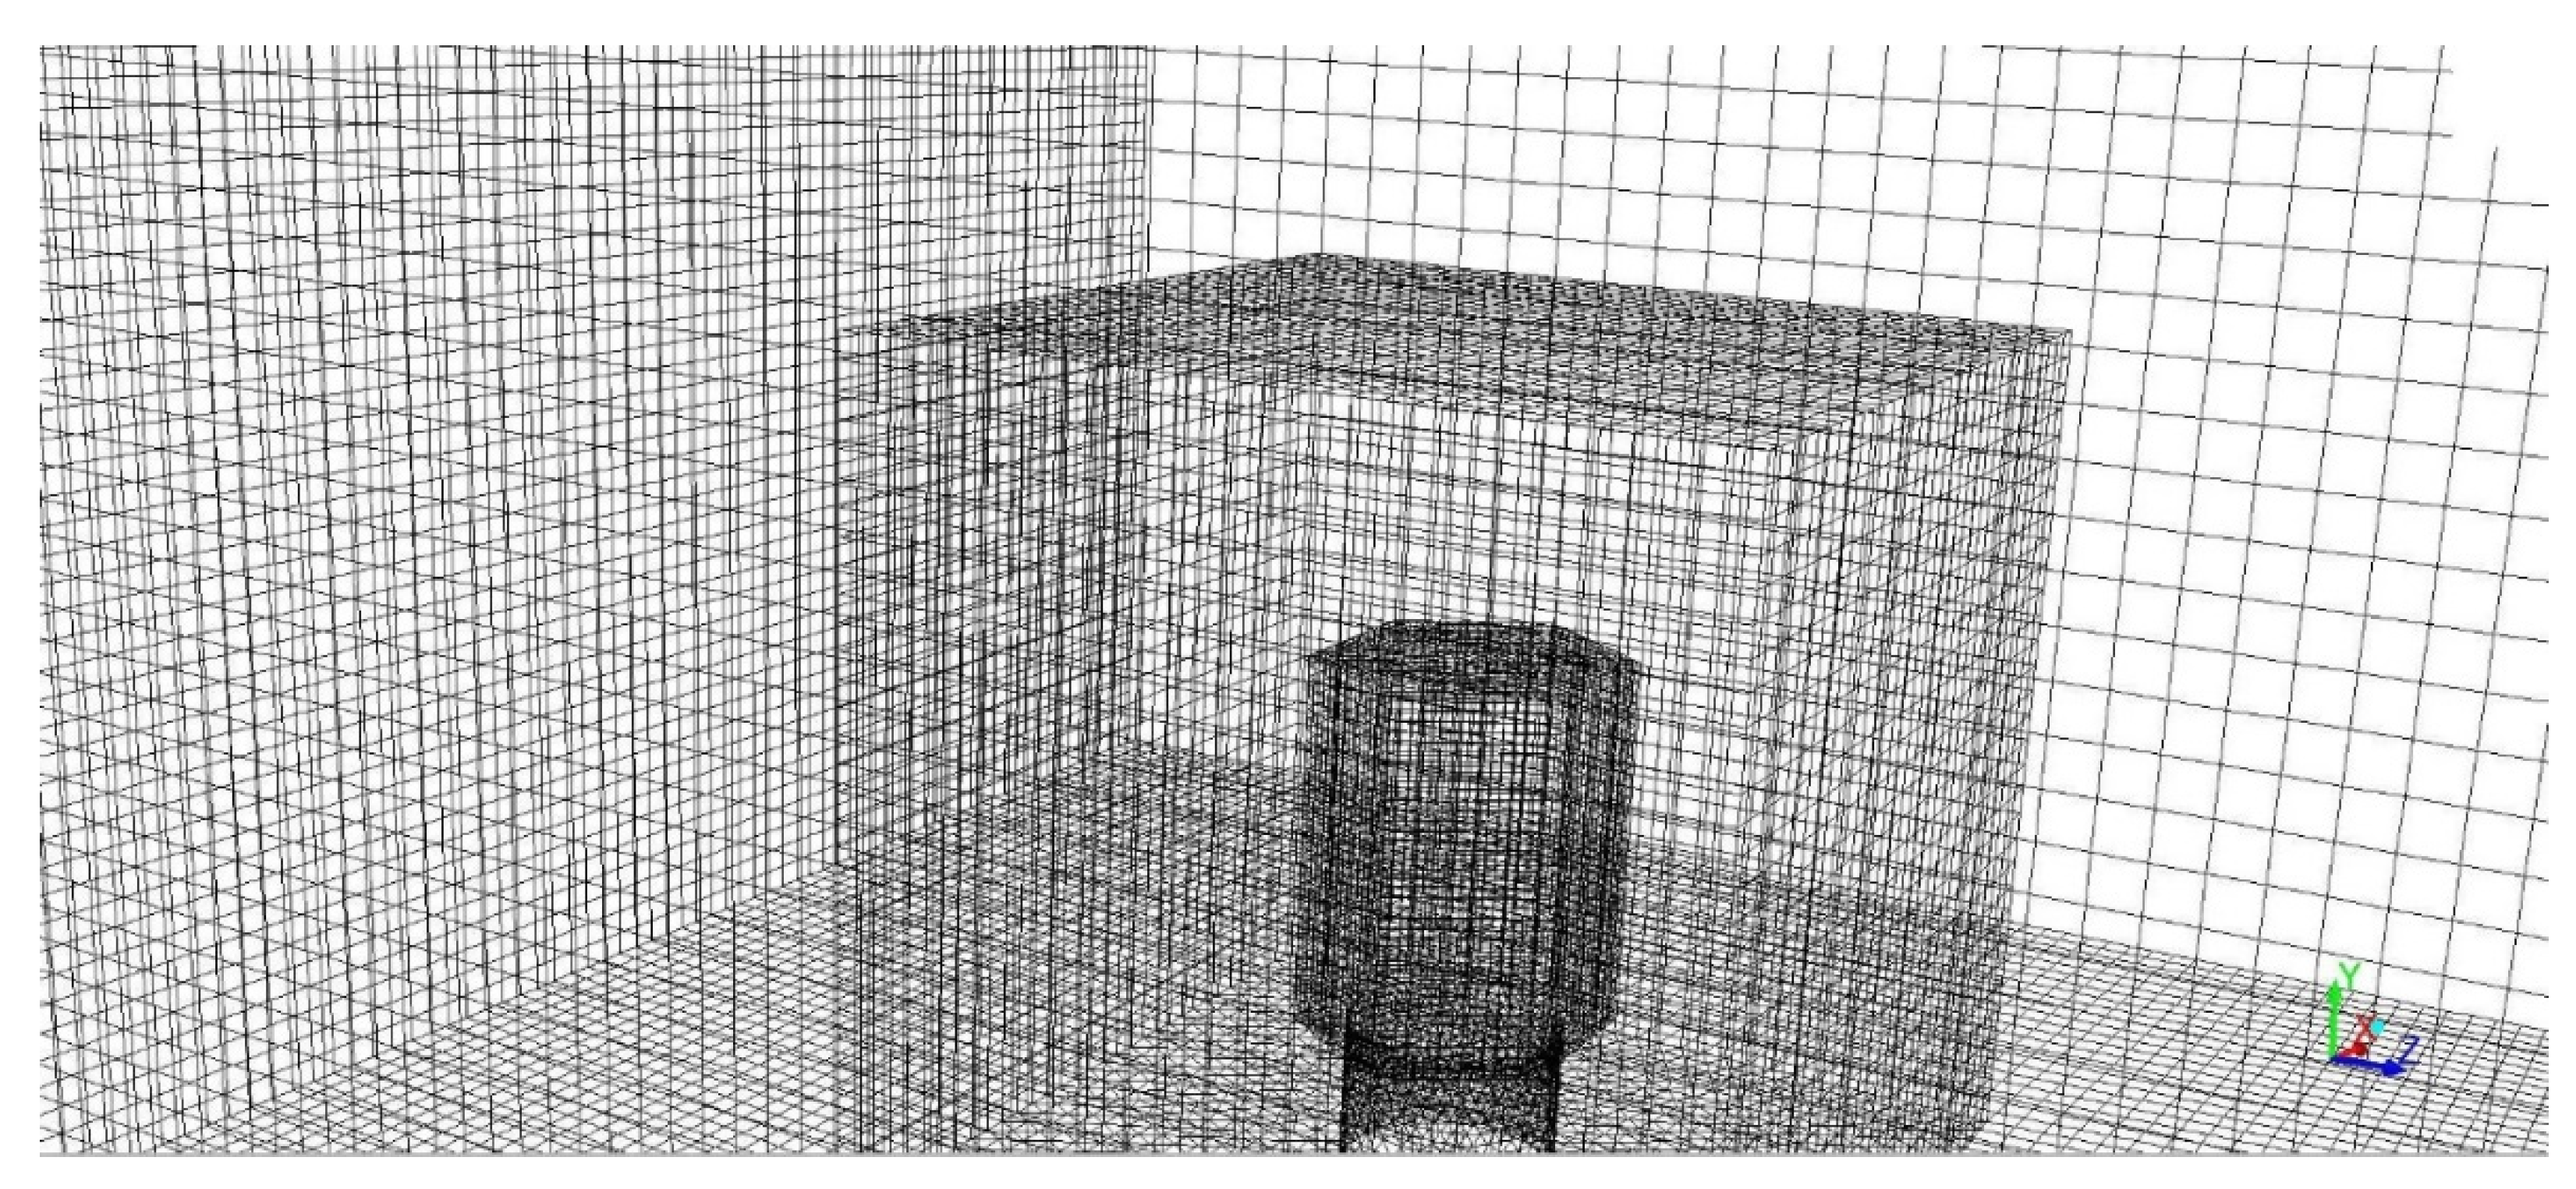
The computational grid is shown in Figure 6. The grid is non−uniform, with a refinement near the inlet of the water withdrawal pipe. The smallest grid spacing is 0.02 m, the largest 0.2 m. To select a working mesh, mesh sensitivity tests were performed. The total dimension of the mesh used for the calculations is about 570,000 nodes.
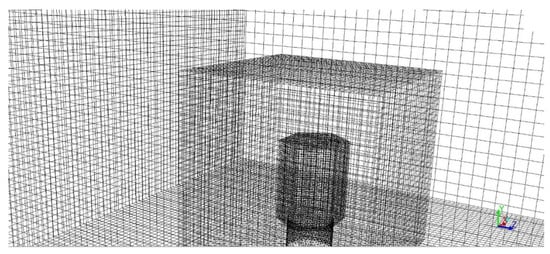
Figure 6.
Computational grid.
Numerical modeling was carried out using the finite volume method. For spatial discretization of the equations, a second−order accuracy scheme was used. The time derivative was written using second−order discretization based on inverse differences, then a multistage explicit time integration by the Runge–Kutta method was used.
3.1. Parameters of Scenarios for Numerical Modeling
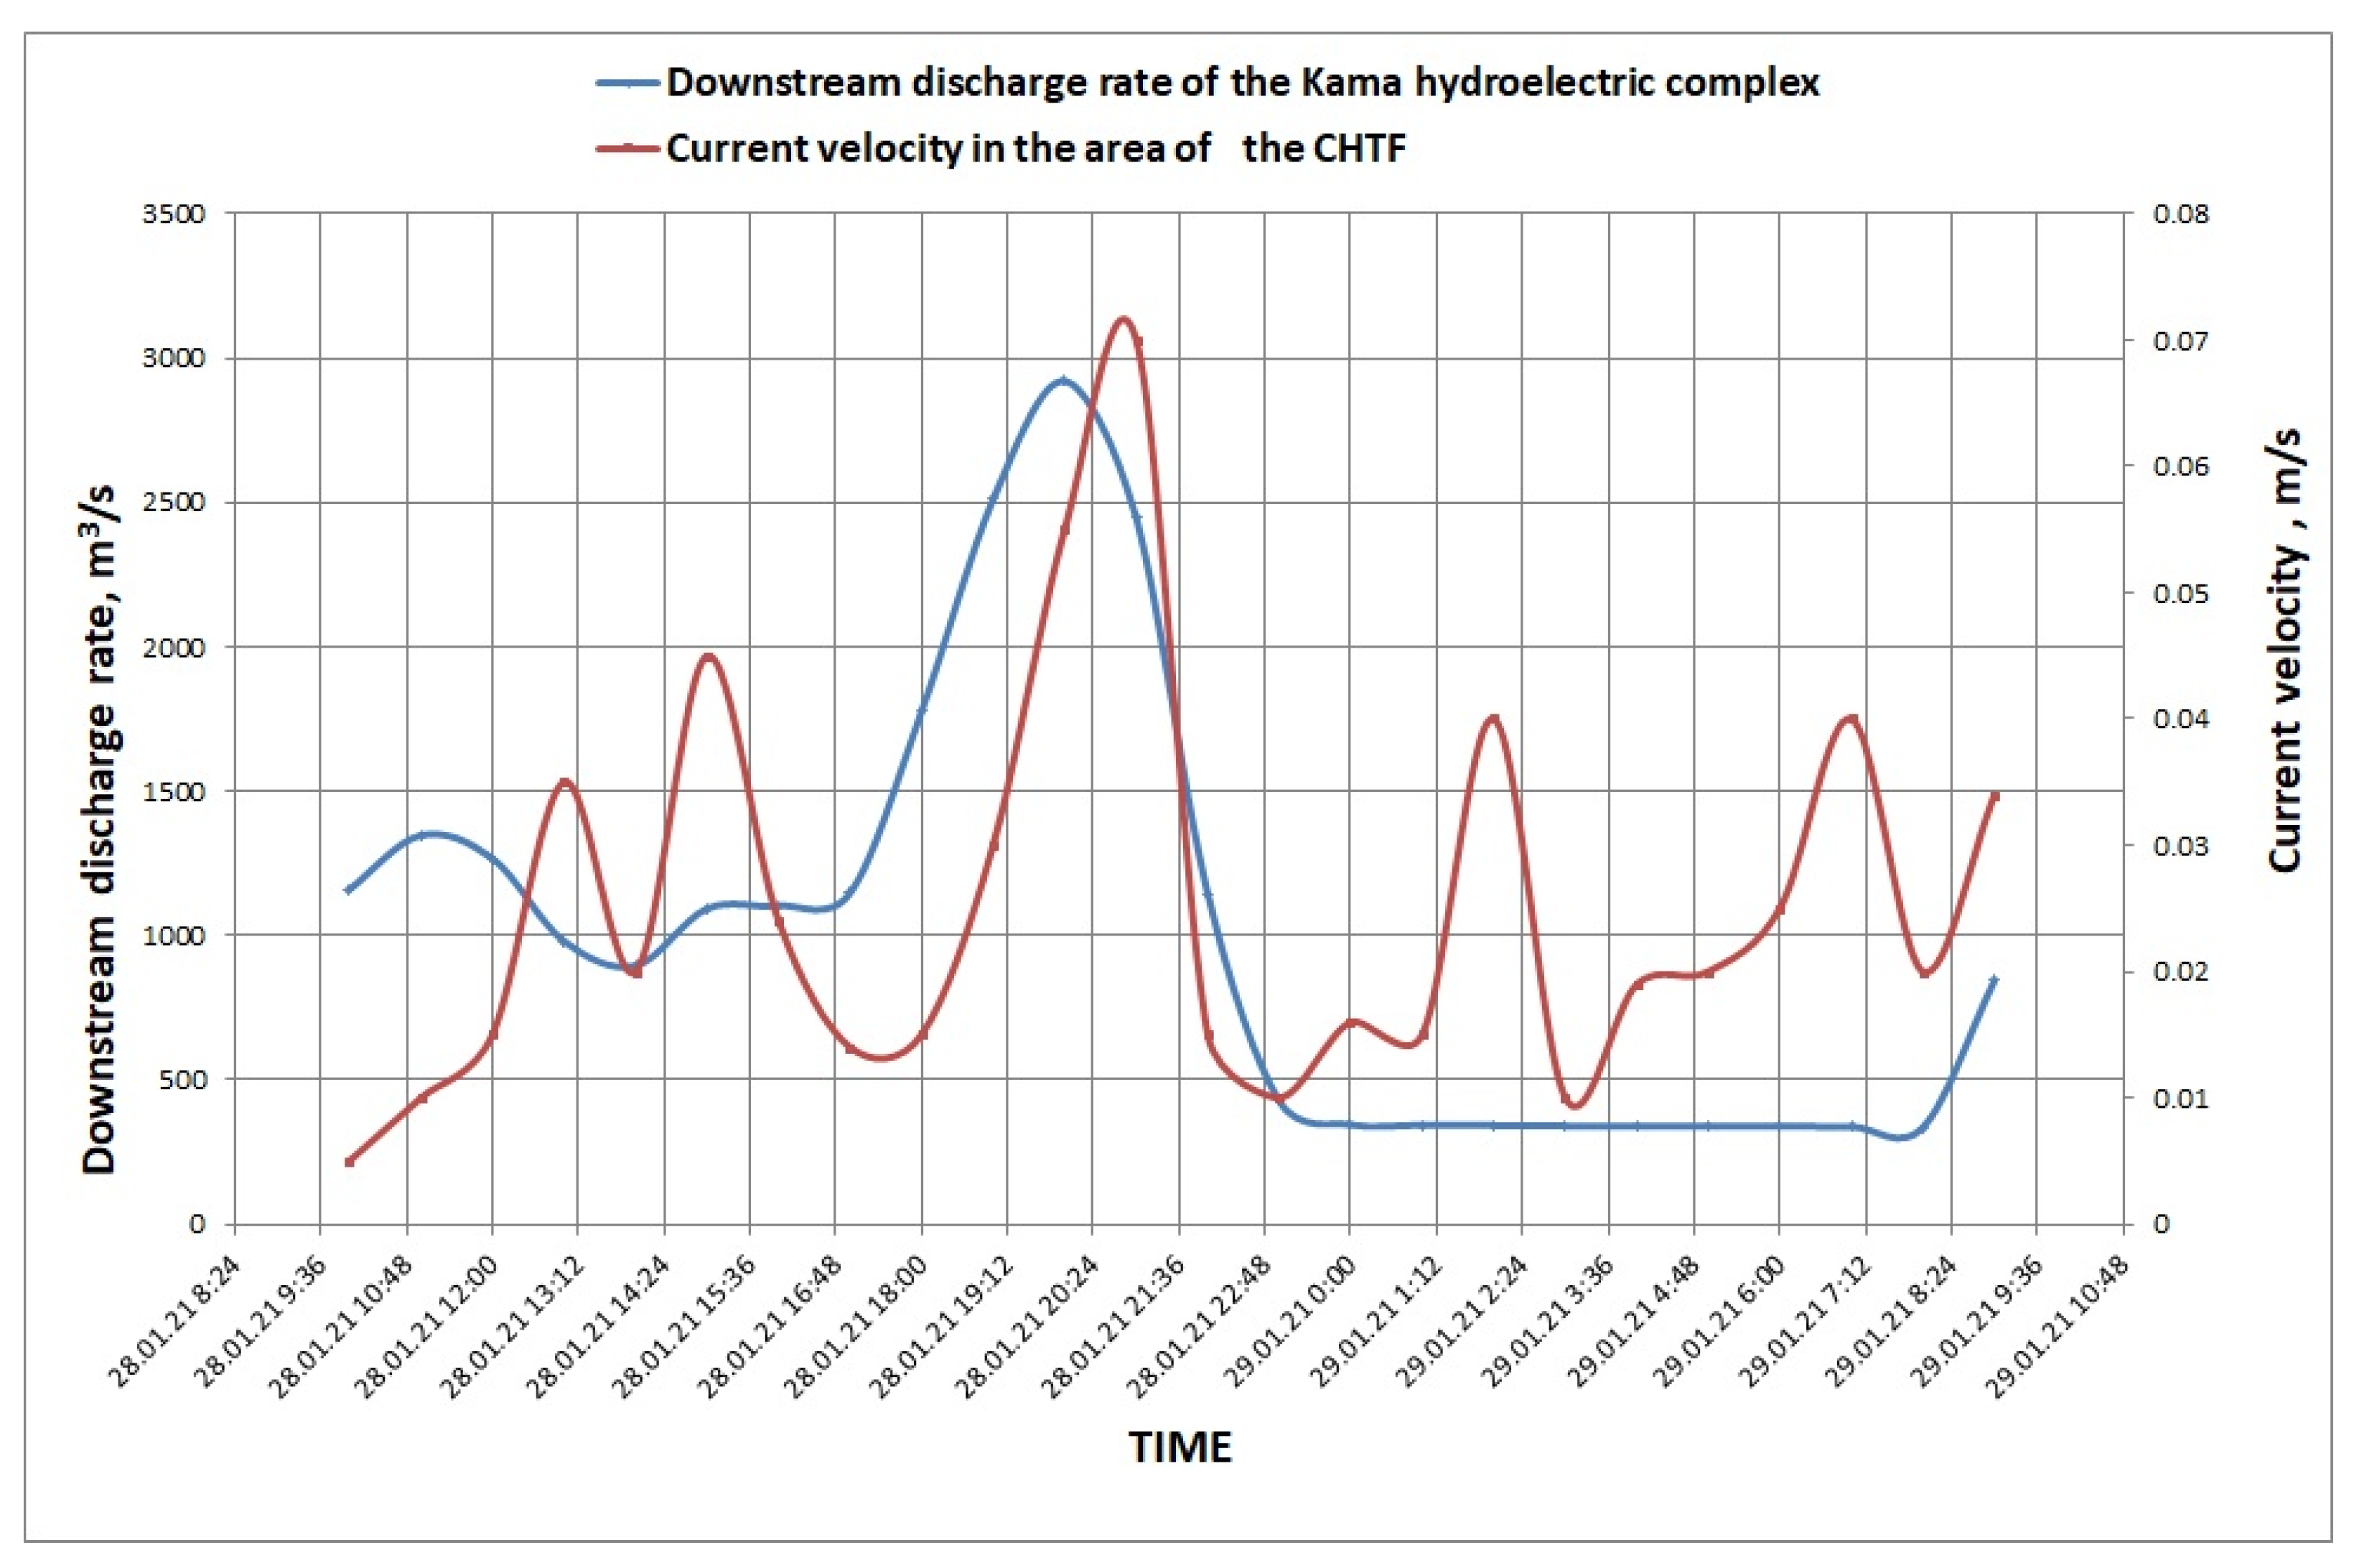
The hydrodynamic characteristics measured in the vicinity of the Chusovskoy water intake heads are compared with the flow rates of water discharge through the dam of Kamskaya HPS averaged over hours in Figure 7. The comparison clearly demonstrates that the water discharge through the dam of the Kamskaya HPS plays a decisive role in the formation of hydrodynamic regime in this particular section of the reservoir. At the same time, it is necessary to take into account the fact that the upper pools of large hydroelectric power stations are complicated non−linear oscillatory systems excited by a significant intraday non-uniformity of water discharge. The non−linearity of such oscillating systems can generate significant secondary flows of complex nature.
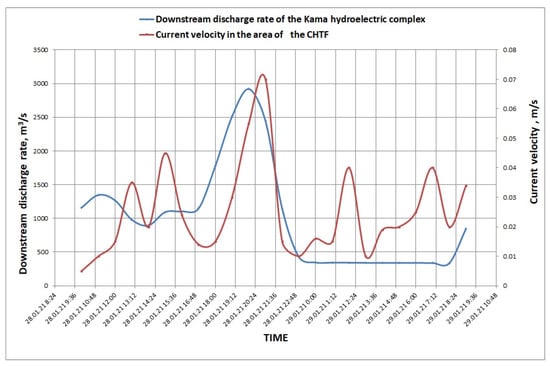
Figure 7.
Superimposed chronological graphs of flow rate and modulus of water velocity in the vicinity of the Chusovskoy water intake heads.
Here, it is to be noted that in the reservoir section immediately adjacent to the hydroelectric complex, the velocity and direction of the flow is determined solely by the upper pool discharge regime, whereas at a certain distance from this area the secondary flows, which may have opposite direction, can also play a significant role.
The presence of secondary flows essentially complicates the hydrodynamics of the reservoir section under examination. Therefore, it is of great interest to assess the impact of observed changes in the hydrodynamic regime on the quality of withdrawn water in the case of selective water intake by means of bottom barriers. In our study such estimates have been obtained by performing the computational experiments, which were based on the hydrodynamic model in the 3D formulation described above.
Numerical modeling was carried out for three scenarios, the parameters of which are given in Table 1.

Table 1.
Input data for calculations.
3.2. Results of Numerical Simulations and Discussion
In our study we were not interested in the situation outside the area of the barriers, therefore, the dimensions of the computational domain outside the barriers were determined solely for reasons of correct estimating the quality of water inside the barriers.
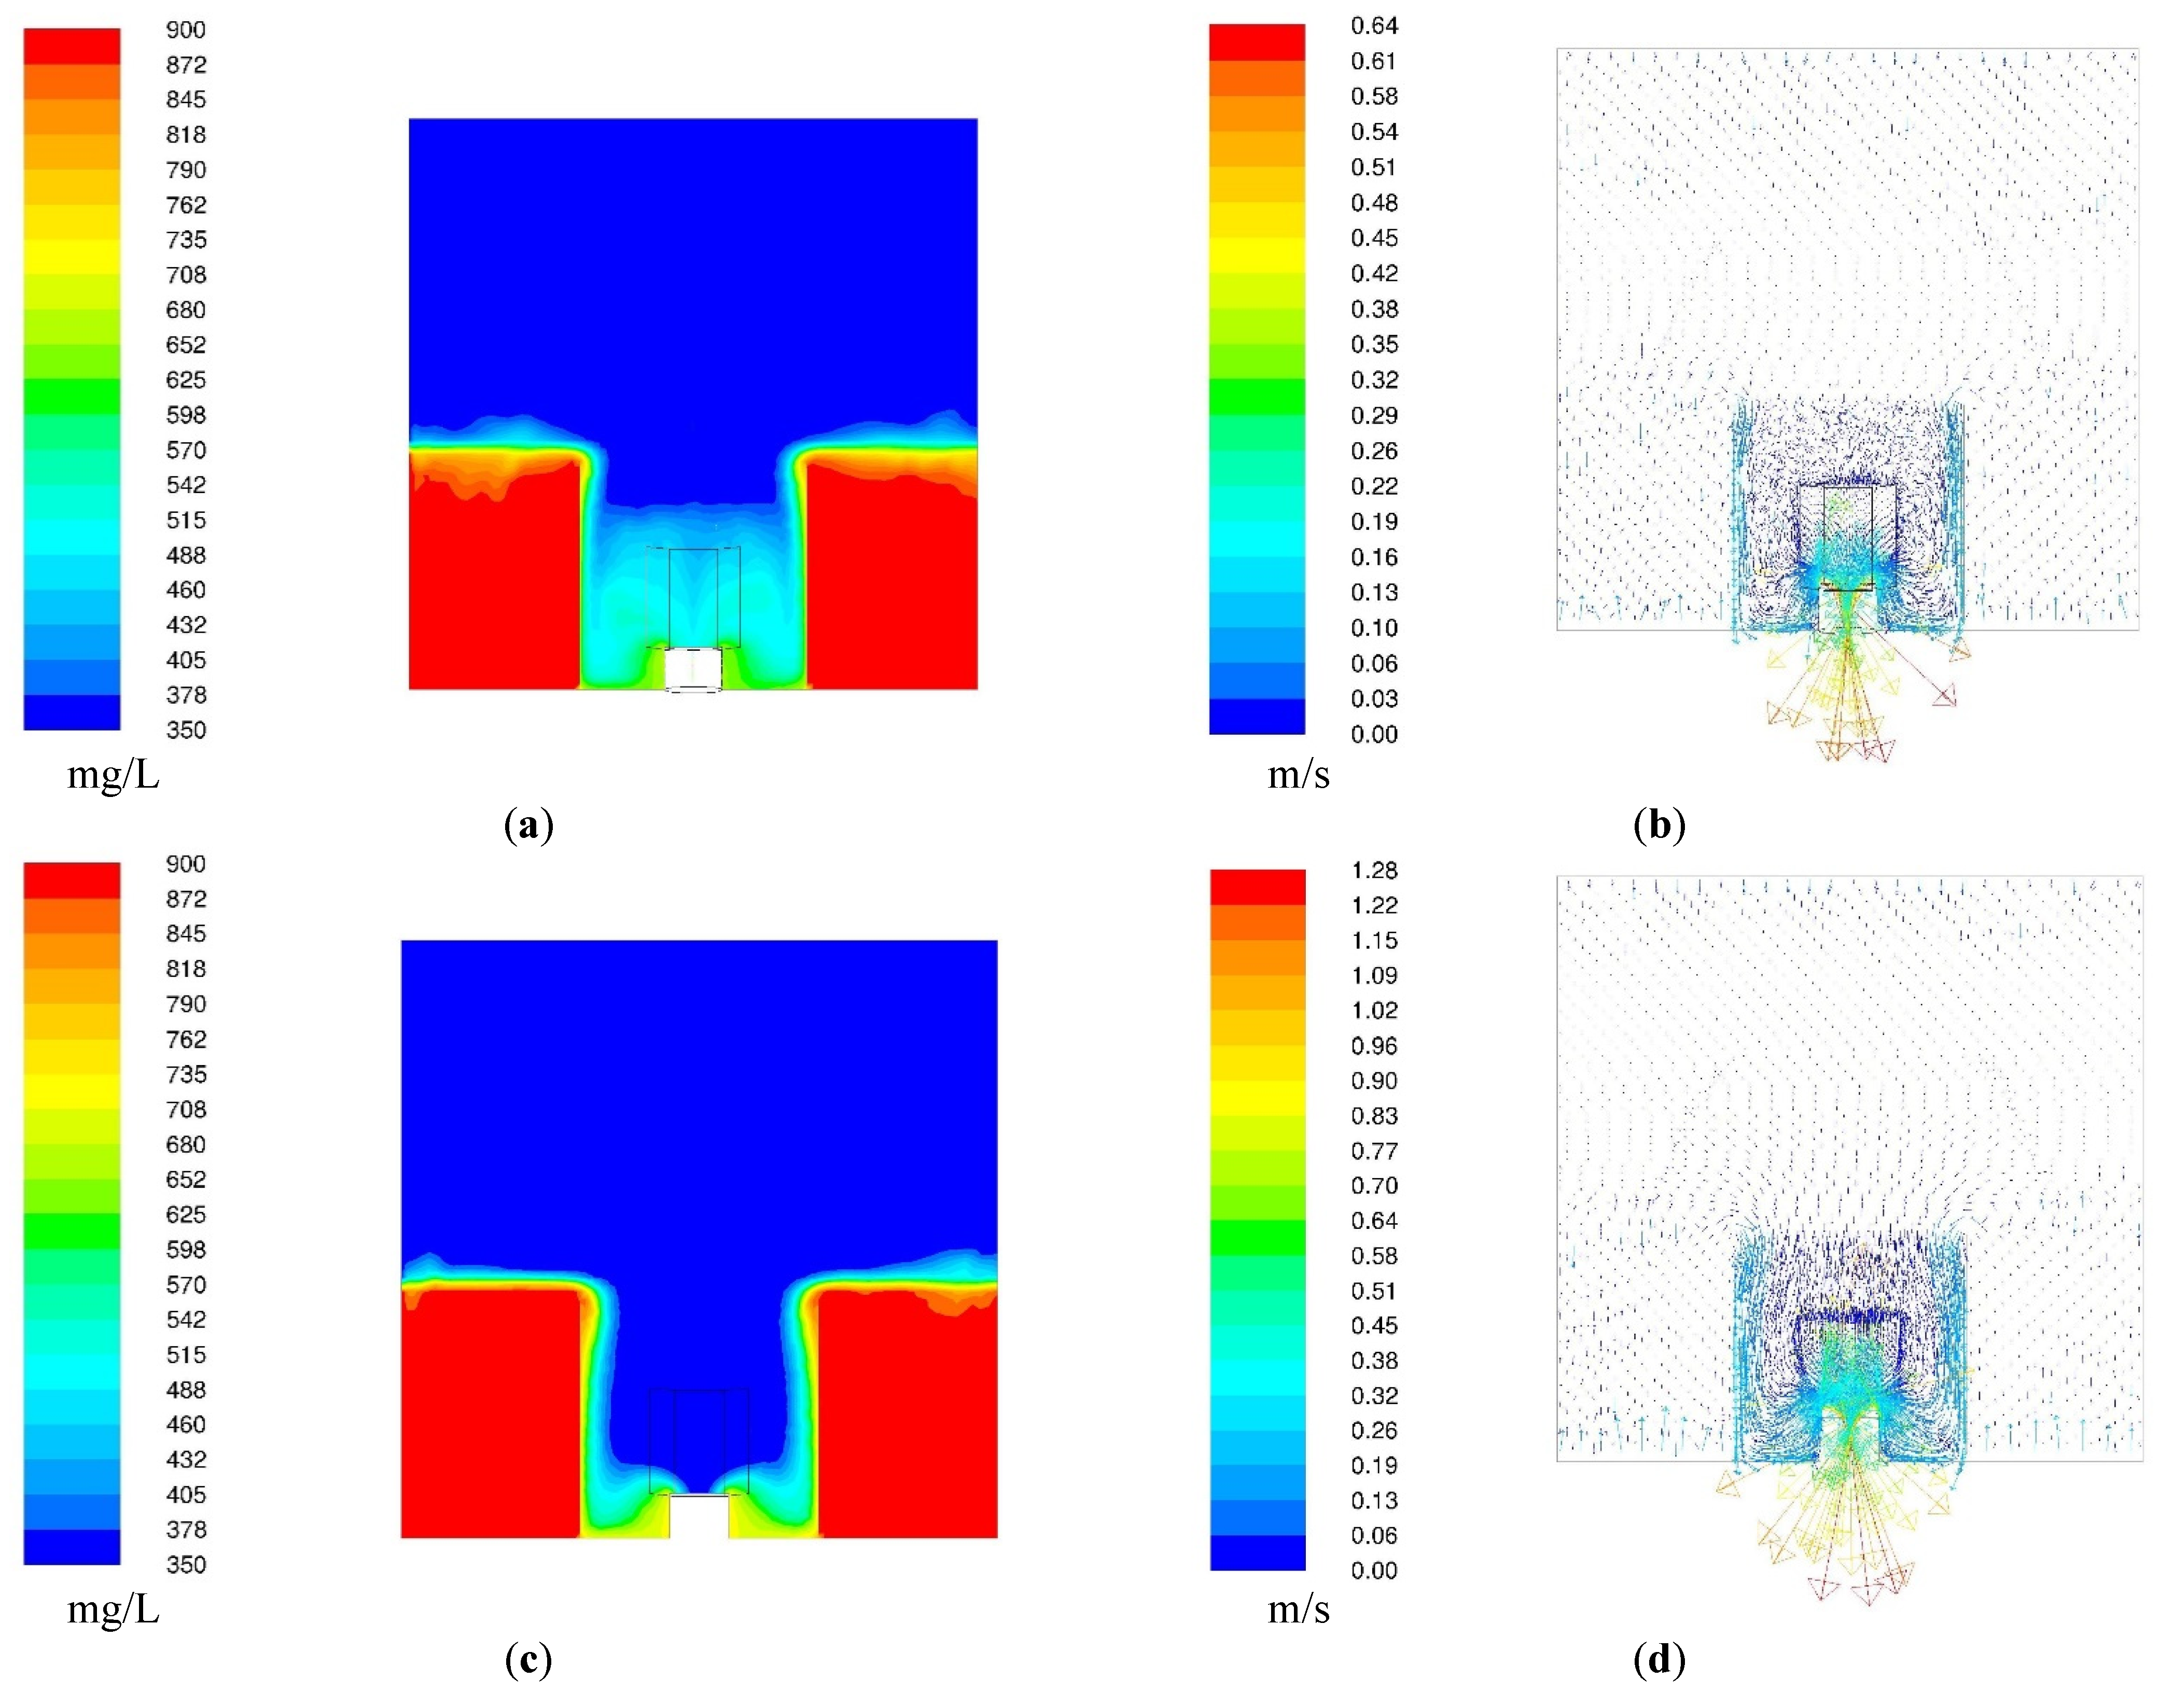
In this series of computational experiments, it was assumed that the layer of density jump is located 0.5 m above the upper mark of the bottom barrier. Since the flow rate of water withdrawal through a single intake head can vary considerably, it seems reasonable to first investigate the impact of the intake flow rate on the water quality. The results of computations under the assumption of zero velocity of the river flow are shown in Figure 8. The impurity concentration fields (a,c) and velocity vector fields (b,d) are shown in the vertical section in the middle of the computational domain.
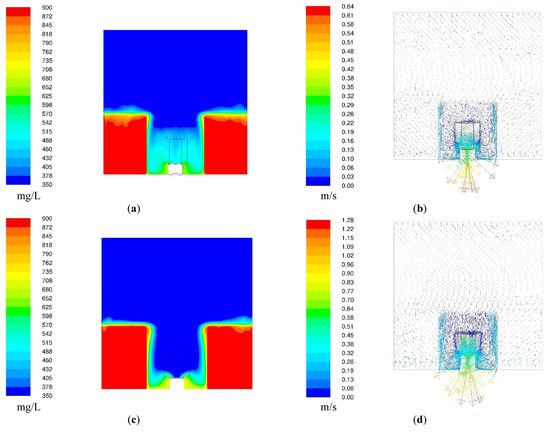
Figure 8.
Distribution of mineralization (a,c) and vector field of flow velocity (b,d) of withdrawn water in the area of the intake head with bottom barriers at the flow rate of the withdrawn water through one head of 2 m3/s (a,b) and 4 m3/s (c,d).
In this case, one should take into account the fact that total water mineralization is linearly related (R2 ~ 0.98) with the main limiting indicator of water quality in this water intake−hardness of withdrawn water. As follows from Figure 8, an increase of the intake flow rate provides more effective breaking of the density jump layer and accordingly lower mineralization and hardness of the withdrawn water. The mineralization of the withdrawn water at the intake flow rate of 4 m3/s becomes more than half as much as the mineralization at the flow rate of 4 m3/s.
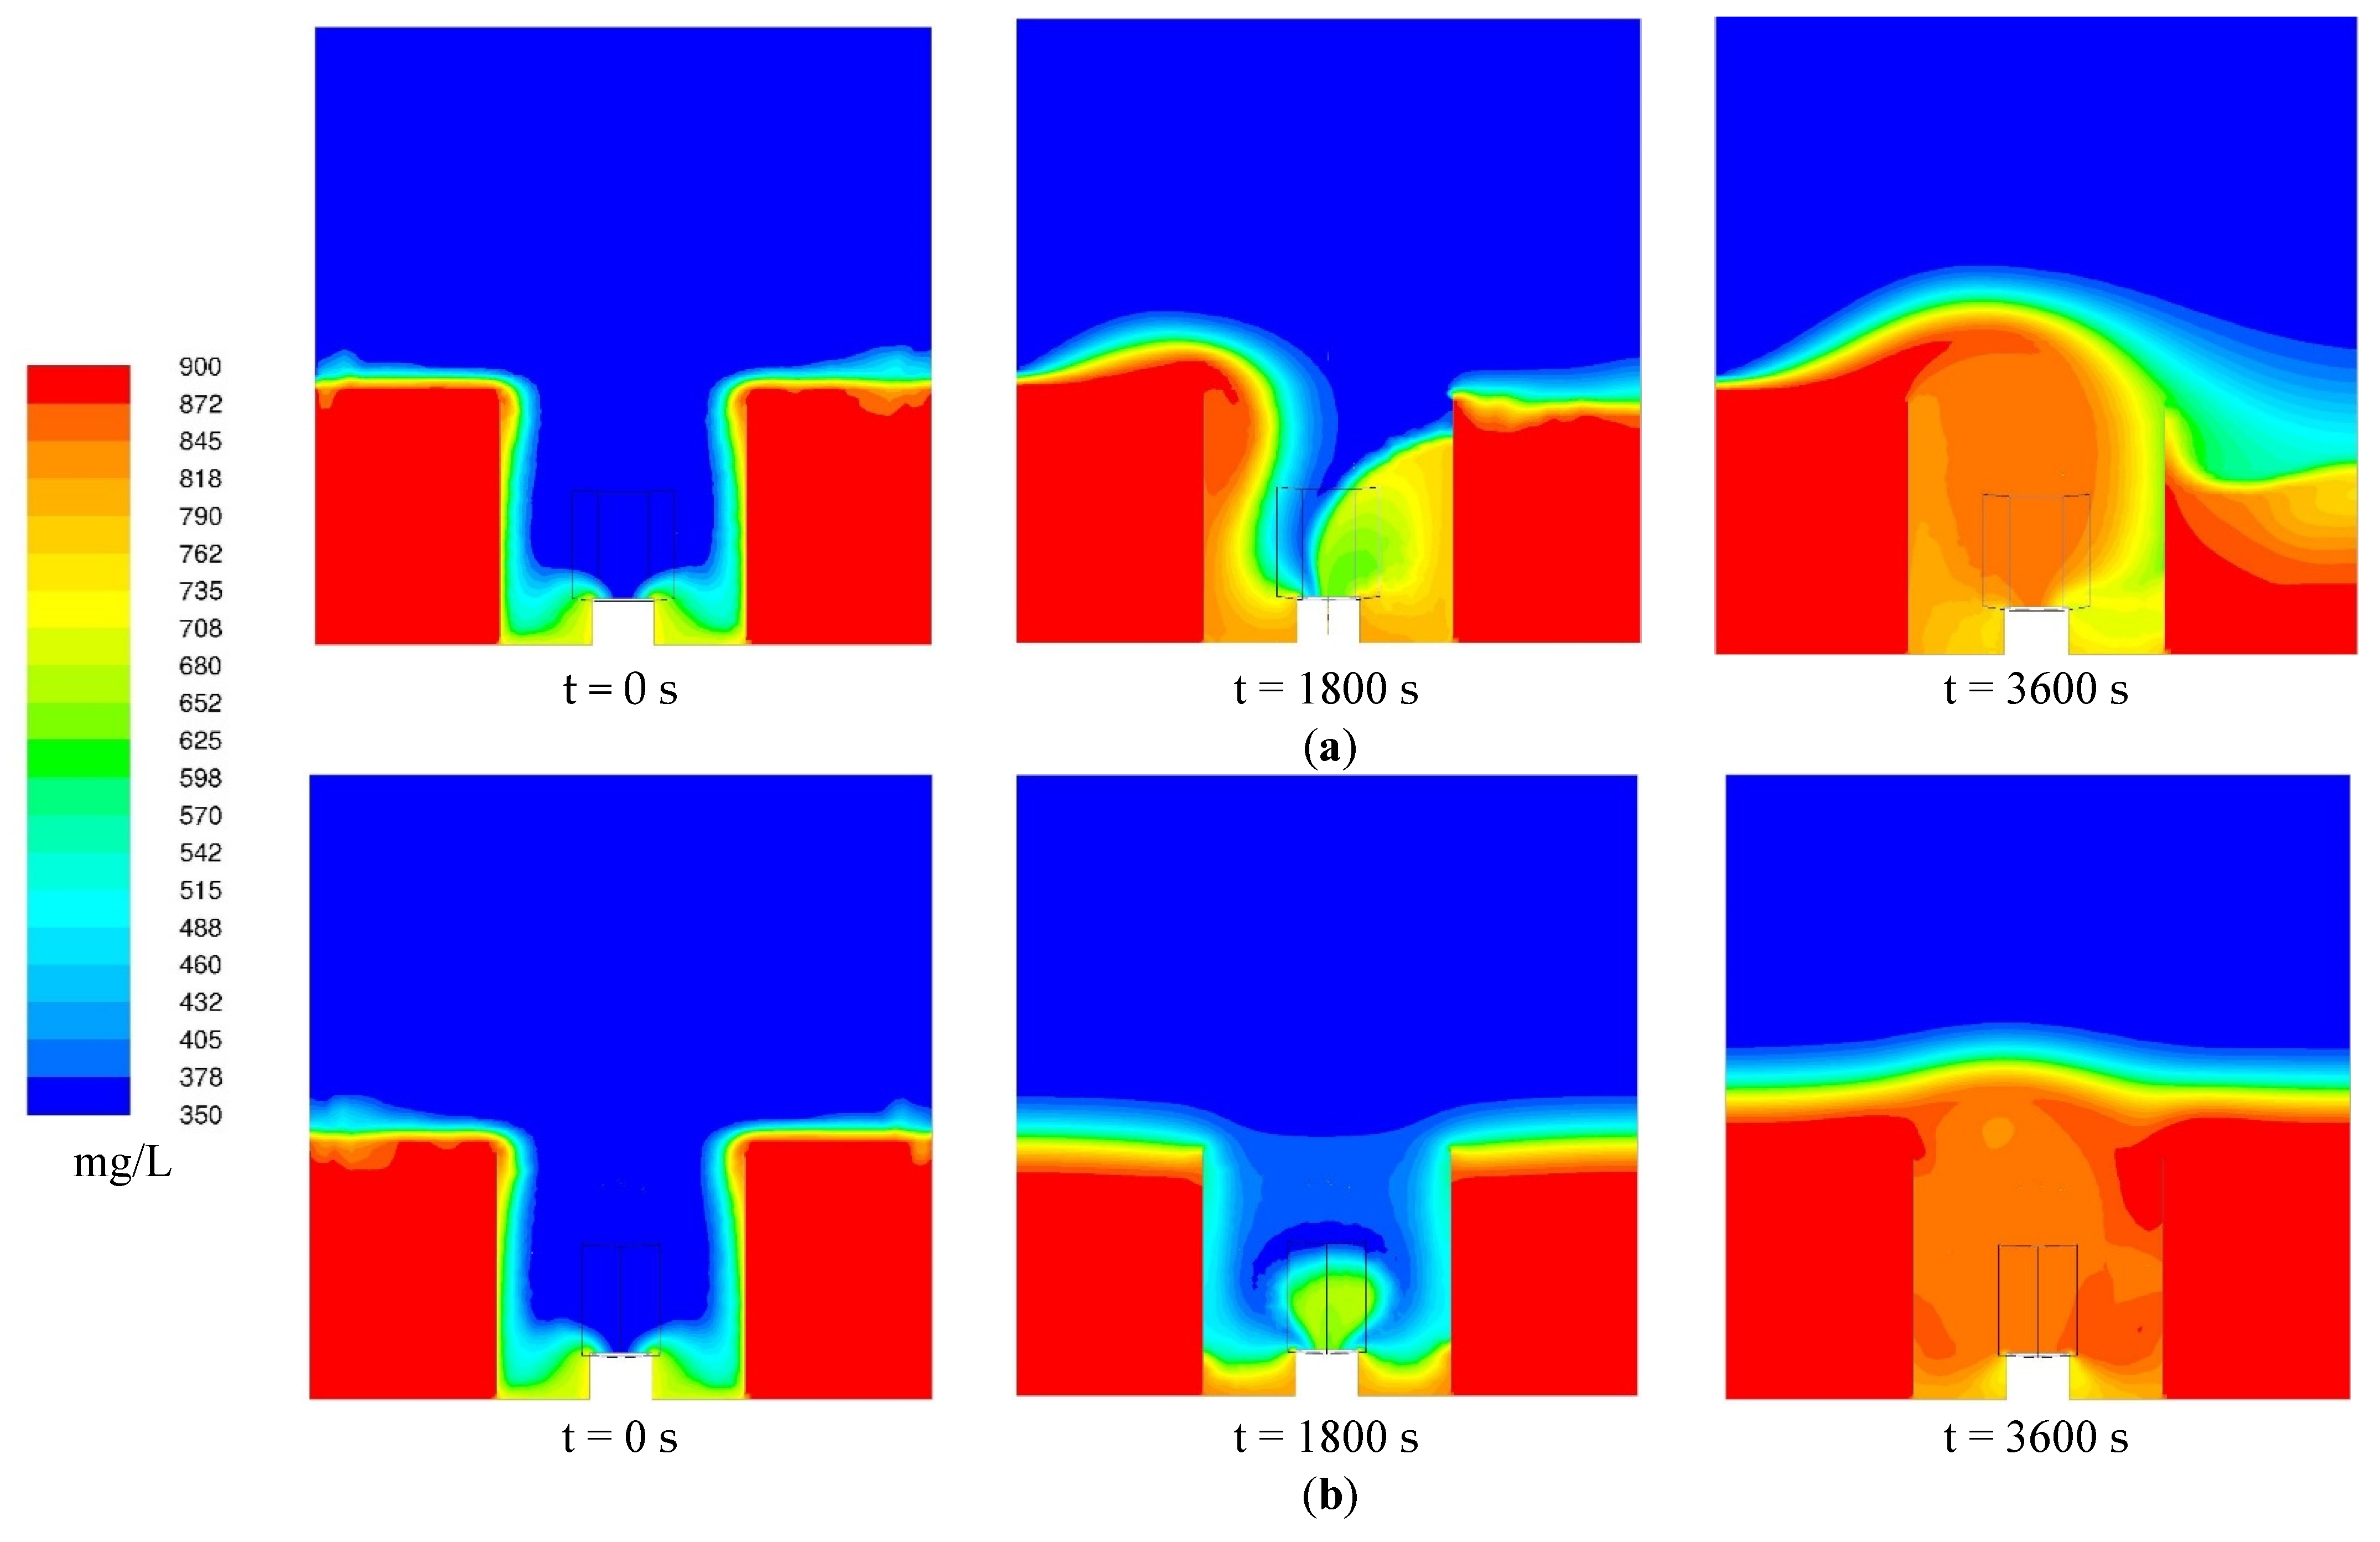
The effect of flow instability on the quality of the withdrawn water is shown in Figure 9. The figure illustrates the temporal evolution of the water mineralization field in the presence of bottom barriers at the rate of water flow through a single water intake head of 4 m3/s in the case when the velocity of the river flow varies linearly from 0 m/s to 0.1 m/s per hour. The impurity concentration fields along the stream are shown in Figure 9a in the middle of the computational domain and across the stream—in Figure 9b. It is seen that the non−stationarity of the flow has also a strong effect on the quality of the withdrawn water. When the flow velocity increases from zero to 0.1 m/s per hour, the mineralization and, accordingly, the hardness of the withdrawn water increases by more than 2.5 times.
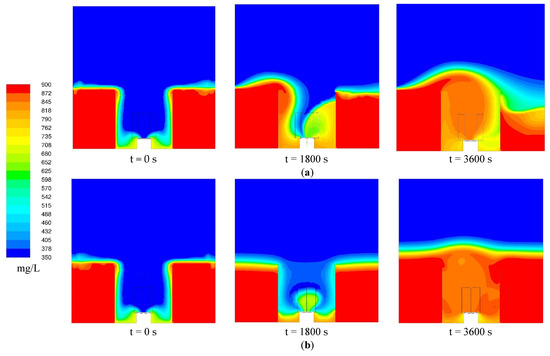
Figure 9.
Temporal evolution of the mineralization field of withdrawn water in the presence of bottom barriers at the flow rate of water intake through a single intake head of 4 m3/s (in the vertical section along the stream (a), across the stream (b)). The velocity of the river flow varies linearly from 0 m/s to 0.1 m/s in 1 h.
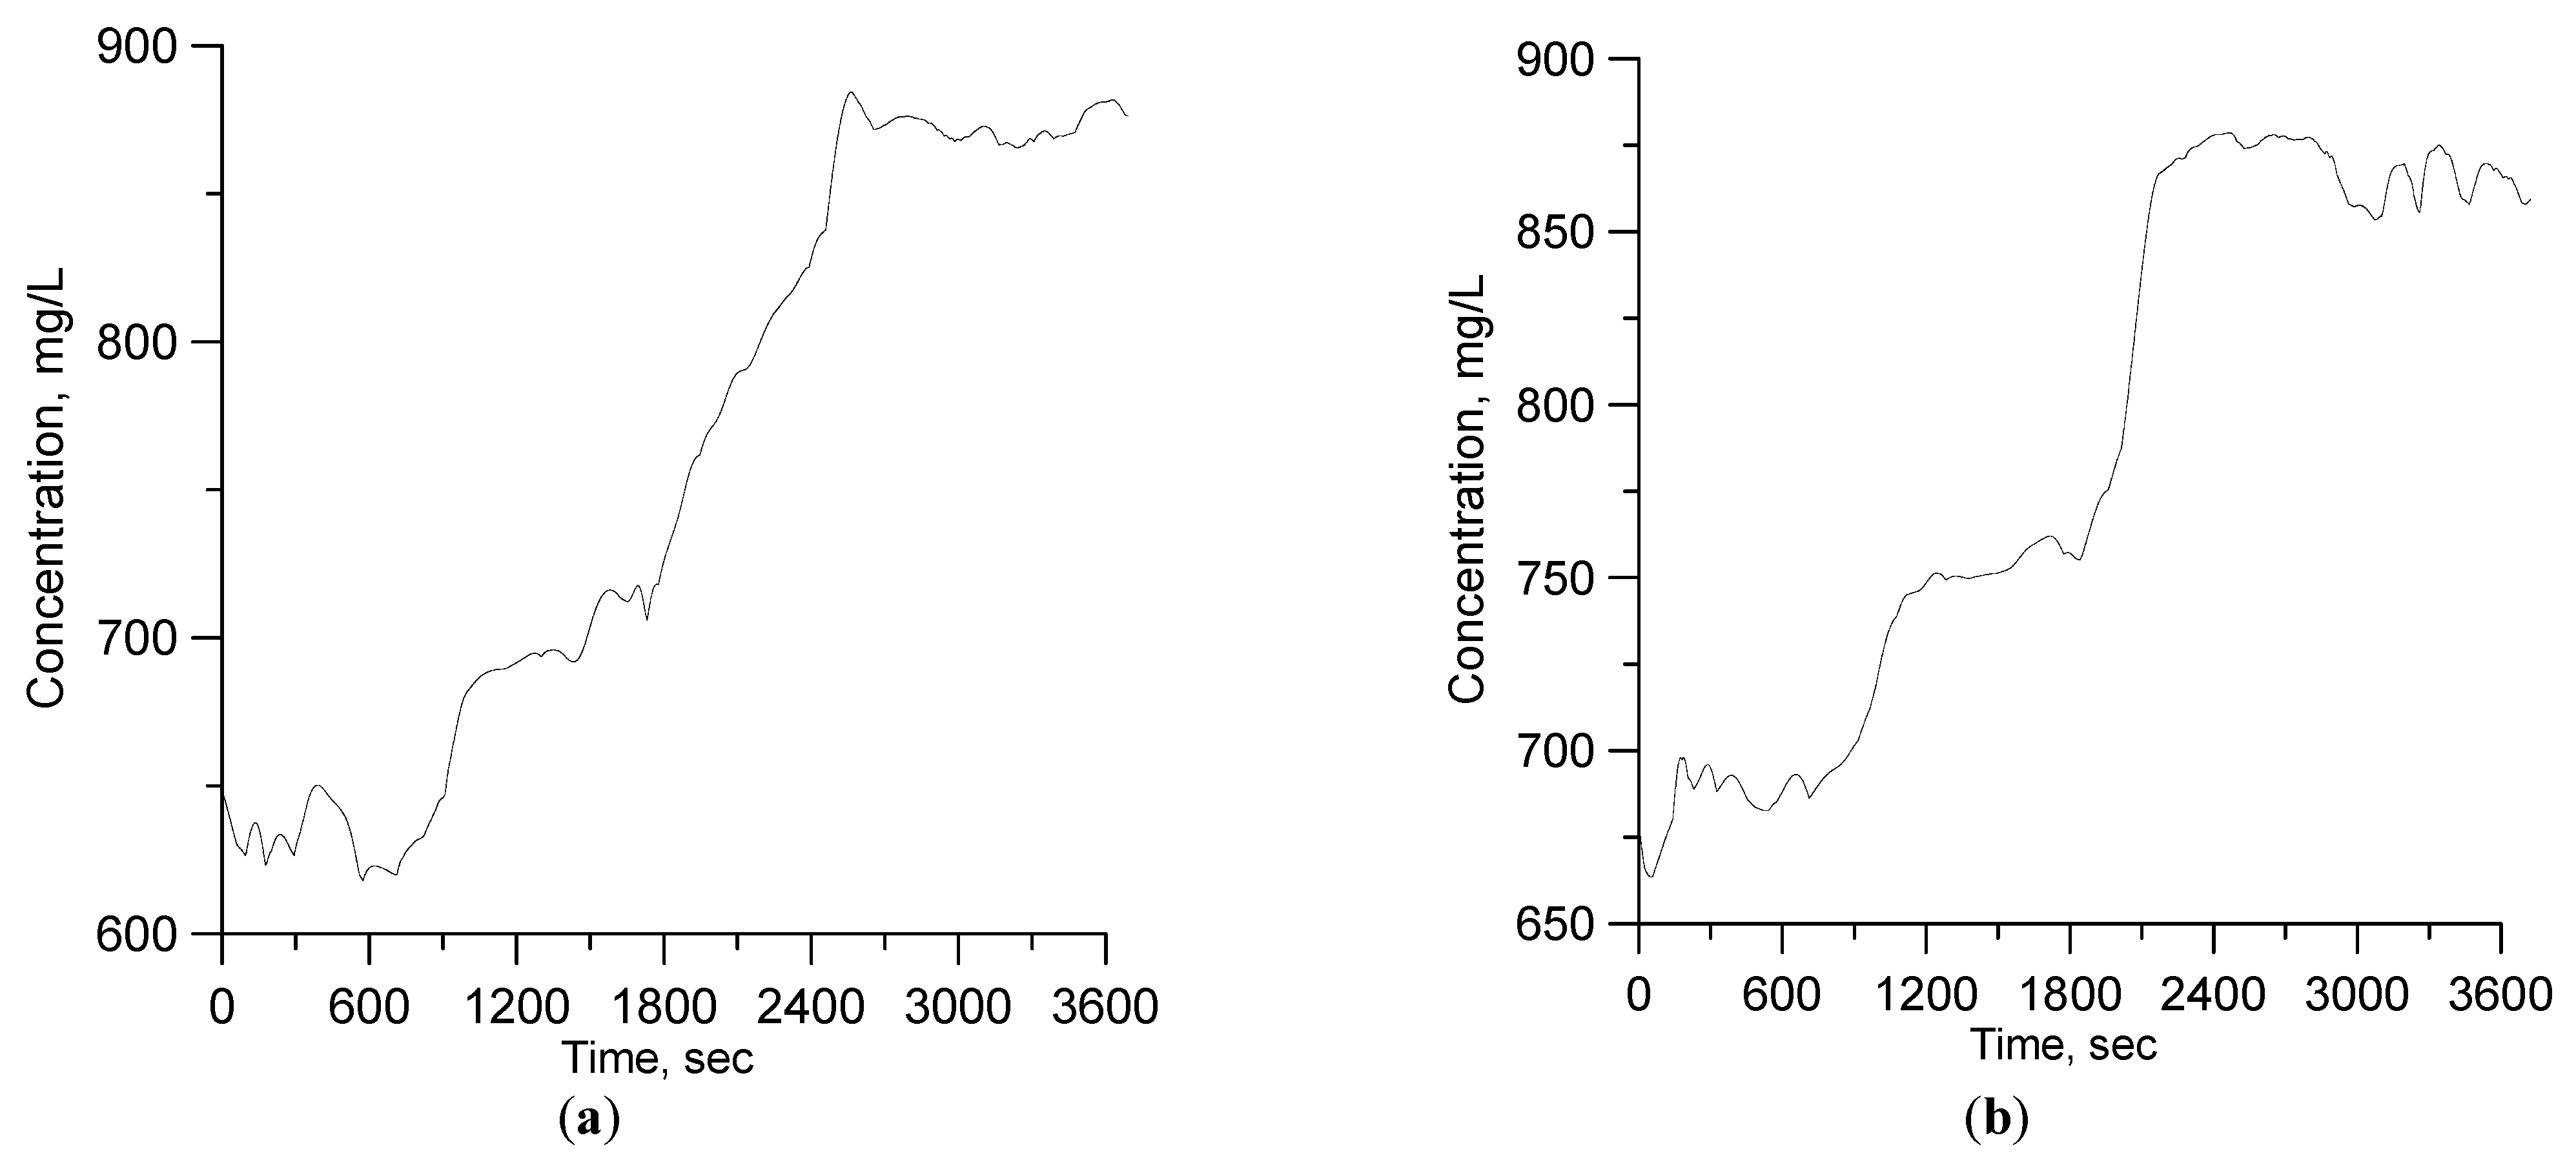
The temporal dynamics of the withdrawn water mineralization as the flow velocity in the reservoir increases from 0 to 0.1 m/s per hour is shown in Figure 10 for water intake scenarios 3 and 4 at the flow rate of 2 m3/s and 4 m3/s, respectively. It is seen that in both cases the withdrawn water has maximum hardness, which is a critical factor for the operation of the intake facilities. This clearly demonstrates the role and the impact of considerable intra−day non−uniformity of the HPS operation on the state of the large water intake located in its upper pool. The optimum way to improve the stability of the selective intake under these conditions is to increase the height of the bottom barriers around the intake heads.
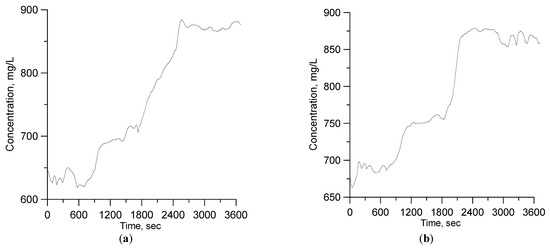
Figure 10.
The temporal evolution of the maximum mineralization of the withdrawn water in the presence of bottom barriers for the flow rate of water withdrawn through a single intake head: 2 m3/s (a), and 4 m3/s (b) at the velocity of the river flow varying from 0 m/s to 0.1 m/s within 1 h.
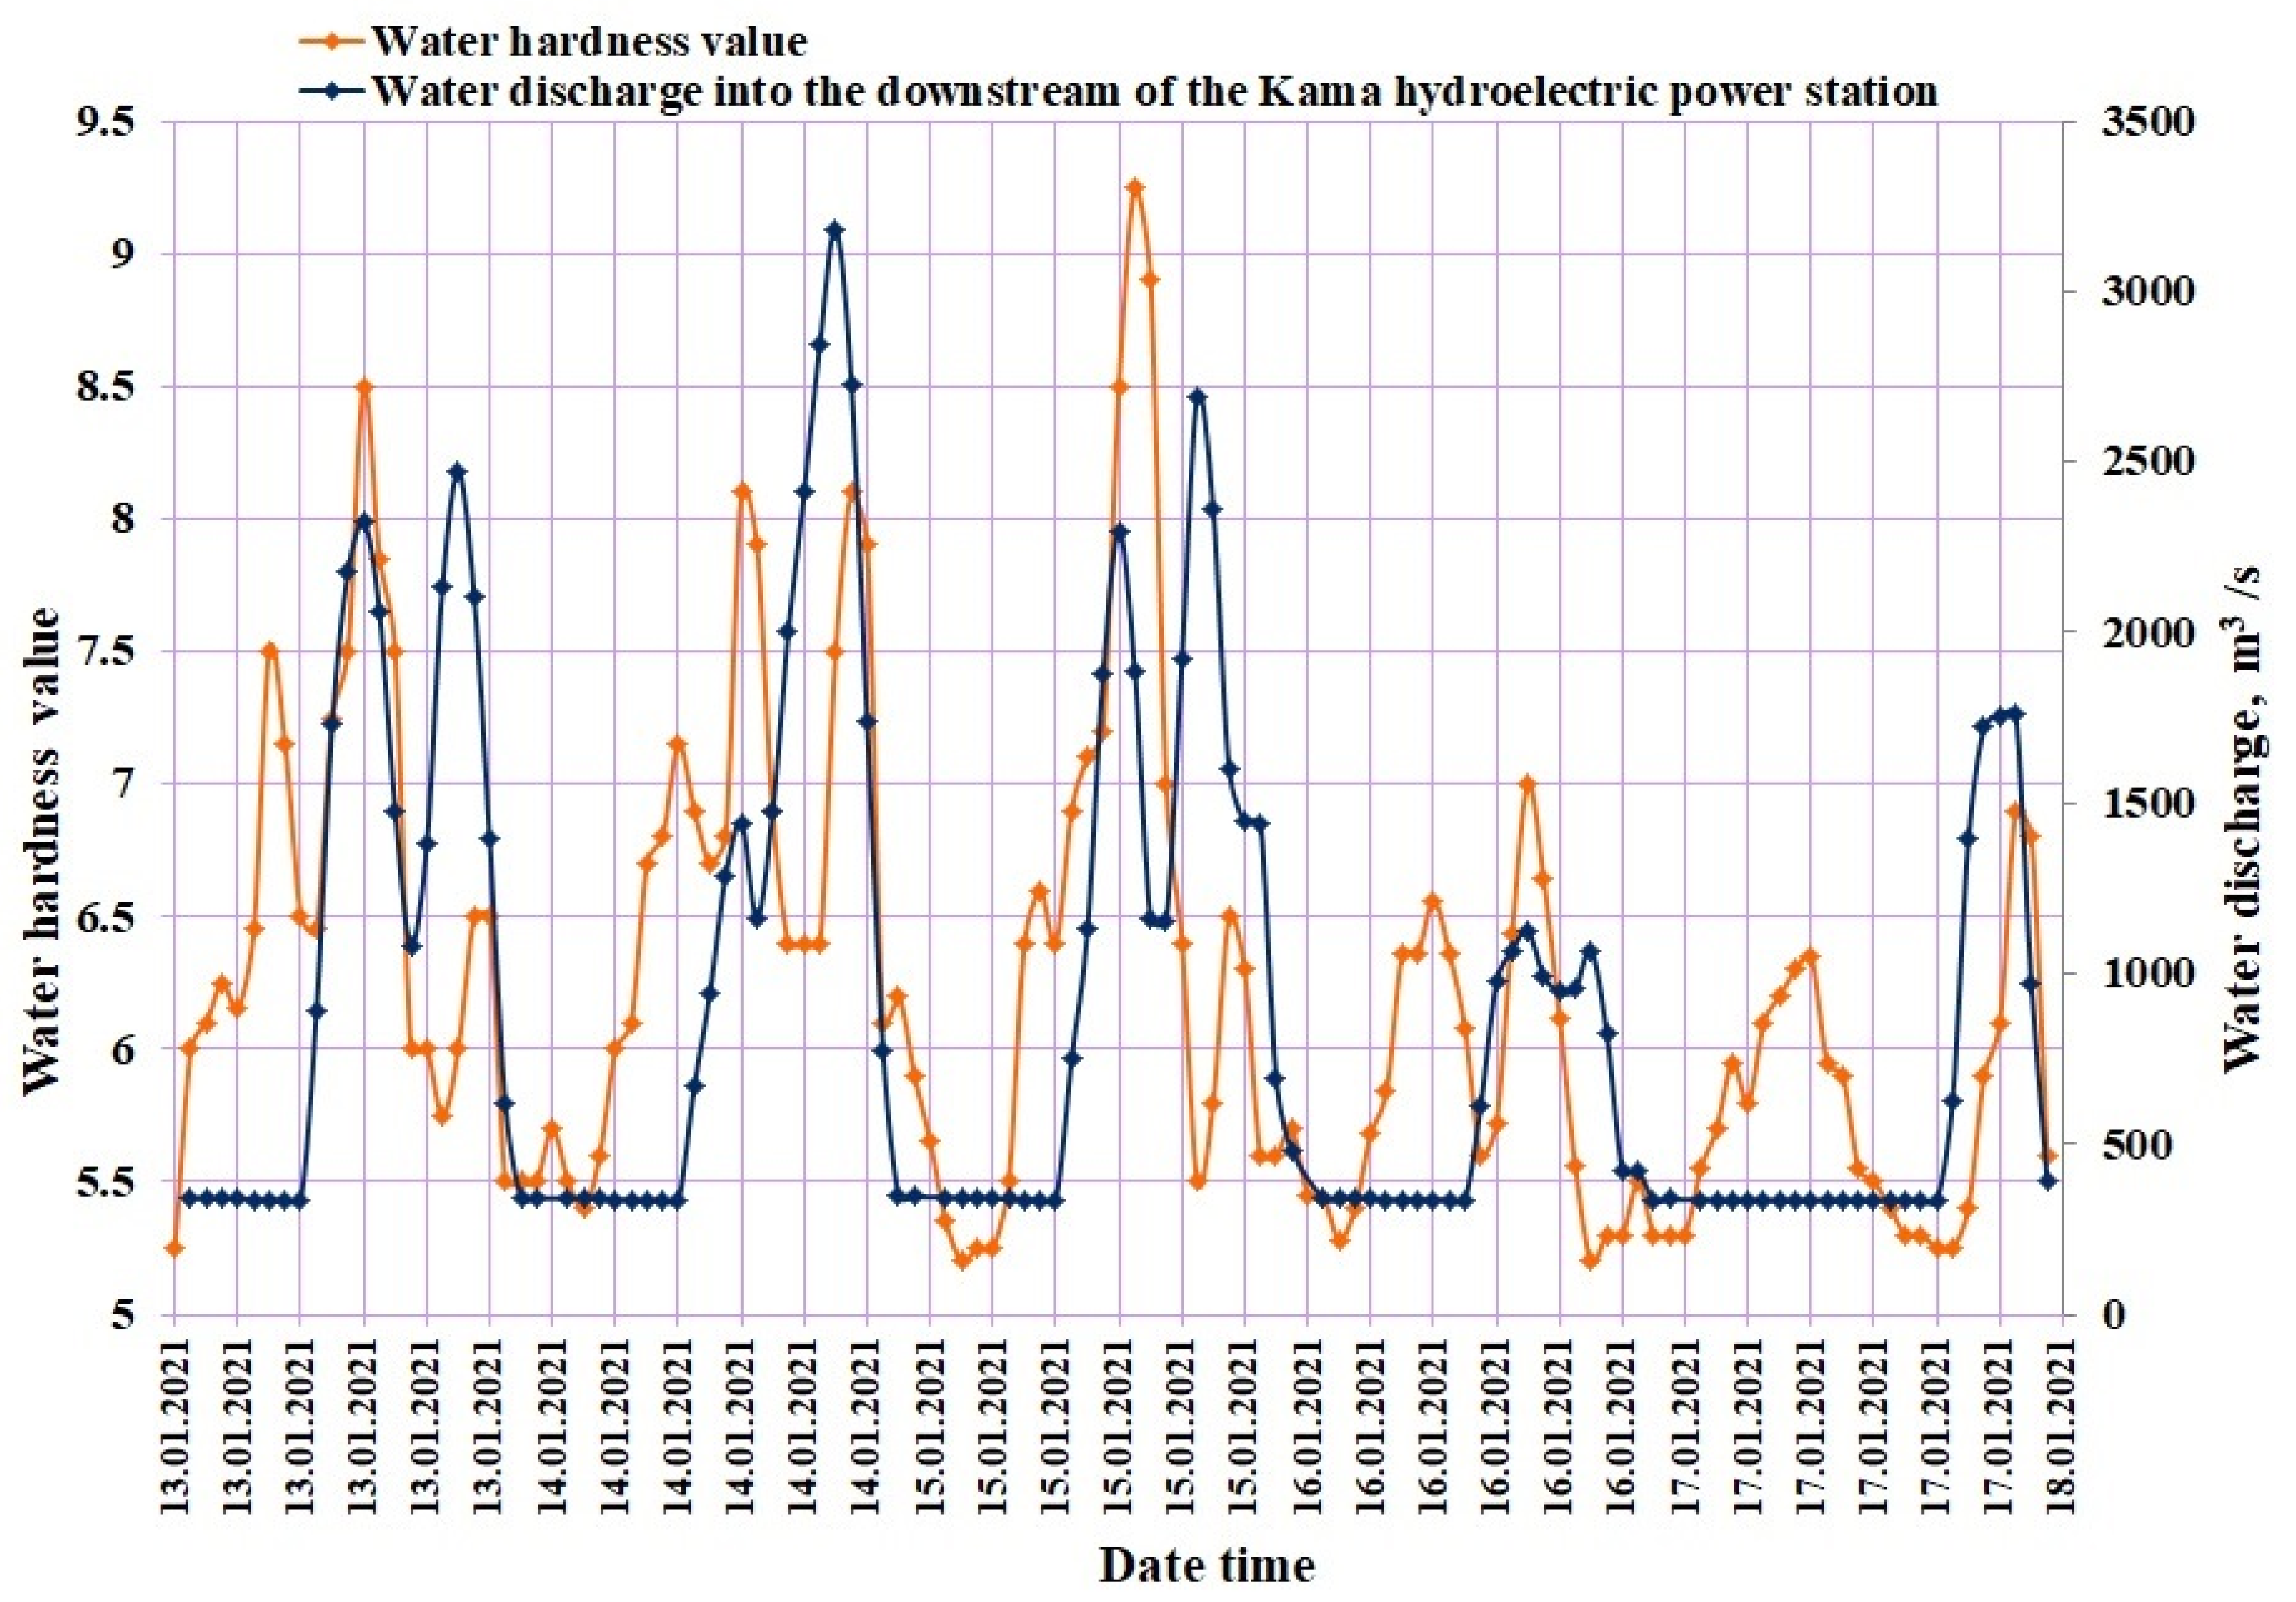
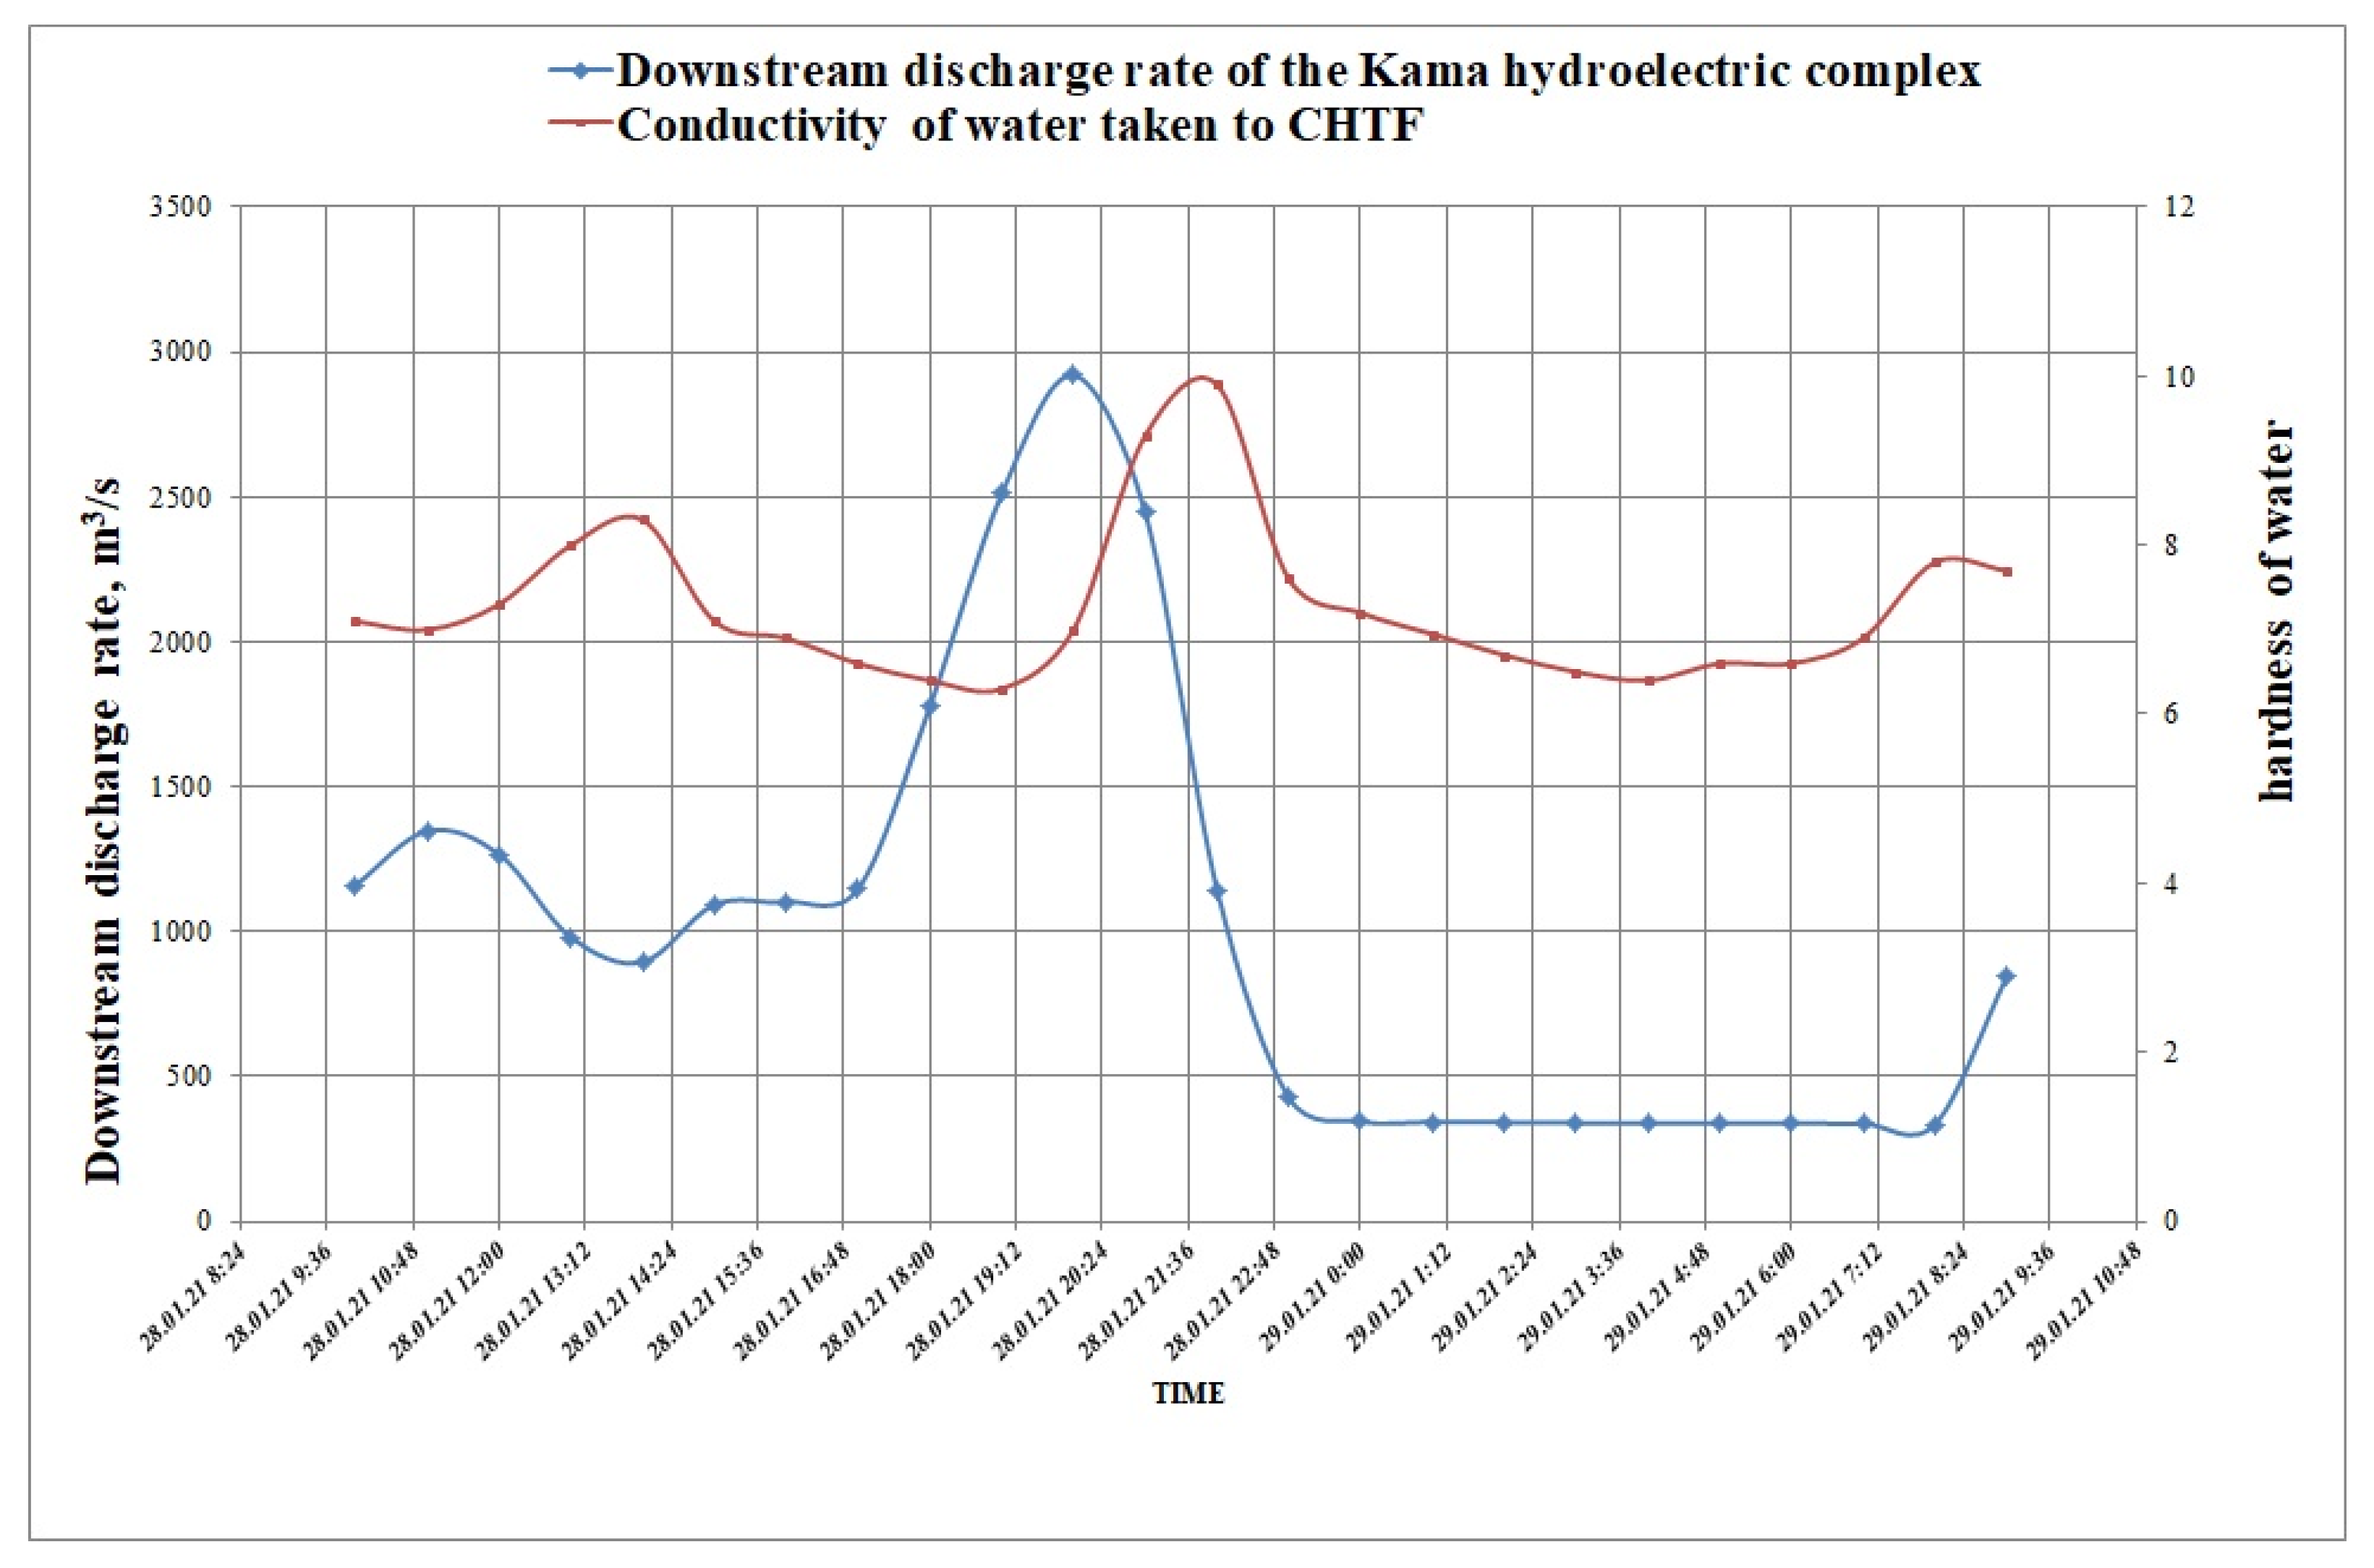
The strong impact of hydrodynamic characteristics on the quality of water intake at the Chusovskoy water intake determined by computation is confirmed by the superimposed graphs of the flow rate dynamics of water discharge through the dam of the Kamskaya HPS and the hardness of water withdrawn at the Chusovskoy water intake, presented in Figure 11.
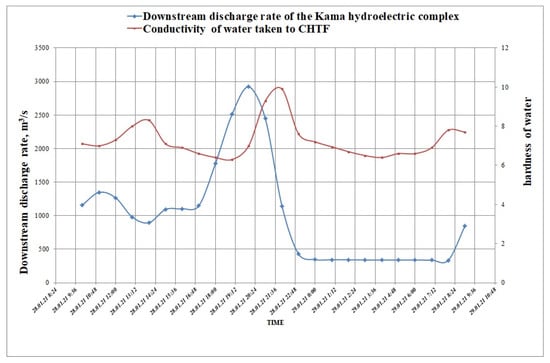
Figure 11.
Superimposed chronological graphs of water discharge into the lower pool of the Kamskaya HPS and measured water hardness in the Chusvskoy water intake area.
Thus, the conducted studies allowed us to establish the relation between the intraday operation non−uniformity of the Kamskaya HPS and fluctuations of hardness of water withdrawn by the main water intake of Perm city, to demonstrate its significance for providing stability of drinking water supply, and to reveal its mechanism. In the traditional approach, the flows generated in the upper pools of the hydroelectric complexes under conditions of significant intraday non−uniformity of their operation are not taken into account in the assessment of the impact of these complexes on economic and natural objects. The example considered in this paper confirms the need for such consideration. At the same time, it is essential that it combines field studies and computational experiments.
4. Conclusions
A complex of field studies carried out using a modern multiparameter flow velocity meter MIDAS ECM Valeport has shown that the intraday irregularity of water discharge through the dam of a large hydroelectric power station causes significant fluctuations of hydrodynamic characteristics in the upper pool even at a distance of 15 km from the hydroelectric power station. Computational experiments carried out within the framework of hydrodynamic models in three−dimensional formulation revealed the mechanisms of influence of fluctuations of intraday hydrodynamic characteristics caused by the operation of the hydroelectric power station on the quality of water withdrawn by selective water intake using bottom barriers. The conducted studies made it possible to develop a complex of measures for increasing stability of the Chusovskoy water intake complex operation under conditions of considerable intraday irregularity of the Kamskaya HPS operation. Installation of bottom barriers of different height on separate water intake heads seems to be the most effective. To improve the reliability of water−use in the upper pools of large hydroelectric power stations, characterized by significant intraday irregularity of operation, it is necessary to assess and analyze the arising hydrodynamic effects.
Field measurements were funded by RFBR and Perm Krai, grant number 20−45−596028 and numerical investigation was funded by Russian Science Foundation, grant 17-77-20093.
Author Contributions
Conceptualization, T.L. and A.L.; methodology, T.L. and A.L.; validation, Y.P., A.B. and Y.L.; investigation, Y.P., A.B. and Y.L.; writing—original draft preparation, T.L., A.L. and Y.P.; writing—review and editing, T.L., A.L. and Y.P.; supervision, T.L. and A.L.; funding acquisition, A.L. and Y.P. All authors have read and agreed to the published version of the manuscript.
Funding
Field measurements were funded by RFBR and Perm Territory (Russian Federation), project number 20−45−596028 and numerical investigation was funded by Russian Science Foundation, grant 17-77-20093.
Institutional Review Board Statement
Not applicable.
Informed Consent Statement
Not applicable.
Data Availability Statement
Not applicable.
Conflicts of Interest
The authors declare no conflict of interest.
References
- Donald, D.M.; Ingersoll, C.G. Development and Evaluation of Consensus-Based Sediment Quality Guidelines for Freshwater Systems. Arch. Environ. Contam. Toxicol. 2000, 39, 20–31. [Google Scholar]
- Ucler, N.; Engin, G.O.; Kocken, H.G.; Öncel, M.S. Game theory and fuzzy programming approaches for bi-objective optimization of reservoir watershed management: A case study in Namazgah reservoir. Environ. Sci. Pollut. Res. 2015, 22, 6546–6558. [Google Scholar] [CrossRef] [PubMed]
- Lopes, L.F.G.; Carmo, J.S.D.; Cortes, R.M.V.; Oliveira, D. Hydrodynamics and water quality modelling in a regulated river segment: Application on the instream flow definition. Ecol. Model. 2004, 173, 197–218. [Google Scholar] [CrossRef]
- Na, E.H.; Park, S.S. A hydrodynamic and water quality modeling study of spatial and temporal patterns of phytoplankton growth in a stratified lake with buoyant incoming flow. Ecol. Model. 2006, 199, 298–314. [Google Scholar] [CrossRef]
- Chen, Q.; Tan, K.; Zhu, C.; Li, R. Development and application of a two-dimensional water quality model for the Daqinghe River Mouth of the Dianchi Lake. J. Environ. Sci. 2009, 21, 313–318. [Google Scholar] [CrossRef]
- Calderon, M.R.; Almeida, C.A.; González, P.; Jofré, M.B. Influence of water quality and habitat conditions on amphibian community metrics in rivers affected by urban activity. Urban Ecosyst. 2019, 22, 743–755. [Google Scholar] [CrossRef]
- Zhao, L.; Zhang, X.; Liu, Y.; He, B.; Zhu, X.; Zou, R.; Zhu, Y. Three-dimensional hydrodynamic and water quality model for TMDL development of Lake Fuxian, China. J. Environ. Sci. 2012, 24, 1355–1363. [Google Scholar] [CrossRef]
- Liu, W.C.; Liu, S.Y.; Hsu, M.H.; Kuo, A.Y. Water quality modeling to determine minimum instream flow for fish survival in tidal rivers. J. Environ. Manag. 2005, 76, 293–308. [Google Scholar] [CrossRef] [PubMed]
- Bai, J.; Xiao, R.; Zhang, K.; Gao, H. Arsenic and heavy metal pollution in wetland soils from tidal freshwater and salt marshes before and after the flow-sediment regulation regime in the Yellow River Delta, China. J. Hydrol. 2012, 450–451, 244–253. [Google Scholar] [CrossRef]
- Endo, I.; Walton, M.; Chae, S.; Park, G.-S. Estimating Benefits of Improving Water Quality in the Largest Remaining Tidal Flat in South Korea. Wetlands 2012, 32, 487–496. [Google Scholar] [CrossRef]
- Jiang, T.; Zhong, M.; Cao, Y.J.; Zou, L.J.; Lin, B.; Zhu, A.P. Simulation of water quality under different reservoir regulation scenarios in the tidal river. Water Res. Manag. 2016, 30, 3593–3607. [Google Scholar] [CrossRef]
- Rahman, S.; Hossain, F. Spatial Assessment of Water Quality in Peripheral Rivers of Dhaka City for Optimal Relocation of Water Intake Point. Water Resour. Manag. 2007, 22, 377–391. [Google Scholar] [CrossRef]
- Biswas, T.; Mosley, L.M. From Mountain Ranges to Sweeping Plains, in Droughts and Flooding Rains; River Murray Water Quality over the Last Four Decades. Water Resour. Manag. 2018, 33, 1087–1101. [Google Scholar] [CrossRef]
- Li, K.; Zhu, C.; Wu, L.; Huang, L. Problems caused by the Three Gorges Dam construction in the Yangtze River basin: A review. Environ. Rev. 2013, 21, 127–135. [Google Scholar] [CrossRef]
- Lyubimova, Т.; Lepikhin, A.; Parshakova, Y.; Konovalov, V.; Tiunov, А. Formation of the density currents in the zone of confluence of two rivers. J. Hydrol. 2014, 508, 328–342. [Google Scholar] [CrossRef]
- Lyubimova, T.; Lepikhin, A.; Parshakova, Y.; Tiunov, A. The risk of river pollution due to washout from contaminated floodplain water bodies in periods of high magnitude floods. J. Hydrol. 2016, 534, 579–589. [Google Scholar] [CrossRef]
- Lyubimova, T.; Parshakova, Y.; Lepikhin, A.; Lyakhin, Y.; Tiunov, A. The Effect of Unsteady Water Discharge through Dams of Hydroelectric Power Plants on Hydrodynamic Regimes of the Upper Pools of Waterworks. Water 2020, 12, 1336. [Google Scholar] [CrossRef]
- Available online: https://www.valeport.co.uk/content/uploads/2020/04/MIDAS-ECM-Datasheet-April-2020.pdf (accessed on 5 December 2021).
Publisher’s Note: MDPI stays neutral with regard to jurisdictional claims in published maps and institutional affiliations. |
© 2021 by the authors. Licensee MDPI, Basel, Switzerland. This article is an open access article distributed under the terms and conditions of the Creative Commons Attribution (CC BY) license (https://creativecommons.org/licenses/by/4.0/).

