Abstract
This paper presents a simplified parametric model for the estimation of depth-limited hurricane wave spectra, accounting for swell and wind-sea components, for coastal engineering applications. The model was evaluated against observations obtained from three shallow water sites in Florida during Hurricane David in September 1979. It was revealed that the parametric approach increases in accuracy with decreasing distance to the storm center and generally provides a conservative representation of the significant wave height, albeit overestimating the peak wave frequency. The model was subsequently adopted to evaluate the performance of tilted hyperbolic paraboloidal (hypar) shells (referred to as “kinetic umbrellas”) as an adaptable alternative to conventional floodwalls via smoothed particle hydrodynamics (SPH). The introduction of hypar geometry proved superior to conventional sloped barriers in reducing overtopping waves but decreases in effectiveness at levels of inundation greater than two-thirds the deployed height. Furthermore, umbrellas exhibiting larger geometrical warping were more capable at suppressing overtopping but must sustain larger base shear forces when subjected to irregular waves consistent with landfalling hurricanes.
1. Introduction
The design criteria of coastal structures are often limited by their performance under extreme loading scenarios, including hurricane-induced sea states. Hence, the quantification of nearshore wave spectra during landfalling hurricanes is paramount for the characterization of extreme waves and spectral characteristics associated with such events [1,2,3]. The quantification of irregular wave actions on coastal installations may therefore be conducted, the effects of which cannot be fully captured by Goda’s empirical relations [4,5,6] in describing purely monochromatic waves. This becomes especially important when designing novel coastal defenses against storm surge flooding and accompanying waves produced from hurricane forcing. One such defense measure is the “kinetic umbrella”, conceptualized by Wang et al. [7] and inspired by the architecture of structural artist Félix Candela [8]. Exemplifying the concept of “adaptable Aquatecture”, the hyperbolic paraboloidal (hypar) shells supported by vertical columns line the coast, providing shade and shelter while not limiting visibility and access to the shore (Figure 1a,c). A hinge at the column-hypar interface enables the umbrellas to rapidly deploy into an impermeable barrier to protect coastal communities from surge-induced inundation (Figure 1b,d,e). While the conceptual feasibility of kinetic umbrellas from a structural engineering perspective was successfully demonstrated [7], it is necessary to further assess their performance against irregular waves generated from severe coastal storms. For this purpose, a convenient approach facilitating the parametric modeling of hurricane wave spectra within depth-limited regimes must be first explored.
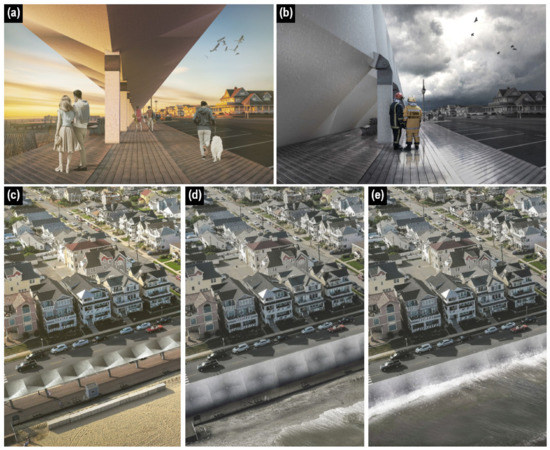
Figure 1.
Architectural rendering of kinetic umbrellas in the (a) upright and (b) deployed position; aerial view of umbrella system in the (c) upright position, and when deployed (d) prior to and (e) during a storm surge event also shown. Images courtesy of FotosForTheFuture/Shutterstock.com with modifications by Mauricio Loyola.
Perhaps the most robust approach to spectral wave modeling constitutes the implementation of numerical simulations. Third generation wave models including SWAN [9] and WAVEWATCH III (WW3) [10] have been widely applied for the reproduction of hurricane sea states in deep water for synthetic and real storms [11,12]. Recent advancements in WW3 which introduced a new parallelization algorithm and implicit solver for triangular unstructured grids to describe coastal zones have also increased its accuracy in simulating nearshore hurricane wave characteristics [13]. However, despite the ubiquity of numerical models in physical oceanography, their application towards the preliminary design and potential form-finding of coastal structures may prove overly complex and computationally demanding. From a structural engineering context, maximum wave forces and rates of overtopping associated with a representative parametric spectrum (e.g., JONSWAP [14]) are often sufficient to inform design. Additionally, it is known that hurricane generated seas typically adhere to unimodal spectral forms for locations within eight times the radius to maximum winds from the storm center due to nonlinear interactions [15,16,17,18]. While fetch-limited parametric models such as JONSWAP [14] or Donelan [19] provide a reliable approximation, available hurricane adaptations based on them have mainly focused on deep water conditions [20]. As such, equivalent shallow water schemes are desired to serve practical engineering applications under landfalling hurricane scenarios.
The formulation of shallow water hurricane spectra effectively enables the design and analysis of creative and unconventional structural forms, such as kinetic umbrellas, subject to extreme hydrodynamic events. The hydrostatic performance of such structures were investigated by Wang et al. [7] via smoothed particle hydrodynamics (SPH) coupled with finite element modeling (FEM). This fluid-structure interaction (FSI) study utilized SPH to capture the spatial distribution of hydrostatic forces on hypar surfaces, to which FEM computed shell stresses and deformations in response to such forces. The SPH-FEM method ultimately confirmed the feasibility of kinetic umbrellas from a structural engineering perspective. However, the ability of kinetic umbrellas in suppressing overtopping waves (relative to conventional floodwalls) under hurricane conditions remain unknown. Since Saville’s pioneering work [21], extensive experimental research has been undertaken to empirically quantify wave overtopping over conventional shoreline protection structures for their integration into design manuals worldwide [2,6,22,23]. While useful for the design of geometrically simple seawalls, existing methodologies cannot address the tilted hypar form embodied by kinetic umbrellas.
Fortunately, advances in computational techniques and hardware have enabled numerical simulations to address complex FSI phenomena, supporting arbitrary solid geometries and wave characteristics, without the need for time-consuming and expensive physical experiments. Various grid or mesh based methods such as the boundary element method (BEM), finite volume method (FVM), and FEM have been adopted in modeling fluid flow in this regard [24,25,26]. However, since stable grid/mesh definitions are required, these techniques may prove problematic when dealing with free surface problems exhibiting large deformations or complex geometry, often necessitating costly and error-prone mathematical transformations (i.e., mesh rezoning) [24,27]. In response, the meshfree Lagrangian SPH method implemented via the open-source DualSPHysics solver [28] has been widely adopted for various coastal engineering problems. Altomare et al. [29] successfully validated the method against analytical and empirical solutions for wave impact against vertical seawalls, while Barreiro et al. [30] and Altomare et al. [31] confirmed its applicability in simulating shallow water wave propagation through comparisons with experimental data. More recently, Dang et al. [32] utilized DualSPHysics to compute overtopping and wave forces under regular and irregular wave action for various conventional seawall designs. Thus, it has been demonstrated that SPH provides a robust framework for the analysis of coastal structures subject to a range of loading scenarios.
This paper first proposes a simplified parametric formulation for the modeling of nearshore hurricane spectra accounting for both wind-sea and swell components. The TMA spectrum [33] was adopted for the transformation of deep water hurricane spectra as parameterized by Young [20] into the depth-limited regime. To account for local wind conditions, swell characteristics from the TMA spectrum were coupled with a parametric wind growth model for shallow water based on observations from Lake George (New South Wales, Australia) [34,35]. The performance of the proposed parametric scheme was assessed against spectral data obtained during the passing of Hurricane David along the Florida east coast in early September 1979 [36]. Comparisons between measured and predicted significant wave heights, peak frequencies, and spectral shapes were conducted across three shallow water monitoring sites with available wave data. Wave spectra consistent with Hurricane David were subsequently adopted to assess the behavior of kinetic umbrellas, based on Wang et al. [7], across different levels of inundation via 3D SPH modeling. The extent of geometric hypar warping was varied to quantify the contribution of geometry in influencing the degree of overtopping and maximum hydrodynamic base shear. This effectively provides insight into the performance of novel hypar forms in suppressing wave overtopping under hurricane conditions relative to conventional sloped floodwalls commonly in use.
2. Parametric Model Definition
2.1. Hurricane Wind Field
The parametric model first requires the definition of an appropriate wind field characterizing hurricanes of a given intensity. The idealization of hurricane wind fields were based upon the popular analytical model of Holland [37], to which the tangential wind speed at radius from the hurricane center is expressed as the gradient wind ():
where signifies the Coriolis frequency, is the air density taken as 1.2 kgm−3, and and respectively denote the ambient and central pressure. The parameter is obtained through a linear relationship to (expressed in hectopascals) as formulated by Young [20], and is related to the radius to maximum winds :
The radius to maximum winds from the storm center (in kilometers) is estimated via the empirical relations proposed by Vickery et al. [38] from observations of hurricanes occurring in the Atlantic Basin:
where is the latitude of the hurricane center and is the pressure deficit in hectopascals (with = 1013.25 hPa). In addition to the gradient winds, the forward speed () and direction of translation of the hurricane relative to the point of interest is considered. When assuming a constant inflow angle of 25° of the radial flow [39], the near-surface winds at radius is approximated as follows:
to which is the gradient wind near the ocean surface [40] and:
where denotes the forward azimuth from the hurricane center to the point of observation while is the translational bearing of the hurricane, both expressed in radians and taken positive clockwise from true north. Figure 2 illustrates the wind field of a hypothetical hurricane centered at latitude = 25.0° N and longitude = 78.0° W with = 970 hPa. The hurricane is translating in the NW direction at 7 ms−1 with bearing = 330° and the radius to maximum winds was estimated to be 33.6 km. The highest winds located to the right of the eye radiating towards the east is clearly illustrated.
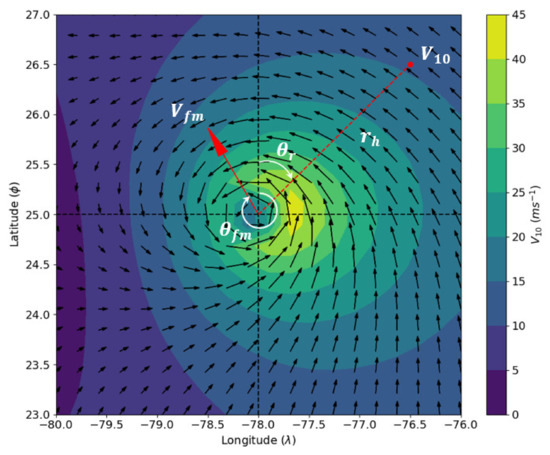
Figure 2.
Wind field of a hypothetical hurricane in the Northern Hemisphere illustrating , , and relative to a point of interest located at distance from the center.
2.2. Shallow Water Transformation of Hurricane Swell
Atmospheric forcing in conjunction with nonlinear wave-wave interactions facilitating energy transfer between different modes acts to stabilize hurricane spectra towards that typical of fetch-limited wind seas. With the additional influence of remote swells, regions in deep water within eight times the radius to maximum winds can be well represented via conventional unimodal spectral formulations such as the JONSWAP model [18]. This observation also appears to hold for shallow regions as observed by Ochi and Chiu [36] and Kennedy et al. [41]. Therefore, offshore hurricane waves must be transformed inshore to recreate the shallow water swell conditions. To approximate the spectral shape under depth-limited conditions, Bouws et al. [33] incorporated Kitaigorodskii et al.’s [42] scaling of the equilibrium range in wavenumber space to the standard JONSWAP form, giving rise to the TMA spectrum. A scaling factor, , was introduced which is dependent upon the frequency and depth to account for shoaling [43]. Despite the ubiquity of the JONSWAP relation with the high frequency face of the spectral energy proportional to , an alternative approach with the high frequency face of was proposed by Donelan et al. [19] as being more representative of wind driven seas (henceforth referred as the Donelan spectrum). Unlike the JONSWAP formulation, the Donelan formula is also internally self-consistent with respect to the total energy [20]. As such, TMA scaling was applied to the Donelan spectral form for the transformation of deep water swells into the depth-limited regime. Note that in deep water, Young [20] observed little difference between the JONSWAP and Donelan spectra in their representation of hurricane sea states. The shape of the Donelan spectrum after TMA scaling, , is presented as follows:
where the standard JONSWAP tuning parameters , , and , are reformulated by Donelan et al. [19] to , , and , respectively. is the frequency of the spectral peak, denotes the gravitational acceleration, and the TMA scaling term is presented in full and in its approximate form [44] as follows:
with and respectively denoting the wavenumber at depth and at infinite depth associated with frequency determined via the dispersion relation:
In addition, the relationship between peak frequency () and total energy () in their nondimensional form consistent with the Donelan spectrum is:
where:
and is per Equation (4). The total energy in deep water () is directly related to the spectral integrated significant wave height, which can be linearly estimated based on the wind speed [17] and shown to be valid under hurricane conditions for regions within [20]:
Finally, the self-consistent Donelan parameters , , and are expressed as follows [19]:
2.3. Hurricane Wind Waves in Shallow Water
The characterization of fetch-limited wave growth in shallow water was based upon formations by Young and Verhagen [35]. Relationships pertaining to the energy and peak frequency of waves as a function of fetch and water depth were obtained using observations from Lake George. However, a north-south stratification of the measurements was present due to taping of the lake bathometry towards its southern shore, resulting in consistently larger waves generated by northern winds. In response, Breugem and Holthuijsen [34] reanalyzed the data to account for this discrepancy and provided updated parameters for the estimation of nondimensional wave energy () and peak frequency () of wind-sea conditions in the depth-limited regime:
where and respectively denote the energy and peak frequency associated with fetch-limited shallow water wind waves. The updated shallow water coefficients by Breugem and Holthuijsen [34] are:
with and respectively denoting the nondimensional depth and fetch:
To adapt the shallow water relations to hurricane generated winds, the equivalent hurricane fetch concept developed by Young [16] was adopted. The equivalent fetch as presented by Young [20] is:
where the coefficients are , , , , , and . The spatial scale parameter and scaling factor are respectively:
and is the wind speed at the radius to maximum wind at the ocean surface [20]. Note that this radius is assumed sufficiently small such that Coriolis effects attributed to planetary rotation may be neglected:
with denoting Euler’s number.
2.4. Coupling of Hurricane Swell and Wind Waves
In order to obtain wave characteristics integrating both wind waves (subscript ) and swells (subscript ) in shallow water, a simplified equivalent model for the significant height and peak frequency is adopted. The combined wind-sea/swell equivalent significant wave height is [43]:
where is the significant wave height associated with shallow water wind waves estimated via the Breugem and Holthuijsen [34] approach with the total energy determined from Equation (13). The significant wave height of swells is computed from the zeroth-order moment of the TMA spectrum ():
In terms of the combined peak frequency, the equivalent approach proposed by Van der Meer and Janssen [45] is utilized:
where:
is the total spectral energy. is obtained through Equation (14) while the TMA characteristic wave frequency is:
Knowledge of and therefore enables the estimation of the equivalent spectral shape of depth-limited hurricane waves associated with wind-sea/swell coupling via the baseline Donelan spectral model omitting the TMA scaling parameter:
with , , and determined via Equation (12) but adopting in lieu of where:
Figure 3 summarizes the procedure for the determination of shallow water hurricane swell/wind-sea spectra via the parametric model presented herein. To compute the depth-limited wave characteristics at a particular site (at latitude and longitude and respectively), only the central pressure, eye coordinates, and forward velocity of the hurricane is required as input. However, if only maximum wave properties are desired, the hurricane location relative to the observation site need not be specified. As such, the significant wave height () and peak frequency of the maximum combined swell/wind-sea waves across various depths and hurricane eye pressures as predicted by the parametric model is illustrated in Figure 4. Two forward speeds of = 5 ms−1 and 10 ms−1 are considered. Since the choice of latitude does not significantly affect wave characteristics at the radius to maximum winds (i.e., = ), a constant latitude of = 30° was utilized. Figure 4 therefore presents an estimate of shallow water wave properties associated with the transition of maximum hurricane winds over a particular site. However, it must be noted that the parametric model does not account for potential depth-induced wave breaking as waves approach the maximum wave height (). This height needs to be estimated based upon local bathymetric characteristics at the site in question [46]. Battjes and Janssen [47] suggests a constant breaker parameter of 0.8 (where ) while Battjes and Stive [48] obtained via experimental studies. Further experiments by Kaminsky and Kraus [49] observed a wider range between 0.6 to 1.59. Nevertheless, Figure 4 presents a useful tool to aid the preliminary design of coastal structures under landfalling hurricane scenarios.
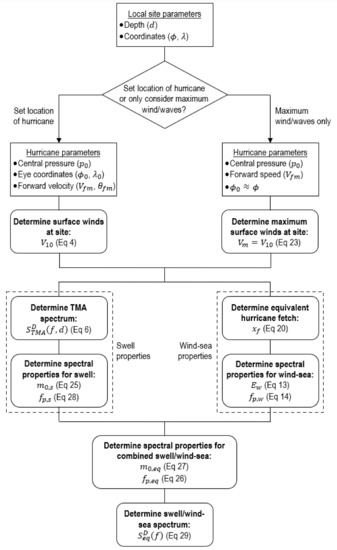
Figure 3.
Flowchart summarizing the parametric model for the determination of combined shallow water swell/wind-sea spectra associated with hurricanes.
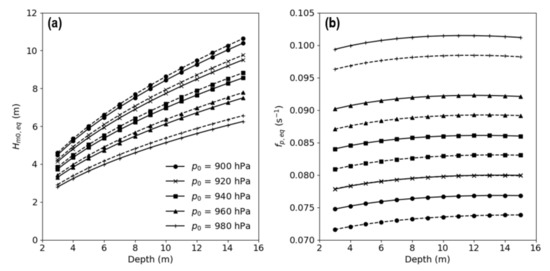
Figure 4.
(a) Significant wave height and (b) peak frequency of maximum combined swell/wind-sea hurricane waves at various shallow depths and eye pressures determined via the parametric model for = 5 ms−1 (solid line) and = 10 ms−1 (dashed line).
3. Comparison of Model with Observations
The performance of the parametric model is evaluated against recorded observations of shallow water wave characteristics arising from landfalling hurricanes. The sporadic distribution of nearshore gauging stations coupled with the extreme and unpredictable nature of hurricane events contribute to difficulties in evaluating such a model. Nevertheless, continuous shallow water spectra measured during the passage of Hurricane David in September 1979 over Florida were adopted for this purpose. Ochi and Chiu [36] reported wave characteristics from pressure transducer monitoring gauges located at three coastal sites along the eastern Florida coast as part of the Florida Coastal Data Network [50]. The sites are located at West Palm Beach (WB), Vero Beach (VB), and Miami Beach (MB) with coordinates 26°42′07” N 80°01′42″ W, 27°40′20″ N 80°21′07″ W, and 25°46′06″ N 80°07′23″ W respectively. The hurricane track in relation to each monitoring station and the recorded storm tide at each site during passage of the storm is presented in Figure 5.
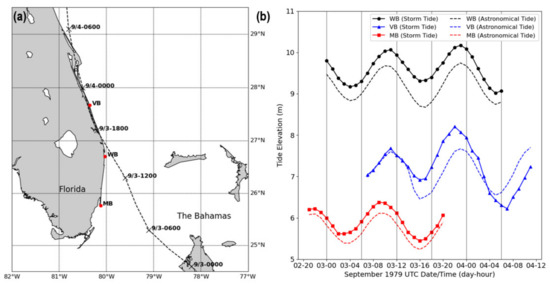
Figure 5.
(a) Track of Hurricane David over eastern Florida and (b) recorded storm tide depth relative to the astronomical tide at MB, WB, and VB monitoring stations over their time intervals of interest (extracted from Howell et al. [51]).
Figure 6a,b illustrate the comparison between the measured significant height () and peak frequency () with their counterparts predicted via the parametric model for Miami Beach. The observational period extended from 09/02 22:00 to 09/03 20:00 to which the shortest distance between the storm center and monitoring site was approximately 70.5 km. It is observed that the combined swell/wind-sea significant height predicted via the parametric model was largely successful in capturing the growth stage while significantly overestimating the decay phase as the storm continues northwards. The maximum predicted significant height of 3.01 m was also 14% greater than the 2.65 m observed at the station. The overestimation in during the decay stage may be attributed to model neglecting the presence of land in its treatment of swell and the estimation of equivalent fetch for wind waves. As the eye passes the MB site, northerly and westerly cyclonic winds prevail which primarily travels over land. Site conditions would therefore be governed by finite-depth wind waves with a reduced fetch than that determined from the model which assumes an unlimited expanse of water in all directions. The peak frequency was also consistently overestimated over the entire observation period. However, discrepancies between the measured and modeled becomes smaller as the distance between the eye and monitoring site decreases. Comparisons between the parametric spectral shape produced using Equation (29) and that witnessed at MB for times corresponding to the severest sea states are shown in Figure 7a with significant wave heights summarized in Table 1.
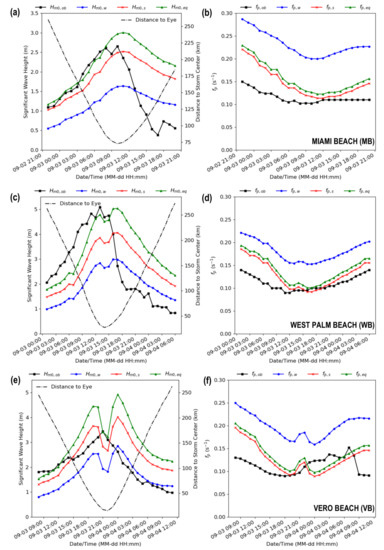
Figure 6.
Wind-sea (subscript ), swell (subscript ), and combined swell/wind-sea (subscript ) parametric results pertaining to the (a,c,e) significant wave height () and (b,d,f) peak frequency () when compared against site observations (subscript ) at Miami Beach (MB), West Palm Beach (WB), and Vero Beach (VB) respectively.
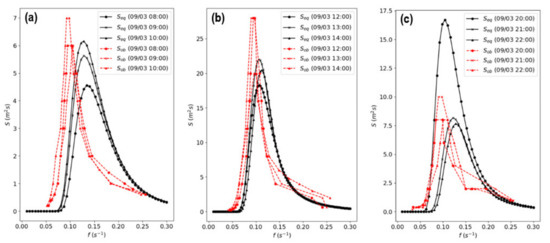
Figure 7.
Comparisons between observed () and modeled () wave spectra corresponding to times with the largest waves at (a) Miami Beach, (b) West Palm Beach, and (c) Vero Beach.

Table 1.
Summary of observed () and predicted () significant wave heights for MB, WB, and VB corresponding to times with the largest waves as presented in Figure 7.
Comparisons between measured and predicted significant heights and peak frequencies pertaining to West Palm Beach are highlighted in Figure 6c,d. The observational period extended from 09/03 01:00 to 09/04 06:00 with the shortest distance between the storm center and monitoring station at approximately 25 km. It is seen that the maximum produced via the parametric model of 5.04 m was 1.2% lower than the peak of 5.10 m observed at the site. Similar to Miami Beach, values were greatly overestimated during the decay stage of the storm. This result may likewise be attributed to local geographic conditions with winds predominately traveling over land as the eye passes the station before making landfall. A consistent overestimation of the peak frequency over the monitoring period is also observed. Like Miami Beach, discrepancies between and are smallest during maximum wind and wave conditions when the storm center is closest to the site. Comparisons between the parametric spectral shape produced using Equation (29) and that witnessed at WB for times corresponding to the severest sea states are shown in Figure 7b with significant wave heights summarized in Table 1.
Figure 6e,f compare the measured significant height and peak frequency with their counterparts predicted via the parametric model for Vero Beach. The observational period ranged from 09/03 08:00 to 09/04 11:00 with the shortest distance between the storm center and monitoring site at approximately 14.1 km, being well within the radius to maximum winds as predicted by Equation (3). The parametric significant wave height was overpredicted across most of the monitored duration with the maximum of 4.93 m exceeding the peak observed of 3.51 m by 40%. The relatively low waves captured at Vero Beach may be a result of the hurricane passing over land on approach as shown in Figure 5a. The predicted decrease in arising from a reduction in local wind as the station was enveloped within the radius to maximum winds () was also not observed, possibly indicating the dominance of larger swells during this interval. In terms of peak frequency, was overestimated during the growth stage but underestimated over the initial decay period. The steep increase in during the decay stage (not observed for MB and WB) was suggested to stem from the inland trajectory of the storm coinciding with the severest conditions at VB [36], a feature unable to accounted for in the parametric model. Comparisons between the parametric spectral shape produced using Equation (29) and that witnessed at VB for times corresponding to the severest sea states are shown in Figure 7c with significant wave heights summarized in Table 1.
In summary, comparisons between the proposed model and recorded observations at the three sites considered, as illustrated in Figure 6 and Figure 7, reveal that the parametric scheme generally produces a conservative estimate of the maximum significant wave height while predicting higher peak frequencies. This overestimation of therefore suggests the scheme may exhibit difficulties in fully accounting for low frequency swell components, especially when the storm is farther away from the observation site. However, the accuracy of model predictions appears to increase with decreasing distance to the storm center, thus enhancing its usefulness for purposes of engineering design. It must be further stressed that the proposed formulation does not account for the presence of land or bathymetric features unique to a given site. Hence, the hurricane track in relation to such features would undoubtedly result in discrepancies between predicted wave characteristics and those observed. Additional comparisons between the proposed scheme and nearshore wave observations during landfalling hurricanes are therefore recommended to further explore its potential and limitations under a range of different scenarios. Nevertheless, the model serves as a simplified tool for simulating the most severe shallow water waves under hurricane conditions and will be adopted for the assessment of Kinetic Umbrellas in the following section.
4. Kinetic Umbrellas Case Study
4.1. Geometric Description of Kinetic Umbrellas
The performance of kinetic umbrellas as adaptable floodwalls against hurricane-induced coastal inundation was subsequently evaluated using the proposed shallow water spectral model implemented within a SPH computational framework. The geometry of four-sided kinetic umbrellas adopted in this work were based upon Wang et al. [7] with each side measuring 8 m (yielding a projected area of 64 m2). Each umbrella (Figure 8b) was constructed via the merger of four straight-edged hypar quadrants (Figure 8a) defined mathematically via based on the axis shown in Figure 8a, where is the warping or twist of the umbrella [52]. The length of each square quadrant was maintained at = = 4 m while four different rises of = 0, 0.96 m, 1.92 m, and 2.88 m were adopted to adjust the extent of geometrical warping. This correlates to rise-over-area ratios of = 0, 0.015 m−1, 0.030 m−1, and 0.045 m−1, respectively, with = 0 effectively reflecting a conventional flat floodwall. Since kinetic umbrellas are designed to operate as part of a continuous impermeable barrier, two additional half umbrellas with the same rise were placed adjacent to the central umbrella to enforce this boundary condition as depicted in Figure 8c. All umbrellas are tilted at a constant angle of inclination of 70° via a column supporting the vertex, yielding a total deployed height of 7.52 m. Full 3D models of the umbrellas exhibiting their respective ratios implemented with the SPH simulation are shown in Figure 8d–g.
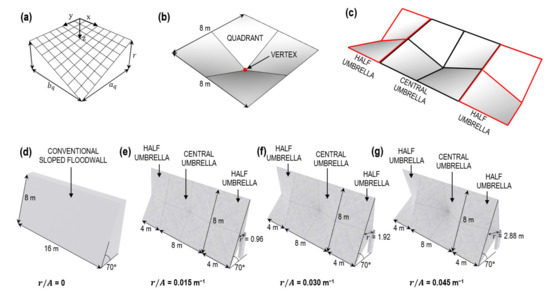
Figure 8.
(a) Geometric description of a hypar quadrant (b) used to create a typical four-sided hypar umbrella (c) with the central umbrella flanked by two half umbrellas to enforce boundary conditions; 3D models of Kinetic Umbrellas implemented within the SPH simulation with ratios of (d) 0 (i.e., conventional sloped floodwall), (e) 0.015 m−1, (f) 0.030 m−1, and (g) 0.045 m−1 also shown.
4.2. SPH Computational Domain
SPH is a mesh-free Lagrangian particle method commonly adopted for the simulation of fluid behavior involving free surface flows [24]. In this work, the open-source CUDA-accelerated solver DualSPHysics [28] was implemented to solve the governing equations (fully detailed in the Appendix A). The discretized Navier-Stokes momentum equation applying Monaghan’s artificial viscosity scheme [53] was implemented to determine fluid forces acting upon the hypar specimens. A weakly compressible approach subsequently enables the pressure-density relationship to be computed via the Murnaghan-Tait equation of state [54]. Dynamic boundary conditions [55] were adopted to model the boundaries of the domain, including all solid objects, to which boundary particles exert a repulsive force on approaching fluid particles to prevent fluid penetration. All boundary particles utilize the same equations of continuity and state as their fluid counterparts, but their positions remain static or translate according to some predefined displacement. A complete description of the SPH formulism implemented within this work is detailed within the Appendix A.
Figure 9a,b present a schematic and 3D view of the SPH computation domain with all relevant dimensions indicated, respectively. A still water elevation of 9.3 m was implemented to reflect the conditions at West Palm Beach during the most severe waves and constitutes an intermediate water depth condition. This location was selected since the largest waves were recorded here. Two inundation depths () at the floodwall of 4 m and 5 m were adopted by adjusting the length of the slope leading up to the barrier while maintaining a constant angle of 6.1° as shown in the table in Figure 9a. A piston wavemaker (composed of boundary particles) was positioned at the seaward end of the domain, which was used to generate waves consistent with the spectra at West Palm Beach. The floodwall/kinetic umbrellas (Figure 8d–g) were first modeled in SketchUp Pro 2020 [56] and exported into the computational domain in STL format. The imported geometry was discretized into a triangular lattice by the DualSPHysics preprocessor before being converted into boundary particles. An overtopping collection zone was defined between the rear face of each barrier and the shoreward end of the domain (Figure 9a). The volume of overtopped water may therefore be determined by the DualSPHysics solver by counting the number of particles entering the zone. Particles with an initial interparticle spacing () of 0.15 m were employed across all simulations. This gives rise to an approximate number of fluid particles of 3.25 × 10⁶ and 3.1 × 10⁶ for = 4 m and 5 m respectively. Each simulation spans 80 s of physical time () with a sampling frequency of 5 s−1 and was performed utilizing a NVIDIA GeForce RTX 2080Ti GPU with 4352 CUDA cores. This enables a sufficient number of waves to contact the structure such that overtopping can be captured, while still ensuring simulations can be completed within a reasonable timeframe (with each run taking approximately 19 h).
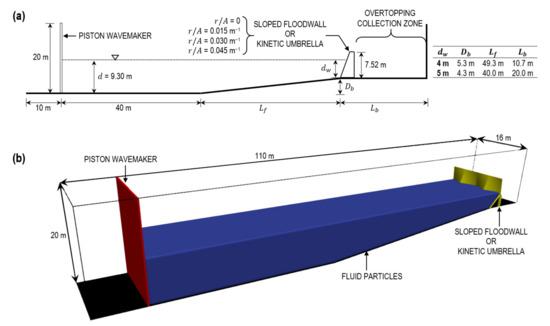
Figure 9.
(a) Elevation and (b) 3D view of SPH computational domain with all relevant dimensions denoted.
4.3. Validation of Numerical Model
Prior to investigating the behavior of kinetic umbrellas, the numerical scheme was first validated against empirical solutions to ensure its validity. 2D SPH simulations (with = 0.15 m) implementing the sloped floodwall (Figure 8d) were performed to determine the maximum wave force produced from monochromatic (regular) waves. Such waves were produced by moving the piston according to second-order wavemaker theory, with its motion automatically defined by DualSPHysics based on a prescribed wave height () and wave period () [57]. Wave forces from SPH were compared against empirical solutions proposed by Tanimoto and Kimura [58] applicable to sloping seawalls and breakwaters (as an extension to the Goda relations [6]) to gauge the performance of the model. For regular waves of height and wavelength , The quasi-static wave pressures shown in Figure 10 are:
where is the density of water and:
while the wavelength is determined from the period (and thus frequency) via the dispersion relation:
where . The total force per unit width is therefore the sum of the wave pressures depicted in Figure 10, and the corresponding hydrostatic component with a value of at the base. Comparisons between SPH and empirical forces were conducted for both inundation depths of = 4 m and 5 m across three different wave periods (5 s, 7.5 s, and 10 s) and wave heights (1 m, 2 m, and 3 m). Figure 11 and Table 2 illustrate the results of the comparison between SPH and Tanimoto and Kimura wave forces for both inundation depths. For the wave periods and heights considered, the mean absolute error across all cases are 4.17% and 6.46% pertaining to = 4 m and 5 m respectively.
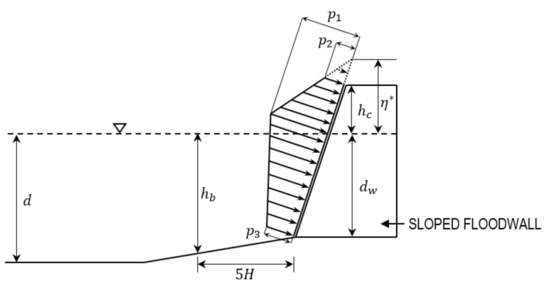
Figure 10.
Parameters used for the computation of maximum wave pressures on sloped barriers per Tanimoto and Kimura [58].
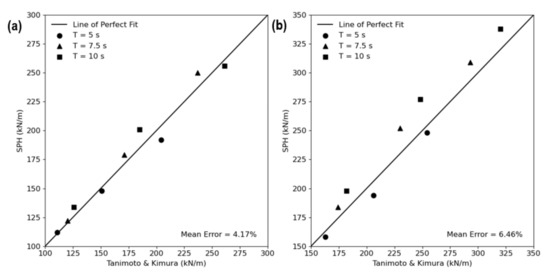
Figure 11.
Comparison between empirical and SPH maximum wave forces on the sloped floodwall for (a) = 4 m and (b) = 5 m.

Table 2.
Summary of empirical and SPH maximum wave forces on the sloped floodwall as shown in Figure 11.
4.4. Performance of Kinetic Umbrellas subject to Hurricane Wave Conditions
The depth-limited hurricane wave spectrum produced via the parametric scheme through Equation (29) pertaining to West Palm Beach at 09/03 16:00 was selected for the generation of irregular waves to assess the performance of kinetic umbrellas as flood barriers. This corresponds to the maximum predicted significant wave height () and is illustrated in Figure 12a, along with the measured spectrum corresponding to the observed maximum, . To prescribe the wavemaker displacement time history, the spectrum is first discretized into = 100 frequency intervals uniformly distributed for . The wave amplitude associated with each discrete frequency is therefore:
where is the constant width of each frequency band. The wavemaker displacement as a function of time is thus:
with being the angular frequency of and is an arbitrary phase shift randomly sampled from a uniform distribution between and . denotes the Biesel transfer function of a piston-type wavemaker assuming irrotational and incompressible fluid behavior with constant pressure at the free surface [57]:
where the wavenumber is determined using Equation (33) and is a wavemaker ramping term to avoid potential numerical instability [1]:
where , with being the period associated with the peak frequency . The wavemaker displacement per Equation (35) is shown via Figure 12b. The free surface elevation history and wave heights relative to at a location 40 m from the wavemaker’s initial position (and halfway between the longitudinal boundaries of the domain) for = 4 m and = 5 m is also shown via Figure 12c and d respectively. Given a total simulation time of = 80 s, the maximum nondimensional time normalized against the peak period is therefore = 8.56.
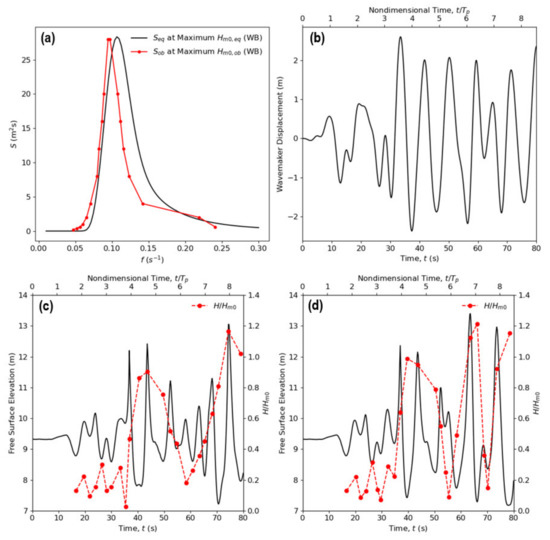
Figure 12.
(a) Wave spectrum adopted for the generation of hurricane waves with (b) associated wavemaker displacement time history; free surface elevation and wave heights relative to located 40 m from the midpoint of the wavemaker for (c) = 4 m and (d) = 5 m also shown.
Figure 13 summarizes the cumulative overtopping, (in m3/m) and the maximum horizontal base shear, (in kN/m) across all four ratios for both inundation depths of = 4 m and 5 m. Recalling that = 0 infers the sloped floodwall, overtopping and base shear ratios are also presented being:
which enables the relative comparison between the performance of Kinetic Umbrellas and that of a conventional sloped barrier with the seaward face inclined at the same angle (70° in this case). It is seen from Figure 13a that increasing leads to a reduction in overtopping for both inundation depths. However, examining the cumulative overtopping ratio (Figure 13b) reveals that while increasing from 0 to 0.015 m−1 results in a minimal decrease in overtopping for = 4 m (equivalent to 53% of the total deployed height), further increases in hypar warping leads to much more significant reductions. For example, adopting = 0.045 m−1 corresponds to a 73% decrease in overtopping relative to the conventional floodwall. However, the same is not witnessed for = 5 m (equivalent to 66% of the total deployed height) with = 0.045 m−1 yielding only a modest 12% reduction in cumulative overtopping. The occurrence of wave overtopping at approximately = 50 s for = 4 m and 5 m across all ratios is visually presented in Figure 14 via the VisualSPHysics plugin [59] implemented within the rendering engine Blender v2.8 [60]. It is clear that at the lower inundation depth of 4 m, hypar warping significantly contributes to wave reflection, manifesting as a plunging breaker concentrated about the plane of symmetry for each umbrella. As increases to 5 m however, the contribution of structural geometry in redirecting incoming waves diminishes as a greater portion of the hypar form is now located below the still water level. Therefore, the adoption of hypar geometry exemplified via kinetic umbrellas appears to offer little benefit in suppressing wave overtopping for inundation depths greater than approximately two-thirds of the maximum deployed height for this particular case study. In terms of the maximum horizontal base shear, Figure 13c indicates a positive relationship between and . Figure 13d also appears to depict a relatively linear relationship between the maximum base shear ratio and for both inundation depths considered. Note that the structural behavior and design of kinetic umbrellas in response to wave forces is beyond the scope of this work and will be investigated in a future study.
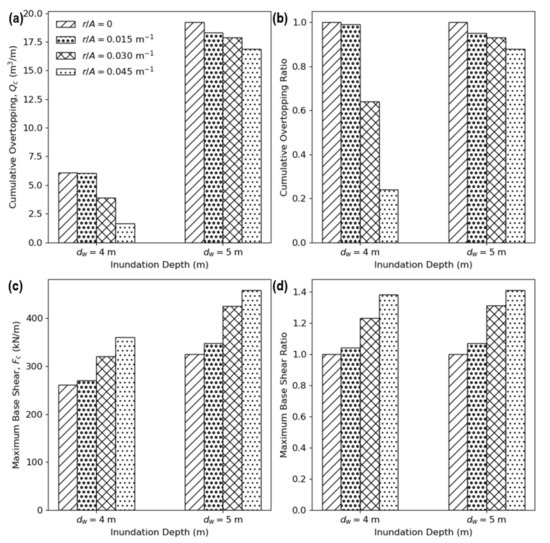
Figure 13.
(a) Cumulative overtopping with (b) overtopping ratio relative to = 0 and (c) maximum horizontal base shear with (d) maximum base shear ratio relative to = 0 for various and .
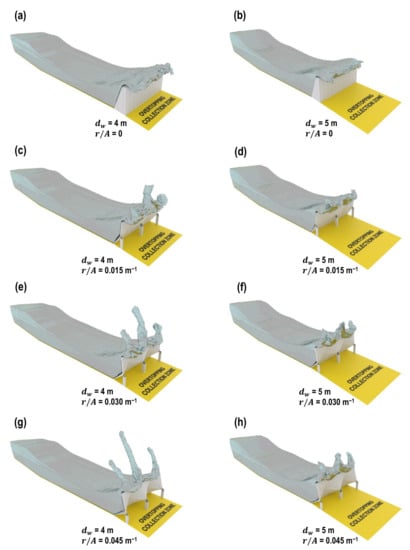
Figure 14.
Observations of wave overtopping at approximately = 50 s pertaining to = 4 m and = 5 m for (a,b) = 0, (c,d) = 0.015 m−1, (e,f) = 0.030 m−1, and (g,h) = 0.045 m−1 for Kinetic Umbrellas subject to hurricane wave conditions.
5. Discussion and Conclusions
This work introduced a simplified parametric scheme for the prediction of hurricane wave characteristics in the depth-limited regime. The objective is to provide a direct method of reproducing shallow water wave spectra during landfalling hurricanes to aid the preliminary design of coastal structures without resorting to sophisticated numerical wave models. The originality of the scheme lies in the adaptation of existing empirical and analytical formulations to the nearshore transformation of hurricane swells coupled with depth-limited wind waves, while leveraging the underlying assumption that swells are produced by the same wind conditions promoting local wave growth at the site. To assess its performance, the parametric model was evaluated against measured observations from three shallow water stations along the Florida east coast during the passage of Hurricane David in early September 1979. It was revealed that the proposed scheme generally provides a conservative estimate of the maximum significant wave height while overestimating the peak frequency associated with the unimodal spectrum. It must be noted that since the model requires only the local depth and relevant hurricane properties as input, it is unable to account for the presence of land or other geographic/bathymetric features unique to a particular site. As such, any potential damping effects associated with such features which may inhibit the growth of waves or promote their breaking would not be captured. Nevertheless, the proposed methodology is likely to prove useful as a conservative starting point for the design or analysis of coastal installations subject to landfalling hurricane wave attack.
The parametric scheme was subsequently adopted for the simulation of shallow water sea states based on Hurricane David in order to evaluate the performance of kinetic umbrellas, conceptualized by Wang et al. [7] as an adaptable alternative to conventional floodwalls. Inspired by the hyperbolic paraboloidal (hypar) concrete shells pioneered by structural artist Félix Candela, such structures may readily tilt from an initially upright position into a physical barrier against surge-induced coastal inundation. The extent of hypar warping was varied across four rise-over-area () ratios of 0, 0.015 m−1, 0.030 m−1, and 0.045 m−1, where = 0 essentially portrays a conventional sloped floodwall. Through the use of smoothed particle hydrodynamics (SPH), it was demonstrated that kinetic umbrellas with greater warping exhibit reduced overtopping, while experiencing larger horizontal base shears. However, the contribution of warping in suppressing overtopping waves diminishes with increasing depths of inundation. Ultimately, the adoption of hypar geometry proves advantageous for coastal armoring solutions and its integration into floodwall designs is recommended to limit wave overtopping during hurricane or severe sea conditions.
Nevertheless, it must be acknowledged that this work considered only doubly-symmetric square kinetic umbrellas tilted at a single angle of inclination. In order to fully explore the potential of hypar geometry in mitigating storm inundation events, the performance of kinetic umbrellas across a range of geometric configurations (including asymmetrical forms) and deployment angles must be investigated. Furthermore, the structural behavior of the hypar shell, constituting bending, shear, and normal stresses, under wave loading has yet to be explored. Such considerations will be addressed within future work as part of an ongoing endeavor to advance the concept of adaptable Aquatecture for coastal defense applications.
Author Contributions
Conceptualization, S.W.; methodology, S.W.; software, S.W.; validation, S.W.; formal analysis, S.W.; writing—original draft preparation, S.W.; writing—review and editing, M.G. and B.G.; supervision, M.G. and B.G.; funding acquisition, M.G. All authors have read and agreed to the published version of the manuscript.
Funding
This research was funded by Princeton University through the “Project X” grant and the Metropolis Project of Princeton University.
Institutional Review Board Statement
Not applicable.
Informed Consent Statement
Not applicable.
Data Availability Statement
Data sets are contained within the article. Please contact the corresponding author regarding further access to data.
Acknowledgments
The authors gratefully acknowledge Mauricio Loyola, affiliated with the School of Architecture at Princeton University, for contributing to the production of Figure 1.
Conflicts of Interest
The authors declare no conflict of interest.
Notations
For brevity, nomenclature used within the appendix are not included in the following list as they are not directly relevant to the main objectives of the study. Note that in the appendix, all variables expressed in bold denote vectors in Euclidean space.
| , | Projected length and width of umbrella quadrant (Figure 8a) |
| Water depth | |
| Inundation depth at floodwall | |
| Width of frequency band | |
| Frequency | |
| Coriolis parameter | |
| Peak frequency of deep water spectrum (Equation (10)) | |
| Combined wind-sea/swell peak frequency (Equation (26)) | |
| Measured peak frequency | |
| Peak frequency of TMA spectrum (Equation (28)) | |
| Peak frequency of shallow water wind-sea (Equation (14)) | |
| Gravitational acceleration | |
| Water depth at distance away from floodwall | |
| Vertical distance from mean water level to top of floodwall | |
| Wavenumber | |
| Warping constant of Kinetic Umbrella | |
| Combined wind-sea/swell spectral energy (Equation (27)) | |
| Zeroth-order moment of the TMA spectrum (Equation (25)) | |
| Pressure deficit in hPa | |
| Central pressure of hurricane in hPa | |
| , , | Quasi-static wave pressures on inclined barrier (Equation (31)) |
| Ambient atmospheric pressure taken as 1013.25 hPa | |
| Rise of Kinetic Umbrella (Figure 8a) | |
| Distance from hurricane center to observation site | |
| Wavemaker ramping function (Equation (37)) | |
| Time | |
| Maximum physical time simulated | |
| Equivalent hurricane fetch (Equation (20)) | |
| Wavemaker displacement (Equation (35)) | |
| Projected area of Kinetic Umbrella | |
| See Equation (15) | |
| See Equation (17) | |
| Wave amplitude associated with frequency component or (Equation (34)) | |
| See Equation (2) | |
| See Equation (16) | |
| See Equation (18) | |
| See Equation (2) | |
| Spectral energy of deep water spectrum (Equation (11)) | |
| Spectral energy of shallow water wind-sea (Equation (13)) | |
| Maximum horizontal base shear in kN/m | |
| Wave height | |
| Combined wind-sea/swell significant wave height (Equation (24)) | |
| Measured significant wave height | |
| Significant wave height of hurricane swell (Equation (25)) | |
| Significant wave height of wind-sea (Equation (24)) | |
| Wavelength | |
| Cumulative overtopping in m3/m | |
| See Equation (21) | |
| Radius to maximum winds (Equation (3)) | |
| Combined wind-sea/swell spectrum (Equation (29)) | |
| Measured wave spectrum | |
| TMA spectrum applied to the Donelan spectral model (Equation (6)) | |
| Wave period | |
| = | |
| Wave period associated with peak frequency | |
| Near-surface wind speed (Equation (4)) | |
| Forward speed of hurricane | |
| Near-surface wind speed at radius to maximum winds (Equation (23)) | |
| Gradient wind speed (Equation (1)) | |
| Gradient wind speed near ocean surface | |
| , , , | Coefficients to determine quasi-static wave pressures (Equation (32)) |
| See Equation (12) | |
| See Equation (12) | |
| Nondimensional water depth (Equation (19)) | |
| Nondimensional total energy of deep water spectrum (Equation (10)) | |
| Nondimensional total energy of shallow water wind-sea (Equation (13)) | |
| Vertical distance above mean water level such that = 0 | |
| Translational bearing of hurricane | |
| Forward azimuth from hurricane center to point of observation | |
| See Equation (5) | |
| Longitude | |
| Longitude of hurricane center | |
| Nondimensional peak frequency of deep water spectrum (Equation (10)) | |
| Nondimensional peak frequency of combined wind-sea/swell spectrum (Equation (30)) | |
| Nondimensional peak frequency of shallow water wind-sea (Equation (14)) | |
| Biesel transfer function of piston wavemaker | |
| Air density taken as 1.2 kgm−3 | |
| Water density taken as 1000 kgm−3 | |
| See Equation (12) | |
| Latitude | |
| Arbitrary phase shift associated with frequency component or | |
| Latitude of hurricane center | |
| TMA scaling parameter (Equation (7)) | |
| Nondimensional hurricane fetch (Equation (19)) | |
| See Equation (22) | |
| Angular frequency | |
| See Equation (8) |
Appendix A
In SPH, a continuum is discretized into particles exhibiting physical properties including position, velocity, density, and pressure. Such quantities for any given particle are computed via the integral interpolant of adjacent particles within its support domain. The extent to which each nearby particle influences a given property is dependent upon the interparticle distance, where a kernel function () is adopted to quantify this contribution. The weighted interpolant approximating any quantity field is:
where is the position vector in , denotes the position of all remaining particles within the support domain and is the smoothing length. In discrete form, Equation (39) is expressed as:
with and respectively denoting the mass and density of particle , and is the weighting kernel. In this work, the Wendland quintic kernel [61] was selected:
where is the ratio between the interparticle distance and smoothing length and . Particle velocities are computed from the Navier-Stokes momentum equation expressed in discrete form via the artificial viscosity scheme [53]:
where is the velocity, denotes the pressure, and is the gravitational acceleration vector. is the viscous term representing an artificial viscosity model [62]:
with:
and respectively denote the relative velocity and position of the particle, , and is the average speed of sound. The artificial viscosity coefficient is designed to prevent numerical instability and spurious oscillations [63], to which Altomare et al. [29] and Barreiro et al. [30] suggests a value of 0.01 for the consideration of water interaction with coastal structures. Furthermore, changes in the fluid density were obtained via discretization of the continuity equation:
As such, the weakly compressible fluid formulation was adopted such that an equation of state [54] may be utilized to determine the pressure-density relationship:
where = 1000 kgm−3 is the fluid reference density, = 7 [62], and is an artificial speed of sound to suppress density fluctuations within 1% of [64]. Time-stepping was conducted via the Verlet scheme [65] implementing a variable time step according to the Courant-Friedrichs-Lewy condition [66]:
where is the force magnitude per unit mass of particle and = 0.2.
References
- Ning, D.; Wang, R.; Chen, L.; Li, J.; Zang, J.; Cheng, L. Extreme Wave Run-up and Pressure on a Vertical Seawall. Appl. Ocean. Res. 2017, 67, 188–200. [Google Scholar] [CrossRef]
- United States Coastal Engineering Manual; U.S. Army Corps of Engineers: Washington, DC, USA, 2015.
- Thompson, E.F.; Vincent, C.L. Significant Wave Height for Shallow Water Design. J. Waterw. Port Coast. Ocean. Eng. 1985, 111, 828–842. [Google Scholar] [CrossRef]
- Chiu, Y.-F.; Lin, J.-G.; Chang, S.-C.; Lin, Y.-J.; Chen, C.-H. An Experimental Study of Wave Forces on Vertical Breakwater. J. Mar. Sci. Technol. 2007, 15, 158–170. [Google Scholar]
- Komori, S.; Tanaka, H.; Wada, A. Simulation Method of Ocean Wave Spectra in an Experimental Basin and Its Application to the Study on Wave Pressure. Coast. Eng. Jpn. 1978, 21, 51–61. [Google Scholar] [CrossRef]
- Goda, Y. Random Seas and Design of Maritime Structures; World Scientific Publishing Co.: Singapore, 2000. [Google Scholar]
- Wang, S.; Garlock, M.; Glisic, B. Hydrostatic Response of Deployable Four-Sided Hyperbolic Paraboloid Shells as Coastal Armor. J. Struct. Eng. 2020, 146, 04020096. [Google Scholar] [CrossRef]
- Garlock, M.E.M.; Billington, D.P. Felix Candela: Engineer, Builder, Structural Artist; Princeton University Art Museum: Princeton, NJ, USA, 2008; p. 8544. [Google Scholar]
- The SWAN Team. SWAN Scientific and Technical Documentation (Cycle III Version 41.10A); Delft University of Technology: Delft, The Netherlands, 2012. [Google Scholar]
- NOAA/NWS/NCEP/MMAB. WW3DG; User Manual and System Documentation of WAVEWATCH III Version 5.16; Tech. Note 329; NOAA/NWS/NCEP/MMAB: College Park, MD, USA, 2016; p. 326. [Google Scholar]
- Chen, X.; Ginis, I.; Hara, T. Sensitivity of Offshore Tropical Cyclone Wave Simulations to Spatial Resolution in Wave Models. J. Mar. Sci. Eng. 2018, 6, 116. [Google Scholar] [CrossRef]
- Moon, I.-J.; Ginis, I.; Hara, T. Numerical Simulation of Sea Surface Directional Wave Spectra under Hurricane Wind Forcing. J. Phys. Oceanogr. 2003, 33, 1680–1706. [Google Scholar] [CrossRef]
- Abdolali, A.; Roland, A.; van der Westhuysen, A.; Meixner, J.; Chawla, A.; Hesser, T.J.; Smith, J.M.; Sikiric, M.D. Large-Scale Hurricane Modeling Using Domain Decomposition Parallelization and Implicit Scheme Implemented in WAVEWATCH III Wave Model. Coast. Eng. 2020, 157, 103656. [Google Scholar] [CrossRef]
- Hasselmann, K.; Barnett, T.P.; Bouws, E.; Carlson, H.; Cartwright, D.E.; Enke, K.; Ewing, J.A.; Gienapp, H.; Hasselmann, D.E.; Kruseman, P.; et al. Measurements of Wind-Wave Growth and Swell Decay during the Joint North Sea Wave Project (JONSWAP); Deutches Hydrographisches Institut: Hamburg, Germany, 1973; p. 95. [Google Scholar]
- Whalen, J.E.; Ochi, M.K. Variability of Wave Spectral Shapes Associated with Hurricanes. In Proceedings of the Offshore Technology Conference, Houston, TX, USA, 8–11 May 1978. [Google Scholar]
- Young, I.R. Parametric Hurricane Wave Prediction Model. J. Waterw. Port Coast. Ocean Eng. 1988, 114, 637–652. [Google Scholar] [CrossRef]
- Ochi, M.K. On Hurricane-Generated Seas. In Proceedings of the Second International Symposium on Ocean Wave Measurement and Analysis, New Orleans, LA, USA, 25–28 July1993; ASCE: New Orleans, LA, USA, 1993; pp. 374–387. [Google Scholar]
- Young, I.R. Observations of the Spectra of Hurricane Generated Waves. Ocean Eng. 1998, 25, 261–276. [Google Scholar] [CrossRef]
- Donelan, M.A.; Hamilton, J.; Hui, W.H. Directional Spectra of Wind-Generated Ocean Waves. Philos. Trans. R. Soc. A 1985, 315, 509–562. [Google Scholar] [CrossRef]
- Young, I.R. A Review of the Sea State Generated by Hurricanes. Mar. Struct. 2003, 16, 201–218. [Google Scholar] [CrossRef]
- Saville, T. Laboratory Data on Wave Run-up and Overtopping on Shore Structures; US Army Corps of Engineers: Washington, DC, USA, 1955. [Google Scholar]
- Owen, M.W. Design of Seawalls Allowing for Wave Overtopping; HR Wallingford Report EX924; HR Wallingford: Wallingford, UK, 1980. [Google Scholar]
- EurOtop. Manual on Wave Overtopping of Sea Defences and Related Structures. In An Overtopping Manual Largely Based on European Research, but for Worldwide Application; Van Der Meer, J.W., Allsop, N.W.H., Bruce, T., De Rouck, J., Kortenhaus, A., Pullen, T., Schüttrumpf, H., Troch, P., Zanuttigh, B., Eds.; EurOtop: London, UK, 2018. [Google Scholar]
- Liu, M.B.; Liu, G.R. Smoothed Particle Hydrodynamics (SPH): An Overview and Recent Developments. Arch. Comput. Methods Eng. 2010, 17, 25–76. [Google Scholar] [CrossRef]
- Zhu, M.; Scott, M.H. Modeling Fluid–Structure Interaction by the Particle Finite Element Method in OpenSees. Comput. Struct. 2014, 132, 12–21. [Google Scholar] [CrossRef]
- Kolaei, A.; Rakheja, S.; Richard, M.J. Three-Dimensional Dynamic Liquid Slosh in Partially-Filled Horizontal Tanks Subject to Simultaneous Longitudinal and Lateral Excitations. Eur. J. Mech. B/Fluids 2015, 53, 251–263. [Google Scholar] [CrossRef]
- Liu, G.R.; Gu, Y.T. An Introduction to Meshfree Methods and Their Programming, 1st ed.; Springer: Dordrecht, The Netherlands, 2005; ISBN 978-1-4020-3468-8. [Google Scholar]
- Crespo, A.J.C.; Dominguez, J.M.; Rogers, B.D.; Gomez-Gesteira, M.; Longshaw, S.; Canelas, R.; Vacondio, R.; Barreiro, A.; Garcia-Feal, O. DualSPHysics: Open-Source Parallel CFD Solver Based on Smoothed Particle Hydrodynamics (SPH). Comput. Phys. Commun. 2015, 187, 204–216. [Google Scholar] [CrossRef]
- Altomare, C.; Crespo, A.J.C.; Dominguez, J.M.; Gomez-Gesteira, M.; Suzuki, T.; Verwaest, T. Applicability of Smoothed Particle Hydrodynamics for Estimation of Sea Wave Impact on Coastal Structures. Coast. Eng. 2015, 96, 1–12. [Google Scholar] [CrossRef]
- Barreiro, A.; Crespo, A.J.C.; Dominguez, J.M.; Gomez-Gesteira, M. Smoothed Particle Hydrodynamics for Coastal Engineering Problems. Comput. Struct. 2013, 120, 96–106. [Google Scholar] [CrossRef]
- Altomare, C.; Dominguez, J.M.; Crespo, A.J.C.; Gonzalez-Cao, J.; Suzuki, T.; Gomez-Gesteira, M.; Troch, P. Long-Crested Wave Generation and Absorption for SPH-Based DualSPHysics Model. Coast. Eng. 2017, 127, 37–54. [Google Scholar] [CrossRef]
- Dang, B.-L.; Nguyen-Xuan, H.; Wahab, M.A. Numerical Study on Wave Forces and Overtopping over Various Seawall Structures Using Advanced SPH-Based Method. Eng. Struct. 2020, 226, 111349. [Google Scholar] [CrossRef]
- Bouws, E.; Gunther, H.; Rosenthal, W.; Vincent, C.L. Similarity of the Wind Wave Spectrum in Finite Water. J. Geophys. Res. 1985, 90, 975–986. [Google Scholar] [CrossRef]
- Breugem, W.A.; Holthuijsen, L.H. Generalized Shallow Water Wave Growth from Lake George. J. Waterw. Port Coast. Ocean Eng. 2007, 133, 173–182. [Google Scholar] [CrossRef]
- Young, I.R.; Verhagen, L.A. The Growth of Fetch Limited Waves in Water of Finite Depth. Part 1. Total Energy and Peak Frequency. Coast. Eng. 1996, 29, 47–78. [Google Scholar] [CrossRef]
- Ochi, M.K.; Chiu, M.-H. Nearshore Wave Spectra Measured during Hurricane David. In Proceedings of the International Conference on Coastal Engineering, Cape Town, South Africa, 14–19 November 1982. [Google Scholar]
- Holland, G.J. An Analytic Model of the Wind and Pressure Profiles in Hurricanes. Mon. Weather Rev. 1980, 108, 1212–1218. [Google Scholar] [CrossRef]
- Vickery, P.J.; Skerlj, P.F.; Twisdale, L.A. Simulation of Hurricane Risk in the U.S. Using Empirical Track Model. J. Struct. Eng. 2000, 126, 1222–1237. [Google Scholar] [CrossRef]
- Shea, D.J.; Gray, W.M. The Hurricane’s Inner Core Region. I. Symmetric and Asymmetric Structure. J. Atmos. Sci. 1973, 30, 1544–1564. [Google Scholar] [CrossRef]
- Powell, M.D. Evaluations of Diagnostic Marine Boundary-Layer Models Applied to Hurricanes. Mon. Weather Rev. 1980, 108, 757–766. [Google Scholar] [CrossRef]
- Kennedy, A.B.; Gravois, U.; Zachry, B. Observations of Landfalling Wave Spectra during Hurricane Ike. J. Waterw. Port Coast. Ocean Eng. 2011, 137, 142–145. [Google Scholar] [CrossRef]
- Kitaigordskii, S.A.; Krasitskii, V.P.; Zaslavskii, M.M. On Phillips’ Theory of Equilibrium Range in the Spectra of Wind-Generated Gravity Waves. J. Phys. Oceanogr. 1975, 5, 410–420. [Google Scholar] [CrossRef]
- Reeve, D.; Chadwick, A.; Fleming, C. Coastal Engineering: Processes, Theory & Design Practice; Taylor and Francis Group: Boca Raton, FL, USA, 2018. [Google Scholar]
- Thompson, E.F.; Vincent, C.L. Prediction of Wave Height in Shallow Water. In Proceedings of the Specialty Conference on Design, Construction, Maintenance and Performance of Coastal Structures, Arlington, VA, USA, 9–11 March 1983; American Society of Civil Engineers: New York, NY, USA; pp. 1000–1008. [Google Scholar]
- Van der Meer, J.W.; Janssen, J.P.F.M. Wave run-up and wave overtopping at dikes. In Wave Forces on Inclined and Vertical Wall Structures; ASCE: New York, NY, USA, 1995; pp. 1–27. [Google Scholar]
- Buckley, M.; Lowe, R.; Hansen, J. Evaluation of Nearshore Wave Models in Steep Reef Environments. Ocean Dyn. 2014, 64, 847–862. [Google Scholar] [CrossRef]
- Battjes, J.A.; Janssen, J.P.F.M. Energy Loss and Set-up Due to Breaking of Random Waves. In Proceedings of the 16th International Conference on Coastal Engineering, Hamburg, Germany, 27 August–3 September 1978; pp. 569–587. [Google Scholar]
- Battjes, J.A.; Stive, M.J.F. Calibration and Verification of a Dissipation Model for Random Breaking Waves. J. Geophys. Res. 1985, 90, 9159–9167. [Google Scholar] [CrossRef]
- Kaminsky, G.M.; Kraus, N.C. Evaluation of Depth-Limited Wave Breaking Criteria. In Proceedings of the 2nd International Symposium on Ocean Wave Measurement and Analysis; American Society of Civil Engineers: New Orleans, LA, USA, 1993; pp. 180–193. [Google Scholar]
- Howell, G.L. Florida Coastal Data Network. In Proceedings of the 17th International Conference on Coastal Engineering, Sydney, Australia, 23–28 March 1980; Volume 1, pp. 421–431. [Google Scholar]
- Howell, G.; Lee, D.Y.; Wang, H. Storm Surge Measurements and Computations for Hurricane David; Coastal & Oceanographic Engineering Department, University of Florida: Gainesville, FL, USA, 1982. [Google Scholar]
- Wang, S.; Levine, A.; Garlock, M.; Contreras-Jimenez, J.A.; Jorquera-Lucerga, J.J. Structural Evaluation of Felix Candela’s 8-Sided Hyperbolic Paraboloidal Umbrellas. Eng. Struct. 2020, 222, 111156. [Google Scholar] [CrossRef]
- Monaghan, J.J. Smoothed Particle Hydrodynamics. Annu. Rev. Astron. Astrophys. 1992, 30, 543–574. [Google Scholar] [CrossRef]
- Batchelor, G.K. An Introduction to Fluid Dynamics; Cambridge Mathematical Library: Cambridge, UK, 2000. [Google Scholar]
- Crespo, A.J.C.; Gomez-Gesteira, M.; Dalrymple, R.A. Boundary Conditions Generated by Dynamic Particles in SPH Methods. Comput. Mater. Contin. 2007, 5, 173–184. [Google Scholar]
- SketchUp. Available online: https://www.sketchup.com (accessed on 17 April 2020).
- The DualSPHysics Team. Users Guide for DualSPHysics Code v4.2; University of Manchester: Manchester, UK, 2018. [Google Scholar]
- Tanimoto, K.; Kimura, K. A Hydraulic Experimental Study on Trapezoidal Caisson Breakwaters; Technical note of the Port and Harbour Research Institute, Ministry of Transport: Yokosuka, Japan, 1985. [Google Scholar]
- Garcia-Feal, O.; Crespo, A.J.C.; Dominguez, J.M. Advanced Fluid Visualization with DualSPHysics and Blender. In Proceedings of the 11th International SPHERIC Workshop, Munich, Germany, 14–16 June 2016; pp. 239–245. [Google Scholar]
- Community, B.O. Blender—A 3D Modelling and Rendering Package; Stichting Blender Foundation: Amsterdam, The Netherlands, 2018. [Google Scholar]
- Wendland, H. Piecewise Polynomial, Positive Definite and Compactly Supported Radial Functions of Minimal Degree. Adv. Comput. Math. 1995, 4, 389–396. [Google Scholar] [CrossRef]
- Monaghan, J.J. Simulating Free Surface Flows with SPH. J. Comput. Phys. 1994, 110, 399–406. [Google Scholar] [CrossRef]
- Crespo, A.J.C.; Dominguez, J.M.; Barreiro, A.; Gomez-Gesteira, M.; Rogers, B.D. GPUs, a New Tool of Acceleration in CFD: Efficiency and Reliability on Smoothed Particle Hydrodynamics Methods. PLoS ONE 2011, 6, e20685. [Google Scholar] [CrossRef]
- Monaghan, J.J. Smoothed Particle Hydrodynamics and Its Diverse Applications. Annu. Rev. Fluid Mech. 2012, 44, 323–346. [Google Scholar] [CrossRef]
- Verlet, L. Computer “Experiments” on Classical Fluids. I. Thermodynamical Properties of Lennard-Jones Molecules. Phys. Rev. 1967, 159, 98–103. [Google Scholar] [CrossRef]
- Monaghan, J.J.; Kos, A. Solitary Waves on a Cretan Beach. J. Waterw. Port Coast. Ocean Eng. 1999, 125, 145–155. [Google Scholar] [CrossRef]
Publisher’s Note: MDPI stays neutral with regard to jurisdictional claims in published maps and institutional affiliations. |
© 2021 by the authors. Licensee MDPI, Basel, Switzerland. This article is an open access article distributed under the terms and conditions of the Creative Commons Attribution (CC BY) license (http://creativecommons.org/licenses/by/4.0/).