Abstract
Accurate estimation of pan evaporation (Ep) is vital for the development of water resources and agricultural water management, especially in arid and semi-arid regions where it is restricted to set up the facilities and measure pan evaporation accurately and consistently. Besides, using pan evaporation estimating models and pan coefficient (kp) models is a classic method to assess the reference evapotranspiration (ET0) which is indispensable to crop growth, irrigation scheduling, and economic assessment. This study estimated the potential of a novel hybrid machine learning model Coupling Bat algorithm (Bat) and Gradient boosting with categorical features support (CatBoost) for estimating daily pan evaporation in arid and semi-arid regions of northwest China. Two other commonly used algorithms including random forest (RF) and original CatBoost (CB) were also applied for comparison. The daily meteorological data for 12 years (2006–2017) from 45 weather stations in arid and semi-arid areas of China, including minimum and maximum air temperature (Tmin, Tmax), relative humidity (RH), wind speed (U), and global solar radiation (Rs), were utilized to feed the three models for exploring the ability in predicting pan evaporation. The results revealed that the new developed Bat-CB model (RMSE = 0.859–2.227 mm·d−1; MAE = 0.540–1.328 mm·d−1; NSE = 0.625–0.894; MAPE = 0.162–0.328) was superior to RF and CB. In addition, CB (RMSE = 0.897–2.754 mm·d−1; MAE = 0.531–1.77 mm·d−1; NSE = 0.147–0.869; MAPE = 0.161–0.421) slightly outperformed RF (RMSE = 1.005–3.604 mm·d−1; MAE = 0.644–2.479 mm·d−1; NSE = −1.242–0.894; MAPE = 0.176–0.686) which had poor ability to operate the erratic changes of pan evaporation. Furthermore, the improvement of Bat-CB was presented more comprehensively and obviously in the seasonal and spatial performance compared to CB and RF. Overall, Bat-CB has high accuracy, robust stability, and huge potential for Ep estimation in arid and semi-arid regions of northwest China and the applications of findings in this study have equal significance for adjacent countries.
1. Introduction
Evaporation is the significant content for meteorological science, water resources evaluation, and hydrological cycle [1,2]. Accurate simulation of evaporation contributes to many aspects including hydrology and water resources management, agricultural activities, irrigation scheduling, and water conservation, especially in arid regions [3,4]. However, evaporation is extremely difficult to present effectively due to its complex interactions between land and atmosphere system [5]. Nowadays, the methods for evaporation measurement are generally divided into estimation by models and direct measurement approach. Empirical and semi-empirical models are accessible estimating methods, but these models require sophisticated and readily available meteorological data which are not always accessible in many areas. Furthermore, the accuracy of these models is varied to a different situation, and some of these methods are valid only under specific climatic and agronomic conditions [6]. In situ direct measurements such as the eddy correlation system and pan evaporation method can provide relatively reliable results, although these applications are required for precise and high-quality construction with massive expenditure and greatly restricted by extreme circumstances such as strong winds, heavy rain, and utmost drought, which are prominent problems in arid and semi-arid areas [7,8]. Thus, developing an available and suitable method for estimating pan evaporation is significant to the estimation of evaporation. In addition, utilizing pan evaporation data and pan coefficient (kp) models is a classic way to assessing the reference evapotranspiration (ET0) that is indispensable to crop growth, irrigation scheduling, and economic assessment [9].
The evaporation process is characteristically highly non-linear, complex, and unsteady, which is the reason why it is impossible to develop a mathematical relationship including all relevant factors [7,10,11,12]. Due to these peculiarities, in recent years, with the superiority of unraveling nonlinear relationships, machine learning techniques including artificial neural network (ANN), support vector machines (SVM), multivariate adaptive regression splines (MARS), M5 model tree (M5T), random forest (RF), extreme learning machine (ELM), gradient boosting decision tree (GBDT), gradient boosting with categorical features support (CatBoost), a kernel-based nonlinear extension of Arps decline (KNEA), Wavelet-Extreme Learning Machine (WA-ELM), have been broadly employed in hydrological and environmental models to forecast parameters such as streamflow, groundwater level, soil moisture, solar radiation and reference evapotranspiration [13,14,15,16,17,18,19,20,21]. In addition, a plethora of literature indicates these machine learning algorithms perform excellently in predicting pan evaporation (Ep) as well. Keskin, M. E., et al., [22] compared the performance of an ANN model and the empirical Penman model at Lake Eğirdir of Turkey and found the ANN model with relatively fewer inputs even achieved considerably better agreement than the Penman model in predicting Ep value. Lu, X., et al. [23] evaluated three tree-based machine learning approaches (including M5, RF, and GBDT) for estimating daily Ep in the Poyang Lake Basin. The result showed that the GBDT model exhibited the best stability and accuracy in the prediction among the three models. Goyal, M. K., et al. [6] investigated the abilities of ANN model with Bayesian Regularization (BR) and Levenberg–Marquardt (LM) algorithm, LSSVR model, Fuzzy Logic model, and ANFIS model in the modeling of daily pan evaporation by accessible inputs (including rainfall, minimum and maximum temperature, minimum and maximum humidity, and sunshine hours). They found that the LS-SVR and Fuzzy Logic models performed successfully in sub-tropical climates. Besides, Kisi, O., et al. [24] attempted using only temperature data as inputs to predict monthly pan Ep through M5, MARS models and empirical models including CHS, MLR and SS models. The conclusion was that the MARS model generally had better accuracy than M5 and empirical models, and more test data contributed to its positive impact.
Nevertheless, most machine learning methods are easily struck in drawbacks and it is difficult to tune the model’s unique parameters manually. Therefore, the novel heuristic algorithm such as Grey Wolf Optimization (GWO), Whale Optimization Algorithm (WOA), Flower pollination algorithm (FPA), Salp Swarm Algorithm (SSA) and CatBoost (Cat) has been applied or coupled with machine learning models successfully in estimating ET0 and Ep recently. For instance, Wang, H., et al. [8] developed a new hybrid model based on the salp swarm algorithm (SSA) and the kernel-based nonlinear Arps decline (KNEA) and compared the ability to predict Ep with M5 and MARS models in the arid and semi-arid regions of northwest China. The new model was superior to both M5 and MARS models in all input combinations. Wu, L., et al. [18] made a comparison among two new ELM model coupled with whale optimization algorithm (WOA) and flower pollination algorithm (FPA) and the differential evolution algorithm-optimized ELM (DEELM), the improved M5 model tree (M5P) and artificial neural networks (ANN) models for monthly Ep prediction in Poyang Lake Basin of southern China. The result showed FPAELM model was estimated best among these models at all stations. Seifi, A., et al. [25] evaluated the capability of three novel ANN models hybridized with Genetic Algorithm (GA), Grey Wolf Optimization (GWO), and Whale Optimization Algorithm (WOA) under five different climate conditions in Iran for estimating Ep value. They draw conclusions that ANN-GA model performed better than the other two models in estimating daily Ep and the hybrid ANN model represented input and output relationships effectively.
Bat algorithm (BA) is a meta-heuristic algorithm based on swarm intelligence for global optimization [26]. Due to the advantage of high accuracy, effectiveness, and maneuverability in optimizing parameters, the Bat algorithm has been applied in such as environmental resource scheduling, flood routing, rainfall forecasting, and evapotranspiration estimating [27,28,29,30,31]. Dong, J., et al. [32] conclude that the ELM model coupled with the Bat algorithm showed the highest accuracy and stability in the estimation of daily dew point temperature among ten models (including KNEA, GA-ELM, POS-ELM, ANN, ANFIS, RF, SVM, ELM, MARS). Therefore, the potential of the Bat algorithm in self-improving and the ability to optimize non-linear parameters is tremendous. To the best of our knowledge, the application of meta-heuristic algorithms such as the Bat algorithm in the hydrological field has been minimal, even none in Ep prediction.
Besides, compared with bat algorithm, tree-based ensemble models such as gradient boosting with categorical features support (CatBoost) have unique advantages and equivalent potential in predicting ability. CatBoost is a novel gradient boosting technology proposed by Yandex Company. It has been applied in many fields as a result of good performance such as weather forecast, media popularity prediction, and reference evapotranspiration [33,34]. Huang, G., et al. [35] compared the CatBoost model with SVM and RF models in estimating reference evapotranspiration in humid regions of China and found the CatBoost model represents significant superiority not only in accuracy and stability but also in computing time and memory usage. Zhang, Y., et al. [20] further evaluated the feasibility of the CatBoost model in estimating ET0 under arid and semi-arid conditions of Northern China and took the generalized regression neural network (GRNN) and random forests (RF) models as a contrast. Their findings revealed the CatBoost showed the same advantage comparing with GRNN and RF and was observed to be the best alternative for estimating ET0.
Nevertheless, the different random permutations produced in CatBoost may have a great impact on the results. Besides, there are more parameters for CatBoost to set compared to other machine learning models, which increases the possibility of falling into local optima. To overcome this weakness, coupling an efficient searching algorithm with CatBoost is a workable method. Bat algorithm stands out for its excellent global searching ability. In addition, there seems to be no literature available utilizing bat algorithms to optimize the CatBoost, which is a potential application in hydrology, agriculture, and environmental fields, especially in pan evaporation estimation.
Thus, the objectives of this study were set to (1) investigate capability and usability of the hybrid model coupled CatBoost with Bat algorithm (Bat-CB) in arid and semi-arid regions of northwest China for estimating Ep; (2) evaluate the generalization performance of Bat-CB under seasonal and geographic conditions though weather data from 45 stations, in comparison with CatBoost and RF models.
2. Material and Methods
2.1. Random Forest (RF)
The random forest has not only striking predicting accuracy and widespread application in classification and regression fields but also has a powerful ability to handle features in a dataset [36]. Besides, random forest is a compatible algorithm. Iwendi, C., et al. [37] found ensemble random forest had outperformed all the included methods for improving intrusion detection systems. Therefore, to examine the forecasting capacity of two aforesaid advanced algorithms, random forest stands out as the standard method. Based on the classification and regression tree (CART), random forest utilizes the ensemble strategies such as bootstrap and bagging to handle high-dimensional regression issues [31,38,39].
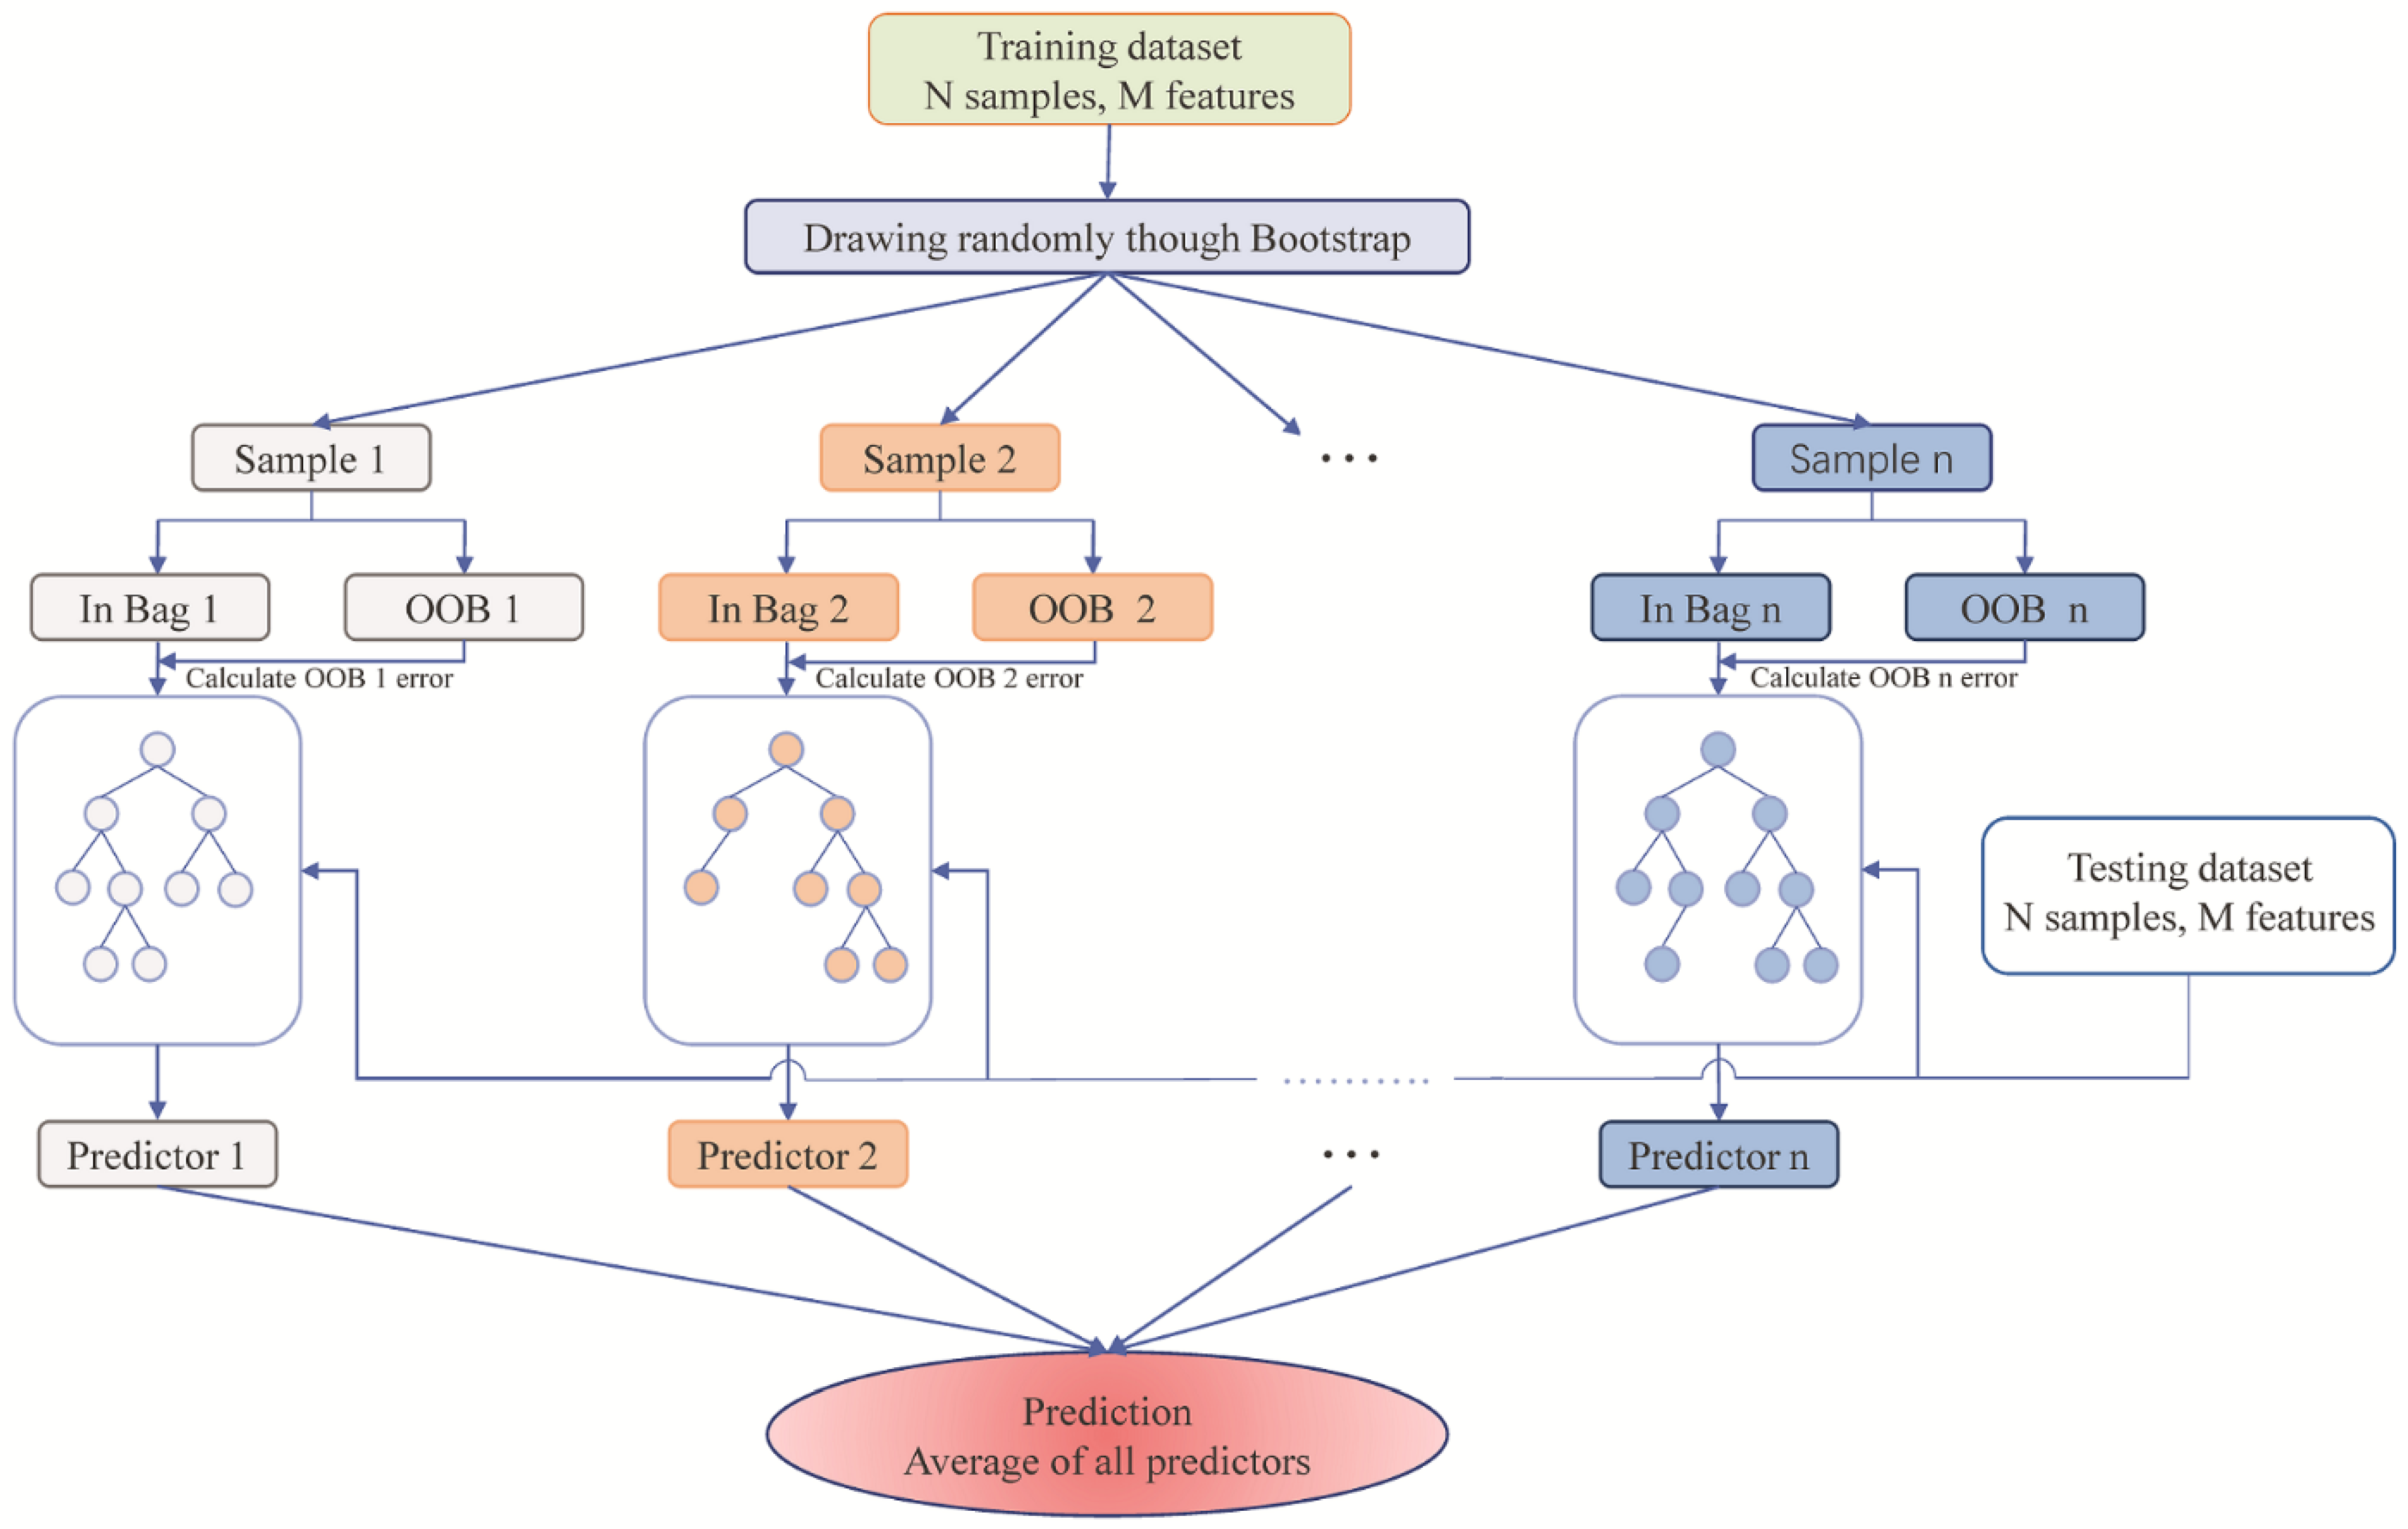
For making a group of trees, random forest draws randomly from the original dataset as the training subsets by a bootstrap method and releases them back after sampling until the minimum number of nodes is reached. The data not sampled in the original dataset are called “out of the box” (OOB) and can be used to calculate out-of-bag error that is an unbiased estimation [38]. Additionally, RF grows trees unpruned and each node is split using the best predictor of randomly chosen subsets of predictors rather than the best one among all predictors, which are robust against the overfitting. Eventually, the ultimate outcome of the forecast is determined through a bagging procedure that assesses the predictors comprehensively in the integrated trees. More details about Random Forest can be found in Breiman, L. [38]. The structure of the RF is shown in Figure 1.
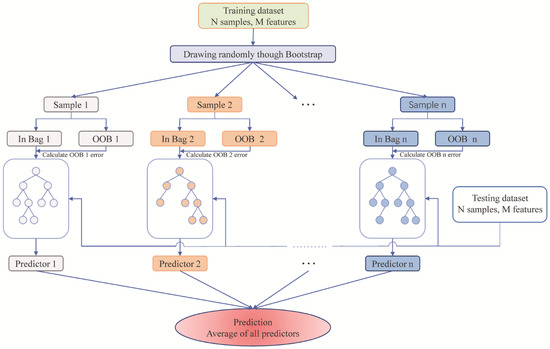
Figure 1.
The structure of the random forest algorithm.
From the algorithm described above, only two parameters needs tuned, the number of ensemble trees (ntree) and the number of predictors randomly selected at each node (mtry). The ntree should be settled appropriately so that every input gets predicted at enough times without increasing calculating time excessively. As for mtry, the default values are different for classification. The two optimal parameters vary among different stations but will be trained and input until the optimum appears.
2.2. Gradient Boosting with Categorical Features Support (CB)
CatBoost, a novel machine-learning algorithm based on gradient boosting decision tree (GBDT) algorithm, was verified that it surpassed other advanced GBDT algorithms such as XGBoost and LightGBM in many aspects particularly while dealing with considerable data and features. The enhancements are majorly reflected in three fields:
First and foremost, traditional GBDT algorithms generally cope with categorical features by a method named Greedy Target Statistics (Greedy TS) which is quite efficient but subject to an inherent problem of conditional shift. To avoid this problem, CatBoost applies an approach that relied on the ordered principle so that it can get over the target leakage. Therefore, this approach makes the whole dataset available for the training model to learn and handles categorical features during training time. Specifically, CatBoost performs a random permutation of the dataset and select one categorical feature, then calculates an average label value for the example with the same category value placed before the selected category in the permutation. According to Prokhorenkova, L., et al. [40], if we sample as a permutation (θ = [σ1, σ2, …, σn]nT) from the given dataset, the permutation is substituted with (Equation (1)):
In (Equation (1)), P is a prior value and β is the weight of the prior value. The prior is usually the average label value in the dataset, and it helps reduce the noise from the low-frequency category.
Secondly, another pivotal enhancement of CatBoost is the conversion from the traditional gradient boosting algorithm to the ordered boosting which figures out the inevitable problem of the gradient bias in the iteration process and increases the generalization ability. When GBDT substitutes categorical features with numerical values by target statistic, the conditional distribution for a training example will be not identical with that for the test example. Training a model without the specific sample, in order to make the residual of models unshifted, can solve the issue of unbiased gradient boosting. However, it is difficult to carry out in practice. CatBoost generates random multiple permutations through a method inspired by the ordering principle to obtain sufficient permutations, which can reduce the effect of overfitting efficiently and enhance the robustness of models [40].
Thirdly, in the aspect of handling categorical features, CatBoost constructs combinations of categorical features though a greedy way and uses these combinations as the additional features. Namely, CatBoost combines the categorical features already presented in built trees with all categorical features in the dataset. This method helps models to more easily capture the high-order dependencies and further improve the accuracy of estimation.
Another advanced and noticeable specialty is that CatBoost selects oblivious decision trees as the base predictors. Such trees work out an impartial decision with the same splitting across the entire level of the tree and speed up the execution, which means they are less prone to over-fitting and shorten the testing time.
2.3. Bat Algorithm Coupling with CatBoost (Bat-CB)
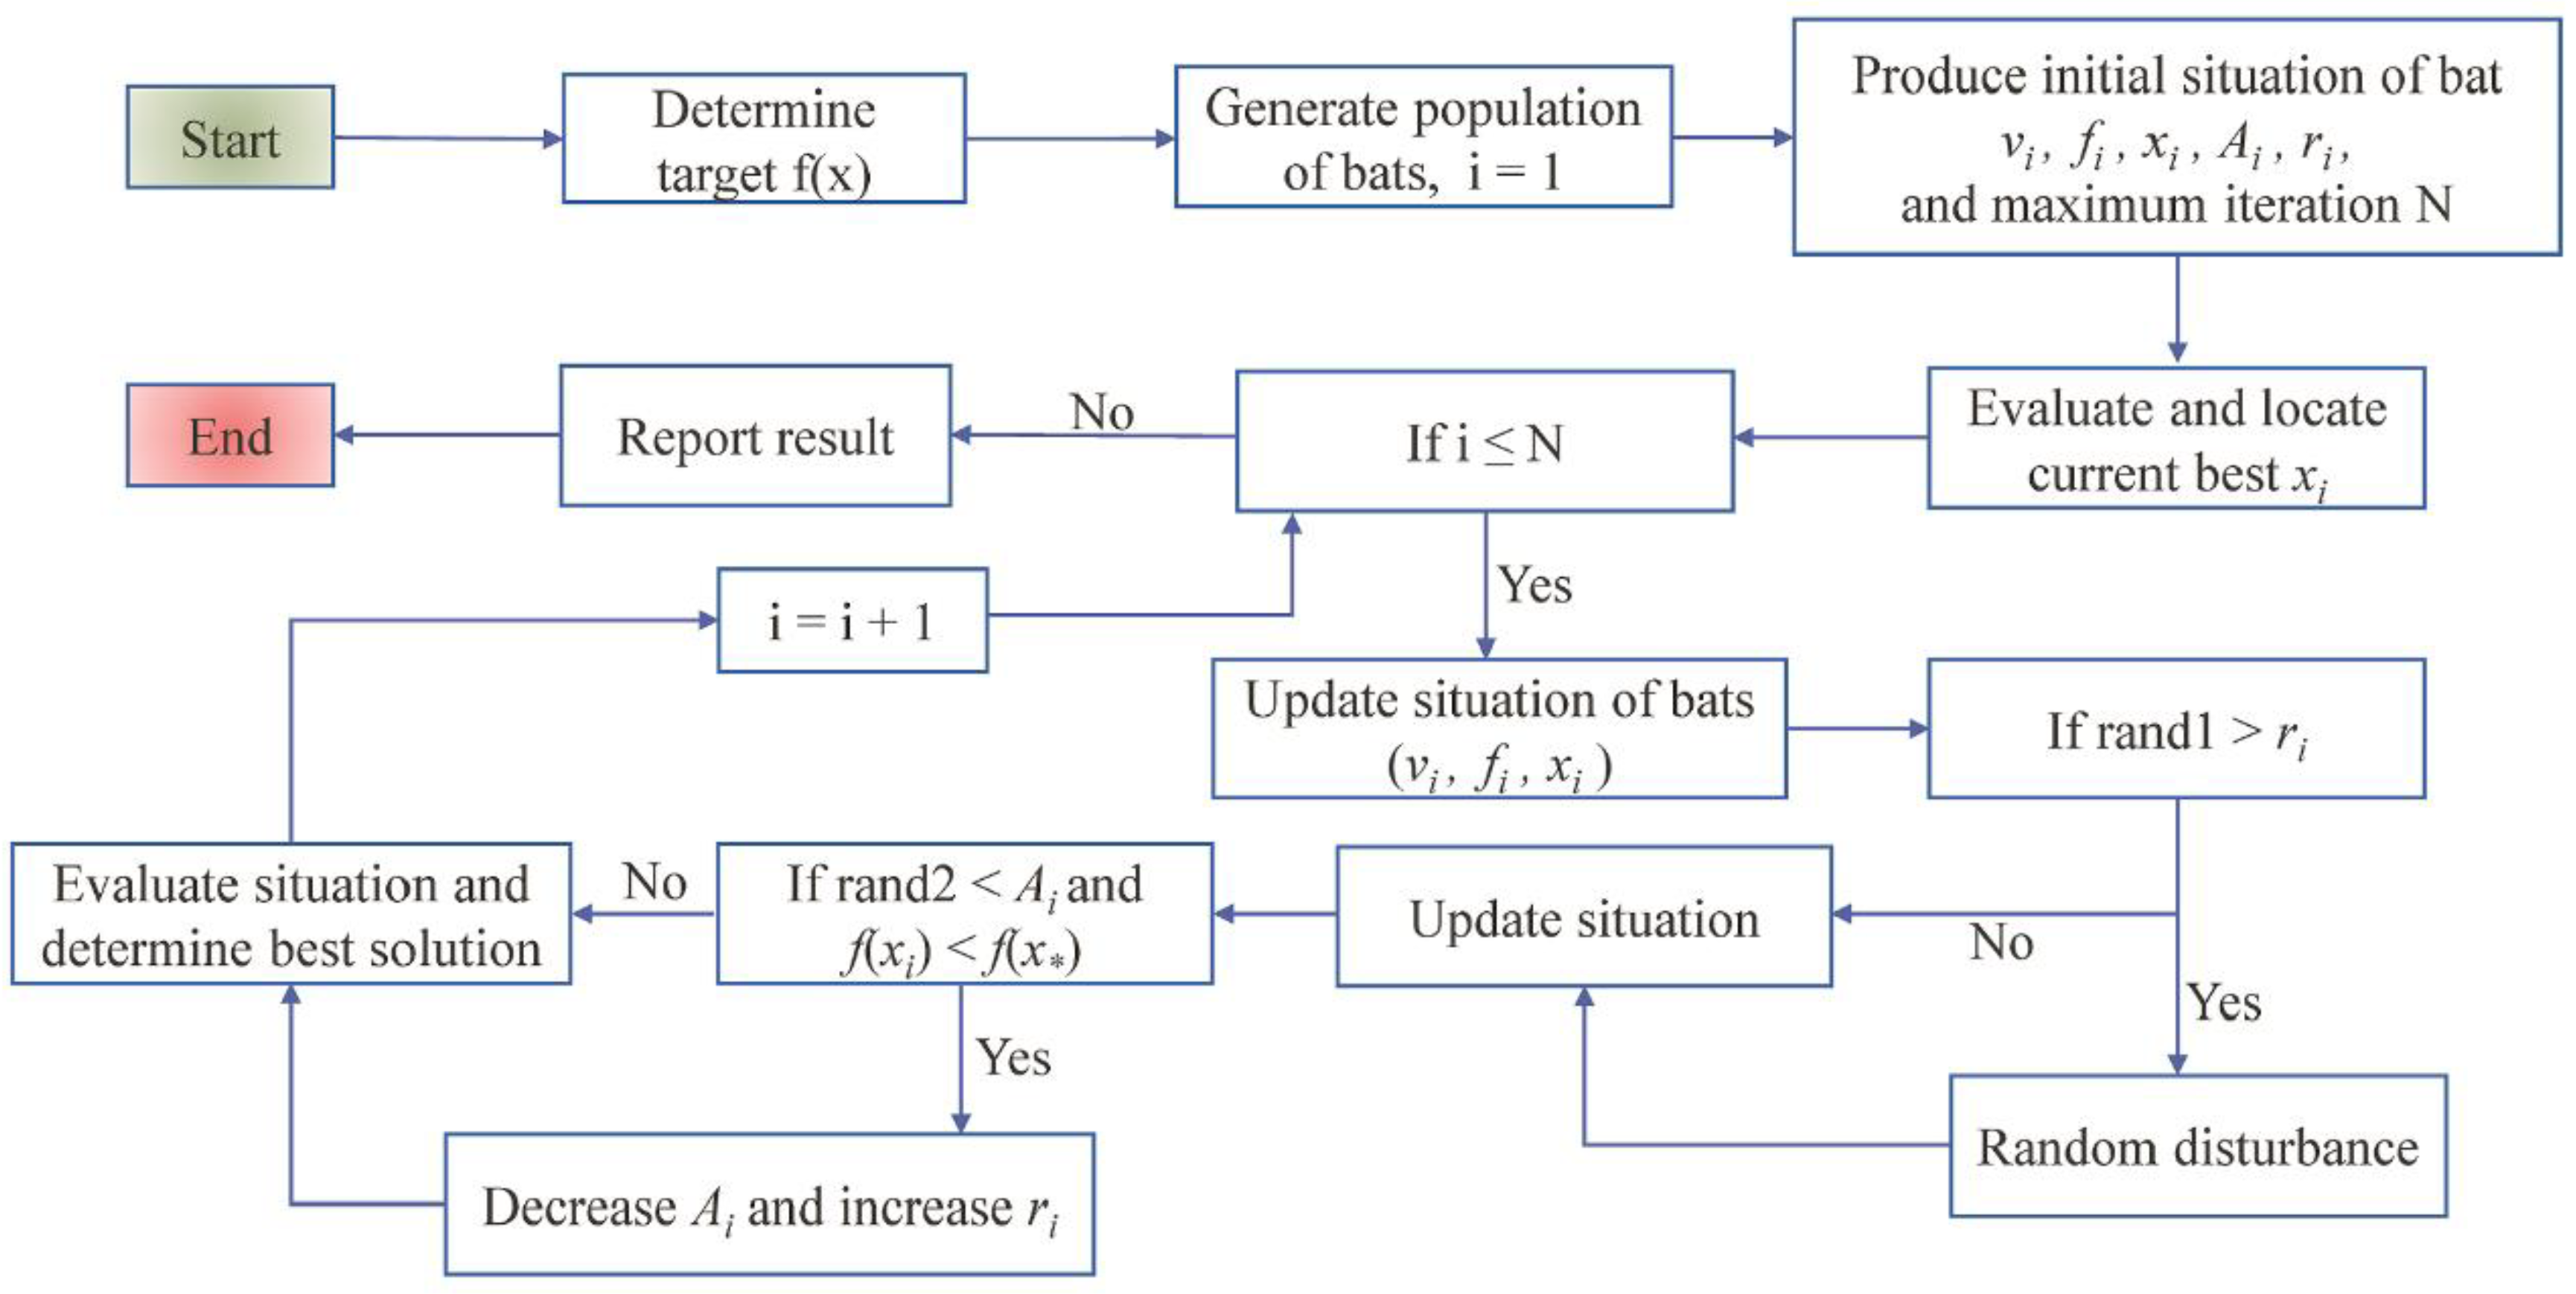
The bio-inspired bat algorithm is a metaheuristic algorithm originally introduced by Yang, X. S. [26], which mirrors the foraging behavior of micro bats. In the searching process, each bat emits high-frequency pulses to search for targets and analyzes the unique echolocation characteristics (i.e., velocity, loudness, and frequency) which contributes to locating the target and strengthen searching ability. Mathematically, the bat algorithm can be implemented as follows:
- Generating a population of bats for simulations, and assigning each bat the initial velocity vi, frequency fi, and position xi.
- From the first iteration to the maximum iteration, the three characters at time t are updated by (Equations (2)–(4)).
In (Equations (2)–(4)), β∈[0, 1) is a random vector from a normal distribution, fi controls the step length of bat movement, xti and vti are the updated positions and velocities of bats at time t, respectively, and x∗ is the current best position(solution), namely, a bat is located after comparing all the fitness values of solutions among the bats within the population.
- 1
- Generating a random number (rand) as the criteria for whether the current solution needs improvement. If the random is higher than At, bats will update their best positions through the random walk:where rand∈[−1, 1] and At is the average loudness of all bats at time t.
- 2
- Generating another random number. If rand <Ai and f(xi) < f(x*), then yield the solution at the last step and updating the emission rates of each bat ri and loudness of each bat At by:where α and γ are both constants. Thereby, 0 < α < 1 and γ > 0.
The iterations (from step 2 to step 4) will continue processing until the maximum number of iterations is reached. Finally, ranking the fitness values of all bats and obtain the best position. The structure of the bat algorithm is shown in Figure 2.
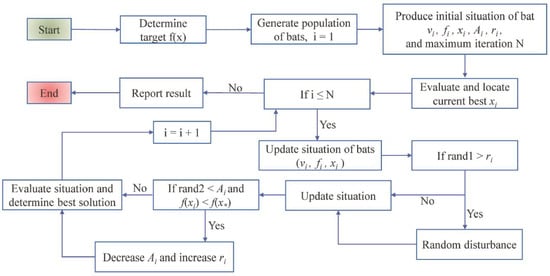
Figure 2.
The flowchart of the Bat algorithm.
In this study, the bat algorithm was integrated with CatBoost models for estimating pan evaporation. As stated previously, the parameters have a large impact on the final performance of CatBoost. Choosing appropriate parameters for the CatBoost model will intensify the gradient boosting function and improves the forecasting ability remarkably in theory. In Bat-CB, three vital parameters of the CatBoost model, including the number of trees to grow (n rounds), the learning rate (eta), and the maximum depth of trees (depth), were optimized by bat algorithm.
2.4. Study Area
The study area, which covers nearly 1/6th area of China, comprises the most area of Xinjiang and the northwest regions of Gansu, Ningxia, and Inner Mongolia. The geographical position of the study area is located adjacently in Central Asia where is far from the seas and less influenced by a summer monsoon and humid ocean air. Therefore, it belongs to the typical temperate continental climate which is characterized by torridity, dry, abundant sunshine, and scarce precipitation. The annual precipitation ranges mostly from 100 mm to 300 mm while the annual evaporation is higher than 1500 mm, even up to 3000 mm. The multi-years mean relative humidity is about 50.33% and is far below that in eastern and western regions of China (almost range from 60% to 80%). Another noteworthy character, the evaporation varies greatly along with seasons while the evaporation in summer is 10–30 times as much as that in spring and winter.
Due to the above reasons, the water resources shortage is extraordinarily severe in such arid and semi-arid regions of Northwest China, which is the biggest obstacle in the socio-economic development of the study area. Solving the water shortage in the study area is a hotspot with huge potential value and significance. Additionally, the typical temperate continental climate, occupying a 3/5th area of Asia, is the most widely distributed climate in Asia. The results of the study may have a universal significance in such an area with a similar climate.
2.5. Dataset
In this study, a continuous and long-term series of daily meteorological data from 45 weather stations in Northwest China during 2006–2017 was selected for model training and testing. The five meteorological parameters, including minimum air temperature (Tmin, °C), maximum air temperature (Tmax, °C), relative humidity (RH, %), wind speed (U, ms−1), and sunshine duration (N, h) were considered in the models. The global solar radiation (Rs, MJ m−2d−1) data are insufficient because of the limitation of stations that can measure the parameter directly in the study area. Thus, the Rs was calculated by using a completely clear day (R0) and sunshine duration (N, h) through the empirical Angström–Prescott model (A-P model) according to Fan, J., et al. [41]. The other four parameters along with sunshine duration and completely clear day were obtained from the National Meteorological Information Center (NMIC) with quality control examined by China Meteorological Administration (CMA) (http://data.cma.cn/). The observed data as the real values of pan evaporation were obtained easily by the measuring pan among 45 stations. The data were divided into two groups, of which one group (2006–2013) was used to develop and train the three artificial intelligence models and the other group (2014–2017) was used for the model testing. The statistical properties of the daily data at the selected 45 stations are shown in Table 1.

Table 1.
Geographical and meteorological information of the 45 stations selected for this study.
2.6. Statistical Analysis
Four statistical evaluation measures were used to comprehensively evaluate the performance of different methods for pan evaporation estimations. The equations are as follows:
- (i)
- Root mean square error (RMSE)
- (ii)
- Mean absolute error (MAE)
- (iii)
- Nash–Sutcliffe Efficiency (NSE)
- (iv)
- Mean absolute percentage error (MAPE)
In (Equations (8)–(11)), YEST,i, and YOBS,i are estimated and observed pan evaporations respectively. The YOBS,i,MEAN is the average value of observed pan evaporation.
3. Results and Discussion
3.1. Statistical Performance of the Three Machine Learning Models
In this study, we developed pan evaporation model in each station based on three different machine learning approaches (RF, CB and Bat-CB) with daily meteorological variables of Tmax, Tmin, Rs, RH and U, and tested the performance of the model by four commonly used statistical indicators (MAE [Ideal = 0, (0,+∞)], MAPE [Ideal = 0, (0,+∞)], RMSE [Ideal = 0, (0,+∞) ], NSE [Ideal = 1, (−∞,1)]). Table 2 shows the overall performance of the three machine learning methods at the 45 stations during the training and testing stages. In the training data, three models showed high consistencies among different statistical indicators and value categories.

Table 2.
Statistical indicators of three machine learning models for predicting the pan evaporation in northwest China.
The RF models (RMSE = 0.127–0.528 mm·d−1; MAE = 0.077–0.353 mm·d−1; NSE = 0.981–0.995; MAPE = 0.042–0.081) performed the best in the training period, and their RMSE, MAE, NSE and MAPE were lower than those of CB and BAT-CB models. Additionally, Bat-CB (RMSE = 0.288–1.125 mm·d−1; MAE = 0.166–0.846 mm·d−1; NSE = 0.908–0.952; MAPE = 0.115–0.167) was slightly superior to CB (RMSE = 0.300–1.322 mm·d−1; MAE = 0.180–0.851 mm·d−1; NSE = 0.894–0.950; MAPE = 0.131–0.181) in the training stage probably because it optimized the parameters previously before the data training of CB. Nevertheless, both the BAT-CB model and CB model were better than the RF model during the testing period. Compared with RF model, the RMSE of CB and BAT-CB in 45 stations decreased by 15.0% and 48.4% on average, and MAE decreased by 15.1% and 45.3% on average; the median value of RMSE decreased by 10.4% and 56.3%, and the median value of MAE decreased by 16.8% and 54.2%; the RMSE maximum decreased by 23.6% and 61.9%, while the minimum decreased by 4.3% and 16.9%.Obviously, RF pursues the best fitting results in training but performs worst in the practical testing, which indicates that RF model has the most serious over-fitting problem among the three models. This indication has been in accordance with not only the predictions of ET0 by Zhang, Y., et al. [20] who declared CatBoost had a less over-fitting problem than RF and GRNN models in all input combinations but also the estimation of dew point temperature by Dong, J., et al. [32]. In particular, the estimations of some stations by RF have quite large errors without a limitation for excessive dispersion, while CB and BAT-CB models have better and more positive effects in the stations with large errors.
Nevertheless, using an optimization algorithm will not usually have an improvement on the original models in some studies [6,42,43]. Comparing the hybrid model with the original model and another commonly used model whose parameter combination is not sophisticated was indispensable for the validation of the novel model [8]. In this part, the improvement of Bat-CB model is relatively limited in the stations where the errors of the three methods are relatively small. Correspondingly, the Bat-CB draws positive results in the stations and indictors whose values are relatively high. Specifically, in the comparison with CB, Bat-CB has a more conspicuous improvement of controlling the Max value and the SD value (decreased by 22.1% and 31.3% on average of RMSE, MAE, and MAPE) in the testing stage than the other three statistical indicators which are the mean value, the min value and the median value (decreased by 13.1%, 0.7%, and 12.0% respectively). It is noteworthy that Bat-CB outperformed CB in both calibration and validation stages, which is evident as the bat algorithm help CB overcome the overfitting problem and improve the accuracy of prediction substantially. In general, the above statistical results preliminarily show that BAT-CB model is superior to CB model and RF model.
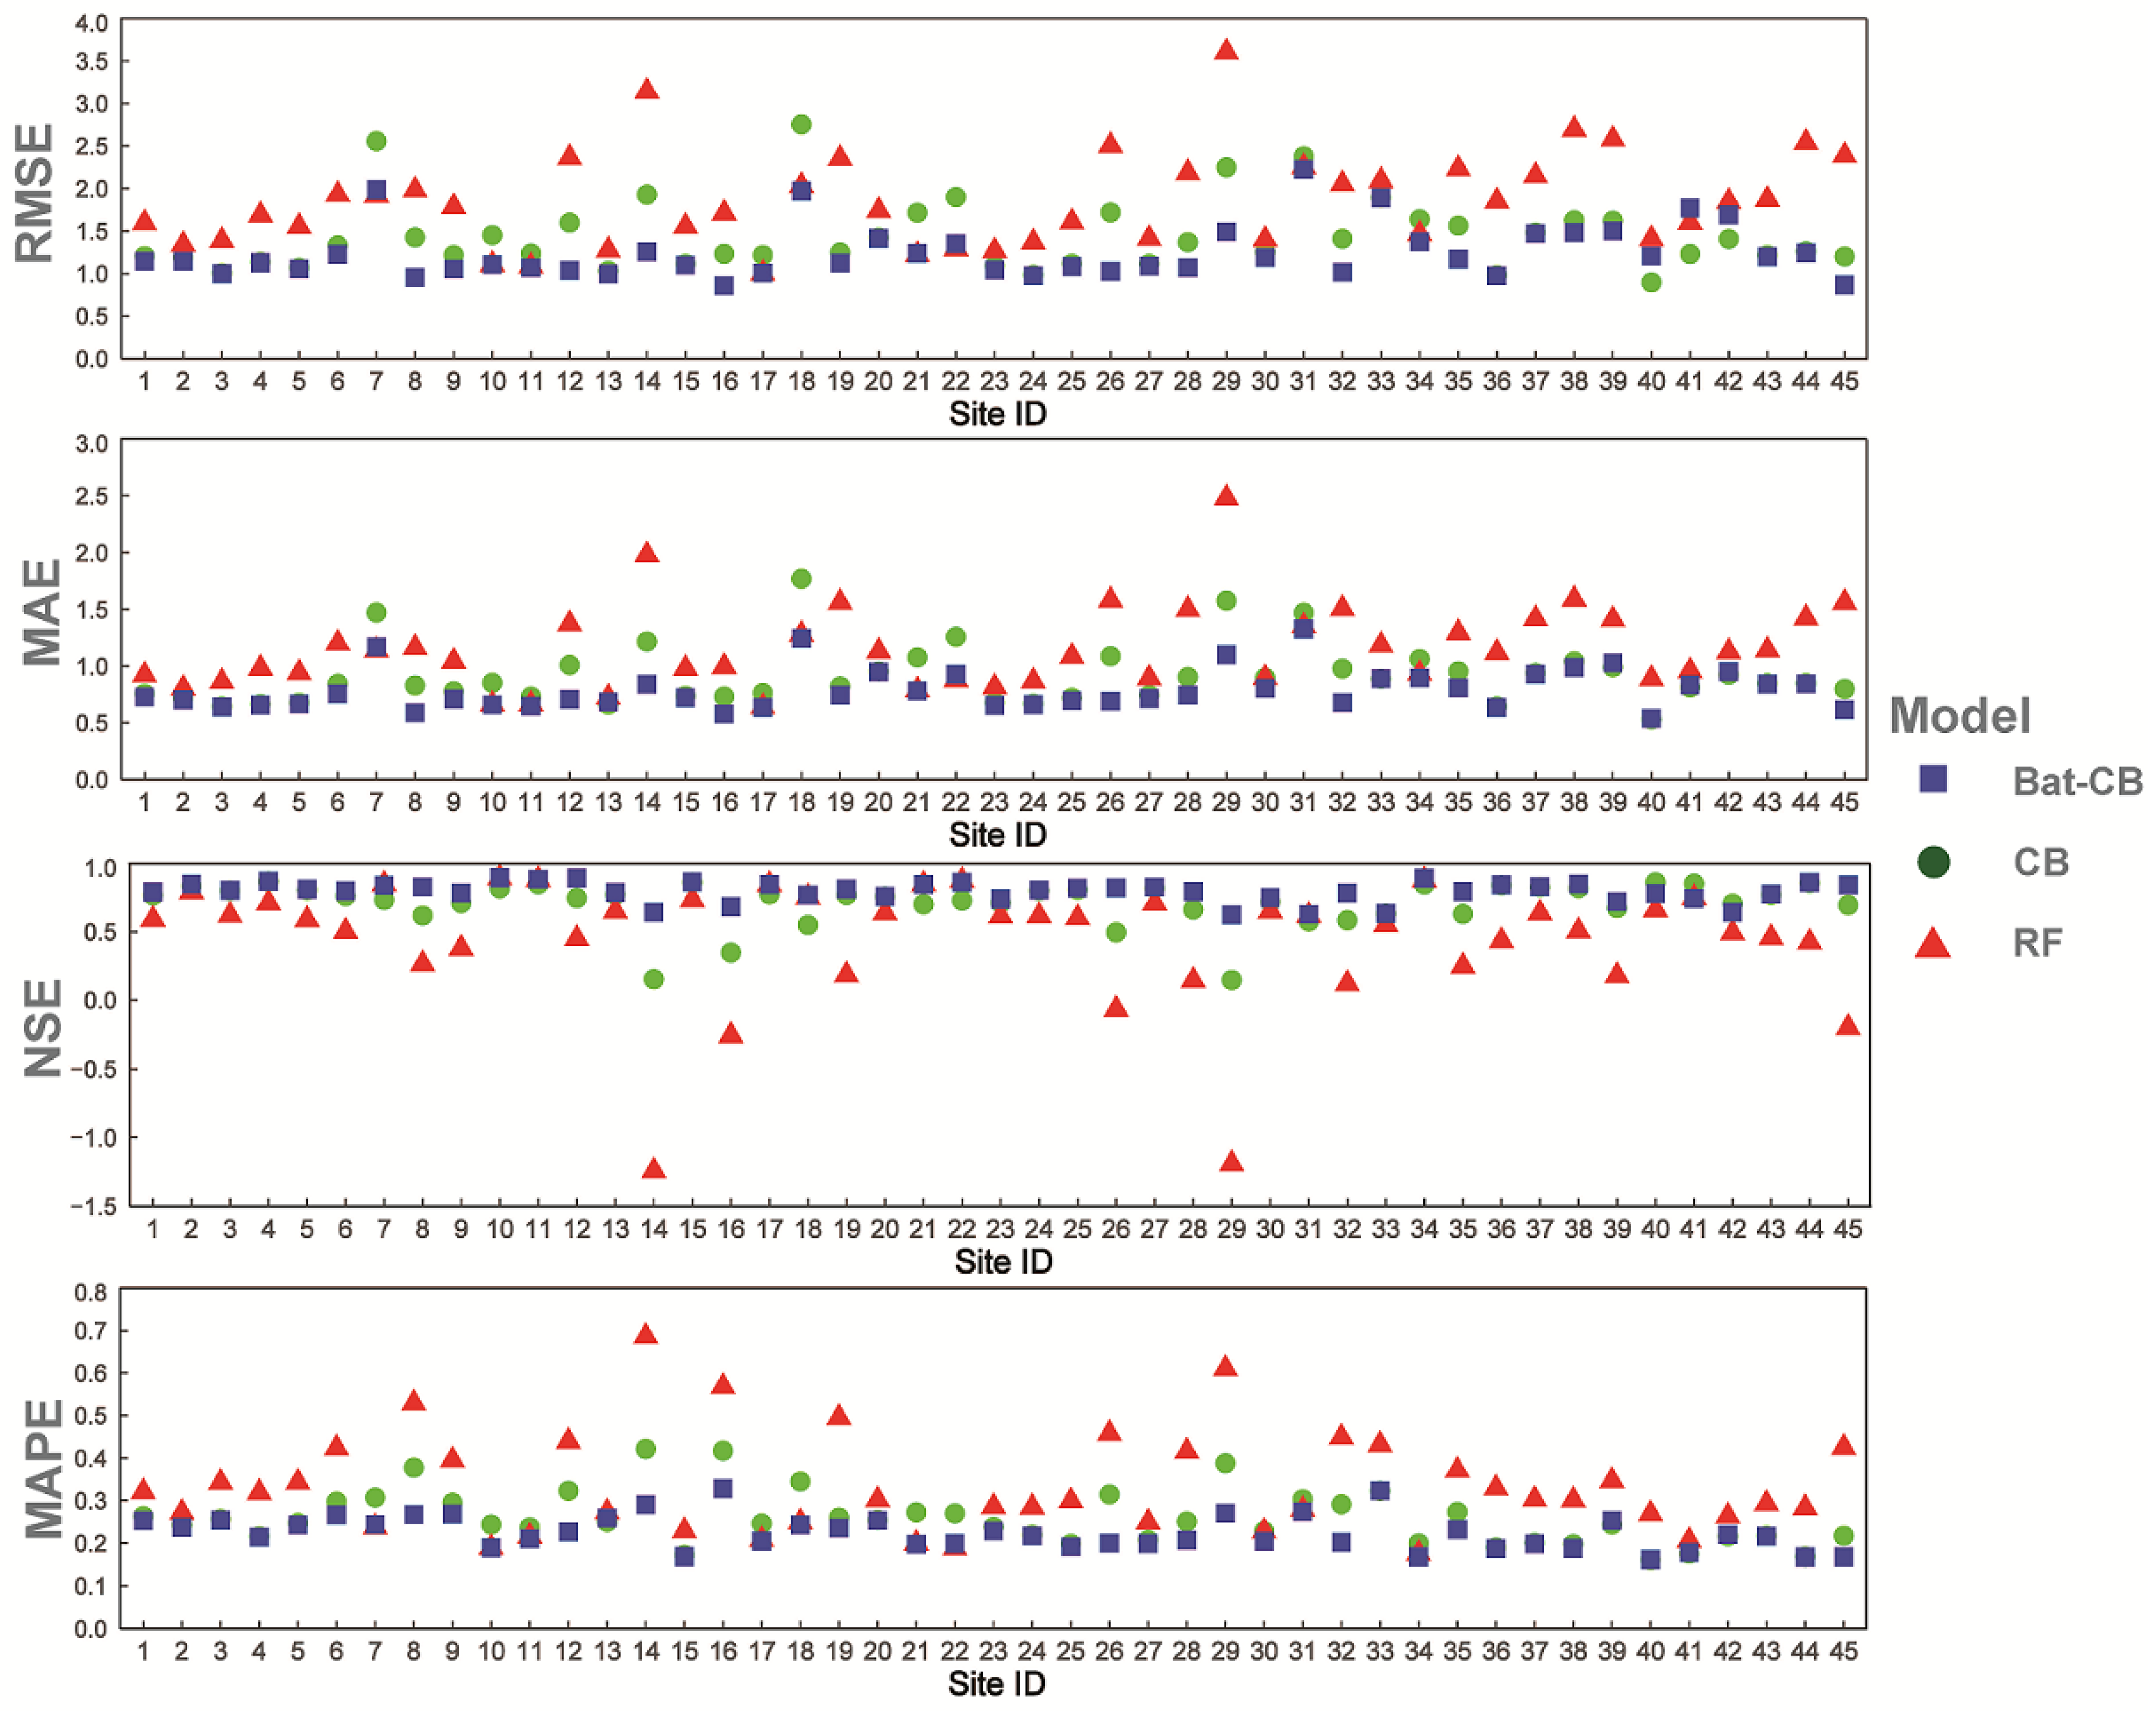
Though Table 2 showed the four statistical indicators of estimating outcomes holistically, visualizing the performance of models in every station was indispensable and convincing. Consequently, Figure 3 presented the authentic estimating results of the three models through four statistical indices in the 45 stations. The consequences of models showed an accordant trend of the four different indicators in the stations, which was a complement of the previous conclusions. Bat-CB performed best in the majority of stations while RF was relatively dissatisfactory among the three models. Moreover, Bat-CB had a certain degree of advantages that varied from the different stations. However, the superiority of the models was not absolute, RF still had considerable predicting ability in station 51709 and the 51232, and CB performed slightly better than Bat-CB in the station 52546, 52652, and 52674 especially in RMSE and NSE indicators. Further research was still required to explain the advantages of the three models in various stations. Nevertheless, it is doubtless that Bat-CB had the best predicting ability and robust stability in most stations among the three models in general.
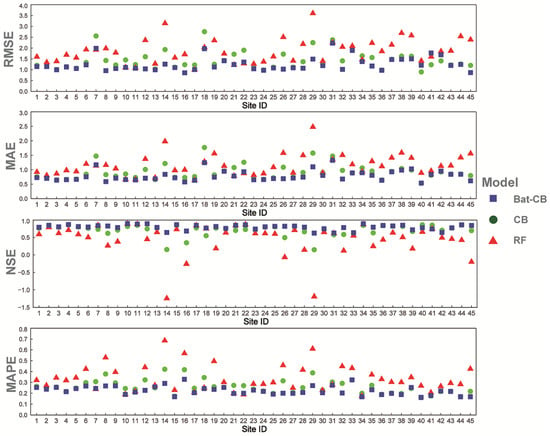
Figure 3.
Scatterplots of 45 stations’ ID and values of four statistical indicators in the 45 stations generated by three models in the testing period.
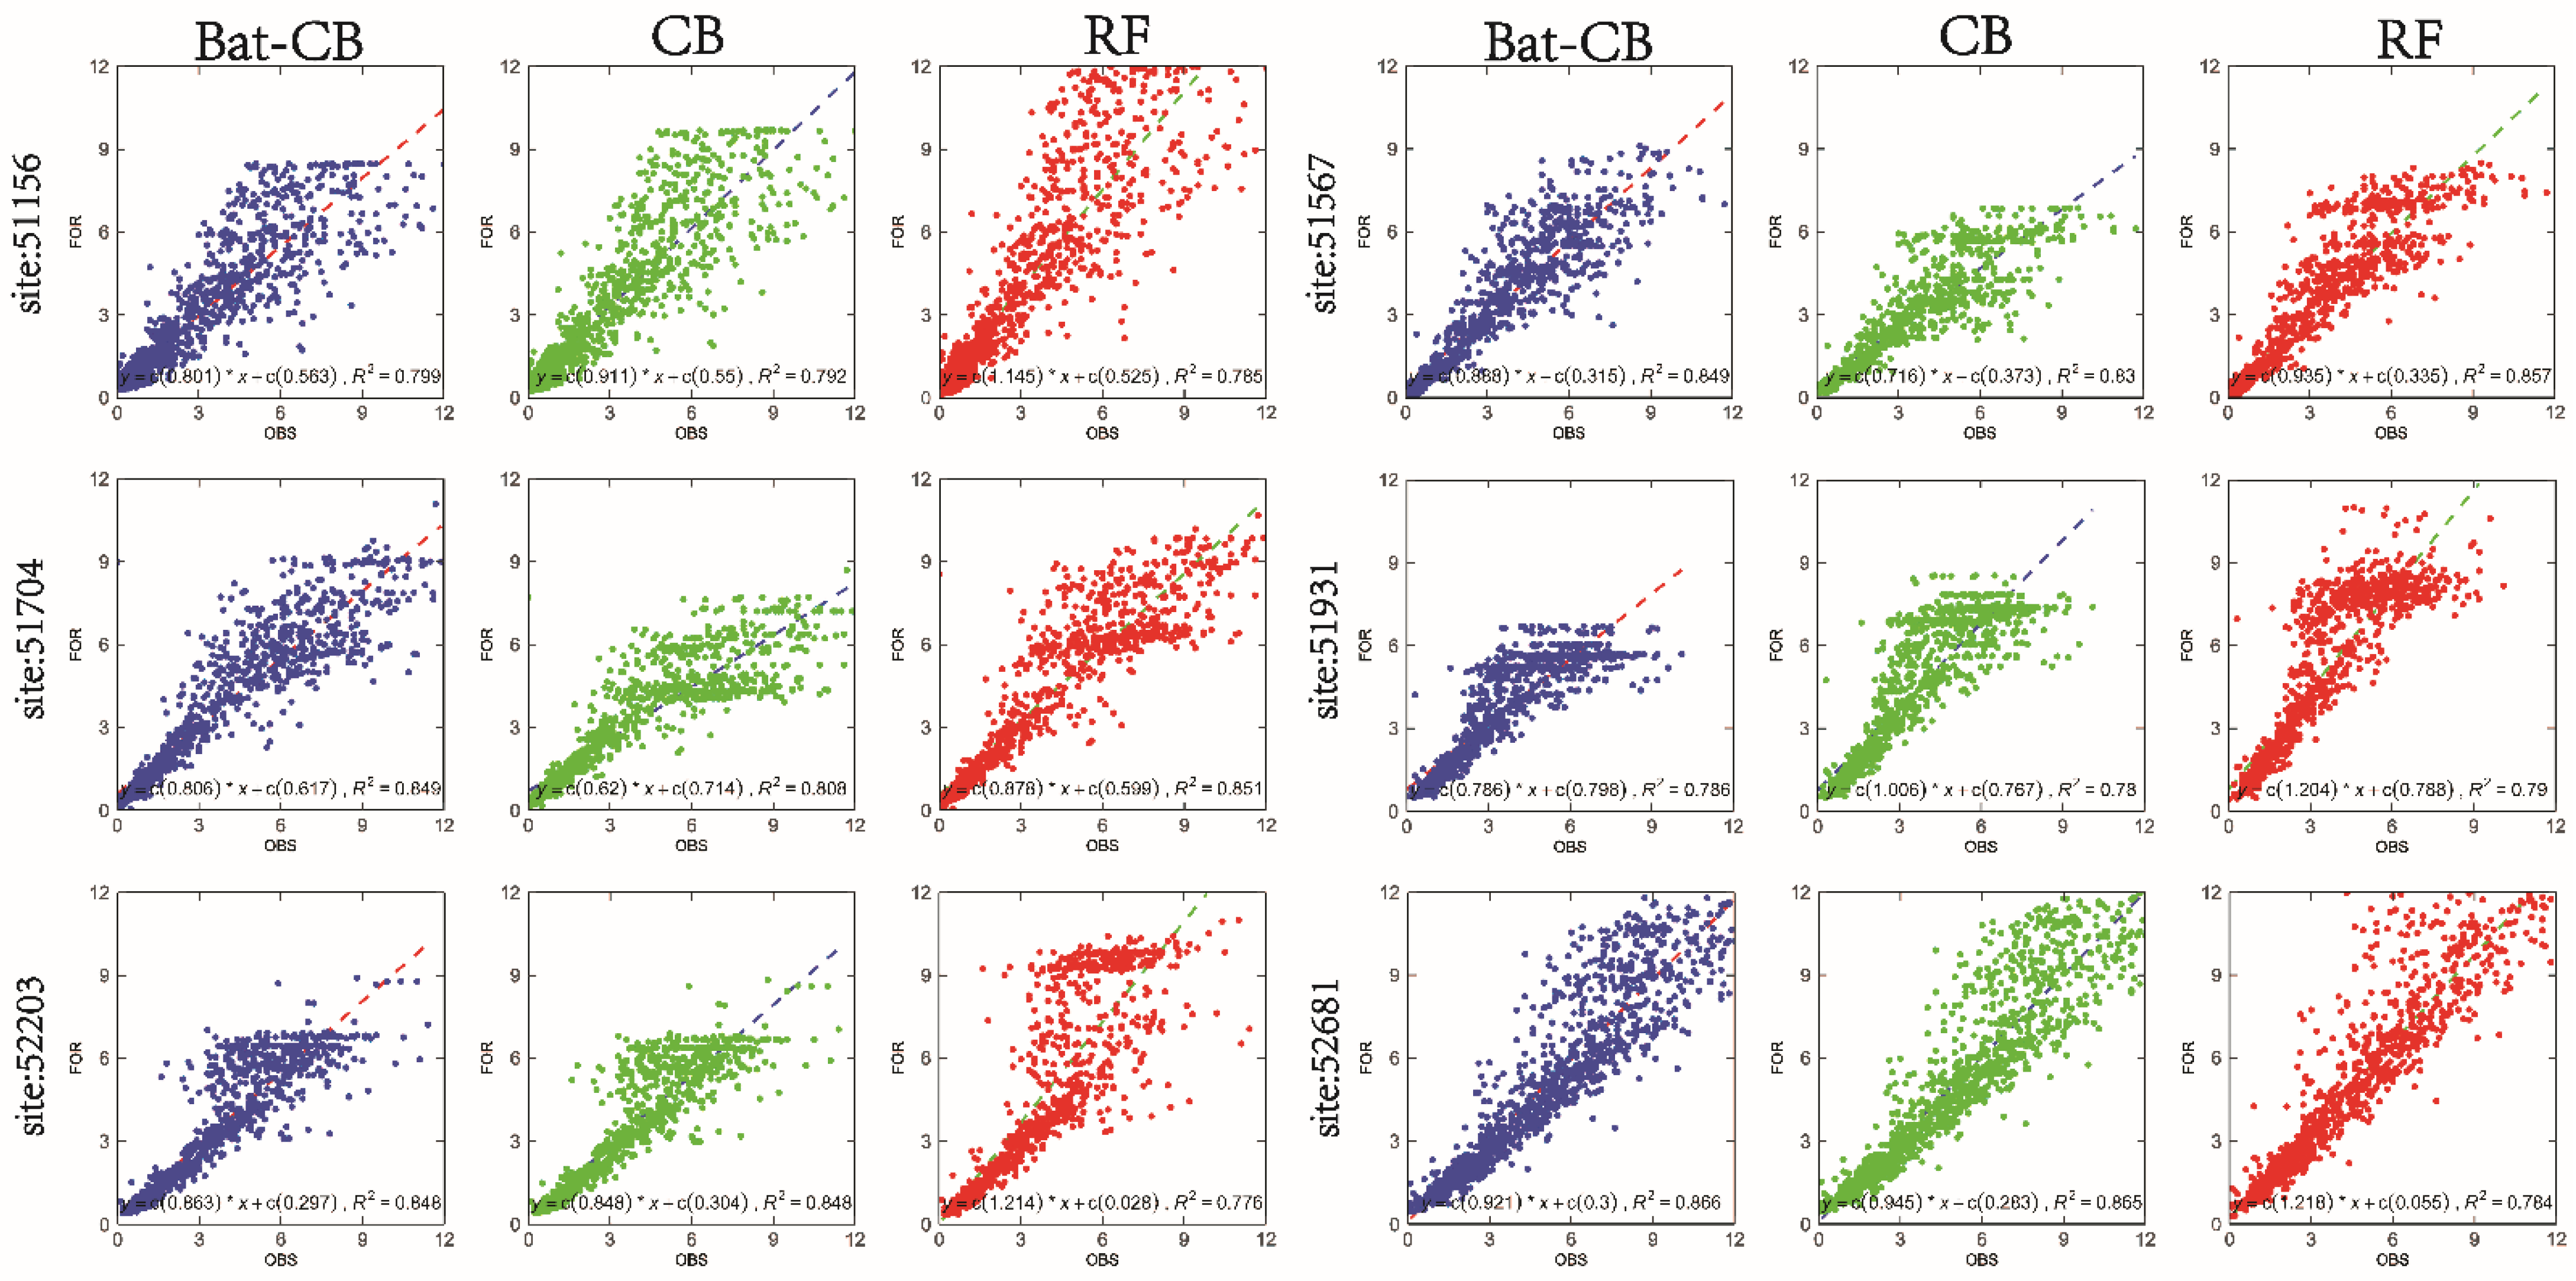
To further observe the performance of the models, we randomly selected six stations dispersed from the local position in the study region and drew scatter plots of measured and simulated pan evaporation values (Figure 4). It is conspicuous that the scatter plots of measured values and simulated values of the three methods during the test period are significantly different. For better exemplification, the linear fit equation and the coefficient of determination (R2) were included, which provides a universal approach to measure the global adequacy of the model.
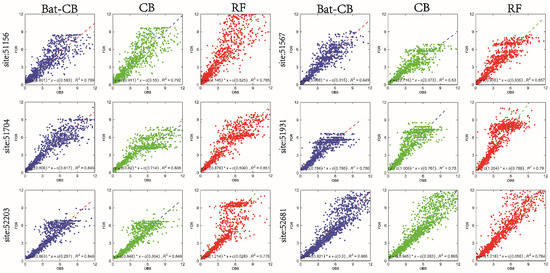
Figure 4.
Scatterplots of observed (OBS) and forecasted (FOR) pan evaporation generated from the three models applied at the 6 randomly selected stations in the testing period. Each panel shows the linear regression fit and the coefficient of determination (R2).
The three different methods evenly have a good performance when the evaporation is small (<4 mm d−1), but when the evaporation is large than 4 mm d−1, the RF scatter points diverted from the 1:1 liner form, and all sites showed obvious problems of overestimation or underestimation. In consideration of the special climate in the study area, the applicability and accuracy of RF is decreased and unconvinced in such arid and the semi-arid area where the evaporation is extremely higher than the normal levels with a long period every year. CB method was slightly better than the RF method in general, which was highly overestimated when the evaporation capacity of 52203 and 52681 stations was very large. Compared with CB, Bat-CB has a higher R2 and convergent tendency of 1:1 line without any exception in all 6 sites as the plots showed (Figure 4). This indicates Bat algorithm has a positive promotion on the CatBoost almost every site. Although the improvement evoked from the bat algorithm seems not so conspicuous in minority stations such as the 52203 site, the bat algorithm help CB avoid the overfitting problem obviously in 51704 and 51567 sites.
It is noteworthy that both CB and Bat-CB have underestimated the values generally (according to the slope <1) which is inverse to the view that the heuristic models over-estimate the high pan evaporation values in some studies [44]. In terms of the distribution of points, it is interesting that the forecasted values are distributed evenly to observed values especially when the values are large. This phenomenon is a signal alerting us to check over the models in practical application, and we can average the results or shorten the span of steps to approach the real values efficiently. However, RF mainly has highly overestimated aggregates of points at high values in 4 stations (51567, 51931, 52203, and 52681 sites) occupied a proportion of 2/3, which even transfer the illusion the results seemed convinced. Definitely, there is no use for RF to fix itself by the above methods. As a whole, Bat-CB avoids the problems that existed in CB and RF with high accuracy and shows the strongest stability in every station, particularly in large value estimation.
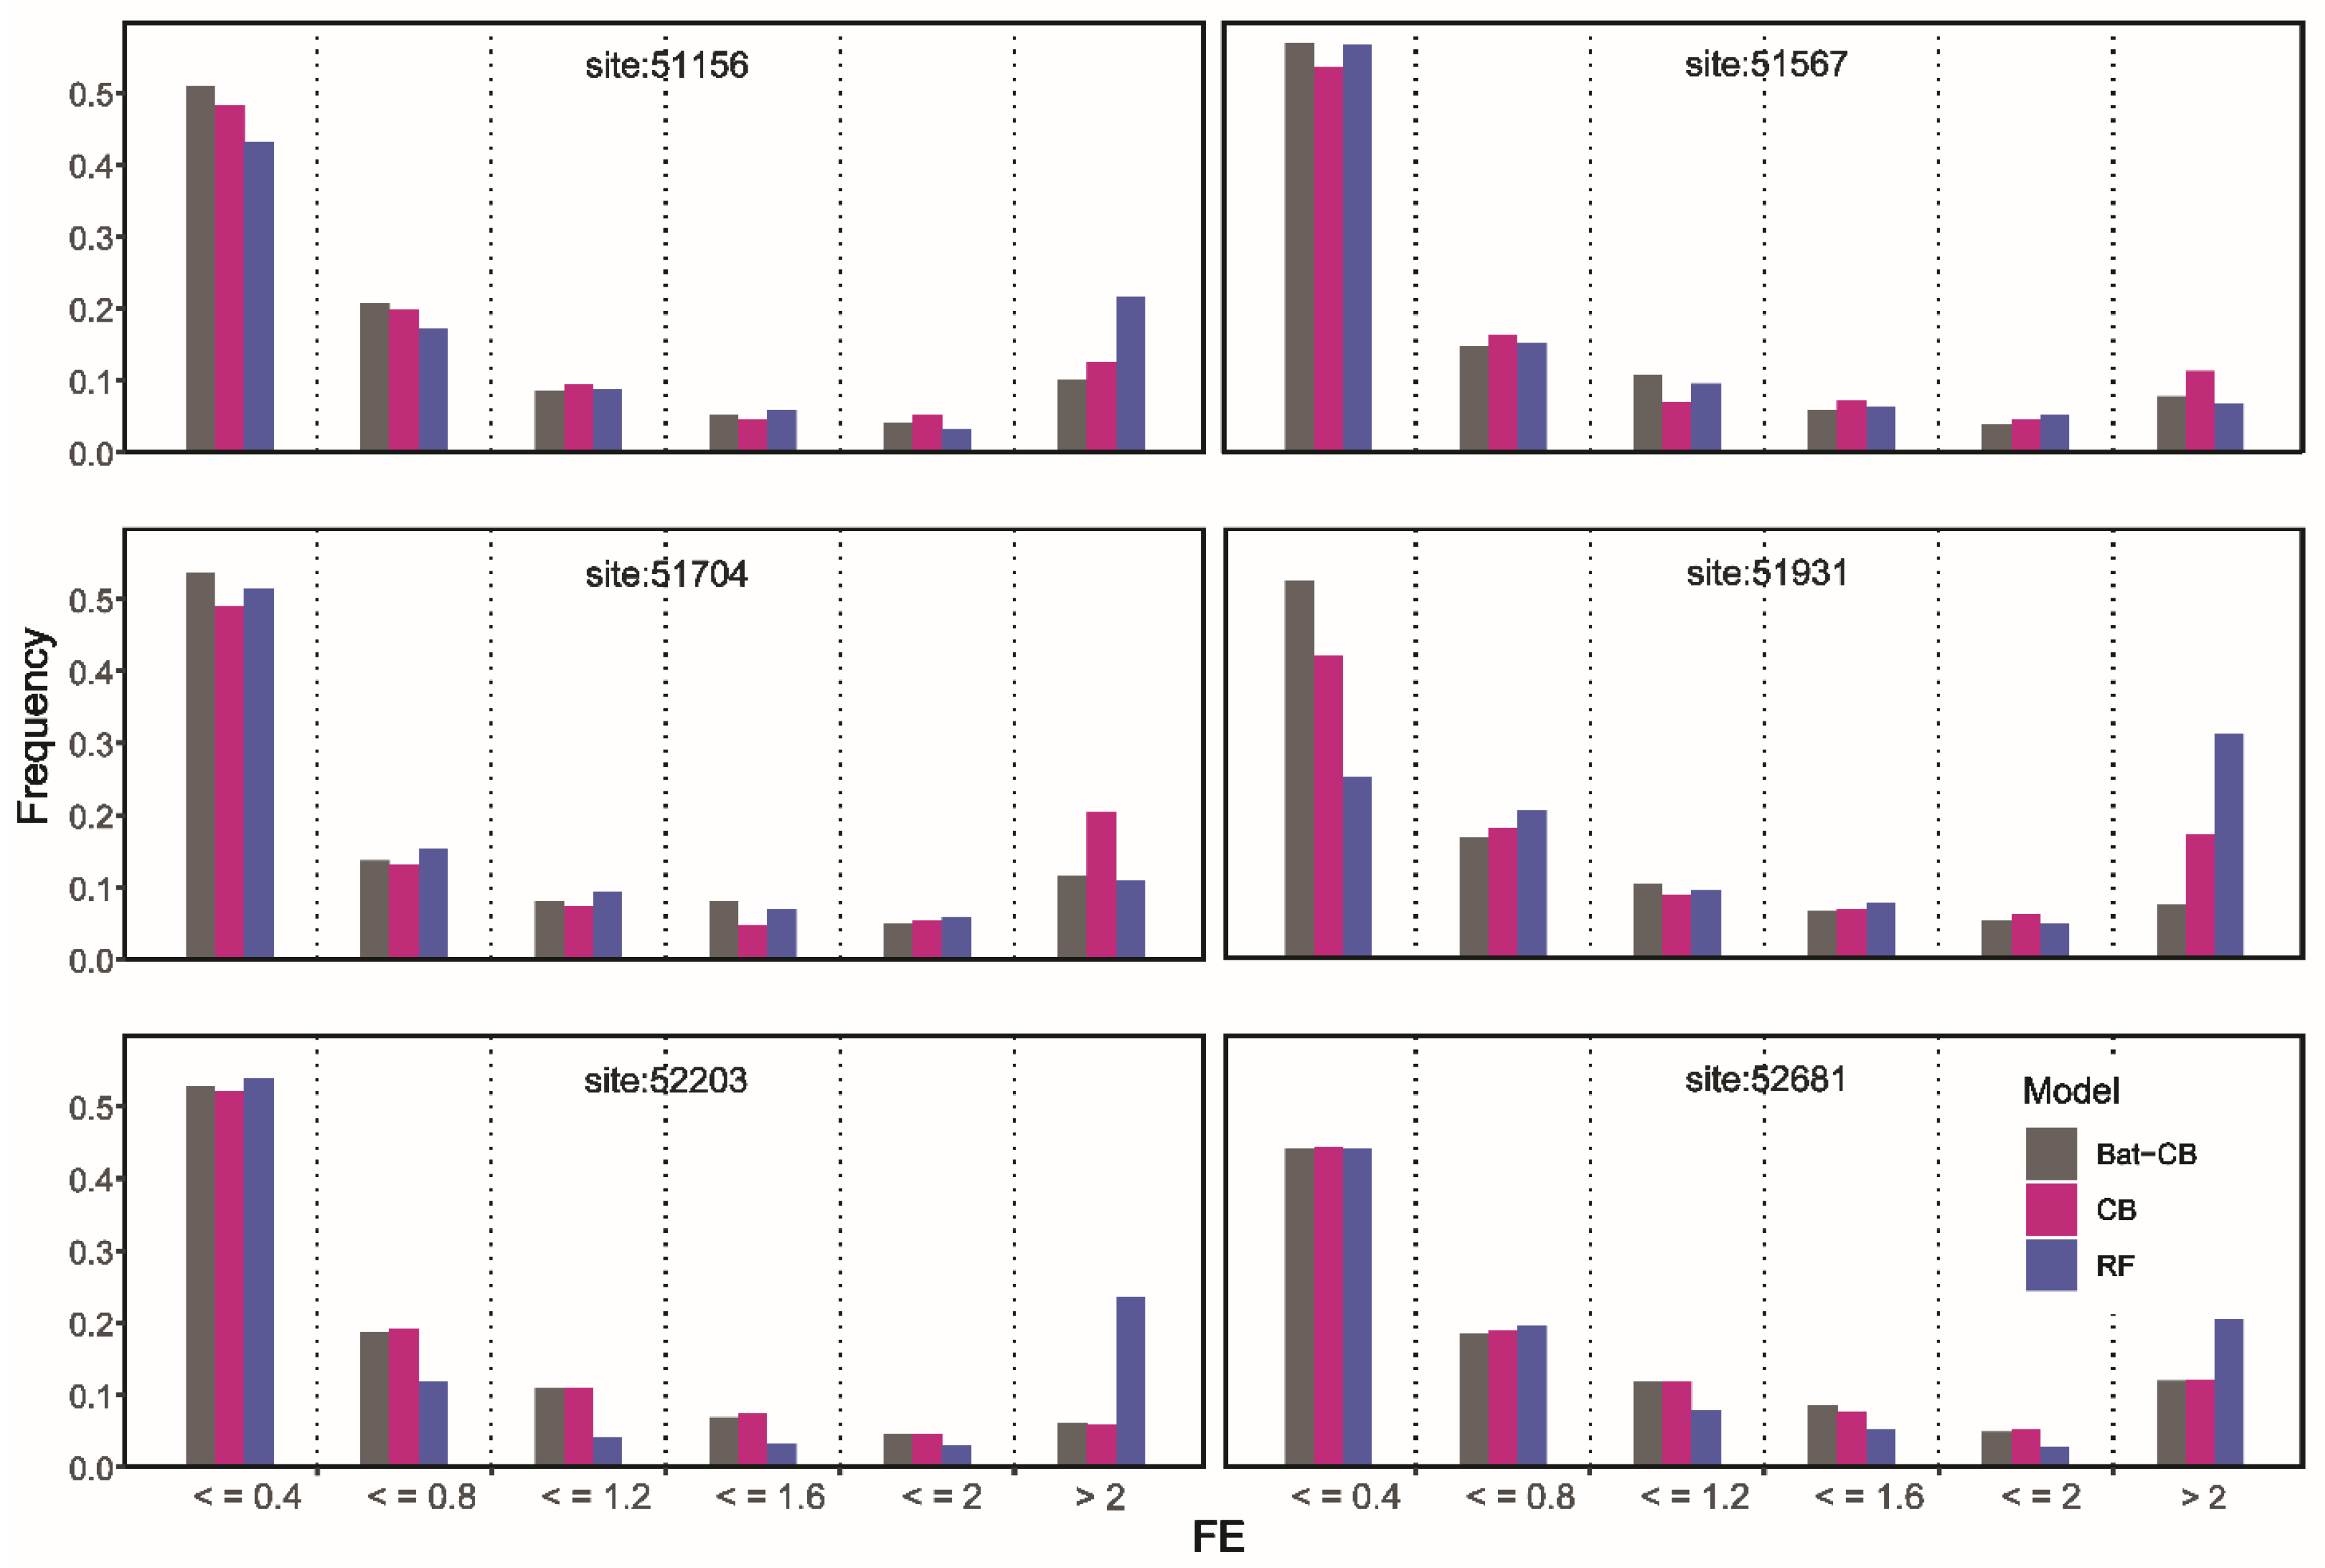
On the other hand, the distribution of AE can be further evaluated the applicability of the model (Figure 5).
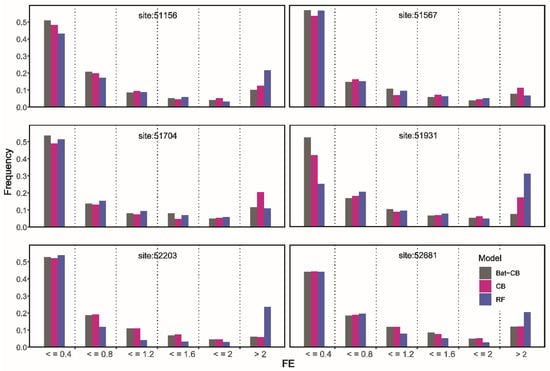
Figure 5.
Histograms illustrating the frequency distribution within each of the absolute forecasting error (FE) generated by the three models.
AE is the absolute error which is computed as AE = |FOR − OBS|; [Ideal value = 0]. Hence, a model that has higher occurrences of AE close to zero is generally better and more convincing. In the above six stations, the three different machine learning methods all have about 50% point of AE below 0.4 mm·d−1. From 0 to 2 mm·d−1 of AE, the proportion of data is gradually decreasing. However, the percentage of points larger than 2 mm·d−1 mainly distributed 10–20%. Especially for the RF model, the error of this method larger than 2 mm was more than other models. In contrast, the AE larger than 2 mm of Bat-CB was the most stable proportion in six stations ranged from 0.06 to 0.13 and the lowest proportion in 51156, 51931, 52681 sites. From the perspective of two groups that AE value is less <0.4 mm·d−1 and AE value is 0.4–0.8 mm·d−1, the AE of the Bat-CB model had the highest proportion at 51156, 51567, 51,704, 51931 stations of a total of six stations, which were significantly higher than CB and RF models. Although the RF model had a slightly higher percentage of points <0.4 mm·d−1 at station 52203 than the other two models (higher about 0.02), it also had the highest percentage of points with the AE at >2 mm·d−1 (higher about 0.19), which is an important reason for the poor performance of RF models. Generally, RF performed worst far from Bat-CB and CB in 51156, 51931, 52203, 52681 stations. CB is mildly inferior to RF and Bat-CB in 51567 and 51704 stations. While Bat-CB showed unparalleled stability and high accuracy compared with the two other models. This outcome is consistent with the results shown in scatter plots (Figure 4). Accordingly, the AE histogram also confirmed the main advantage of the Bat-CB model with higher accuracy is to reduce the proportion of points with large errors.
3.2. Seasonal Effects on the Performance of Machine Learning Models
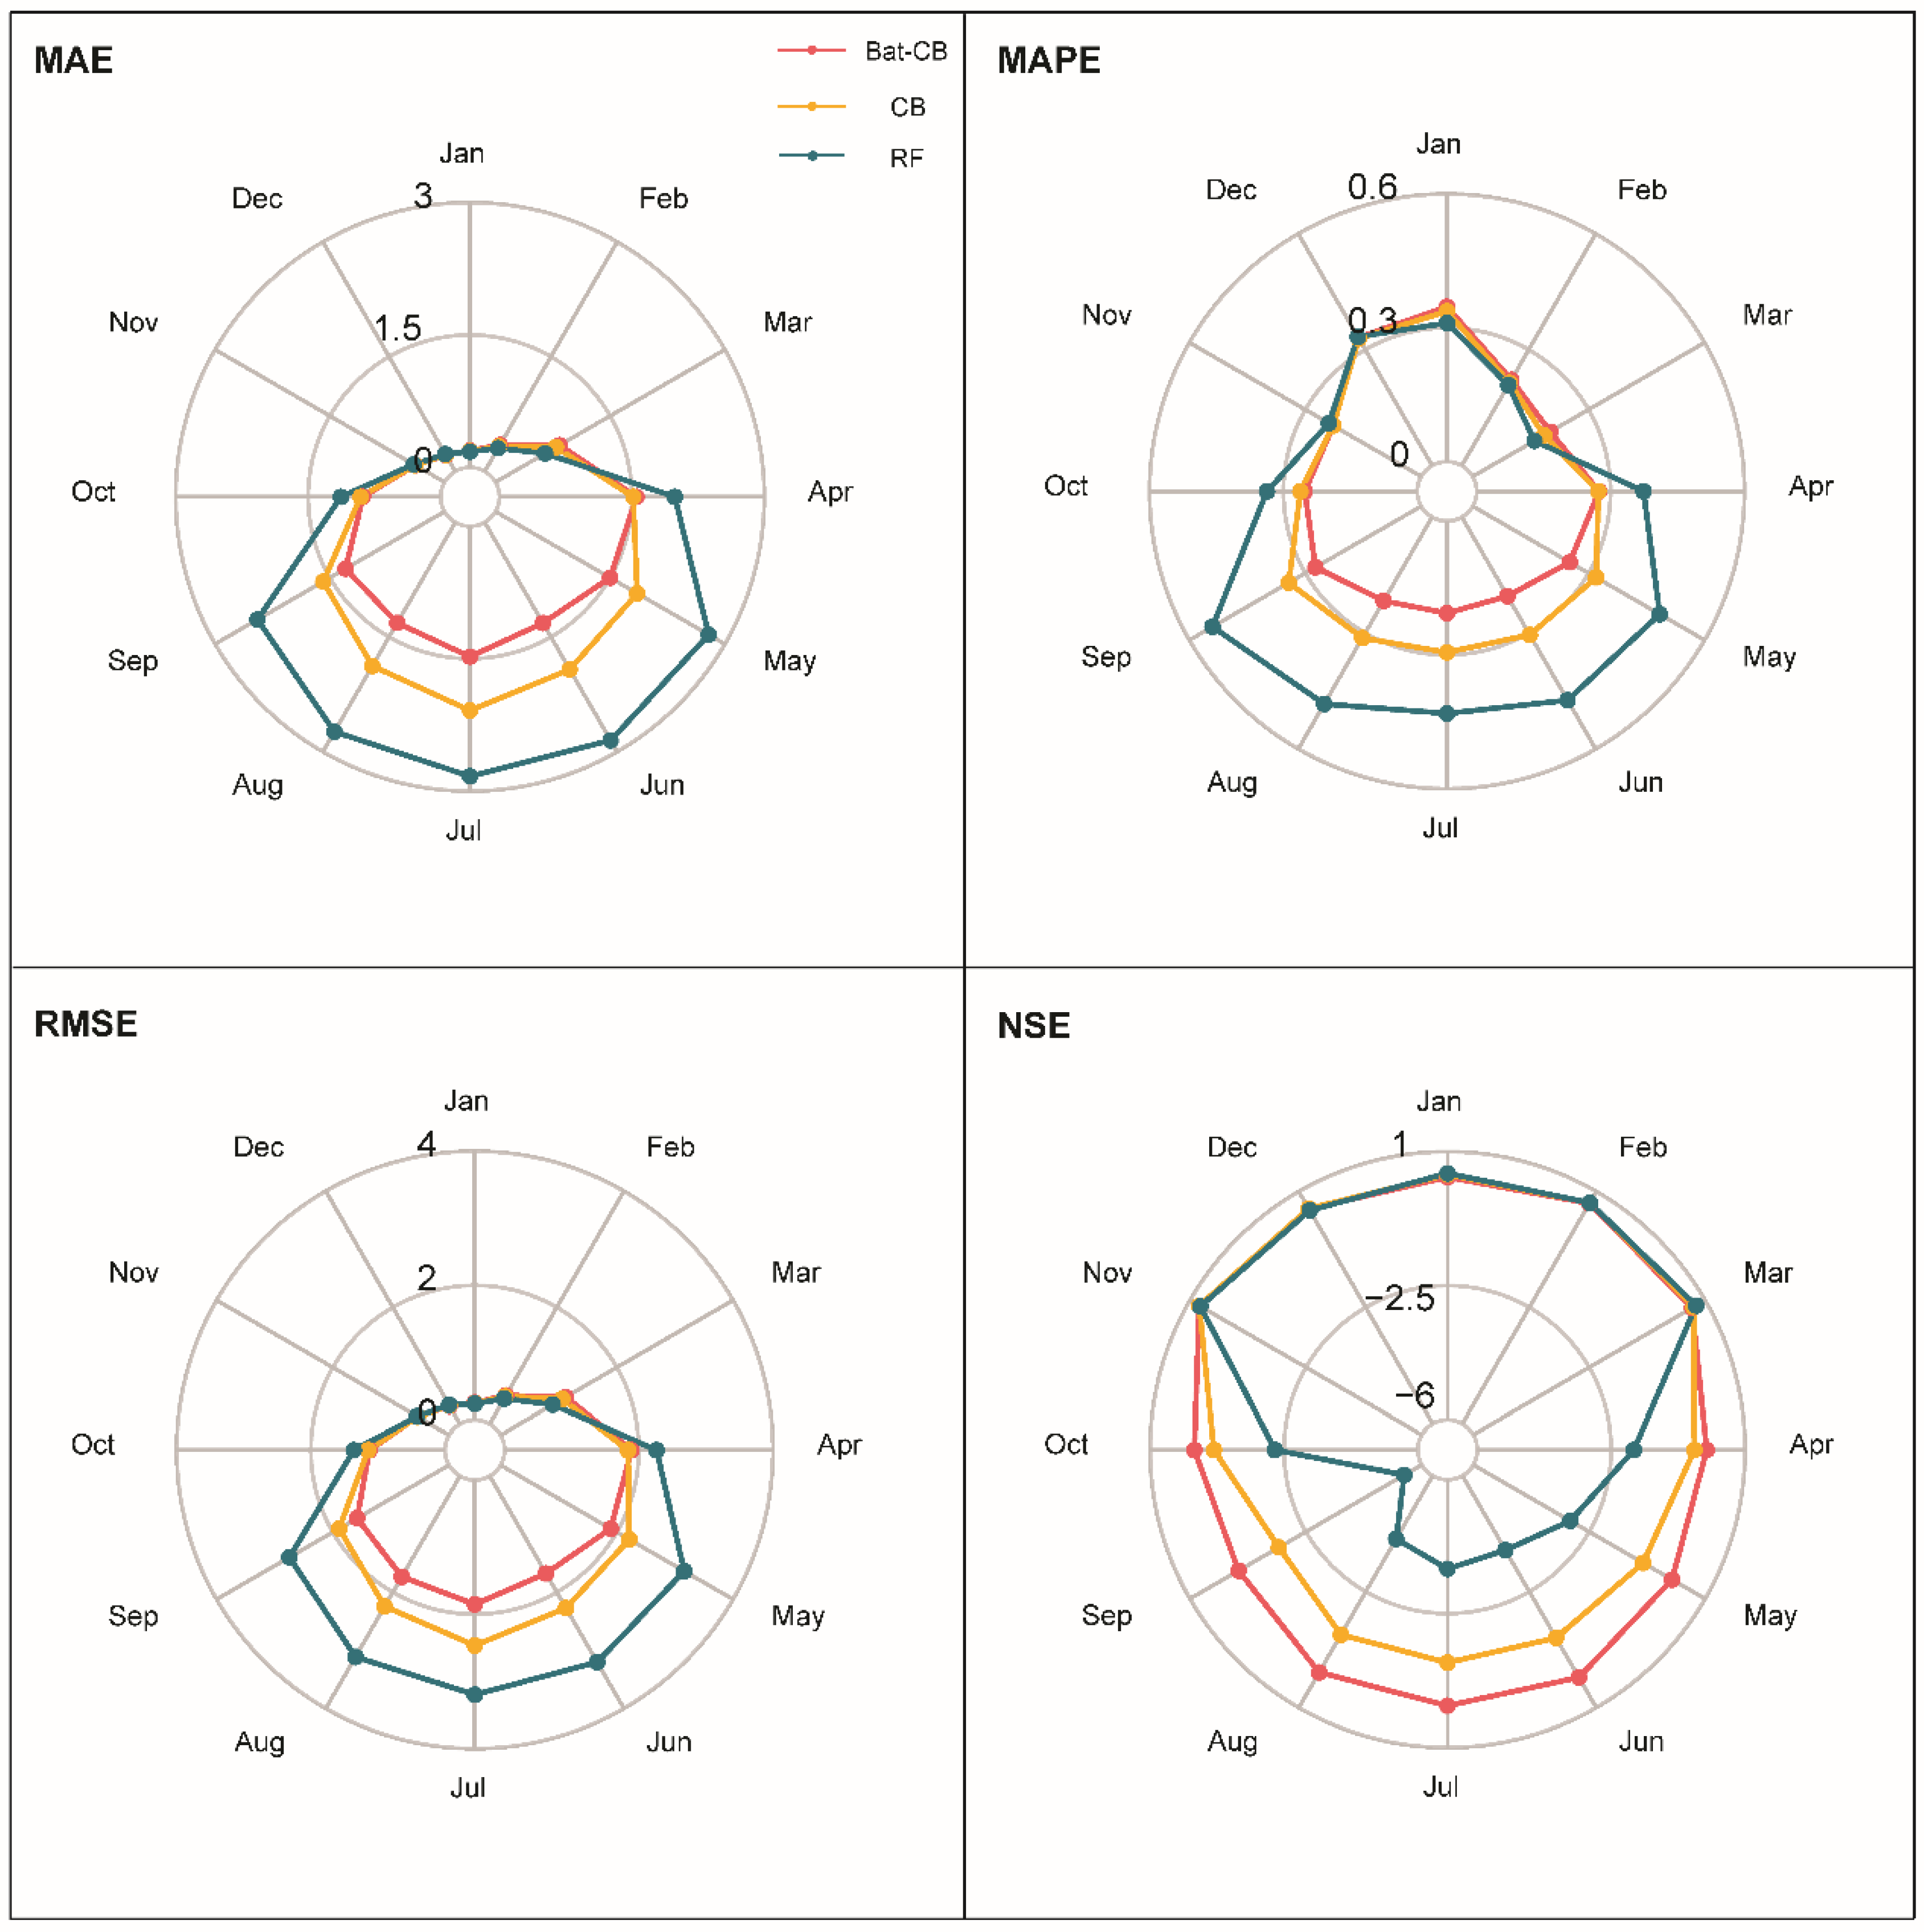
From the point of view of water resources management, the error at month scale especially the error of different seasons is also imperative for the application of the models. For the moment, most machine learning models were vulnerable in operating the sudden dramatic changes [8,45]. In this study, the stability and the accuracy of the models are equally important especially when the data are extremely abnormal like the pan evaporation in summer of arid regions. The average deviation of three different machine learning models across all stations for each month is shown in Table 3 and Figure 6 through four statistical indicators (MAE, MAPE, RMSE, NSE respectively). For brevity, the main reason for the performance difference of the three different algorithms is that the performance of the three models is hugely different from April to October, while there is almost indiscrimination from November to March. The BAT-CB model had the best performance from April to October on every indicator, followed by the CB model and RF model.

Table 3.
Monthly average values of statistical indicators generated from the three machine learning models during the testing period.
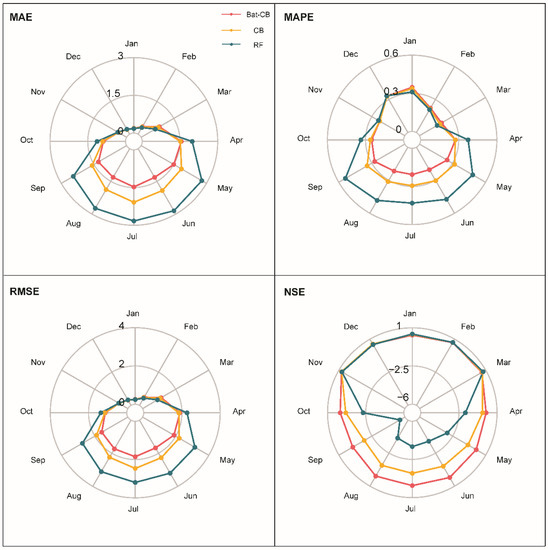
Figure 6.
Polar plots showing the monthly average values of the four statistical indicators generated from the three models in forecasting pan evaporation.
In addition, since the study area is located in the northern hemisphere, the absolute errors RMSE and MAE in summer are significantly higher than those in winter (December to February). RF’s poor ability to operate in the non-stationary environment and adapt to erratic changes makes it easy to stuck in the abrupt malfunction caused by seasonal variations of pan evaporation. RF had the extreme worst NSE and MAPE value in September and it performed unstably among months, which confirmed the foresaid disadvantage. Additionally, using relative forecasting errors such as MAPE and NSE to assess the capacity of models among different conditions is necessary [45,46]. From the perspective of relative errors (MAPE), the errors of the Bat-CB model are not significantly different among months. This indicates that the Bat-CB model has better equilibrium and exhibits excellently and robustly in different seasons. Thus, Bat-CB may be a suitable and recommended hybrid model to overcome the long-lasting problem that most models cannot work effectively in suddenly changed conditions.
3.3. Spatial Effects on the Performance of Machine Learning Models
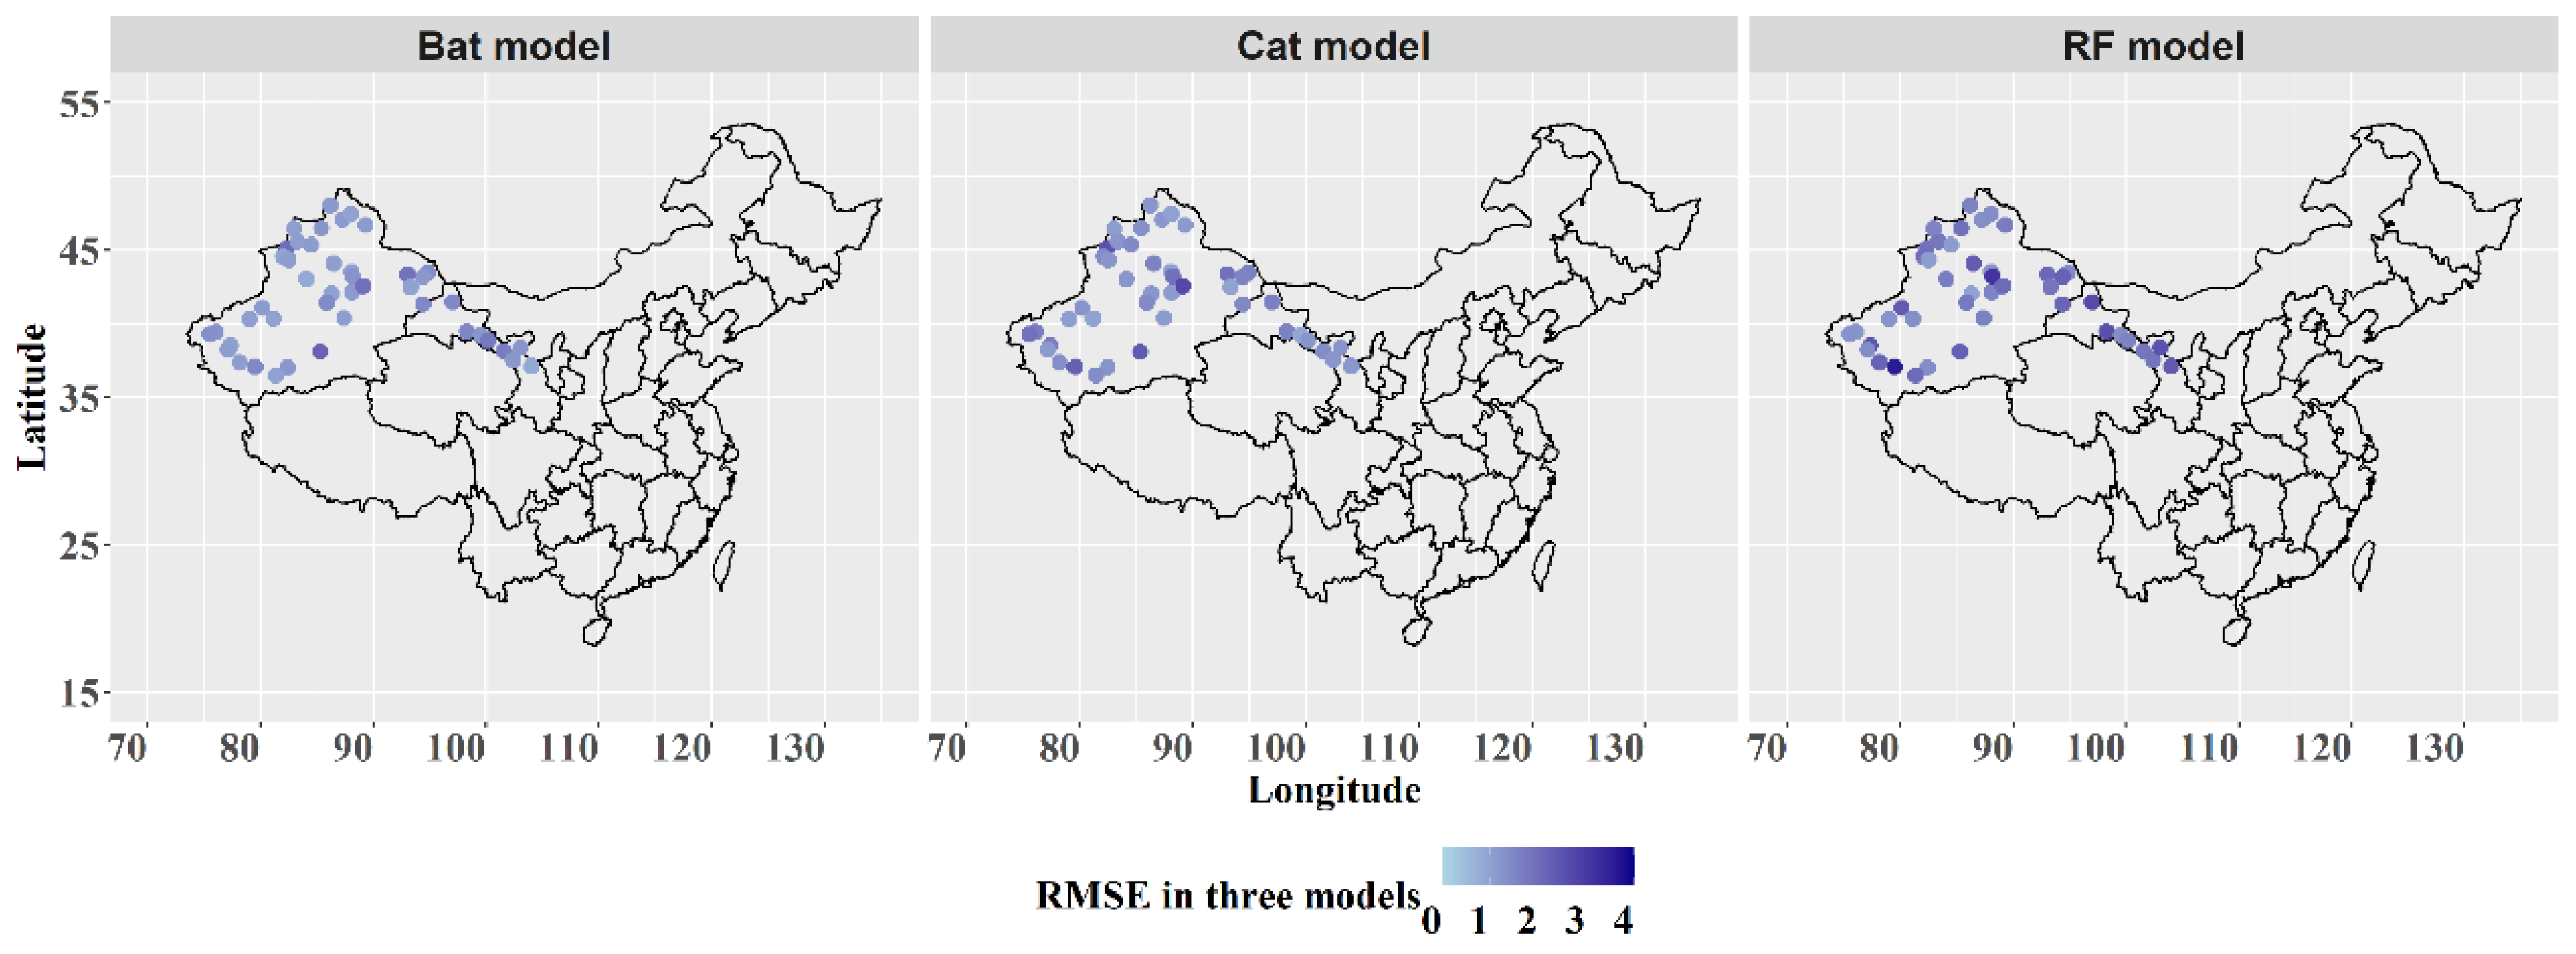
Equal to seasonal data changes, the spatial performance of machine learning models is the other far-reaching factor mirroring the generalization ability of models. The performance of machine learning models for estimating pan evaporation was visibly distinct to different weather stations [20,23,42,47]. Marking the position of 45 stations in the map and reflecting the value of RMSE to the color is an efficient visualization method to explore the spatial generalization ability of the three models (Figure 7). It was evident in Figure 7 that Bat-CB had the lowest RMSE among most stations while RF performed worst as a whole. This result and the condition of sufficient weather stations guarantee the high accuracy prediction, robust stability, and reliable generalization of Bat-CB once again.
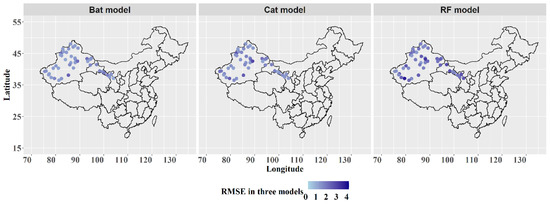
Figure 7.
Spatial distribution of the RMSE during testing stage generated from the three models for pan evaporation forecasting.
However, some individual stations did not reach satisfactory results in overall three models such as station 51855 and 51573, which probably because the stations suffered from the complicated terrain and labile climate. Thus, the application of models varied a lot in such spatial individual stations and further study was necessary for this field. Additionally, it is noteworthy that the several stations located in the Turpan Depression which are the mid area of Xinjiang province performed worst may be due to its extremely large values of pan evaporation. In contrast, the stations in the western and northern regions of the study area can be forecasted by Bat-CB with minuscule error, which indicated Bat-CB may have potential application in the extension of the boundary regions and adjacent countries like Russia, Kazakhstan, Iron, Kyrgyzstan, etc.
4. Conclusions
The study established a novel hybrid machine learning model (Bat-CB) and evaluated its application of accurately estimating the pan evaporation in the arid and semi-arid zones of northwest China. The CatBoost coupled with Bat algorithm (Bat-CB) model, along with original CatBoost and a commonly used tree-based RF algorithm, were fed with meteorological data (including Tmax, Tmin, Rs, RH, U) from abundant 45 stations during 2006–2017 and were investigated through four statistical indicators (RMSE, MAE, MAPE, NSE). The results showed the Bat-CB exhibited suitable accuracy and stability in arid and semi-arid regions and are superior to CB and RF conspicuously. CB has a slight preponderance compared with RF which presents poor ability to operate huge erratic changes for instance the pan evaporation in arid regions. The improvement brought from the Bat algorithm were conspicuous and expressed comprehensively in almost every indicator and field compared to the original CatBoost. In seasonal performance analysis, Bat-CB had better equilibrium in different months and exhibited more accuracy and robustness from April to October in comparison with RF and CatBoost. In spatial performance analysis, the result confirmed the strongest predicting ability of the Bat-CB for pan evaporation once again and indicated that further spatial generalization study was still essential. Nevertheless, the variable combinations of meteorological inputs and more types of climate were not contained in this study. Further research exploring the application in other climates and the condition of missing or limited meteorological data is significant. Overall, Bat-CB had a powerful ability for pan evaporation forecasting and obviously outperformed CatBoost and RF among sufficient fields, especially in arid and semi-arid areas.
Author Contributions
Conceptualization, W.Z. and H.C.; methodology, L.W.; software, L.D.; writing—original draft preparation, L.D.; writing—review and editing, G.L., A.K.S., T.G. All authors have read and agreed to the published version of the manuscript.
Funding
This research was funded by the National Natural Science Foundation of China (NSFC) (Grant Nos. 51879196 and 51790533), the mobility program by the Joint Committee of the Sino-German Center for Research Promotion (SGC) (Grant No. M-0009), and the DFG Mobility and BonaRes-Soil3 (Grant No. 031B0151A).
Institutional Review Board Statement
Not applicable.
Informed Consent Statement
Not applicable.
Data Availability Statement
The data presented in this study are available on request from the corresponding author.
Acknowledgments
We are grateful for support from Chang Ao for the constructive suggestions.
Conflicts of Interest
The authors declare no conflict of interest.
References
- Kisi, O.; Genc, O.; Dinc, S.; Zounemat-Kermani, M. Daily pan evaporation modeling using chi-squared automatic interaction detector, neural networks, classification and regression tree. Comput. Electron. Agric. 2016, 122, 112–117. [Google Scholar] [CrossRef]
- Shabani, S.; Samadianfard, S.; Sattari, M.T.; Mosavi, A.; Shamshirband, S.; Kmet, T.; Varkonyi-Koczy, A.R. Modeling Pan Evaporation Using Gaussian Process Regression K-Nearest Neighbors Random Forest and Support Vector Machines; Comparative Analysis. Atmosphere 2020, 11, 66. [Google Scholar] [CrossRef]
- Rahimikhoob, A.; Asadi, M.; Mashal, M. A Comparison Between Conventional and M5 Model Tree Methods for Converting Pan Evaporation to Reference Evapotranspiration for Semi-Arid Region. Water Resour. Manag. 2013, 27, 4815–4826. [Google Scholar] [CrossRef]
- Shiri, J.; Marti, P.; Karimi, S.; Landeras, G. Data splitting strategies for improving data driven models for reference evapotranspiration estimation among similar stations. Comput. Electron. Agric. 2019, 162, 70–81. [Google Scholar] [CrossRef]
- Chang, L.-C.; Sun, W.-Z.; Chung, C. Dynamic factor analysis and artificial neural network for estimating pan evaporation at multiple stations in northern Taiwan. Hydrol. Sci. J. 2013, 58, 813–825. [Google Scholar] [CrossRef][Green Version]
- Goyal, M.K.; Bharti, B.; Quilty, J.; Adamowski, J.; Pandey, A. Modeling of daily pan evaporation in sub tropical climates using ANN, LS-SVR, Fuzzy Logic, and ANFIS. Expert Syst. Appl. 2014, 41, 5267–5276. [Google Scholar] [CrossRef]
- Ghaemi, A.; Rezaie-Balf, M.; Adamowski, J.; Kisi, O.; Quilty, J. On the applicability of maximum overlap discrete wavelet transform integrated with MARS and M5 model tree for monthly pan evaporation prediction. Agric. For. Meteorol. 2019, 278. [Google Scholar] [CrossRef]
- Wang, H.; Yan, H.; Zeng, W.; Lei, G.; Ao, C.; Zha, Y. A novel nonlinear Arps decline model with salp swarm algorithm for predicting pan evaporation in the arid and semi-arid regions of China. J. Hydrol. 2020, 582, 124545. [Google Scholar] [CrossRef]
- Babakos, K.; Papamichail, D.M.; Tziachris, P.; Pisinaras, V.; Demertzi, K.; Castaldelli, G. Assessing the Robustness of Pan Evaporation Models for Estimating Reference Crop Evapotranspiration during Recalibration at Local Conditions. Hydrology 2020, 7, 62. [Google Scholar] [CrossRef]
- Kim, S.; Shiri, J.; Kisi, O. Pan Evaporation Modeling Using Neural Computing Approach for Different Climatic Zones. Water Resour. Manag. 2012, 26, 3231–3249. [Google Scholar] [CrossRef]
- Kisi, O. Pan evaporation modeling using least square support vector machine, multivariate adaptive regression splines and M5 model tree. J. Hydrol. 2015, 528, 312–320. [Google Scholar] [CrossRef]
- Wang, L.; Niu, Z.; Kisi, O.; Li, C.; Yu, D. Pan evaporation modeling using four different heuristic approaches. Comput. Electron. Agric. 2017, 140, 203–213. [Google Scholar] [CrossRef]
- Mehr, A.D. An improved gene expression programming model for streamflow forecasting in intermittent streams. J. Hydrol. 2018, 563, 669–678. [Google Scholar] [CrossRef]
- Sharma, N.; Zakaullah, M.d.; Tiwari, H.; Kumar, D. Runoff and sediment yield modeling using ANN and support vector machines: A case study from Nepal watershed. Model. Earth Syst. Environ. 2015, 1, 23. [Google Scholar] [CrossRef]
- Malekzadeh, M.; Kardar, S.; Shabanlou, S. Simulation of groundwater level using MODFLOW, extreme learning machine and Wavelet-Extreme Learning Machine models. Groundw. Sustain. Dev. 2019, 9, 100279. [Google Scholar] [CrossRef]
- Wei, Z.; Meng, Y.; Zhang, W.; Peng, J.; Meng, L. Downscaling SMAP soil moisture estimation with gradient boosting decision tree regression over the Tibetan Plateau. Remote. Sens. Environ. 2019, 225, 30–44. [Google Scholar] [CrossRef]
- Wu, L.; Huang, G.; Fan, J.; Zhang, F.; Wang, X.; Zeng, W. Potential of kernel-based nonlinear extension of Arps decline model and gradient boosting with categorical features support for predicting daily global solar radiation in humid regions. Energy Convers. Manag. 2019, 183, 280–295. [Google Scholar] [CrossRef]
- Wu, L.; Huang, G.; Fan, J.; Ma, X.; Zhou, H.; Zeng, W. Hybrid extreme learning machine with meta-heuristic algorithms for monthly pan evaporation prediction. Comput. Electron. Agric. 2020, 168, 105115. [Google Scholar] [CrossRef]
- Karimi, S.; Shiri, J.; Marti, P. Supplanting missing climatic inputs in classical and random forest models for estimating reference evapotranspiration in humid coastal areas of Iran. Comput. Electron. Agric. 2020, 176, 105633. [Google Scholar] [CrossRef]
- Zhang, Y.; Zhao, Z.; Zheng, J. CatBoost: A new approach for estimating daily reference crop evapotranspiration in arid and semi-arid regions of Northern China. J. Hydrol. 2020, 588, 125087. [Google Scholar] [CrossRef]
- Shan, X.; Cui, N.; Cai, H.; Hu, X.; Zhao, L. Estimation of summer maize evapotranspiration using MARS model in the semi-arid region of northwest China. Comput. Electron. Agric. 2020, 174, 105495. [Google Scholar] [CrossRef]
- Keskin, M.E.; Terzi, O. Artificial Neural Network Models of Daily Pan Evaporation. J. Hydrol. Eng. 2006, 11, 65–70. [Google Scholar] [CrossRef]
- Lu, X.; Ju, Y.; Wu, L.; Fan, J.; Zhang, F.; Li, Z. Daily pan evaporation modeling from local and cross-station data using three tree-based machine learning models. J. Hydrol. 2018, 566, 668–684. [Google Scholar] [CrossRef]
- Kisi, O.; Heddam, S. Evaporation modelling by heuristic regression approaches using only temperature data. Hydrol. Sci. J. 2019, 64, 653–672. [Google Scholar] [CrossRef]
- Seifi, A.; Soroush, F. Pan evaporation estimation and derivation of explicit optimized equations by novel hybrid meta-heuristic ANN based methods in different climates of Iran. Comput. Electron. Agric. 2020, 173, 105418. [Google Scholar] [CrossRef]
- Mishra, S.; Shaw, K.; Mishra, D. A New Meta-heuristic Bat Inspired Classification Approach for Microarray Data. Procedia Technol. 2012, 4, 802–806. [Google Scholar] [CrossRef]
- Yang, X.-S.; Ding, W.-J.; Yang, X.-S. Bat algorithm based on simulated annealing and Gaussian perturbations. Neural Comput. Appl. 2013, 25, 459–468. [Google Scholar] [CrossRef]
- Hasançebi, O.; Teke, T.; Pekcan, O. A bat-inspired algorithm for structural optimization. Comput. Struct. 2013, 128, 77–90. [Google Scholar] [CrossRef]
- Farzin, S.; Singh, V.P.; Karami, H.; Farahani, N.; Ehteram, M.; Kisi, O.; Allawi, M.F.; Mohd, N.S.; El-Shafie, A. Flood Routing in River Reaches Using a Three-Parameter Muskingum Model Coupled with an Improved Bat Algorithm. Water 2018, 10, 1130. [Google Scholar] [CrossRef]
- Han, Y.; Wu, J.; Zhai, B.; Pan, Y.; Huang, G.; Wu, L.; Zeng, W. Coupling a Bat Algorithm with XGBoost to Estimate Reference Evapotranspiration in the Arid and Semiarid Regions of China. Adv. Meteorol. 2019, 2019, 1–16. [Google Scholar] [CrossRef]
- Ali, M.; Deo, R.C.; Downs, N.J.; Maraseni, T. Multi-stage hybridized online sequential extreme learning machine integrated with Markov Chain Monte Carlo copula-Bat algorithm for rainfall forecasting. Atmos. Res. 2018, 213, 450–464. [Google Scholar] [CrossRef]
- Dong, J.; Wu, L.; Liu, X.; Li, Z.; Gao, Y.; Zhang, Y.; Yang, Q. Estimation of daily dew point temperature by using bat algorithm optimization based extreme learning machine. Appl. Therm. Eng. 2020, 165, 114569. [Google Scholar] [CrossRef]
- Kang, P.; Lin, Z.; Teng, S.; Zhang, G.; Guo, L.; Zhang, W. Catboost-Based Framework with Additional User Information for Social Media Popularity Prediction; ACM: New York, NY, USA, 2019; pp. 2677–2681. [Google Scholar]
- Fan, J.; Wang, X.; Wu, L.; Zhou, H.; Zhang, F.; Yu, X.; Lu, X.; Xiang, Y. Comparison of Support Vector Machine and Extreme Gradient Boosting for predicting daily global solar radiation using temperature and precipitation in humid subtropical climates: A case study in China. Energy Convers. Manag. 2018, 164, 102–111. [Google Scholar] [CrossRef]
- Huang, G.; Wu, L.; Ma, X.; Zhang, W.; Fan, J.; Yu, X.; Zeng, W.; Zhou, H. Evaluation of CatBoost method for prediction of reference evapotranspiration in humid regions. J. Hydrol. 2019, 574, 1029–1041. [Google Scholar] [CrossRef]
- Iwendi, C.; Khan, S.; Anajemba, J.H.; Bashir, A.K.; Noor, F. Realizing an Efficient IoMT-Assisted Patient Diet Recommendation System Through Machine Learning Model. IEEE Access 2020, 8, 28462–28474. [Google Scholar] [CrossRef]
- Iwendi, C.; Khan, S.; Anajemba, J.H.; Mittal, M.; Alenezi, M.; Alazab, M. The Use of Ensemble Models for Multiple Class and Binary Class Classification for Improving Intrusion Detection Systems. Sensors 2020, 20, 2559. [Google Scholar] [CrossRef]
- Breiman, L. Random Forests. Mach. Learn. 2001, 45, 5–32. [Google Scholar] [CrossRef]
- Boulesteix, A.-L.; Janitza, S.; Kruppa, J.; König, I.R. Overview of random forest methodology and practical guidance with emphasis on computational biology and bioinformatics. WIREs Data Mining Knowl. Discov. 2012, 2, 493–507. [Google Scholar] [CrossRef]
- Prokhorenkova, L.; Gusev, G.; Vorobev, A.; Dorogush, A.V.; Gulin, A. Catboost: Unbiased boosting with categorical features. In Proceedings of the 32nd International Conference on Neural Information Processing Systems, Montréal, QC, Canada, 3–8 December 2018; Curran Associates Inc.: Red Hook, NY, USA, 2018; pp. 6639–6649. [Google Scholar]
- Fan, J.; Wu, L.; Zhang, F.; Cai, H.; Zeng, W.; Wang, X.; Zou, H. Empirical and machine learning models for predicting daily global solar radiation from sunshine duration: A review and case study in China. Renew. Sustain. Energy Rev. 2019, 100, 186–212. [Google Scholar] [CrossRef]
- Piri, J.; Mohammadi, K.; Shamshirband, S.; Akib, S. Assessing the suitability of hybridizing the Cuckoo optimization algorithm with ANN and ANFIS techniques to predict daily evaporation. Environ. Earth Sci. 2016, 75. [Google Scholar] [CrossRef]
- Feng, Y.; Jia, Y.; Zhang, Q.; Gong, D.; Cui, N. National-scale assessment of pan evaporation models across different climatic zones of China. J. Hydrol. 2018, 564, 314–328. [Google Scholar] [CrossRef]
- Malik, A.; Kumar, A.; Kisi, O. Monthly pan-evaporation estimation in Indian central Himalayas using different heuristic approaches and climate based models. Comput. Electron. Agric. 2017, 143, 302–313. [Google Scholar] [CrossRef]
- Deo, R.C.; Kisi, O.; Singh, V.P. Drought forecasting in eastern Australia using multivariate adaptive regression spline, least square support vector machine and M5Tree model. Atmos. Res. 2017, 184, 149–175. [Google Scholar] [CrossRef]
- Dawson, C.; Abrahart, R.; See, L. HydroTest: A web-based toolbox of evaluation metrics for the standardised assessment of hydrological forecasts. Environ. Model. Softw. 2007, 22, 1034–1052. [Google Scholar] [CrossRef]
- Sebbar, A.; Heddam, S.; Djemili, L. Predicting Daily Pan Evaporation (Epan) from Dam Reservoirs in the Mediterranean Regions of Algeria: OPELM vs. OSELM. Environ. Process. 2019, 6, 309–319. [Google Scholar] [CrossRef]
Publisher’s Note: MDPI stays neutral with regard to jurisdictional claims in published maps and institutional affiliations. |
© 2021 by the authors. Licensee MDPI, Basel, Switzerland. This article is an open access article distributed under the terms and conditions of the Creative Commons Attribution (CC BY) license (http://creativecommons.org/licenses/by/4.0/).

