Investigating Water Quality Data Using Principal Component Analysis and Granger Causality


Abstract
:1. Introduction
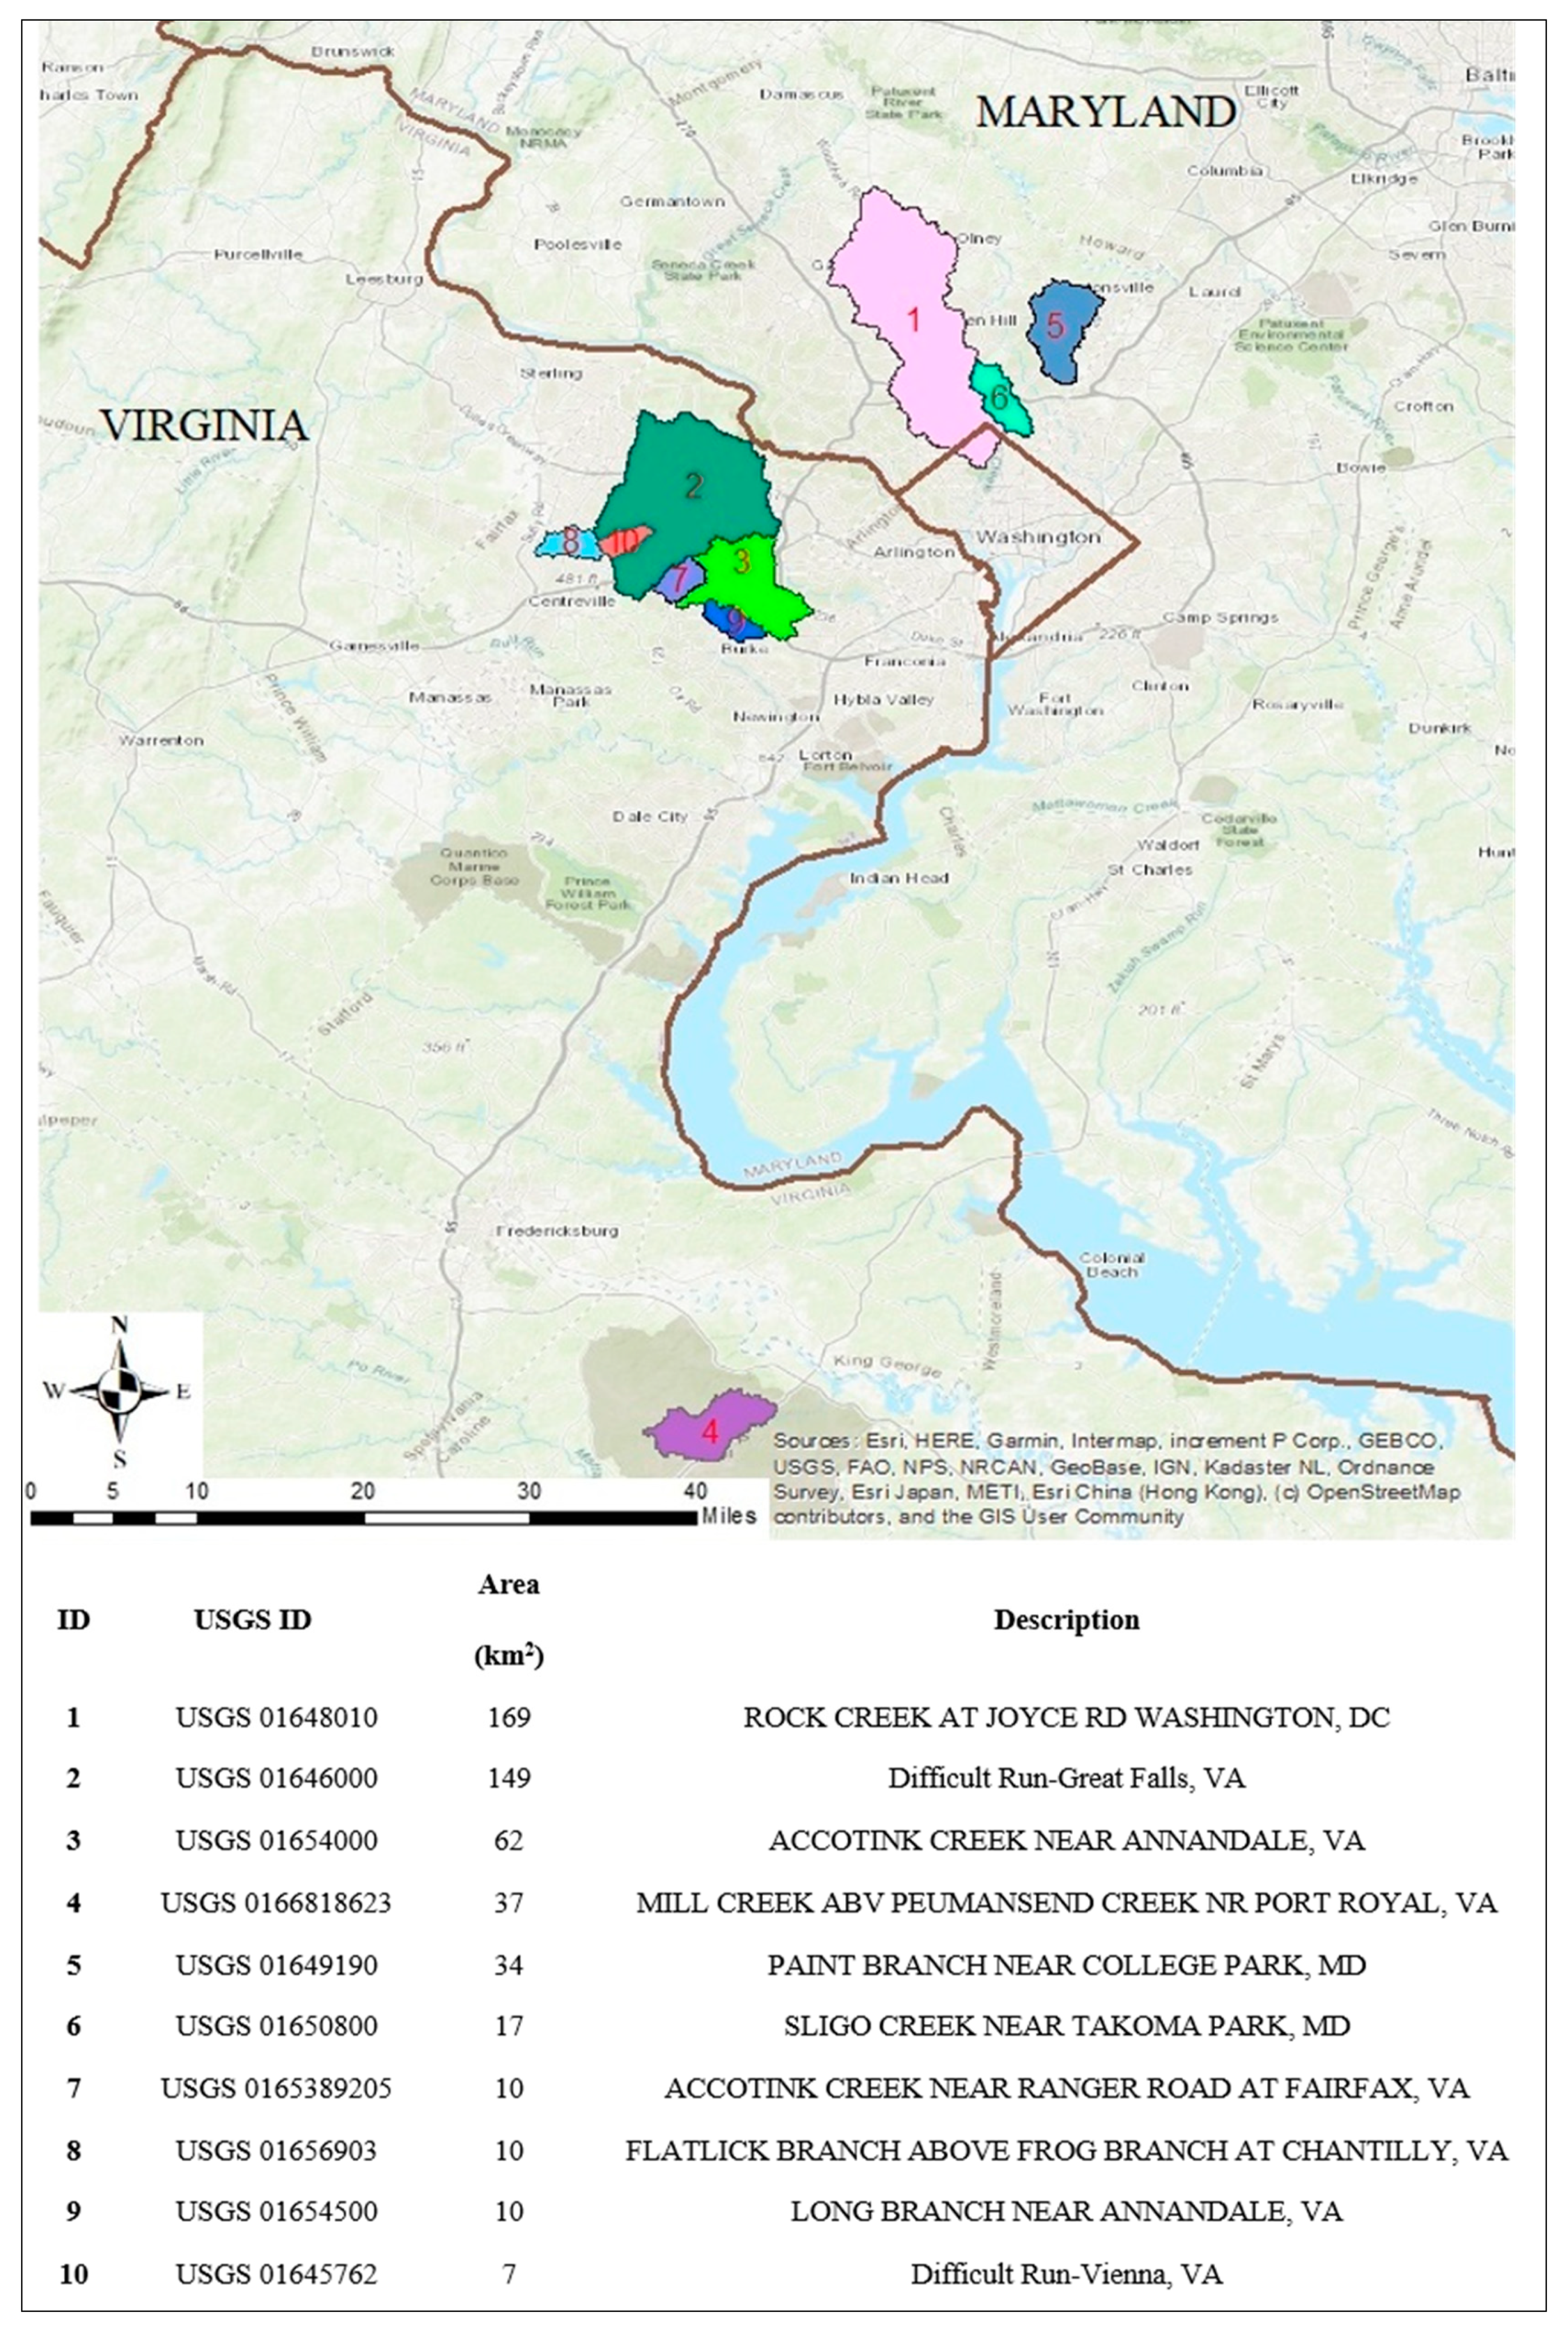
2. Study Area and Dataset
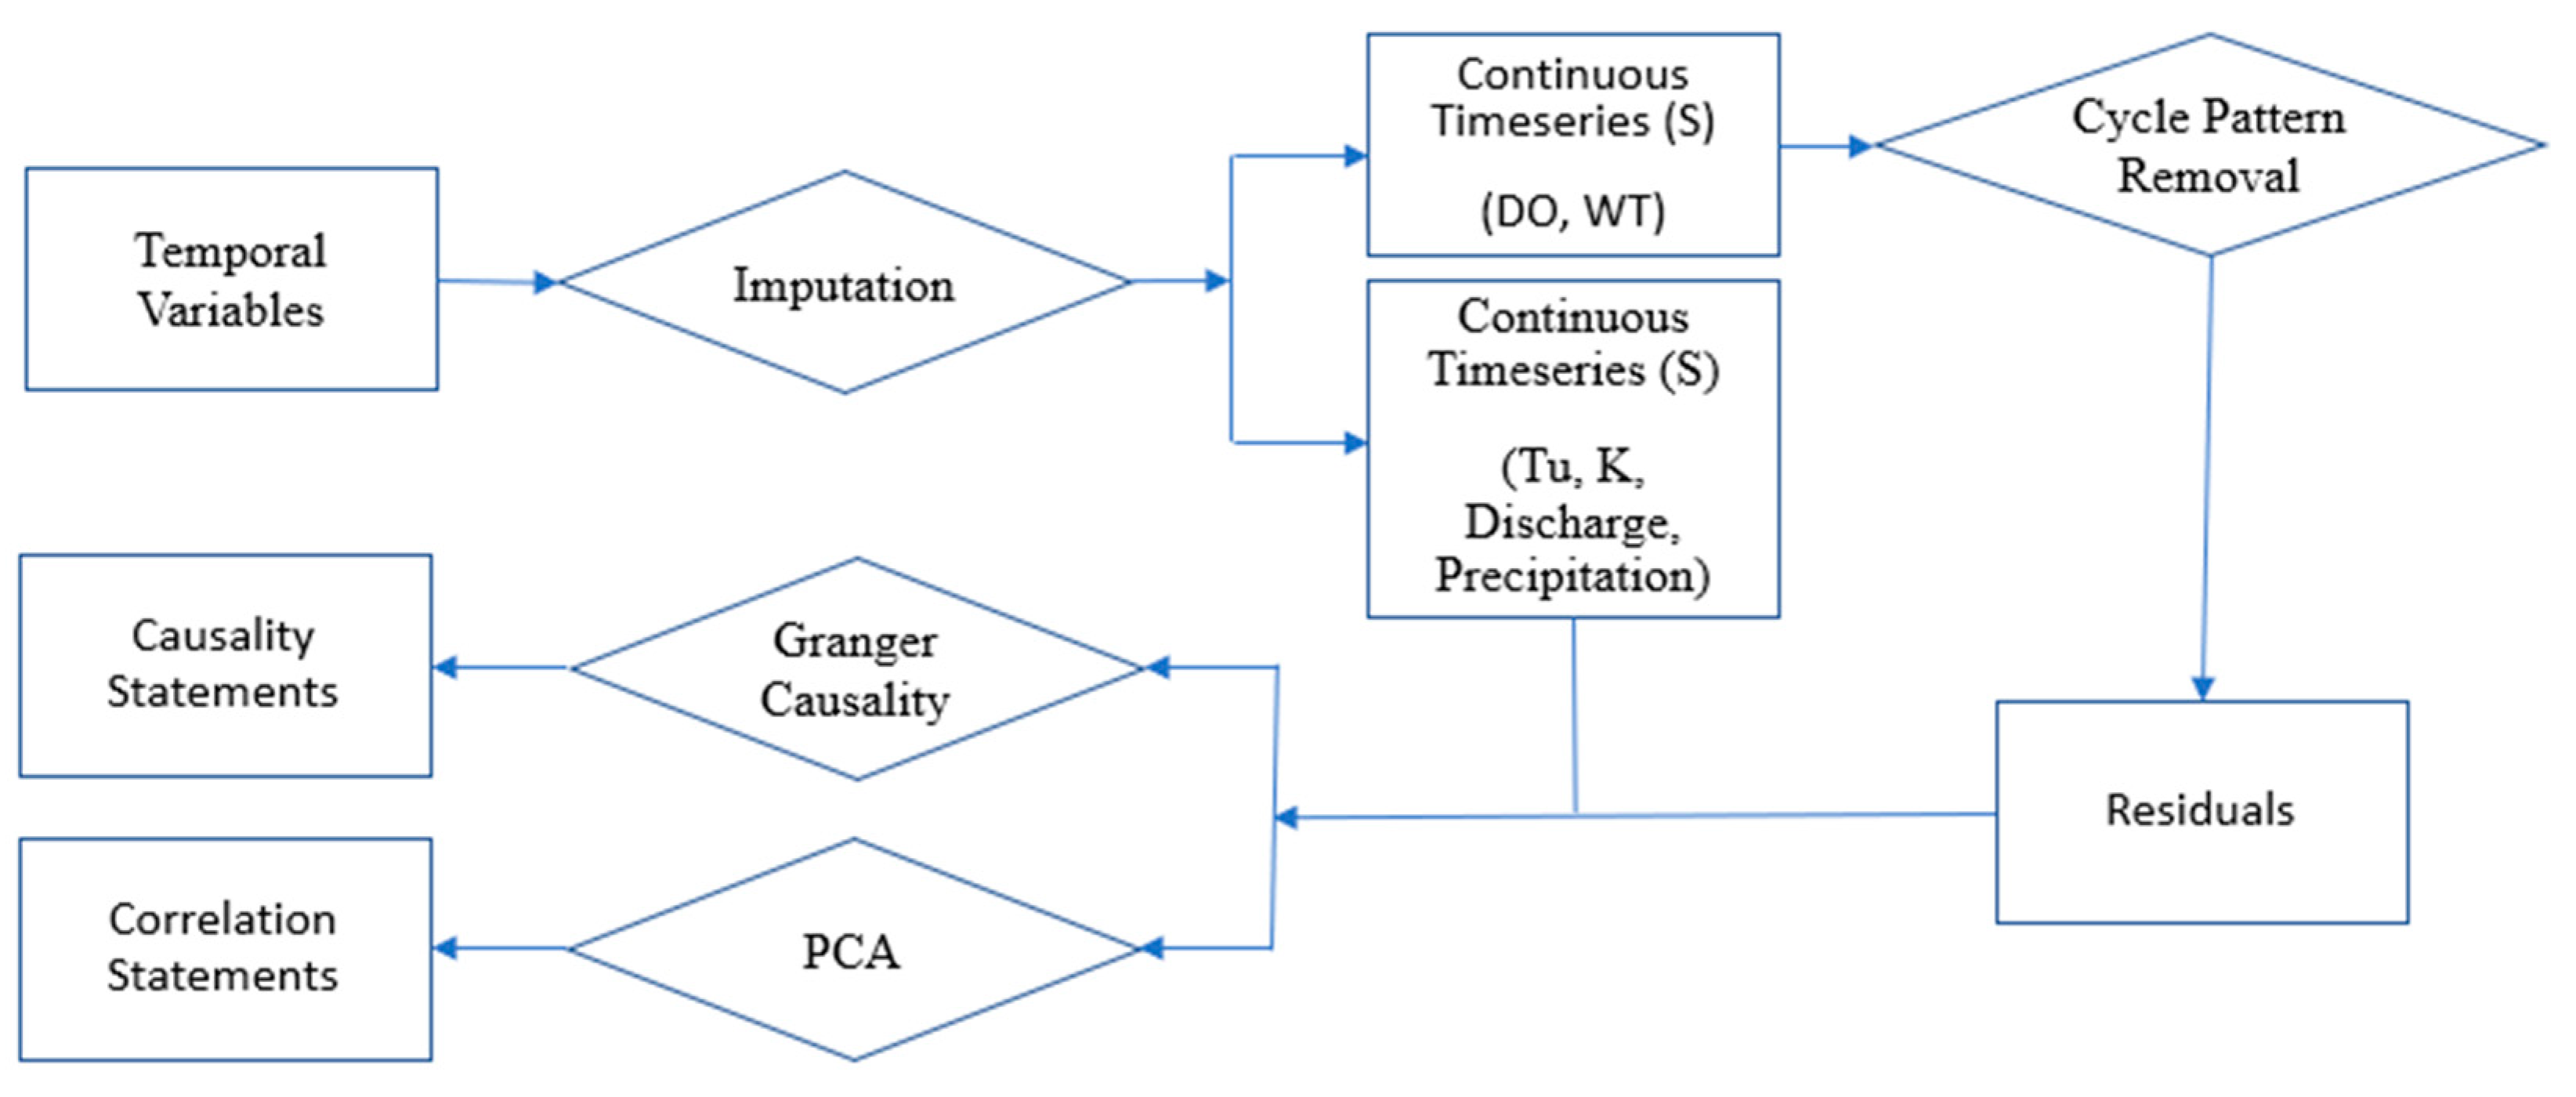
3. Methodology
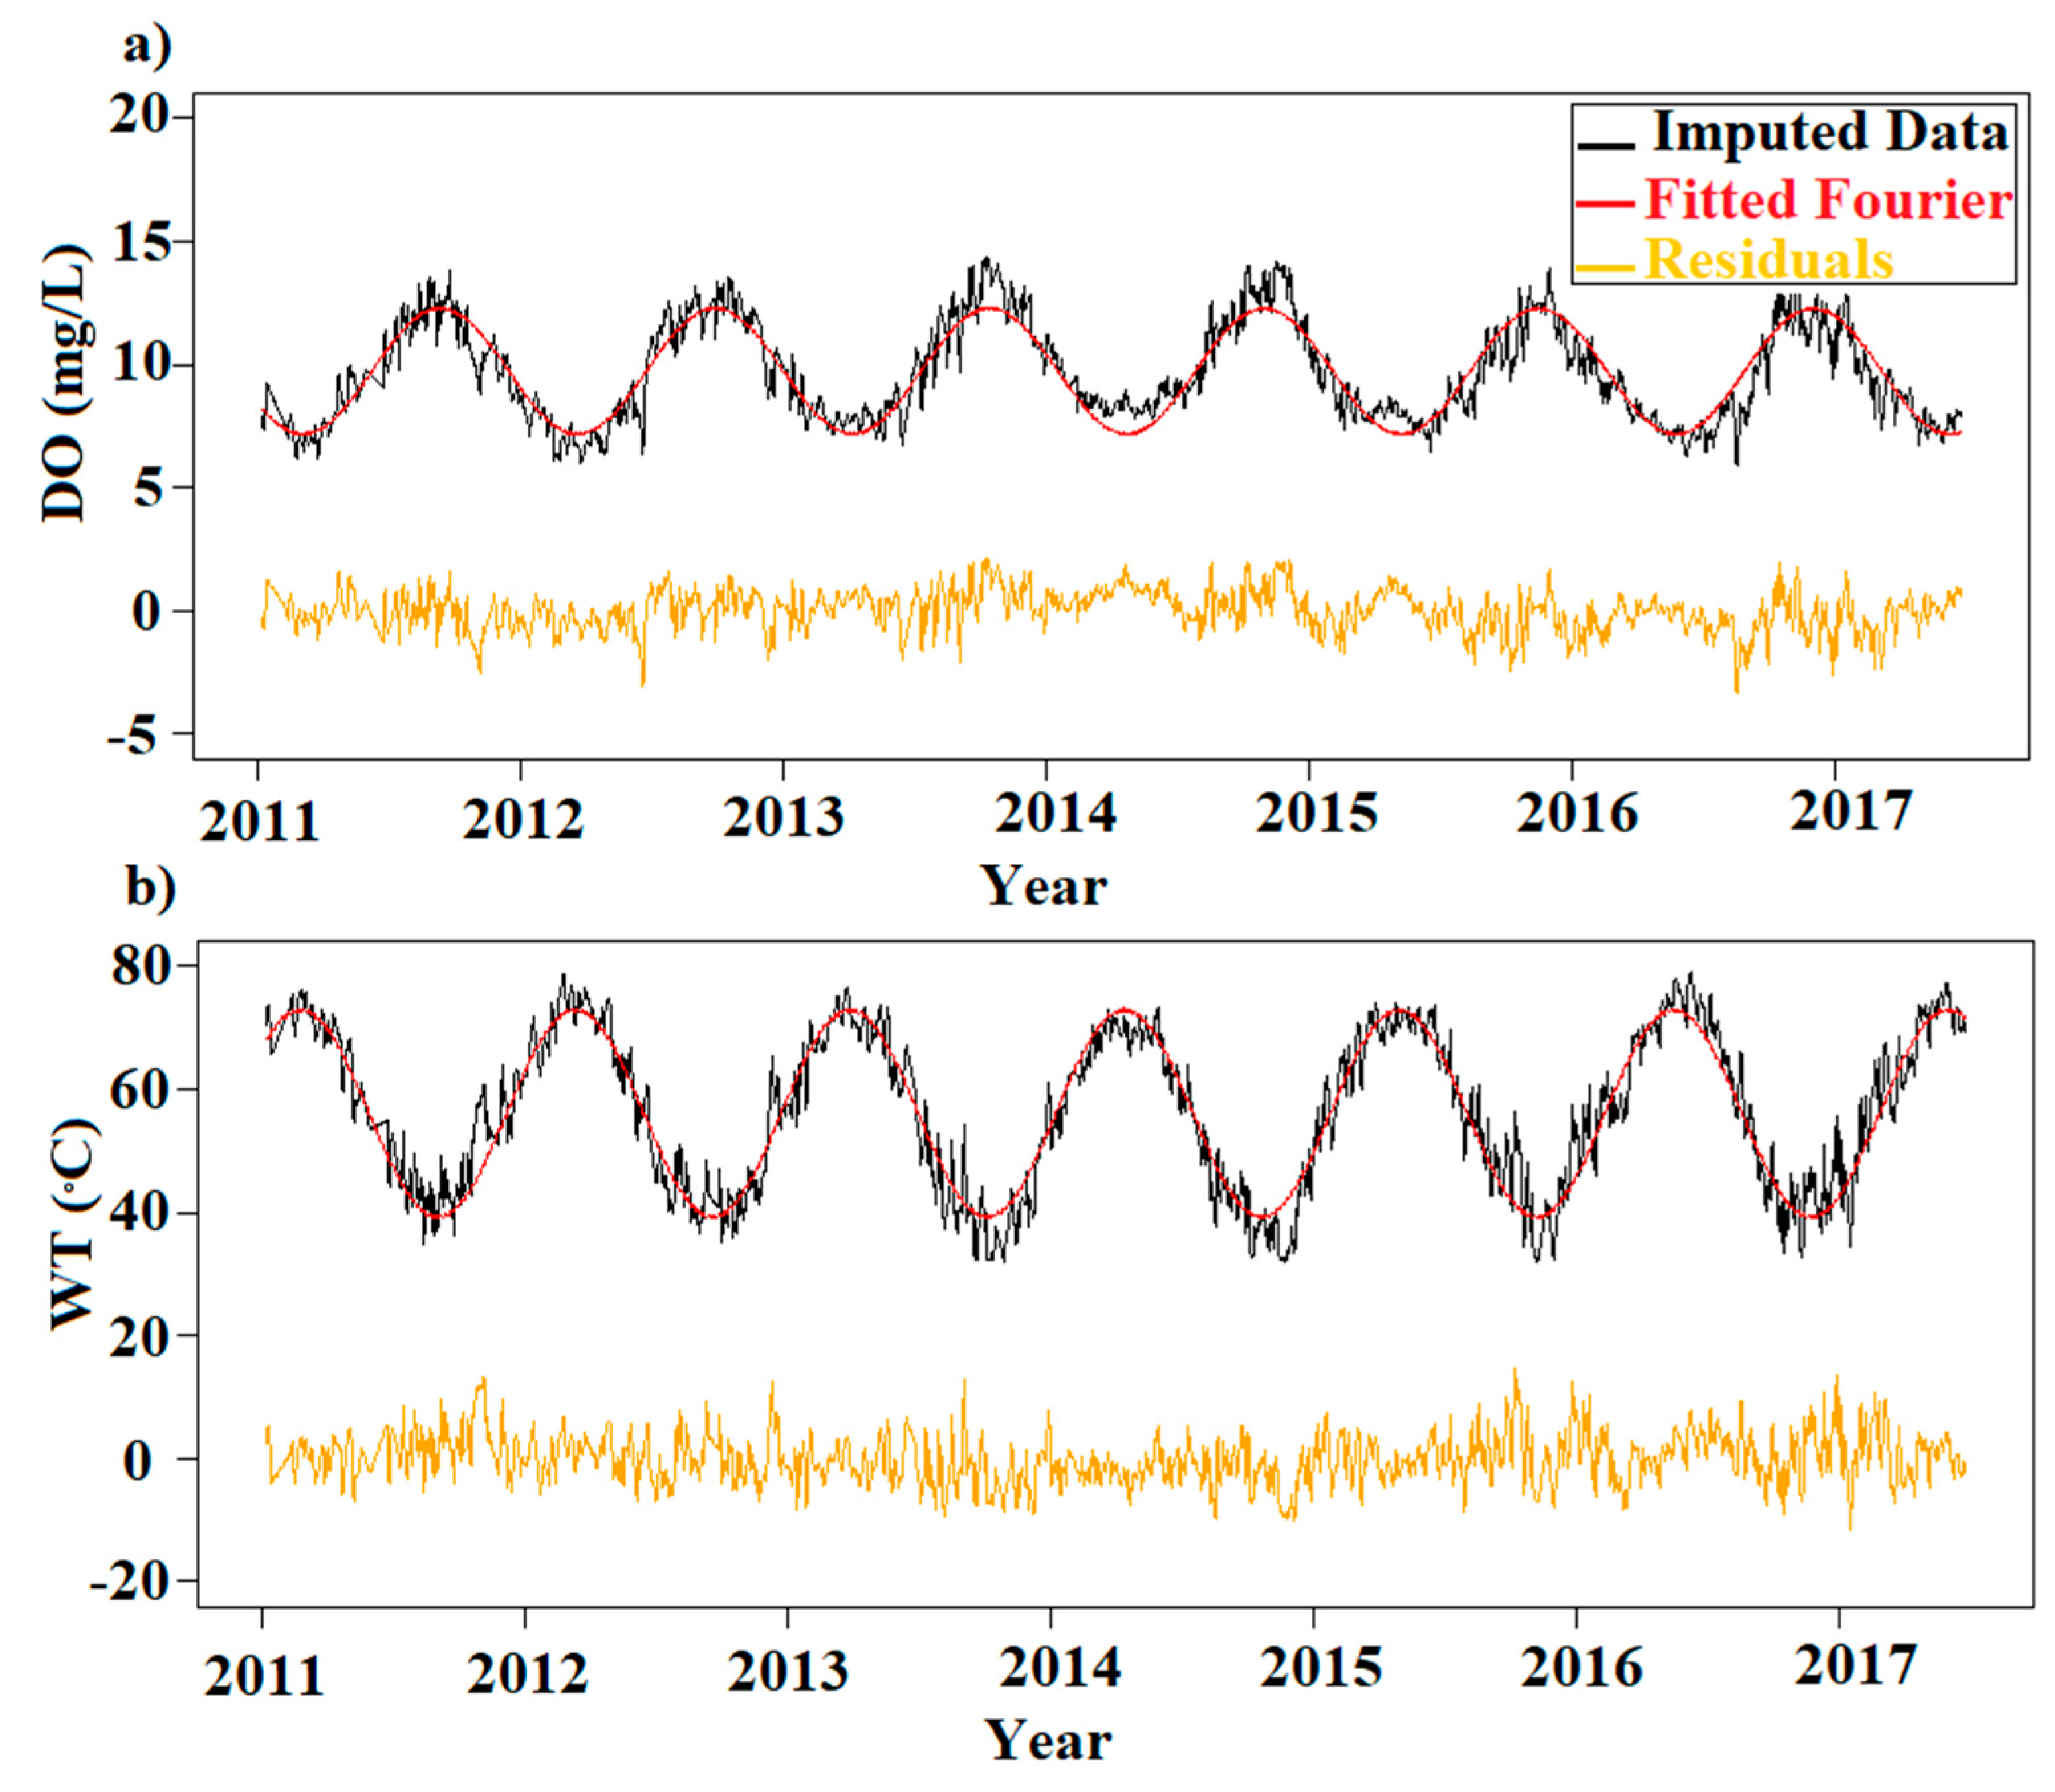
3.1. Data Pre-Processing
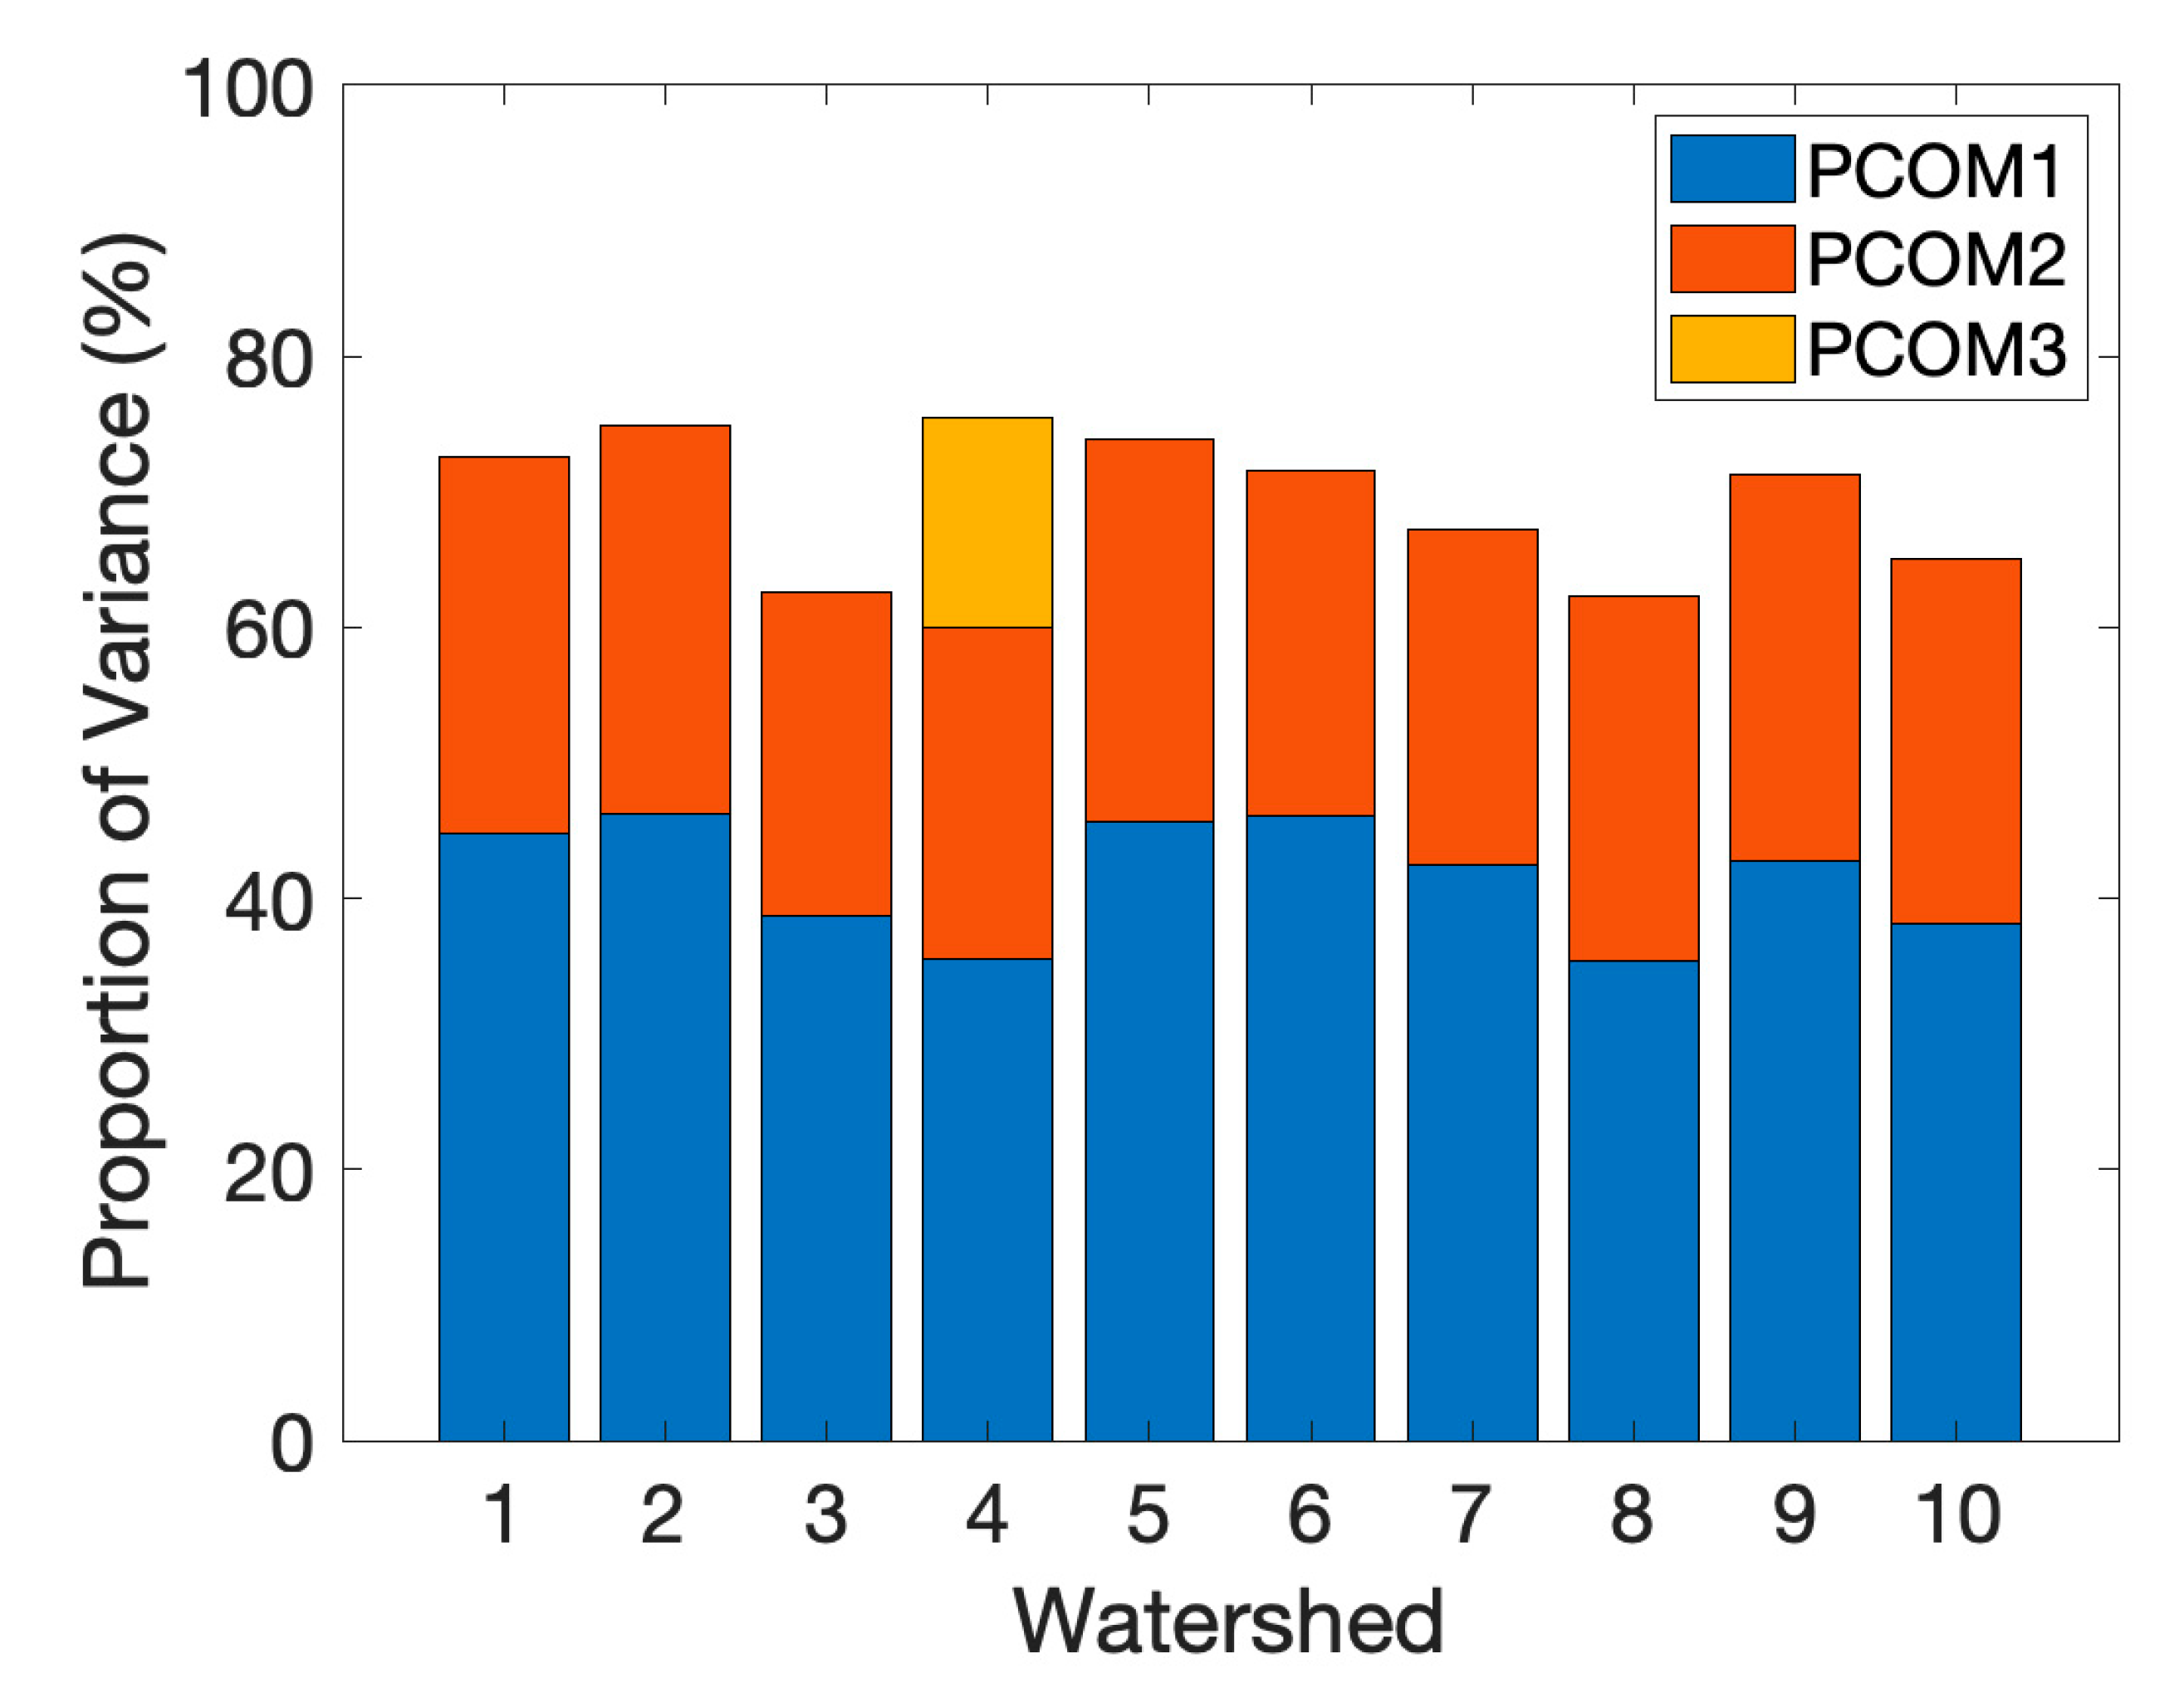
3.2. PCA
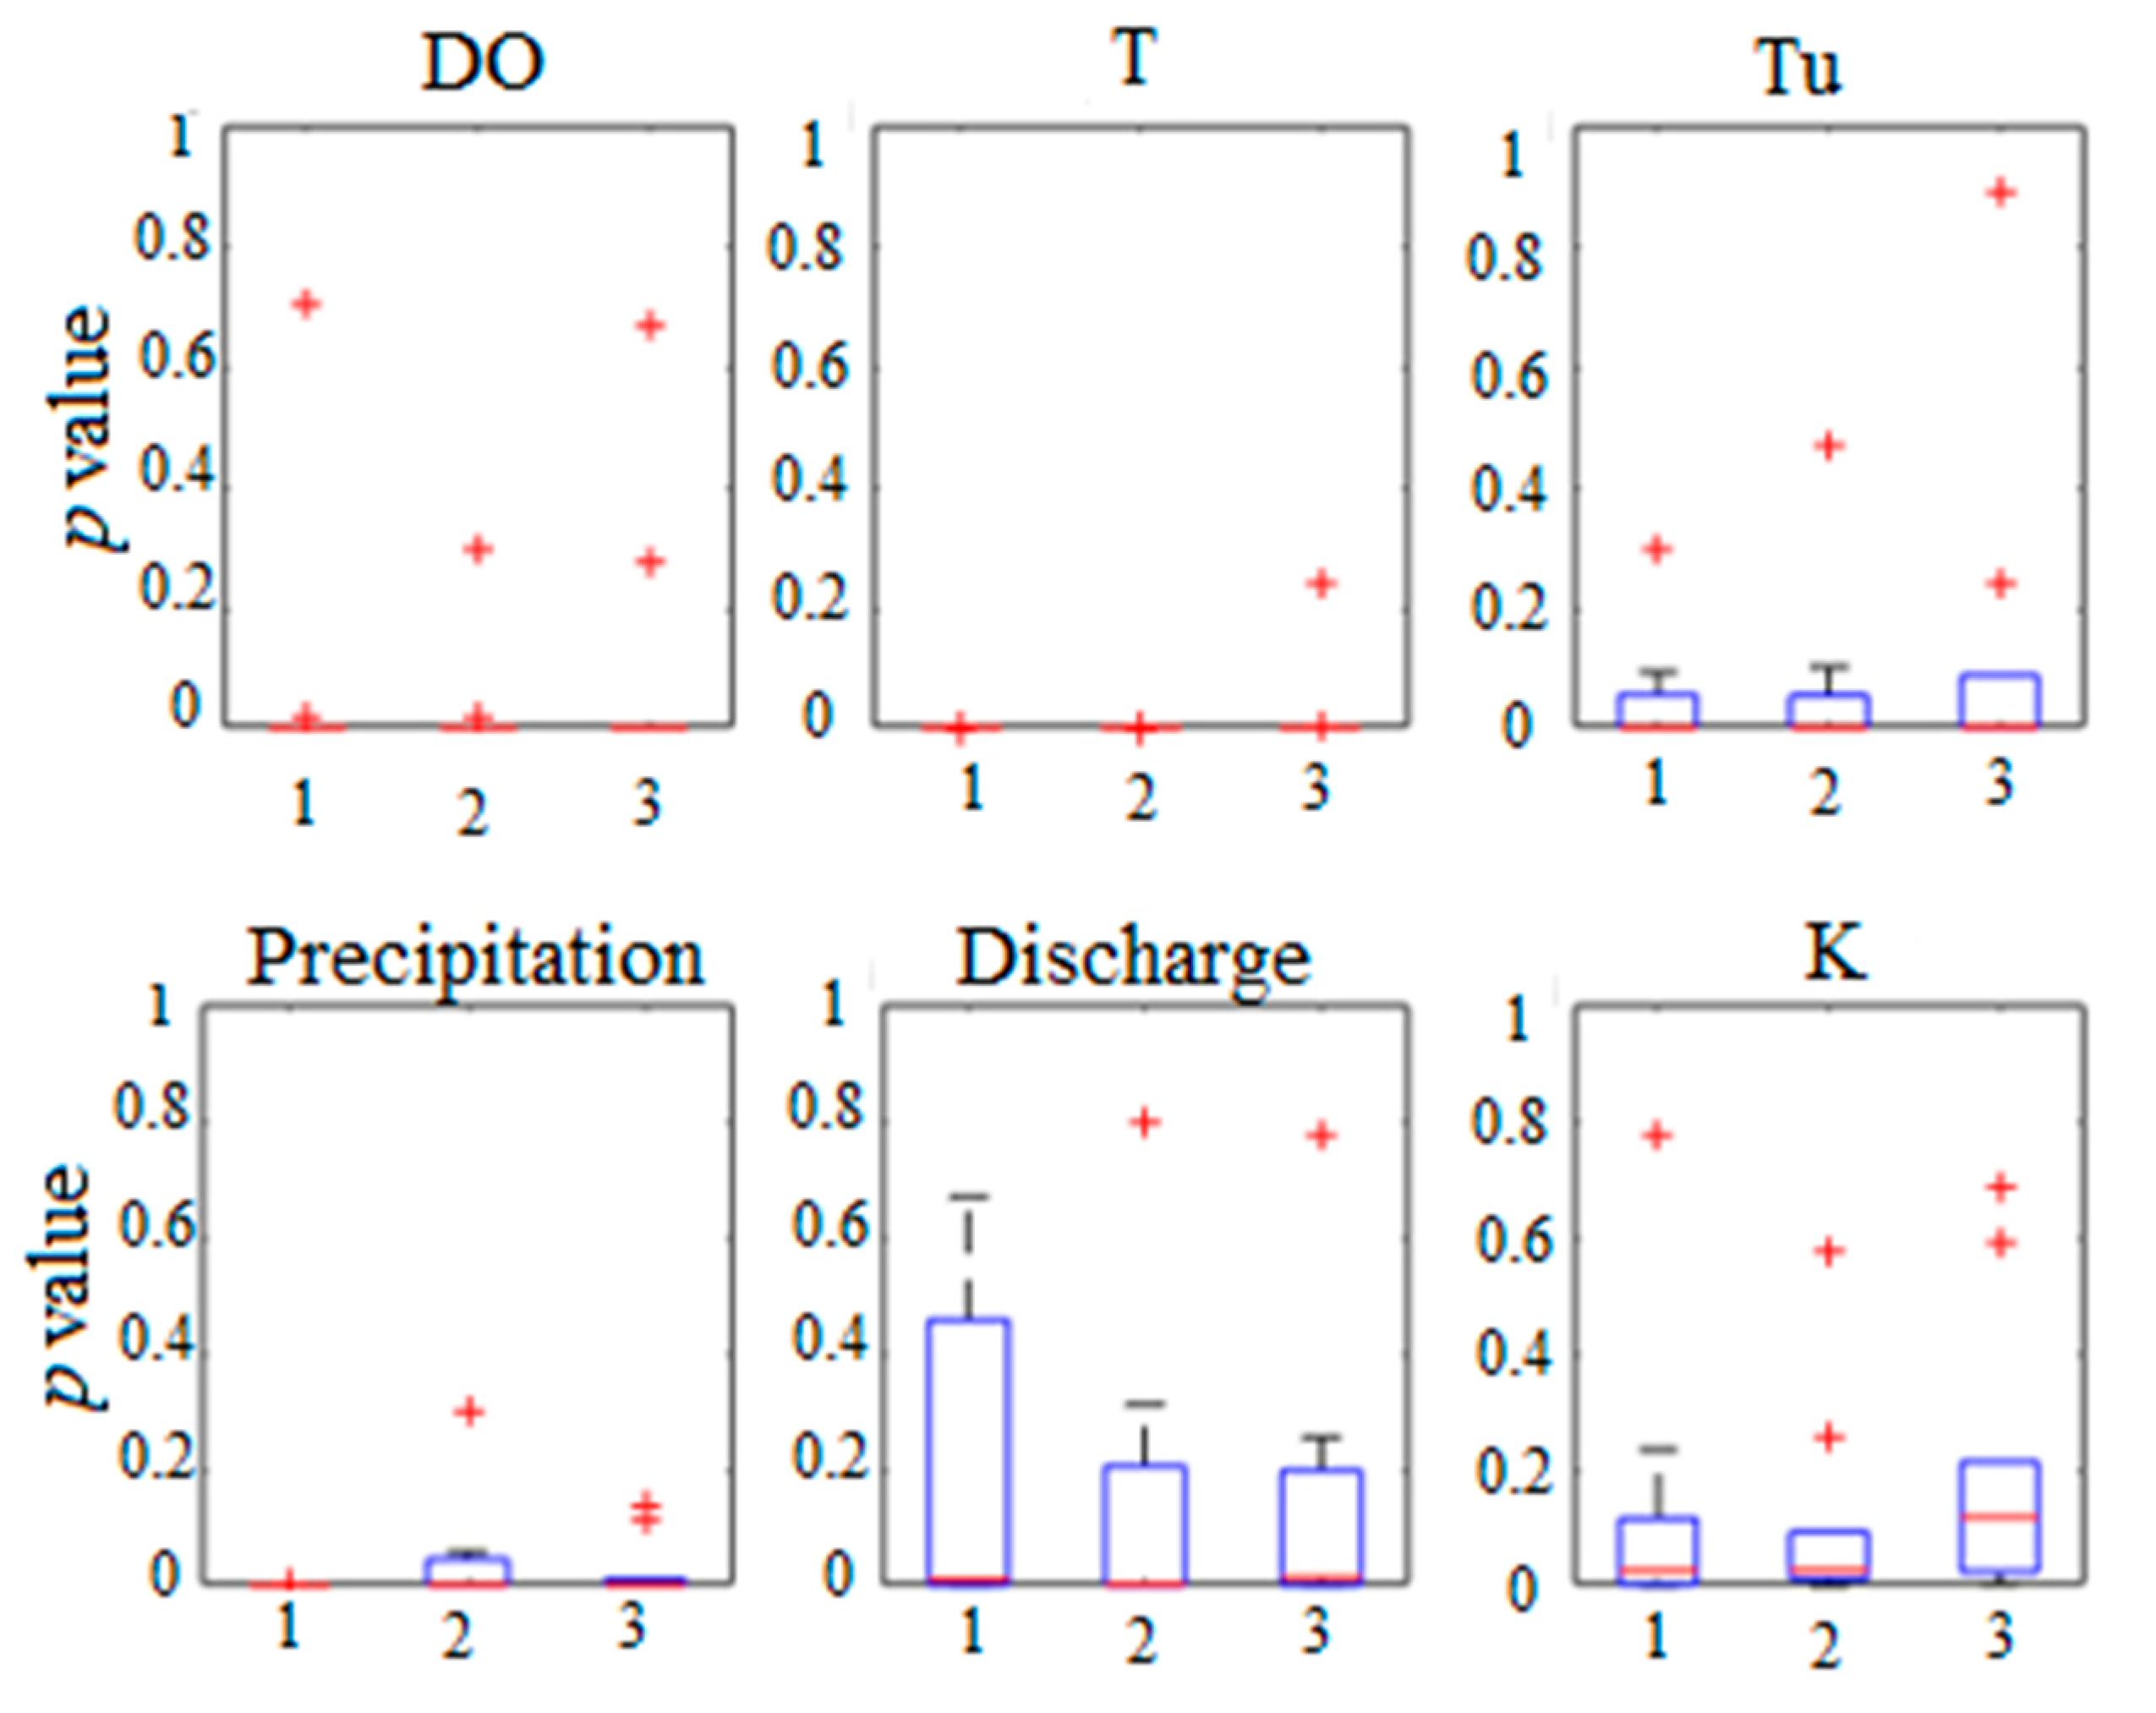
3.3. Granger Causality
4. Results
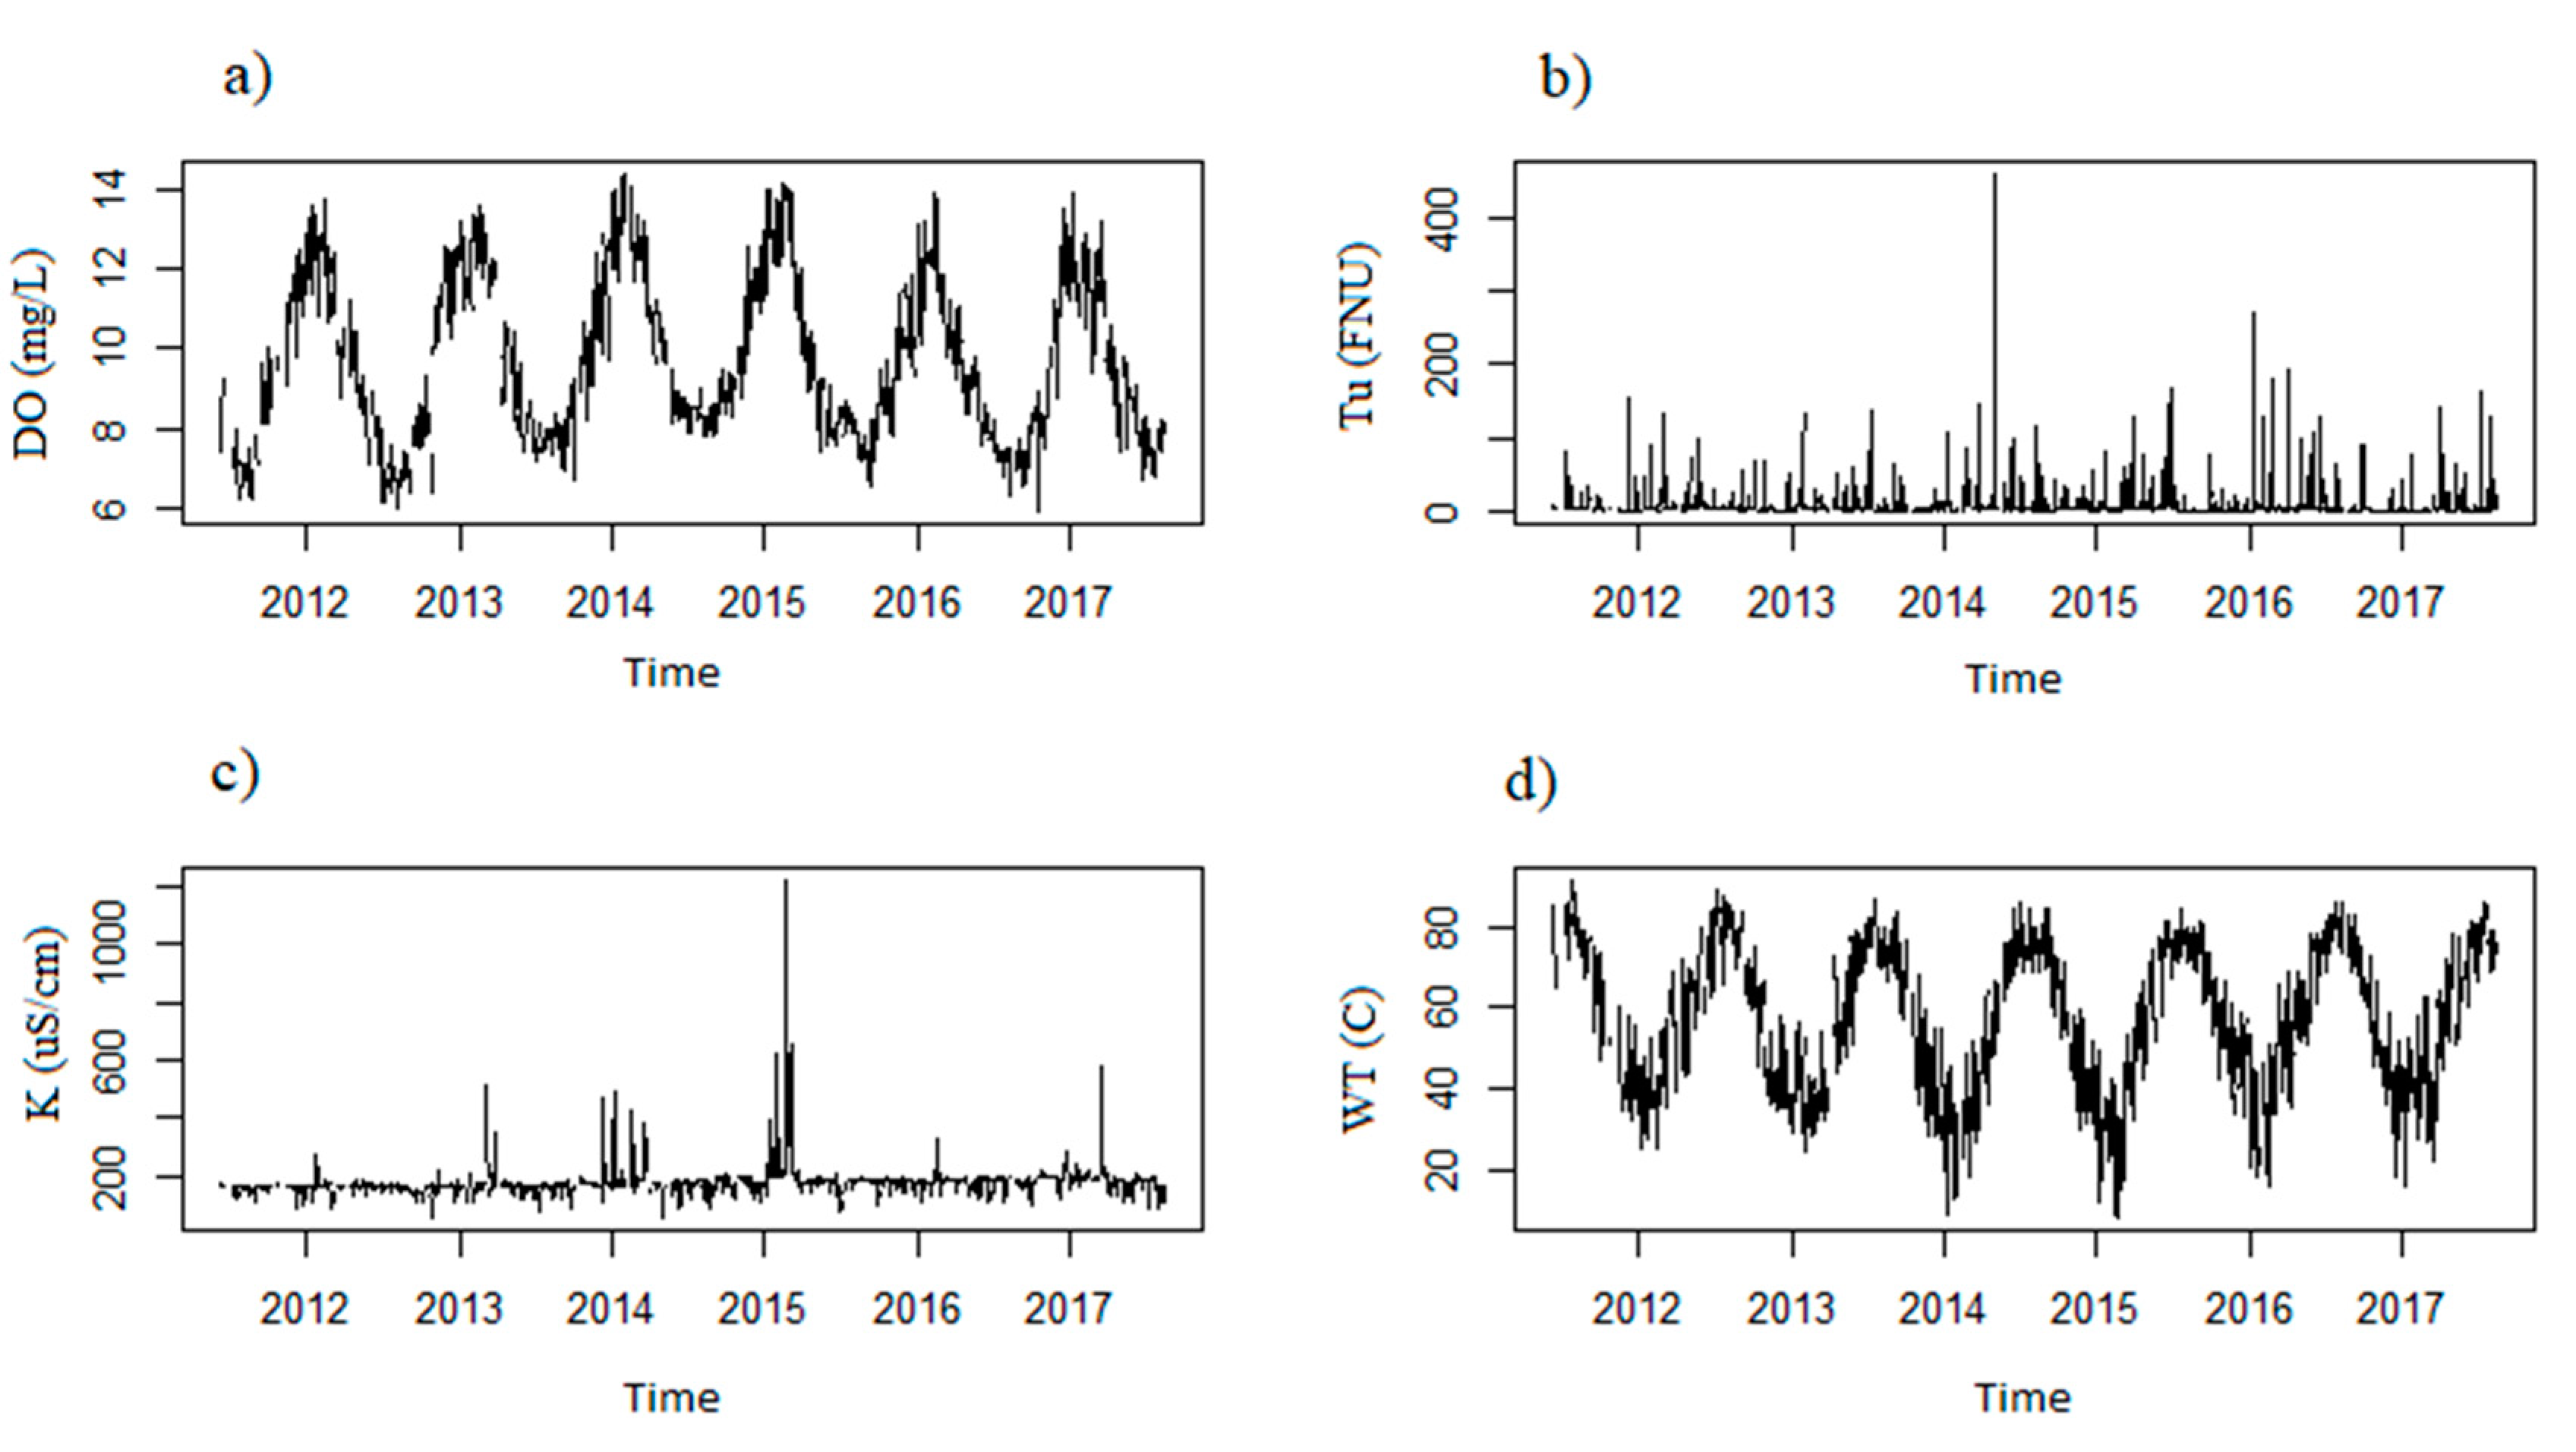
4.1. Pre-Processing
4.2. PCA
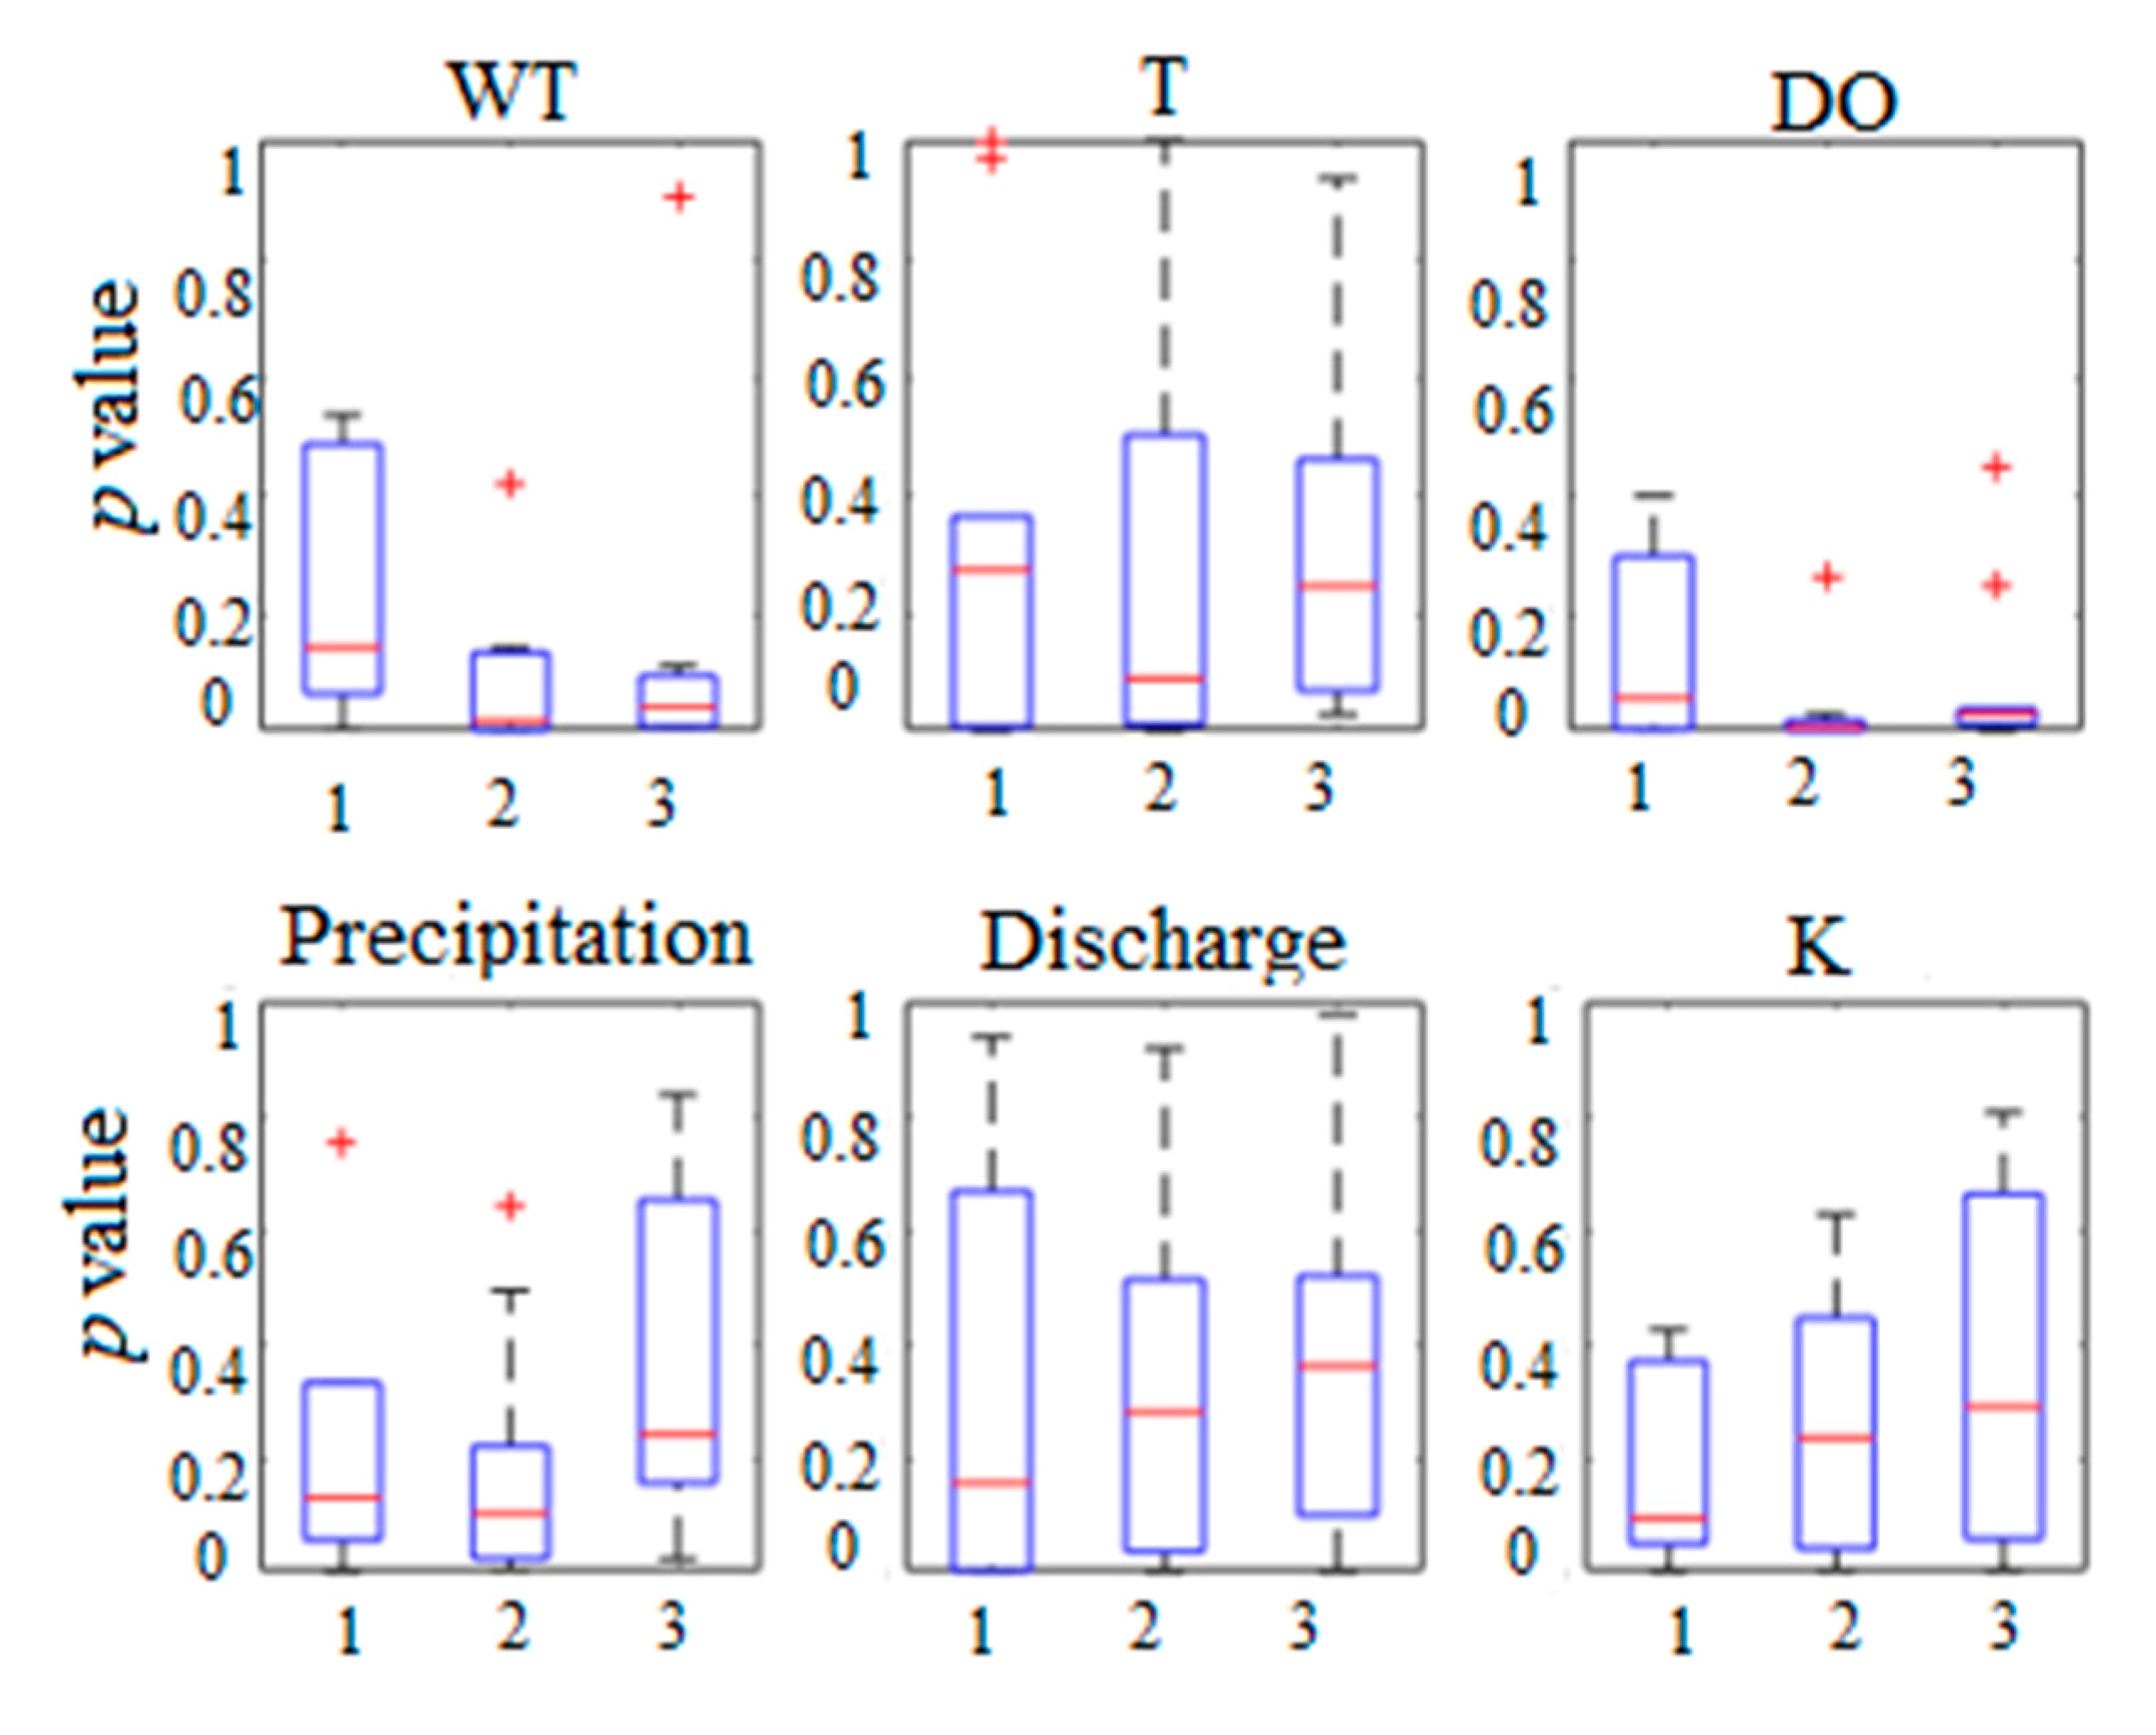
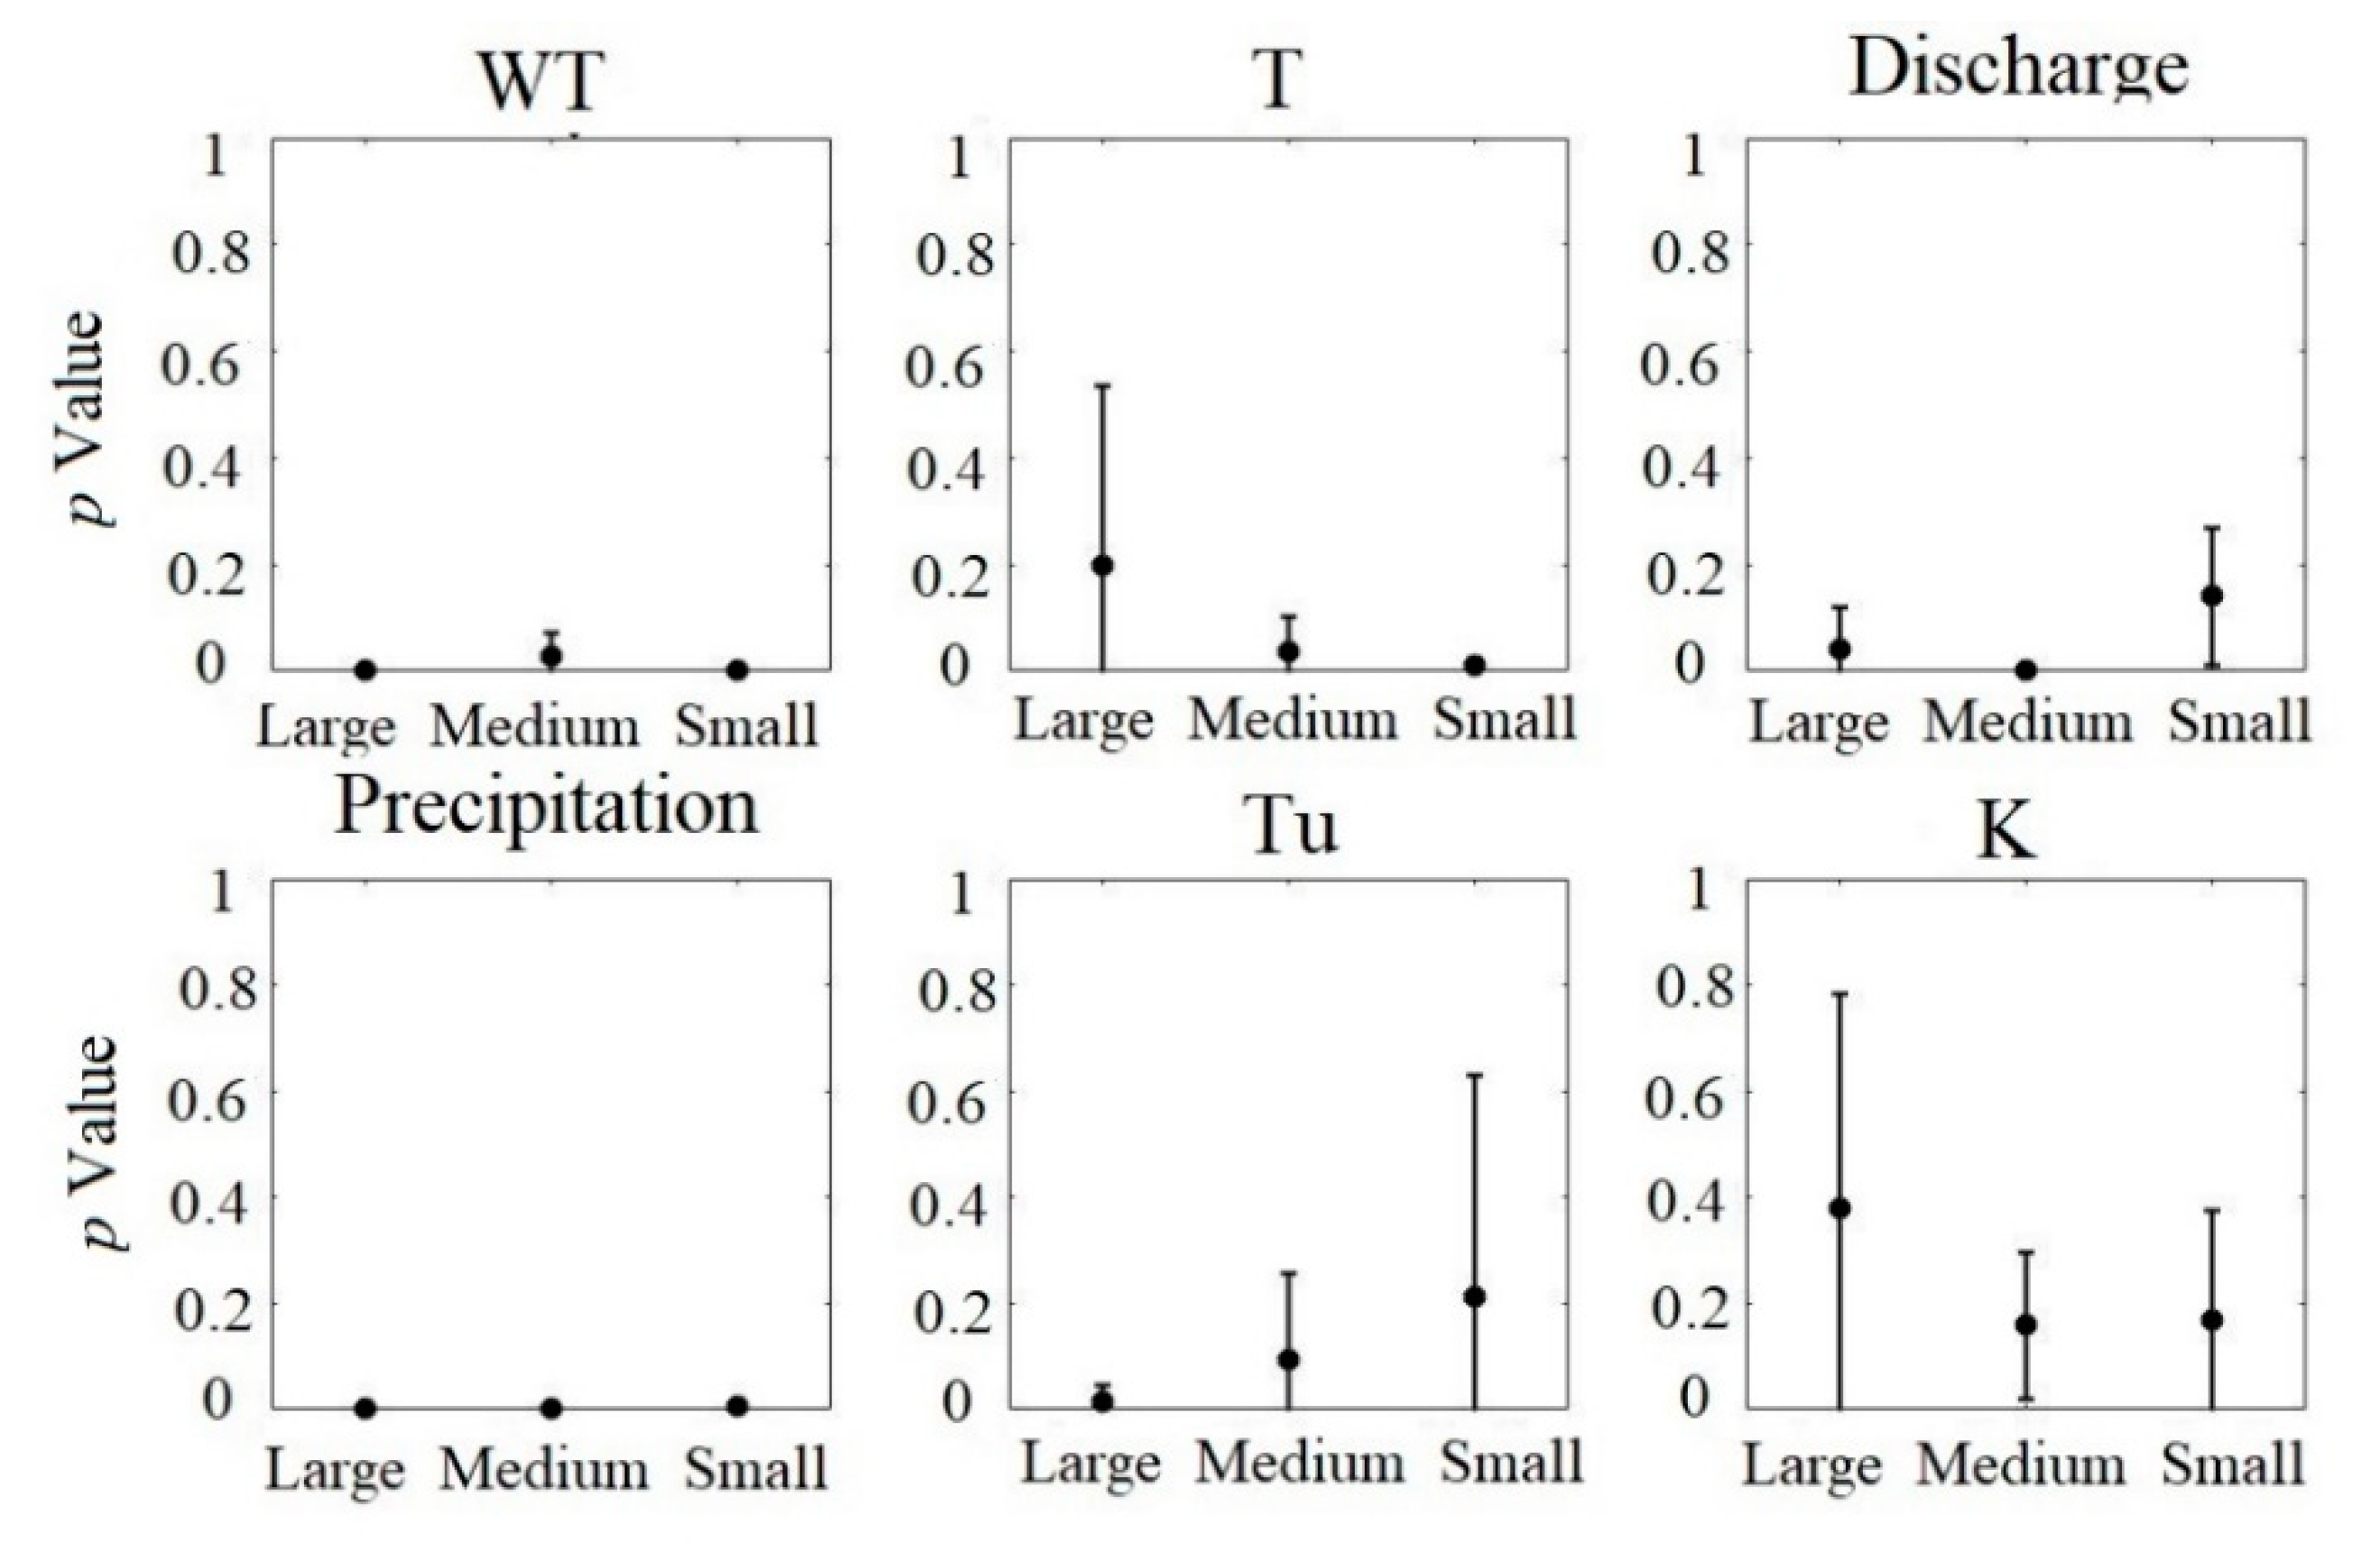
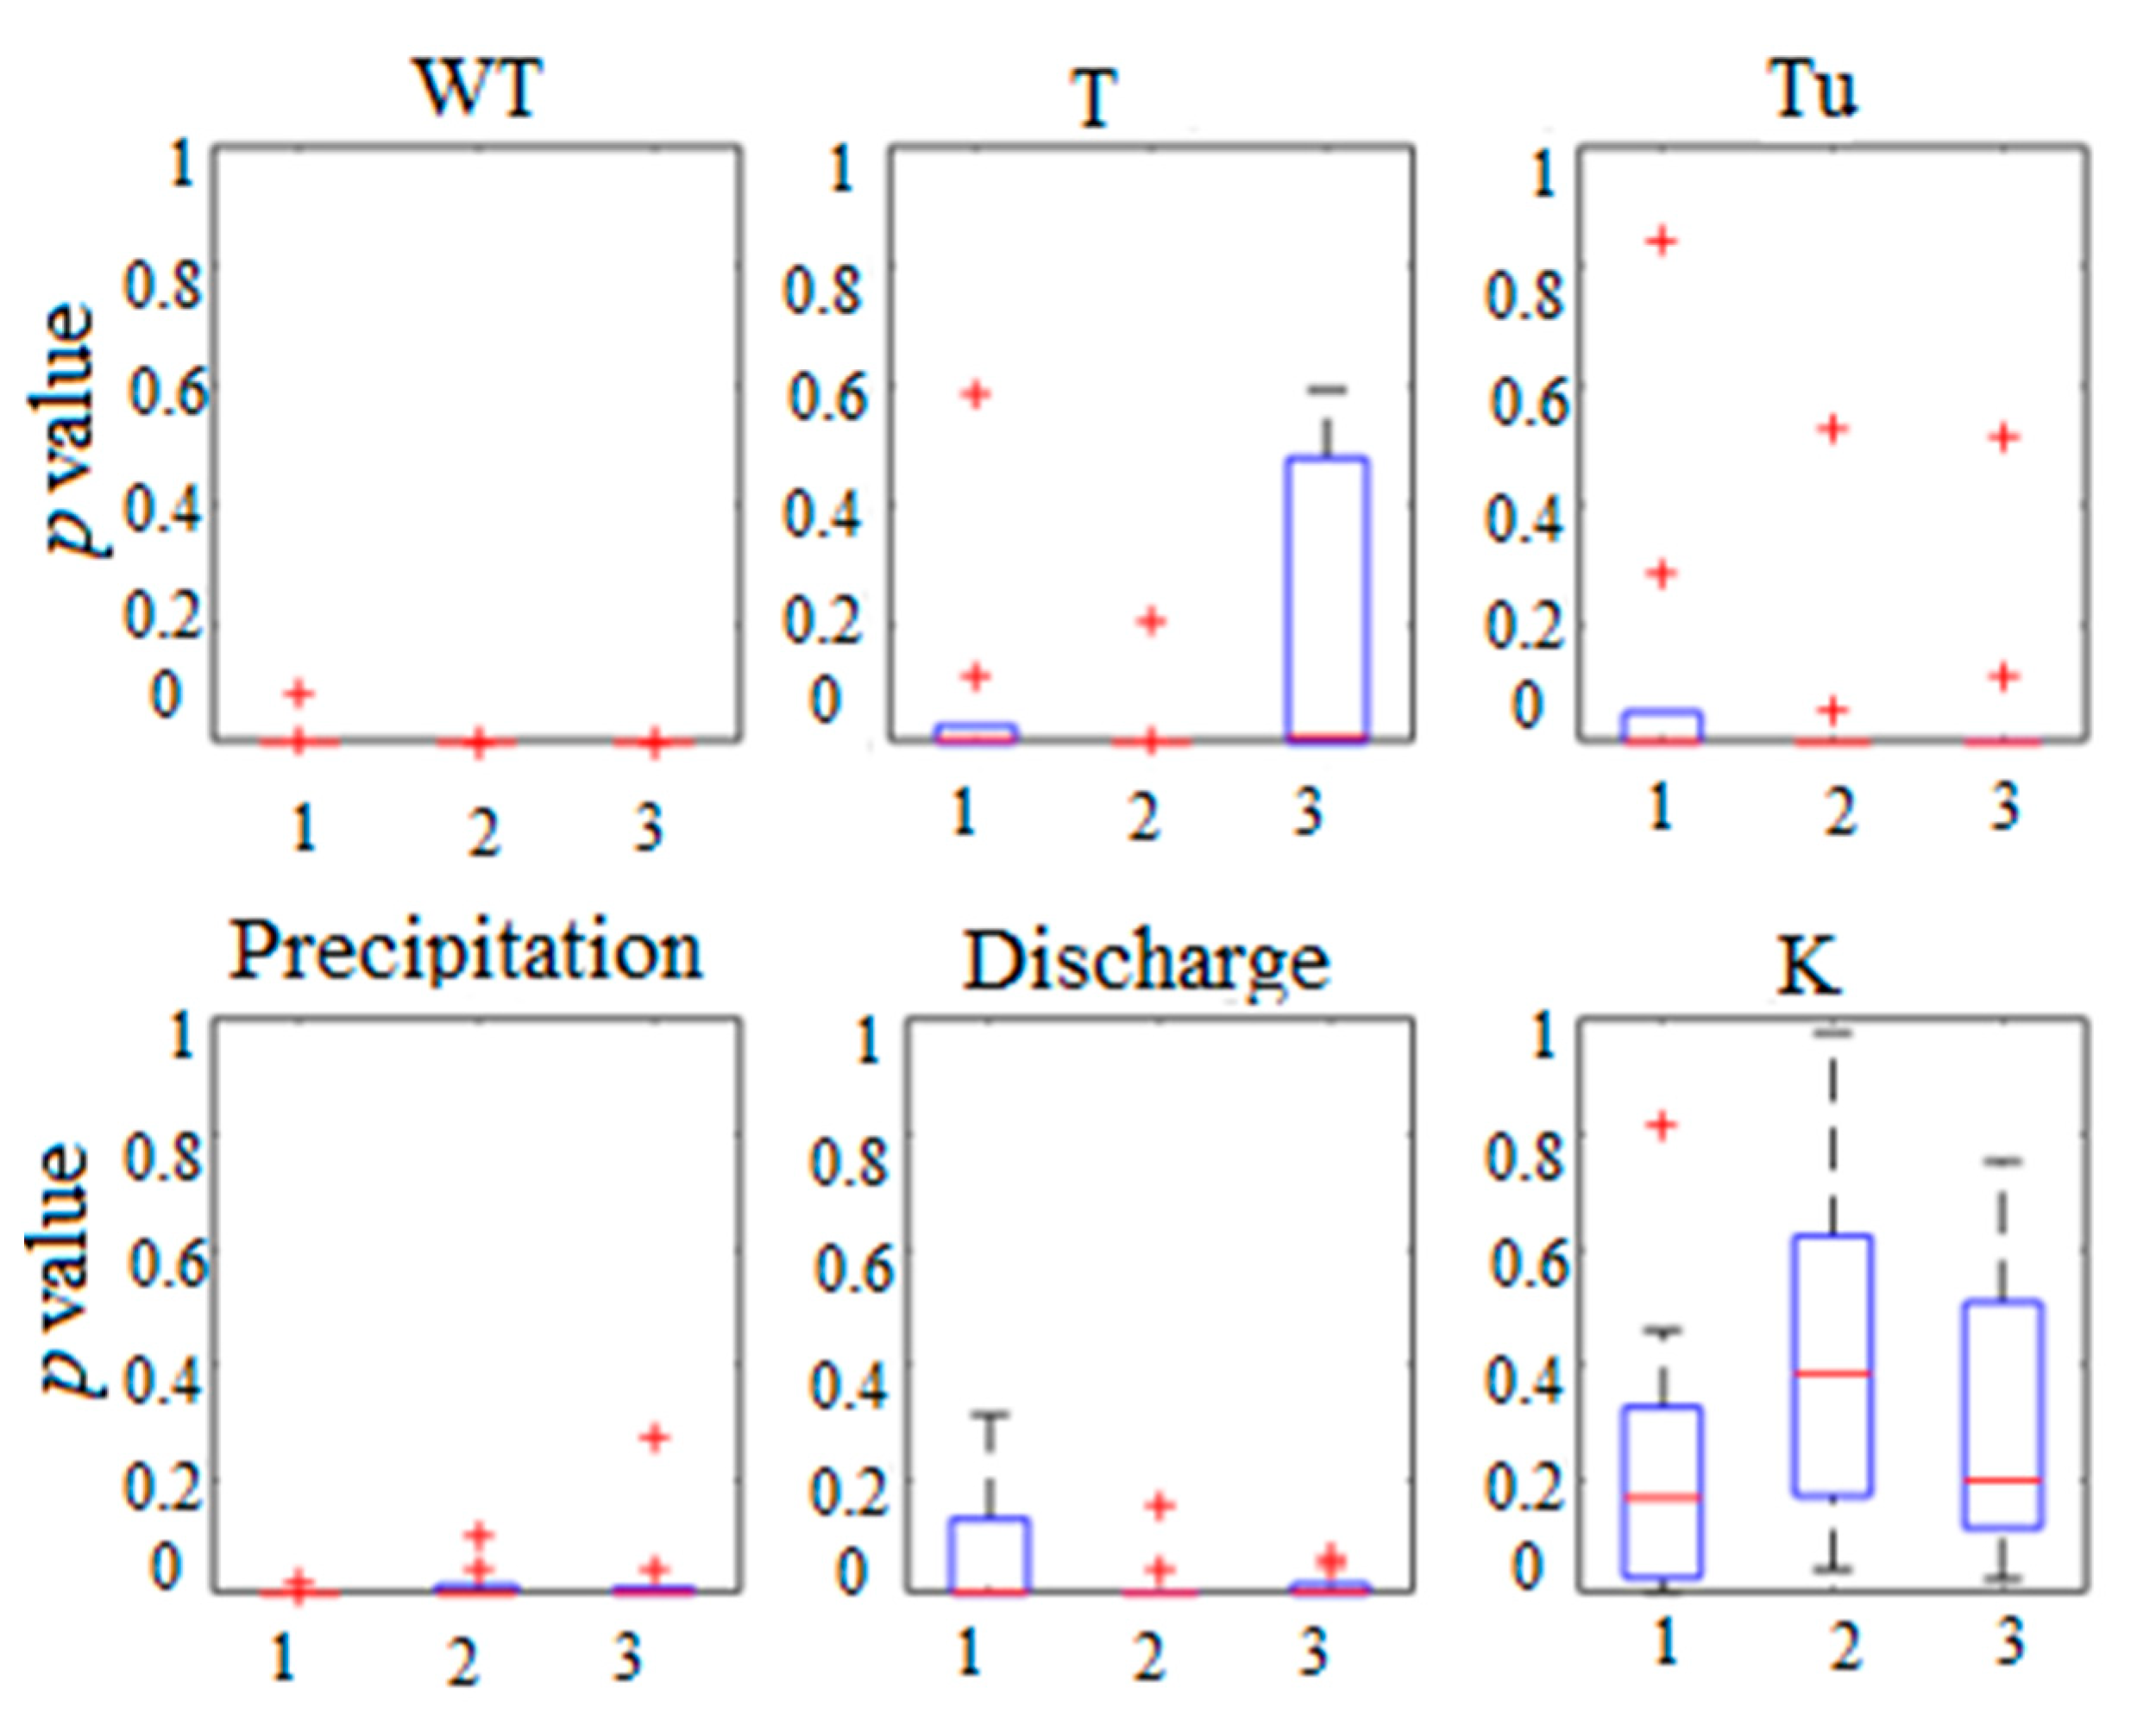
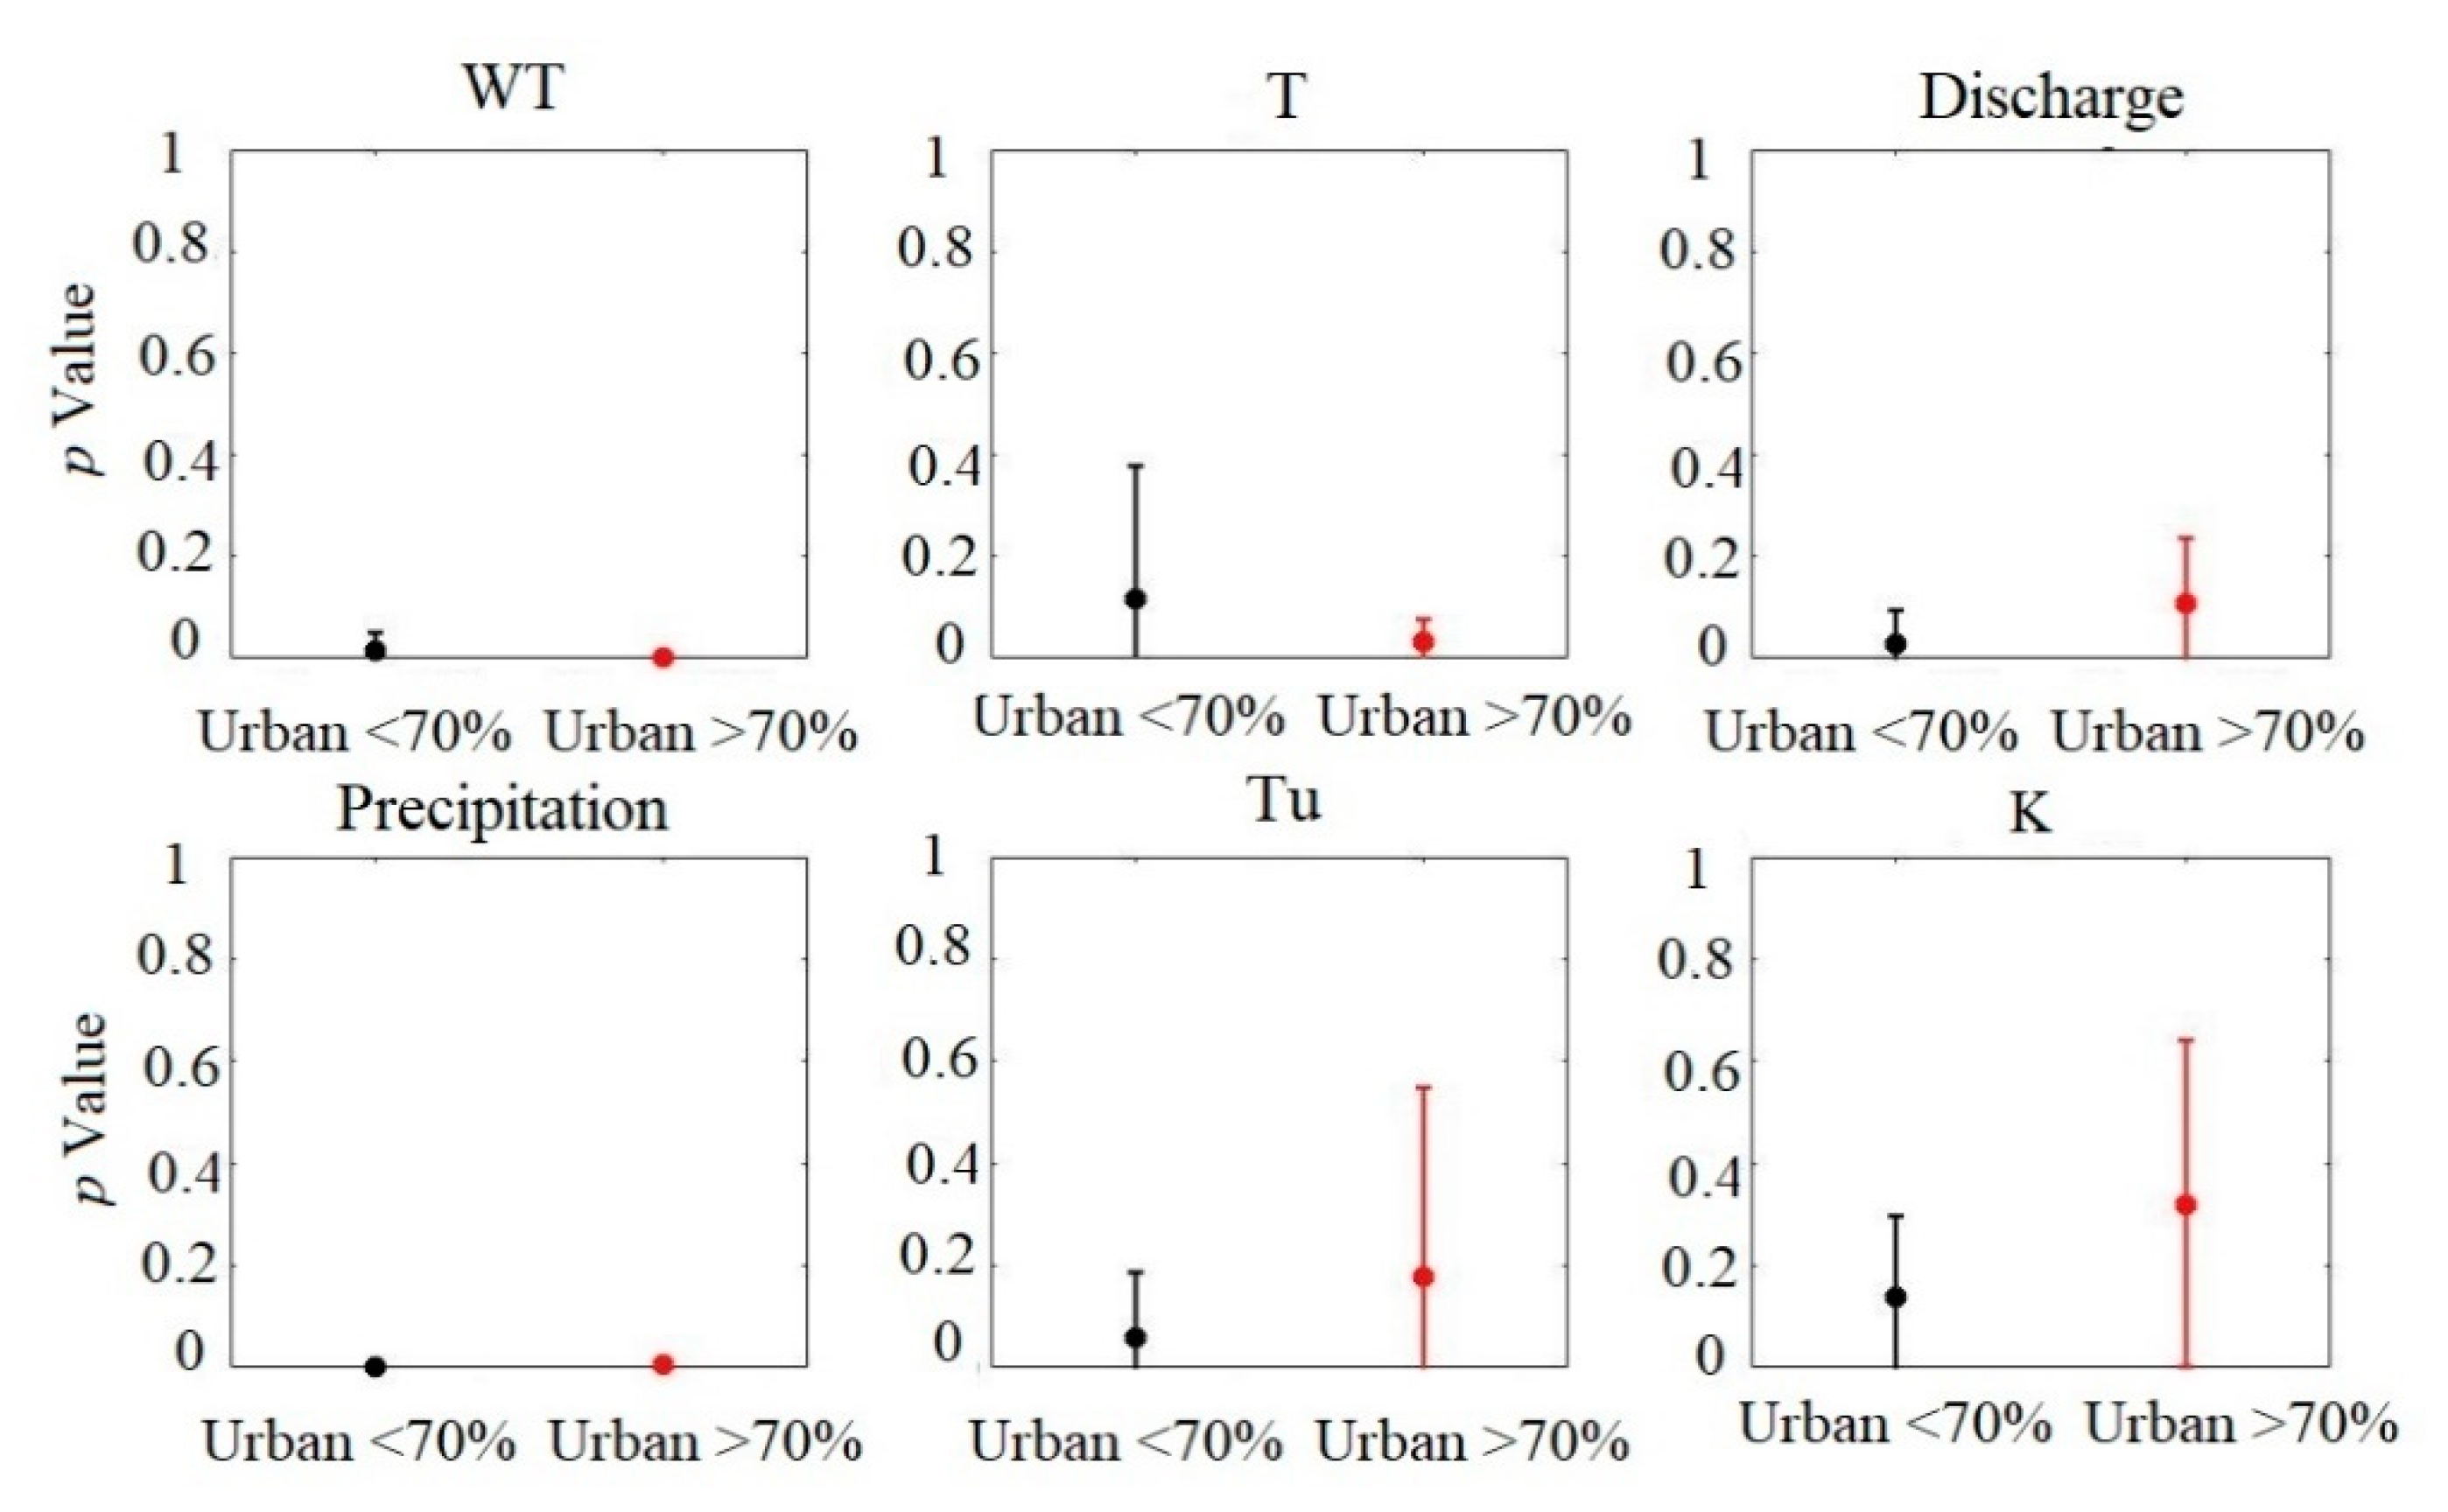
4.3. Granger Causality
5. Conclusions
Author Contributions
Funding
Institutional Review Board Statement
Informed Consent Statement
Data Availability Statement
Acknowledgments
Conflicts of Interest
References
- Surface Water Use, the USGS Water Science School. Available online: https://water.usgs.gov/edu/wusw.html (accessed on 9 May 2018).
- Wagner, R.J.; Boulger, R.W., Jr.; Oblinger, C.J.; Smith, B.A. Guidelines and Standard Procedures for Continuous Water-Quality Monitors: Station Operation, Record Computation, and Data Reporting; USGS Numbered Series 1-D3; 2006. Available online: http://pubs.er.usgs.gov/publication/tm1D3 (accessed on 1 June 2018).
- Hounslow, A. Water Quality Data: Analysis and Interpretation; Lewis Publishers: Boca Raton, FL, USA, 1995. [Google Scholar]
- Zavareh, M.; Maggioni, V. Application of Rough Set Theory to Water Quality Analysis: A Case Study. Data 2018, 3, 50. [Google Scholar] [CrossRef] [Green Version]
- USGS Water-Quality Data for the Nation. Available online: https://waterdata.usgs.gov/nwis/qw (accessed on 6 January 2020).
- Gorgoglione, A.; Castro, A.; Chreties, C.; Etcheverry, L. Overcoming Data Scarcity in Earth Science. Data 2020, 5, 5. [Google Scholar] [CrossRef] [Green Version]
- Longqin, X.; Shuangyin, L. Study of short-term water quality prediction model based on wavelet neural network. Math. Comput. Model. 2013, 58, 807–813. [Google Scholar]
- Grimnes, S.; Martinsen, Ø.G. Chapter 9—Data and Models. In Bioimpedance and Bioelectricity Basics, 3rd ed.; Grimnes, S., Martinsen, Ø.G., Eds.; Academic Press: Oxford, UK, 2015; pp. 329–404. [Google Scholar]
- Ou, M.; Liang, S.; Zhang, R.; Xiong, Q. Evaluation of water quality for the Beilun Gulf and Zhenzhu Bay by principal component analysis. In Proceedings of the 2017 International Conference on Advanced Mechatronic Systems (ICAMechS), Xiamen, China, 6–9 December 2017; pp. 324–328. [Google Scholar] [CrossRef]
- Subhrendu, G.; Gupta, A.D.; Nachabe, M.H. Evaluation of Ground Water Monitoring Network by Principal Component Analysis. Groundwater 2001, 39, 181–191. [Google Scholar] [CrossRef]
- Khound, N.J.; Bhattacharyya, K.G. Assessment of Water Quality in and around Jia-Bharali River Basin, North Brahmaputra Plain, India, Using Multivariate Statistical Technique. Appl. Water Sci. 2018, 8, 221. [Google Scholar] [CrossRef] [Green Version]
- Rao, N.S.; Sunitha, B.; Adimalla, N.; Chaudhary, M. Quality Criteria for Groundwater Use from a Rural Part of Wanaparthy District, Telangana State, India, through Ionic Spatial Distribution (ISD), Entropy Water Quality Index (EWQI) and Principal Component Analysis (PCA). Environ. Geochem. Health 2019. [Google Scholar] [CrossRef]
- Matiatos, I. Apostolos Alexopoulos, and Athanasios Godelitsas. Multivariate Statistical Analysis of the Hydrogeochemical and Isotopic Composition of the Groundwater Resources in Northeastern Peloponnesus (Greece). Sci. Total Environ. 2014, 476, 577–590. [Google Scholar] [CrossRef]
- Kamtchueng, B.T.; Fantong, W.Y.; Wirmvem, M.J.; Tiodjio, R.E.; Takounjou, A.F.; Ngoupayou, J.R.; Kusakabe, M.; Zhang, J.; Ohba, T.; Tanyileke, G.; et al. Hydrogeochemistry and Quality of Surface Water and Groundwater in the Vicinity of Lake Monoun, West Cameroon: Approach from Multivariate Statistical Analysis and Stable Isotopic Characterization. Environ. Monit. Assess. 2016, 188, 524. [Google Scholar] [CrossRef]
- Krishna, K.S.; Babu, S.H.; Rao, P.E.; Selvakumar, S.; Thivya, C.; Muralidharan, S.; Jeyabal, G. Evaluation of Water Quality and Hydrogeochemistry of Surface and Groundwater, Tiruvallur District, Tamil Nadu, India. Appl. Water Sci. 2017, 7, 2533–2544. [Google Scholar] [CrossRef] [Green Version]
- ticescu, C.; Georgescu, L.P.; Murariu, G.; Topa, C.; Timofti, M.; Pintilie, V.; Arseni, M.; Timofti, M. Lower Danube Water Quality Quantified through WQI and Multivariate Analysis. Water 2019, 11, 1305. [Google Scholar] [CrossRef] [Green Version]
- Villegas, P.; Paredes, V.; Betancur, T.; Ribeiro, L. Assessing the hydrochemistry of the Urabá Aquifer, Colombia by principal component analysis. J. Geochem. Explor. 2013, 134, 120–129. [Google Scholar] [CrossRef]
- Granger, C.W.J. Testing for causality: A personal viewpoint. J. Econ. Dyn. Control 1980, 2, 329–352. [Google Scholar] [CrossRef]
- Graf, R. Analysis of granger causality between daily and monthly temperatures of water and air, as illustrated with the example of noteć river. Acta Sci. Pol. Form. Circumiectus 2018, 17, 101–117. [Google Scholar] [CrossRef]
- Val, J.; Chinarro, D.; Pino, M.R.; Navarro, E. Global change impacts on river ecosystems: A high-resolution watershed study of Ebro river metabolism. Sci. Total Environ. 2016, 569–570, 774–783. [Google Scholar] [CrossRef] [PubMed]
- Sun, Y.; Li, J.; Liu, J.; Chow, C.; Sun, B.; Wang, R. Using causal discovery for feature selection in multivariate numerical time series. Mach. Learn. 2015, 101, 377–395. [Google Scholar] [CrossRef]
- Zelaya, A.J.; Parker, A.E.; Bailey, K.L.; Zhang, P.; Van Nostrand, J.; Ning, D.; Elias, D.A.; Zhou, J.; Hazen, T.C.; Arkin, A.P.; et al. High Spatiotemporal Variability of Bacterial Diversity over Short Time Scales with Unique Hydrochemical Associations within a Shallow Aquifer. Water Res. 2019, 164, 114917. [Google Scholar] [CrossRef] [PubMed]
- Salvucci, G.D.; Saleem, J.A.; Kaufmann, R. Investigating Soil Moisture Feedbacks on Precipitation with Tests of Granger Causality. Adv. Water Resour. 2002, 25, 1305–1312. [Google Scholar] [CrossRef]
- Kneebone, E. The Changing Geography of US Poverty. Brookings 2017. Available online: https://www.brookings.edu/testimonies/the-changing-geography-of-us-poverty/ (accessed on 29 January 2020).
- Resiliency Planning|Northern Virginia Regional Commission—Website. Available online: https://www.novaregion.org/1354/Resiliency-Planning (accessed on 28 January 2020).
- Zhang, Q.; Murphy, R.R.; Tian, R.; Forsyth, M.K.; Trentacoste, E.M.; Keisman, J.; Tango, P.J. Chesapeake Bay’s Water Quality Condition Has Been Recovering: Insights from a Multimetric Indicator Assessment of Thirty Years of Tidal Monitoring Data. Sci. Total Environ. 2018, 637, 1617–1625. [Google Scholar] [CrossRef]
- Zhang, Q.; Hirsch, R.M.; Ball, W.P. Long-Term Changes in Sediment and Nutrient Delivery from Conowingo Dam to Chesapeake Bay: Effects of Reservoir Sedimentation. Environ. Sci. Technol. 2016, 50, 1877–1886. [Google Scholar] [CrossRef]
- Earthdata. Available online: https://earthdata.nasa.gov// (accessed on 26 January 2021).
- Lepot, M.; Aubin, J.-B.; Clemens, F.H.L.R. Interpolation in Time Series: An Introductive Overview of Existing Methods, Their Performance Criteria and Uncertainty Assessment. Water 2017, 9, 796. [Google Scholar] [CrossRef] [Green Version]
- Tolstov, G.P. Fourier Series; Courier Corporation: Mineola, NY, USA, 2012. [Google Scholar]
- Cromwell, J.B. (Ed.) Multivariate Tests for Time Series Models; Sage Publications: Thousand Oaks, CA, USA, 1994. [Google Scholar]
- Nugroho, A.; Simanjuntak, B.H. ARMA (Autoregressive Moving Average) Model for Prediction of Rainfall in Regency of Semarang—Central Java—Republic of Indonesia. Int. J. Comput. Sci. Issues (IJCSI) 2014, 11, 27–32. [Google Scholar]
- Everitt, B.; Hothorn, T. Principal Components Analysis. In An Introduction to Applied Multivariate Analysis with R; Everitt, B., Hothorn, T., Eds.; Springer: New York, NY, USA, 2011; pp. 61–103. [Google Scholar]
- Jolliffe, I. Principal Component Analysis. In Wiley StatsRef: Statistics Reference Online; American Cancer Society: Hoboken, NJ, USA, 2014. [Google Scholar]
- Granger, C.W.J. Investigating Causal Relations by Econometric Models and Cross-spectral Methods. Econometrica 1969, 37, 424–438. [Google Scholar] [CrossRef]
- Kirchgässner, G.; Wolters, J.; Hassler, U. Introduction to Modern Time Series Analysis, 2nd ed.; Springer: Berlin/Heidelberg, Germany, 2013. [Google Scholar]


| Variable | Source | Description and Unit |
|---|---|---|
| Date | USGS | 2010 to 2019 |
| Land Use | NLCD 1 2011 | Classified as land, open water, developed, barren, forest, shrubland, herbaceous, planted/cultivated, wetlands |
| Soil type | USDA (gSSURGO 2016) 2 | Type A: High Infiltration and A/D—High/Very Slow Infiltration Type B Moderate Infiltration and B/D—Medium/Very Slow Infiltration Type C: Slow Infiltration and C/D—Medium/Very Slow Infiltration Type D: Very Slow Infiltration |
| Discharge | USGS | Average daily discharge from a watershed at exit point in cubic feet per second |
| Air Temperature (T) | USGS | Average daily air temperature in degree Celsius |
| Water Temperature (WT) | USGS | Average daily water temperature in degree Celsius |
| Precipitation | NLDAS 3-2 | Average daily precipitation |
| Specific Conductivity (K) | USGS | Average daily specific conductivity in microsiemens per centimeter at 25 degrees Celsius |
| Dissolved Oxygen (DO) | USGS | Average daily Dissolved oxygen concentration in milligram per liter |
| Turbidity (Tu) | USGS | Average daily turbidity in Nephelometric Unit (NTU) |
| 1 | 2 | 3 | 4 | 5 | 6 | 7 | 8 | 9 | 10 | |
|---|---|---|---|---|---|---|---|---|---|---|
| Open Water | 0.3 | 0.4 | 0 | 0.1 | 0 | 0 | 0 | 0.1 | 0 | 0 |
| Developed | 69.2 | 53.5 | 74.2 | 7.9 | 61.1 | 87.8 | 85.4 | 86.0 | 70.6 | 44 |
| Barren | 0.2 | 0 | 0 | 0 | 0 | 0 | 0 | 0 | 0 | 0.2 |
| Forest | 20.9 | 38.9 | 22.8 | 77.6 | 29.1 | 11.7 | 14.3 | 11.6 | 27.1 | 51 |
| Shrubland | 0.9 | 0.9 | 0.2 | 5.2 | 0.9 | 0.3 | 0.2 | 0.4 | 0.1 | 0.7 |
| Herbaceous | 0.1 | 0.1 | 0 | 0.3 | 0.2 | 0 | 0 | 0.5 | 0 | 0.1 |
| Planted-Cultivated | 6.5 | 1.8 | 0.2 | 1.9 | 5.9 | 0 | 0 | 0.4 | 0 | 0 |
| Wetlands | 1.8 | 4.3 | 2.7 | 6.8 | 2.7 | 0.1 | 0.1 | 0.9 | 2.3 | 3.8 |
| Soil Type A | 0.7 | 2.9 | 1.2 | 0 | 1.0 | 0 | 0 | 0 | 0.7 | 4.0 |
| Soil Type B | 73.6 | 29.9 | 18.1 | 99.8 | 76.2 | 81.2 | 6.0 | 4.3 | 20.5 | 29.4 |
| Soil Type C | 16.0 | 66.7 | 80.7 | 0.2 | 14.5 | 11.1 | 93.6 | 89.7 | 78.9 | 66.5 |
| Soil Type D | 9.8 | 0.5 | 0.1 | 0 | 8.3 | 7.7 | 0.3 | 6.0 | 0 | 0 |
| Watershed | Principal Component | Tu | Precipitation | Discharge | K | DO | T | WT |
|---|---|---|---|---|---|---|---|---|
| 1 | PCOM 1 | 0.61 | 0.46 | 0.64 | −0.31 | −0.55 | 0.55 | 0.55 |
| PCOM 2 | 0.17 | −0.5 | 0.14 | −0.8 | 0.12 | −0.14 | −0.13 | |
| 2 | PCOM 1 | 0.14 | 0.12 | 0.64 | −0.32 | −0.54 | 0.53 | 0.53 |
| PCOM 2 | 0.62 | 0.41 | 0.25 | −0.38 | −0.15 | 0.18 | −0.11 | |
| 3 | PCOM 1 | 0.33 | 0.1 | 0.29 | −0.25 | −0.46 | 0.52 | 0.5 |
| PCOM 2 | 0.58 | 0.34 | 0.6 | 0.12 | 0.21 | −0.24 | −0.29 | |
| 4 | PCOM 1 | 0.14 | 0.15 | 0.65 | −0.44 | −0.54 | 0.56 | 0.59 |
| PCOM 2 | 0.43 | 0.4 | 0.11 | 0.69 | 0.19 | −0.22 | −0.24 | |
| PCOM 3 | 0.61 | −0.88 | 0.14 | −0.24 | −0.21 | 0.12 | 0.76 | |
| 5 | PCOM 1 | 0.65 | 0.36 | 0.67 | −0.32 | −0.55 | 0.54 | 0.55 |
| PCOM 2 | 0.27 | −0.82 | 0.2 | −0.44 | −0.16 | 0.17 | 0.19 | |
| 6 | PCOM 1 | 0.65 | 0.38 | 0.65 | −0.35 | −0.54 | 0.54 | 0.54 |
| PCOM 2 | 0.29 | −0.92 | 0.26 | 0.93 | −0.17 | 0.21 | 0.22 | |
| 7 | PCOM 1 | 0.18 | 0.29 | 0.15 | −0.21 | −0.54 | 0.55 | 0.55 |
| PCOM 2 | 0.65 | −0.73 | 0.65 | −0.62 | 0.12 | −0.14 | −0.16 | |
| 8 | PCOM 1 | −0.14 | −0.39 | −0.65 | 0.23 | 0.51 | −0.57 | −0.58 |
| PCOM 2 | −0.62 | −0.44 | 0.18 | 0.8 | −0.13 | 0.52 | 0.13 | |
| 9 | PCOM 1 | 0.14 | 0.32 | 0.66 | −0.22 | −0.55 | 0.55 | 0.56 |
| PCOM 2 | 0.65 | −0.53 | 0.25 | −0.81 | 0.12 | −0.53 | −0.12 | |
| 10 | PCOM 1 | 0.65 | 0.31 | 0.66 | −0.22 | −0.55 | 0.55 | 0.58 |
| PCOM 2 | 0.25 | −0.68 | 0.27 | −0.17 | −0.68 | −0.64 | −0.8 |
Publisher’s Note: MDPI stays neutral with regard to jurisdictional claims in published maps and institutional affiliations. |
© 2021 by the authors. Licensee MDPI, Basel, Switzerland. This article is an open access article distributed under the terms and conditions of the Creative Commons Attribution (CC BY) license (http://creativecommons.org/licenses/by/4.0/).
Share and Cite
Zavareh, M.; Maggioni, V.; Sokolov, V. Investigating Water Quality Data Using Principal Component Analysis and Granger Causality. Water 2021, 13, 343. https://doi.org/10.3390/w13030343
Zavareh M, Maggioni V, Sokolov V. Investigating Water Quality Data Using Principal Component Analysis and Granger Causality. Water. 2021; 13(3):343. https://doi.org/10.3390/w13030343
Chicago/Turabian StyleZavareh, Maryam, Viviana Maggioni, and Vadim Sokolov. 2021. "Investigating Water Quality Data Using Principal Component Analysis and Granger Causality" Water 13, no. 3: 343. https://doi.org/10.3390/w13030343
APA StyleZavareh, M., Maggioni, V., & Sokolov, V. (2021). Investigating Water Quality Data Using Principal Component Analysis and Granger Causality. Water, 13(3), 343. https://doi.org/10.3390/w13030343