1. Introduction
Globally, approximately 90,000 km
2 of surface water area disappeared and 184,000 km
2 area of water surfaces formed between 1984 and 2015 [
1]. The changes have been attributed to both climate change and human activities, such as natural drying, river diversion, reservoir filling, damming, and unregulated withdrawal [
2,
3,
4,
5]. Changes in water surface area can affect surface hydrological connectivity and, in turn, the transport of water-mediated matter, energy, and organisms within or between hydrological cycle elements. In order to maintain the ecological integrity and functions of surface water systems, it is necessary to conduct cost-effective and efficient monitoring and evaluation of the hydrological connectivity of these systems. However, due to the lack of appropriate methods and indicators, it is still a challenge to quantitatively assess the hydrological connectivity of a landscape composed of multiple lakes of different sizes and depths.
Satellite remote sensing has been used as a tool for the acquisition of timely and repetitive information on surface water bodies at large scales, which provides data for assessing surface hydrological connectivity. For instance, optical images from Landsat and Moderate Resolution Imaging Spectrometer (MODIS) or their fusions have been successfully used to quantify the hydrological connectivity among rivers, floodplains, and lakes [
6,
7,
8,
9]. In recent years, some big data exploration and information extraction techniques (i.e., the “expert systems” [
10,
11], “visual analytics” [
1], and “evidential reasoning” [
12]) were developed to accurately extract global surface water bodies from Landsat images. The resulting free-access dataset (i.e., the monthly water history dataset from the Joint Research Centre of the European Commission, hereinafter referred to as the JRC Monthly Water History dataset) is available in Google Earth Engine. However, few attempts have been made to use this dataset to quantify surface hydrological connectivity.
In addition to data, surface hydrological connectivity assessment must be supported by an indicator or a set of indicators [
13]. These indicators can be timing, frequency, surface water extent, flow path, etc. [
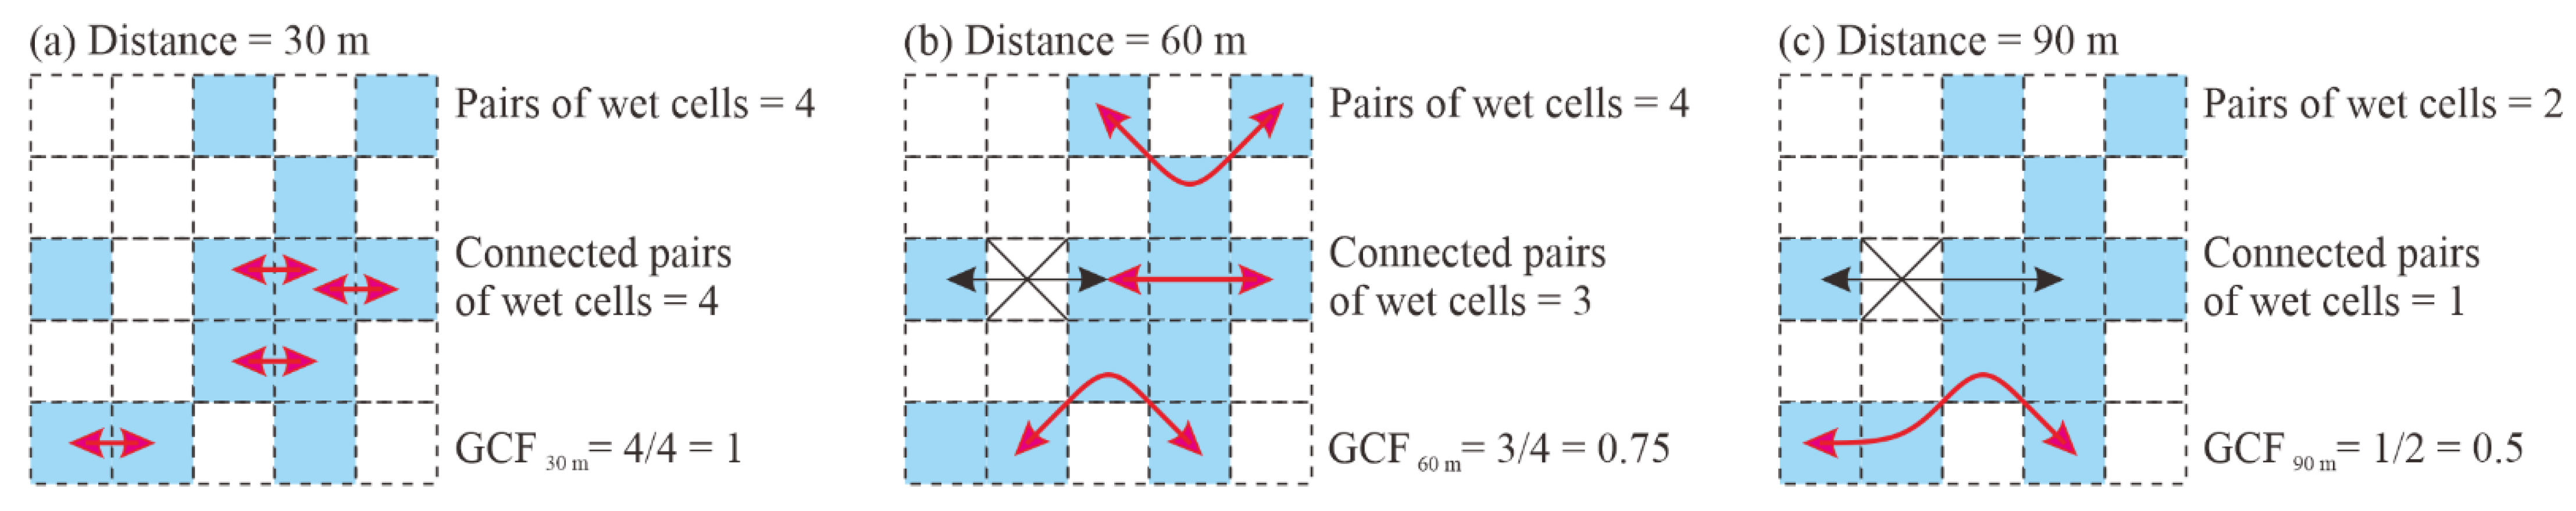
14]. In the recent decade, a set of new indicators was developed through assessing remote sensing data with geostatistical methods. These include the geostatistical connectivity function (GCF) [
6] and maximum distance of connection (MDC). Several studies [
6,
7,
8,
9] have applied the GCF and MDC to quantify surface hydrological connectivity among rivers, floodplains, and lakes under the influence of flood pulses. However, there is a significant knowledge gap regarding the combined impact of artificial replenishment water and flooding on GCF and MDC.
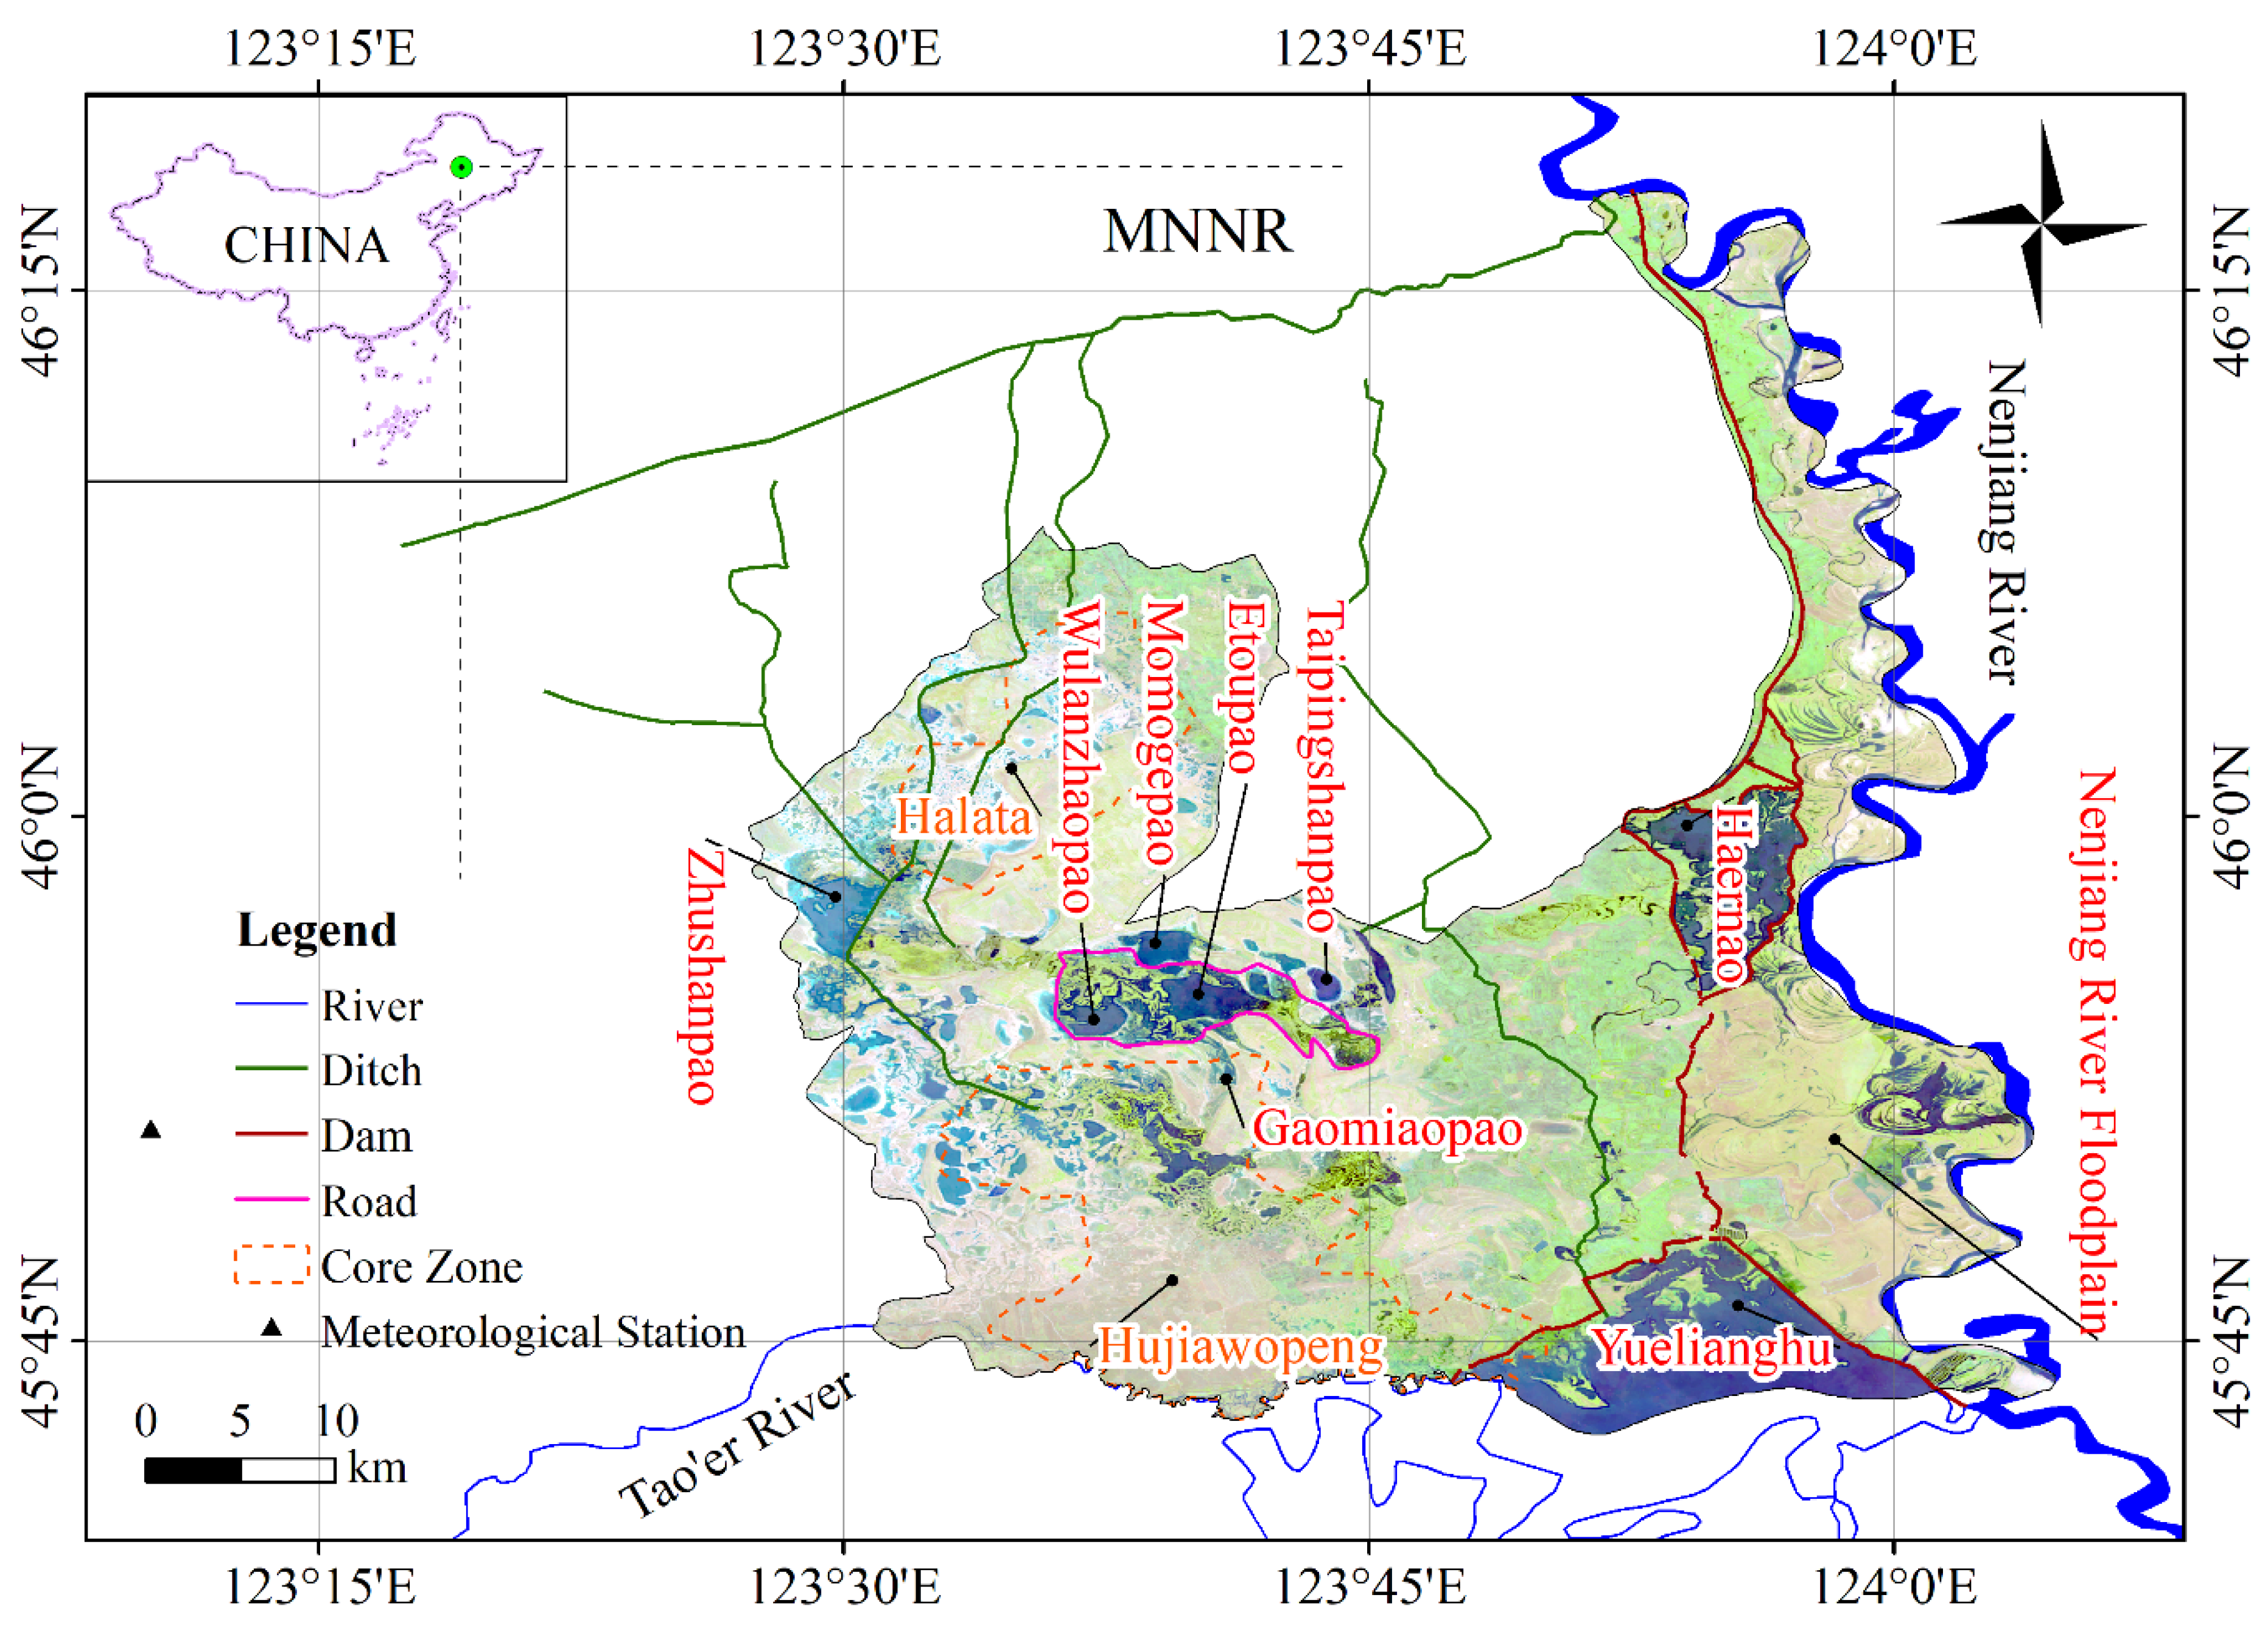
To address this knowledge gap, we combined the JRC Monthly Water History data and geostatistical approach to analyze the dynamics of surface hydrological connectivity of a multi-lake system during a dry, a normal, and a wet year. We took China’s Momoge National Nature Reserve (a Ramsar site) as a case study because it broadly represents the widespread landscape with relatively shallow lakes fed by rivers and manmade canals. Specifically, this study aimed to (1) analyze changing trends in the geostatistical connectivity function and maximum distance of connection along the west–east (W–E) and north–south (N–S) directions during different hydrological years, (2) identify the spatiotemporal distribution and connection process of seasonal connected water bodies during different hydrological years, and (3) quantify the variation in surface water extent of the top 10 largest connectomes during different hydrological years. In our previous paper [
15], we used Sentinel-1 synthetic aperture radar (SAR) data and a geostatistical analysis approach to quantitatively evaluate surface hydrological connectivity dynamics over five normal years in the same study area. Therefore, the results of the current manuscript can be regarded as a supplement to the previous paper. Since the study area undergoes a dry–wet transition every 10 years, the current manuscript is more important for water resource management in the study area.
4. Discussion
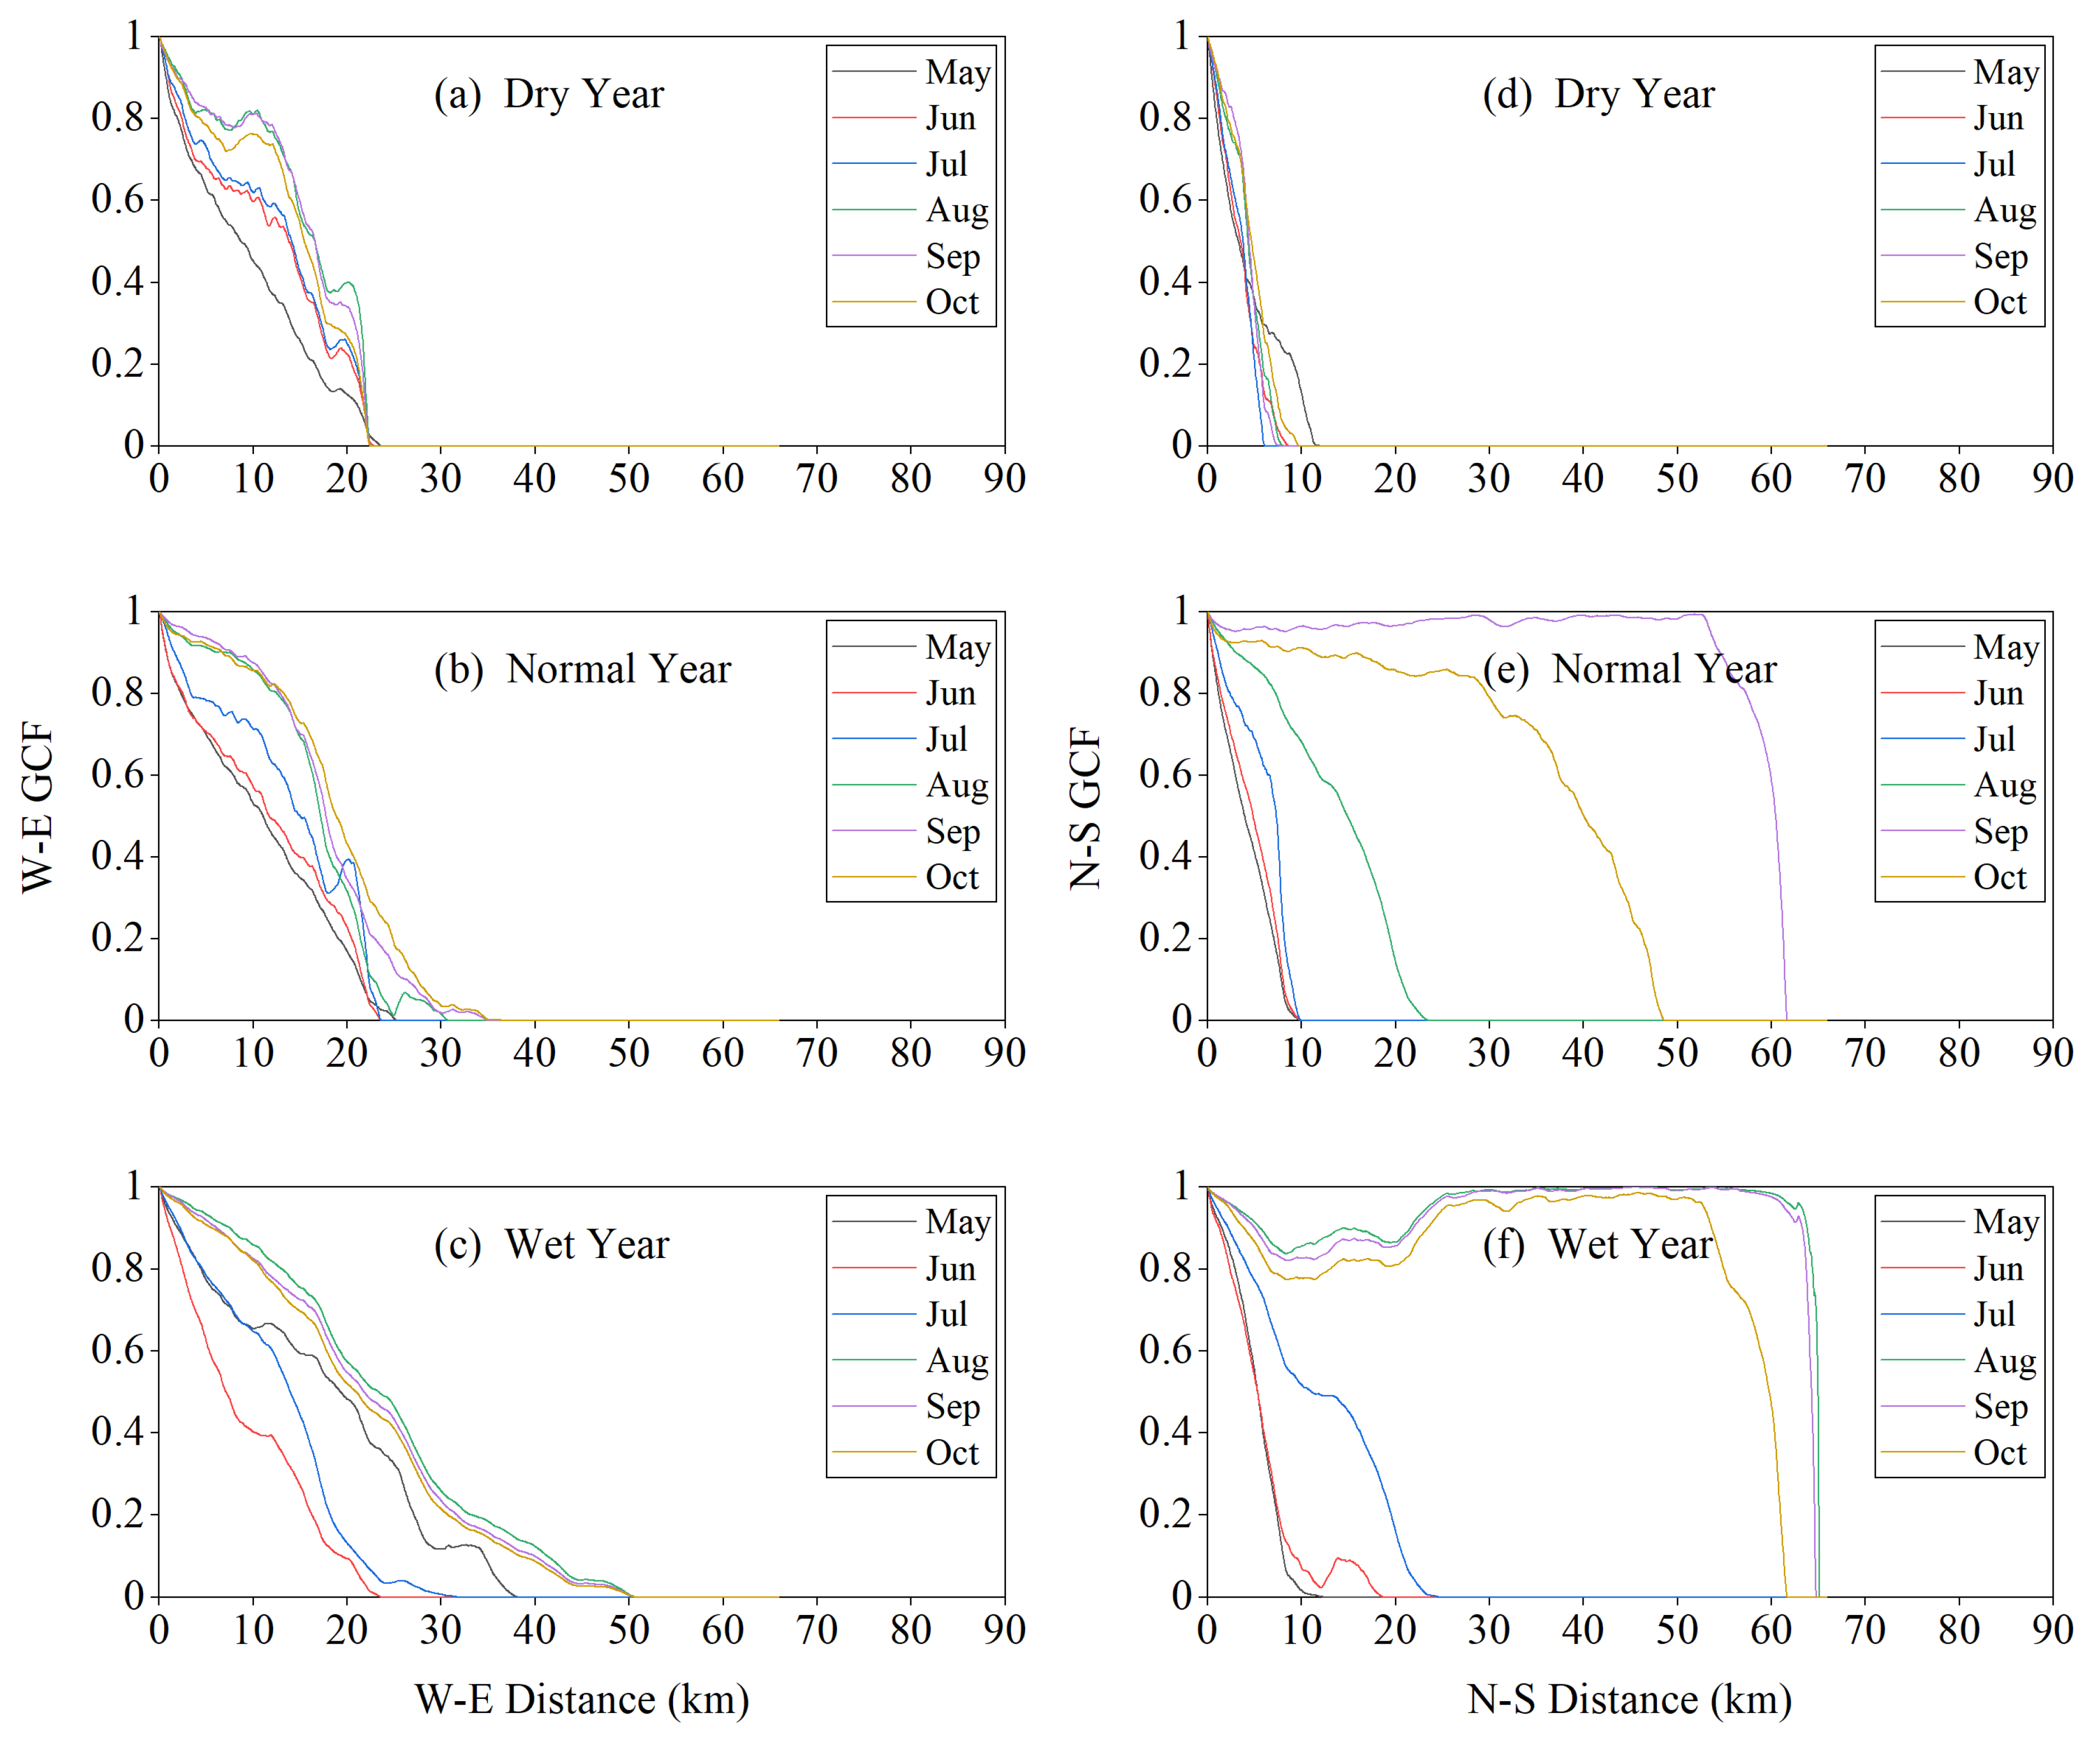
Our results show that, during the dry year, the reduction rate of the GCF curve was slower along the W–E direction than that along the N–S direction, which is contrary to the situation during the normal and wet years (
Figure 3). As far as normal years are concerned, the current results of the reduction rate of the GCF curve using the JRC Monthly Water History dataset are consistent with the findings of our previous paper [
15] using the Sentinel-1 dataset. Moreover, the minimum values of the MDC along the W–E and N–S directions both appeared in the dry year, at 22.4 km and 6.3 km, respectively, while the maximum values of the MDC along the above two directions both appeared in the wet year, at 50.7 km and 65.1 km, respectively (
Figure 3). During the normal year, the MDC along the W–E direction varied from 23.6 km to 36.4 km, while the MDC along the N–S direction varied from 10.0 km to 61.7 km (
Figure 3). Whether in the W–E direction or in the N–S direction, the changes in the MDC in the current study were more dramatic than the findings of our previous paper [
15]. The reason may be that the current paper only focused on one normal year, whereas the results of our previous paper were the average of five normal years. These results indicate that, due to the combined effects of natural and human factors, such as flooding, manmade water replenishment, dams, and roads, the surface hydrological connectivity along the W–E and N–S directions in a large multi-lake system exhibited different responses. Trigg et al. [
6] and Liu et al. [
8] found that the surface hydrological connectivity in a river–lake system is affected by natural factors such as floods and main lake stages. Our new discovery of the difference in surface hydrological connectivity along the W–E and N–S directions in a large multi-lake system during different hydrological years expands our understanding of surface hydrological connectivity under both natural and manmade influences.
At the beginning of the 21st century, due to years of drought and upstream reservoir filling, Zhushanpao, the lakes in the Halata core zone, and the Hujiawopeng core zone have almost disappeared, whereas the remaining lake area has shrunk dramatically (
Figure 4). Since then, most of the Hujiawopeng core zone has gradually been reclaimed as dry farmland. This land-use change has weakened the surface hydrological connectivity between the lakes inside and outside the Hujiawopeng core zone. In recent years, with the construction and operation of replenishment ditches, the water surface area of Zhushanpao and the lakes in the central part (i.e., Wulanzhaopao, Momogepao, Etoupao, Taipingshanpao, etc.) has increased greatly (
Figure 5). However, due to excessive water,
Scirpus nipponicus and
Scirpus planiculmis in the Wulanzhaopao and Etoupao were submerged, preventing the Siberian cranes from obtaining food in these areas. The current results are consistent with the findings of our earlier study [
15]. In addition, even in the wet year, the surface hydrological connectivity between the Nenjiang River and its floodplain in May was very poor, which may adversely affect the germination and growth of aquatic vegetation in the area.
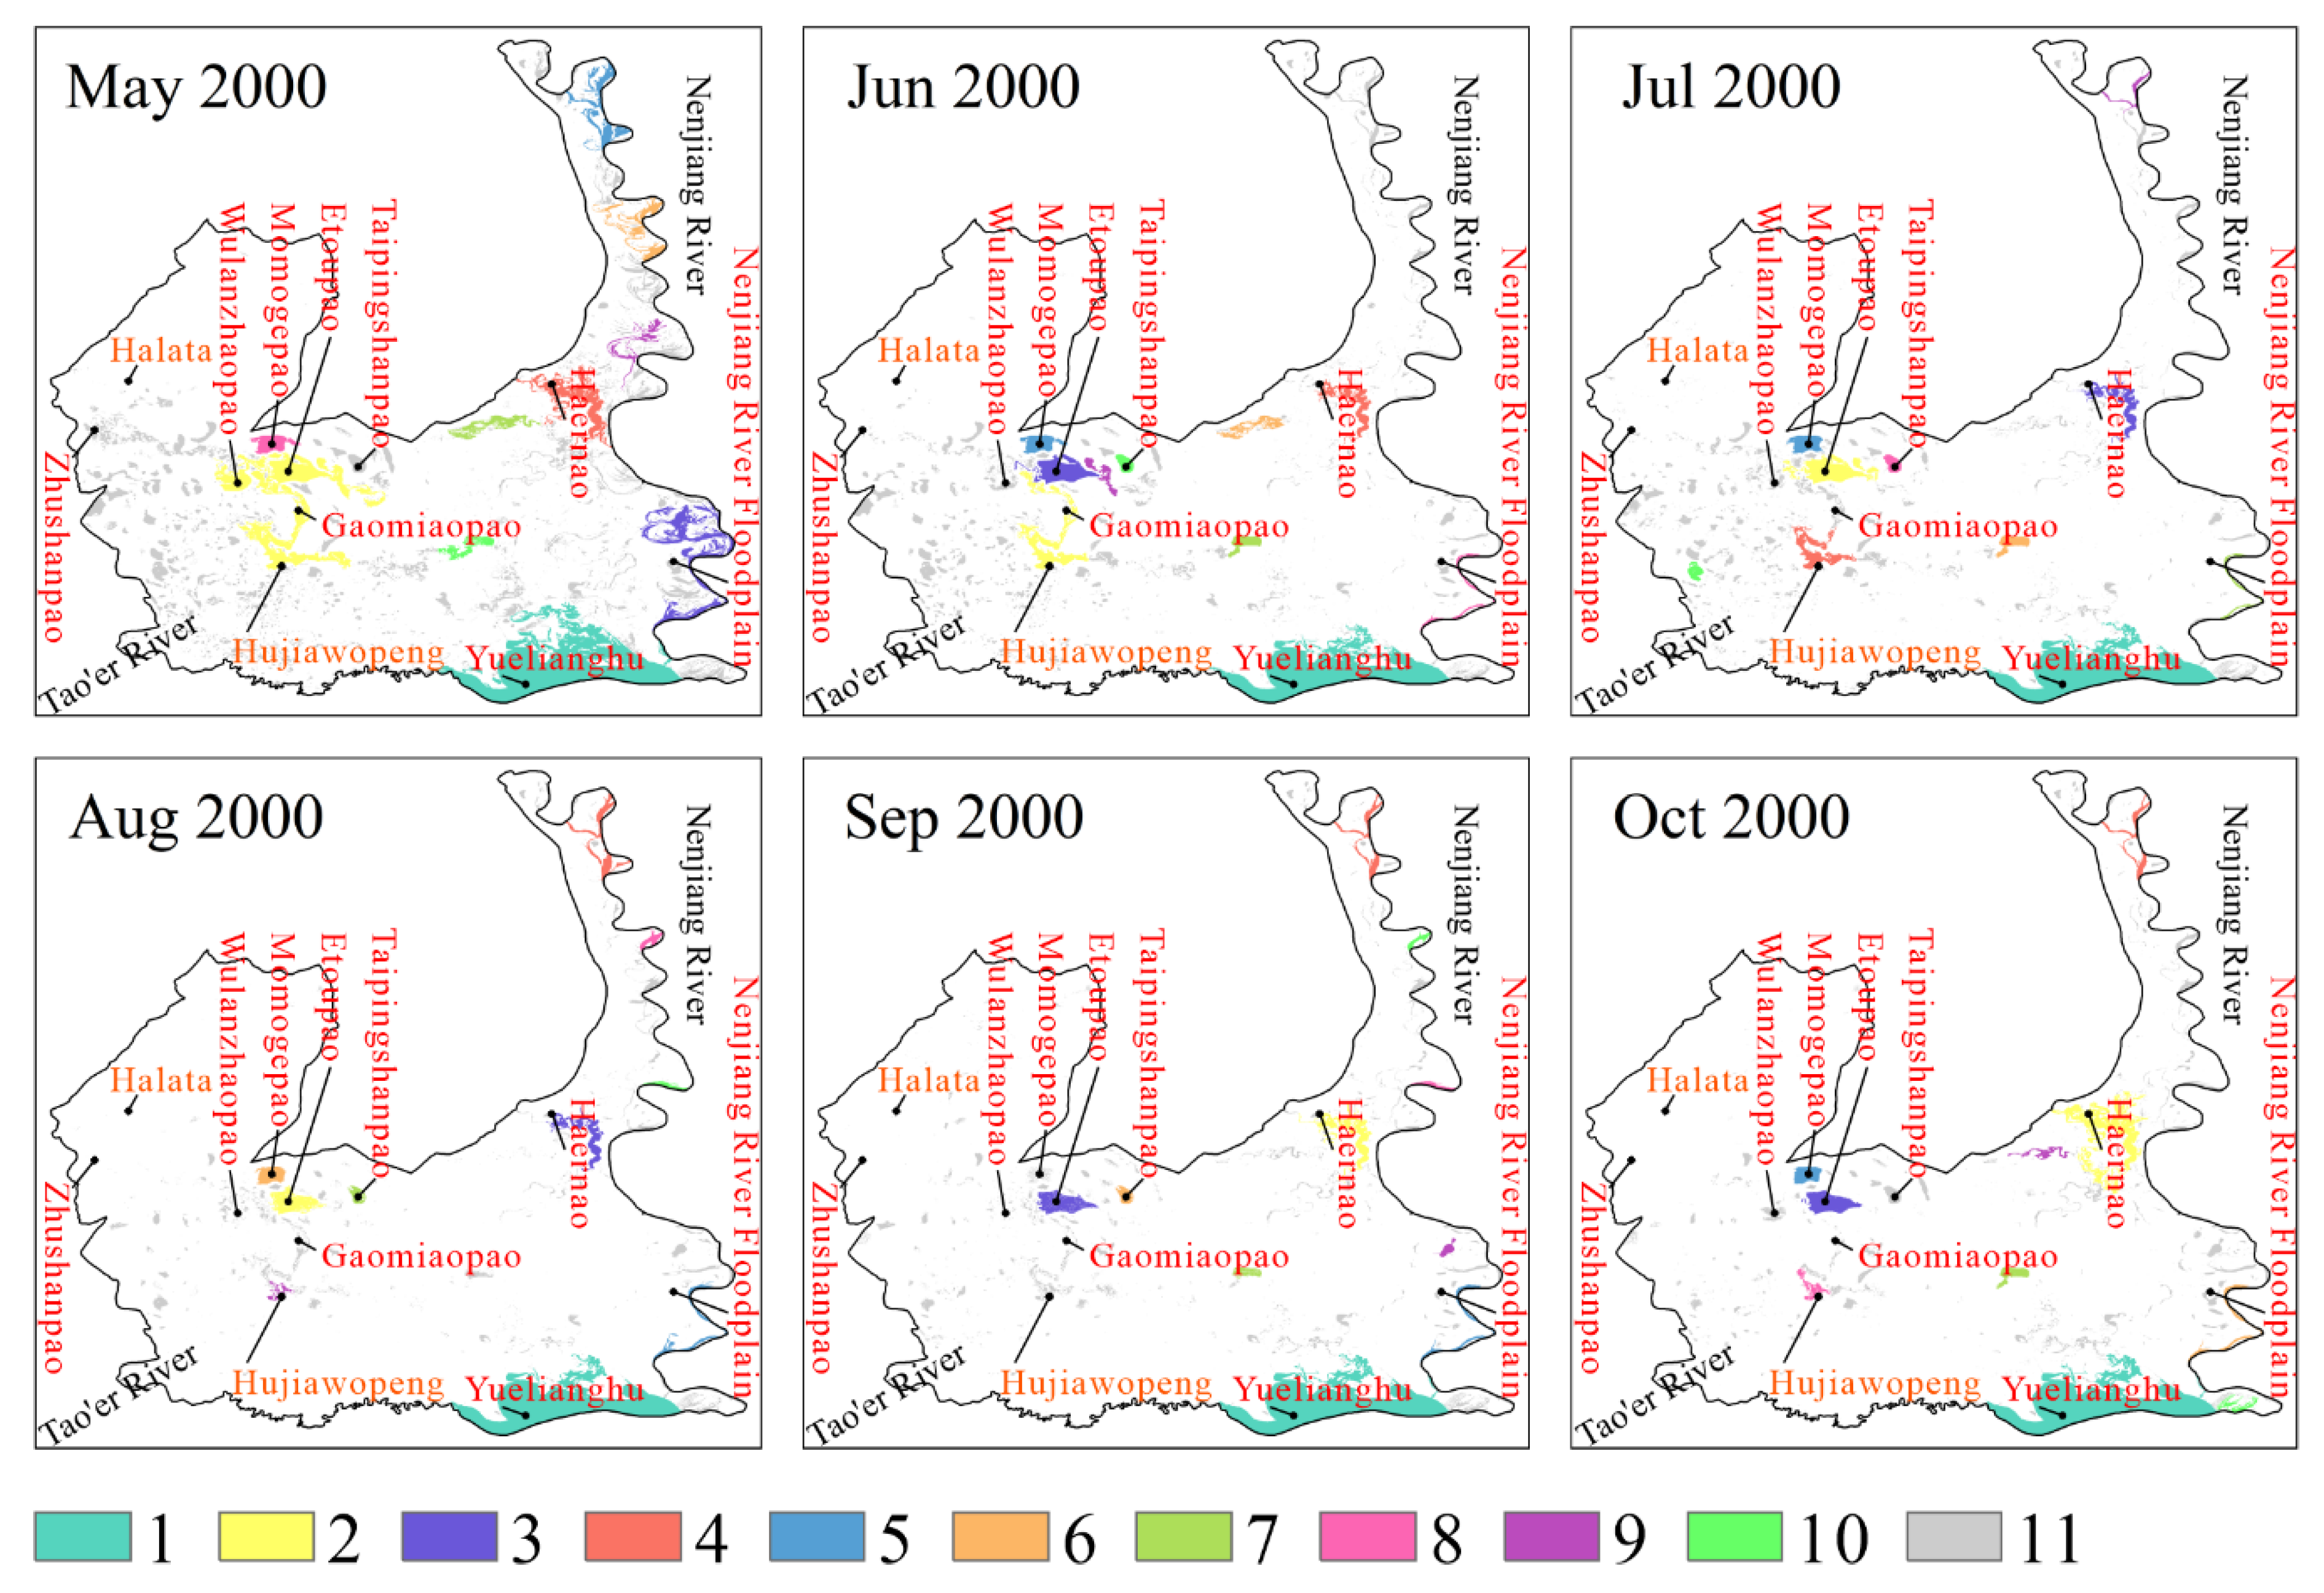
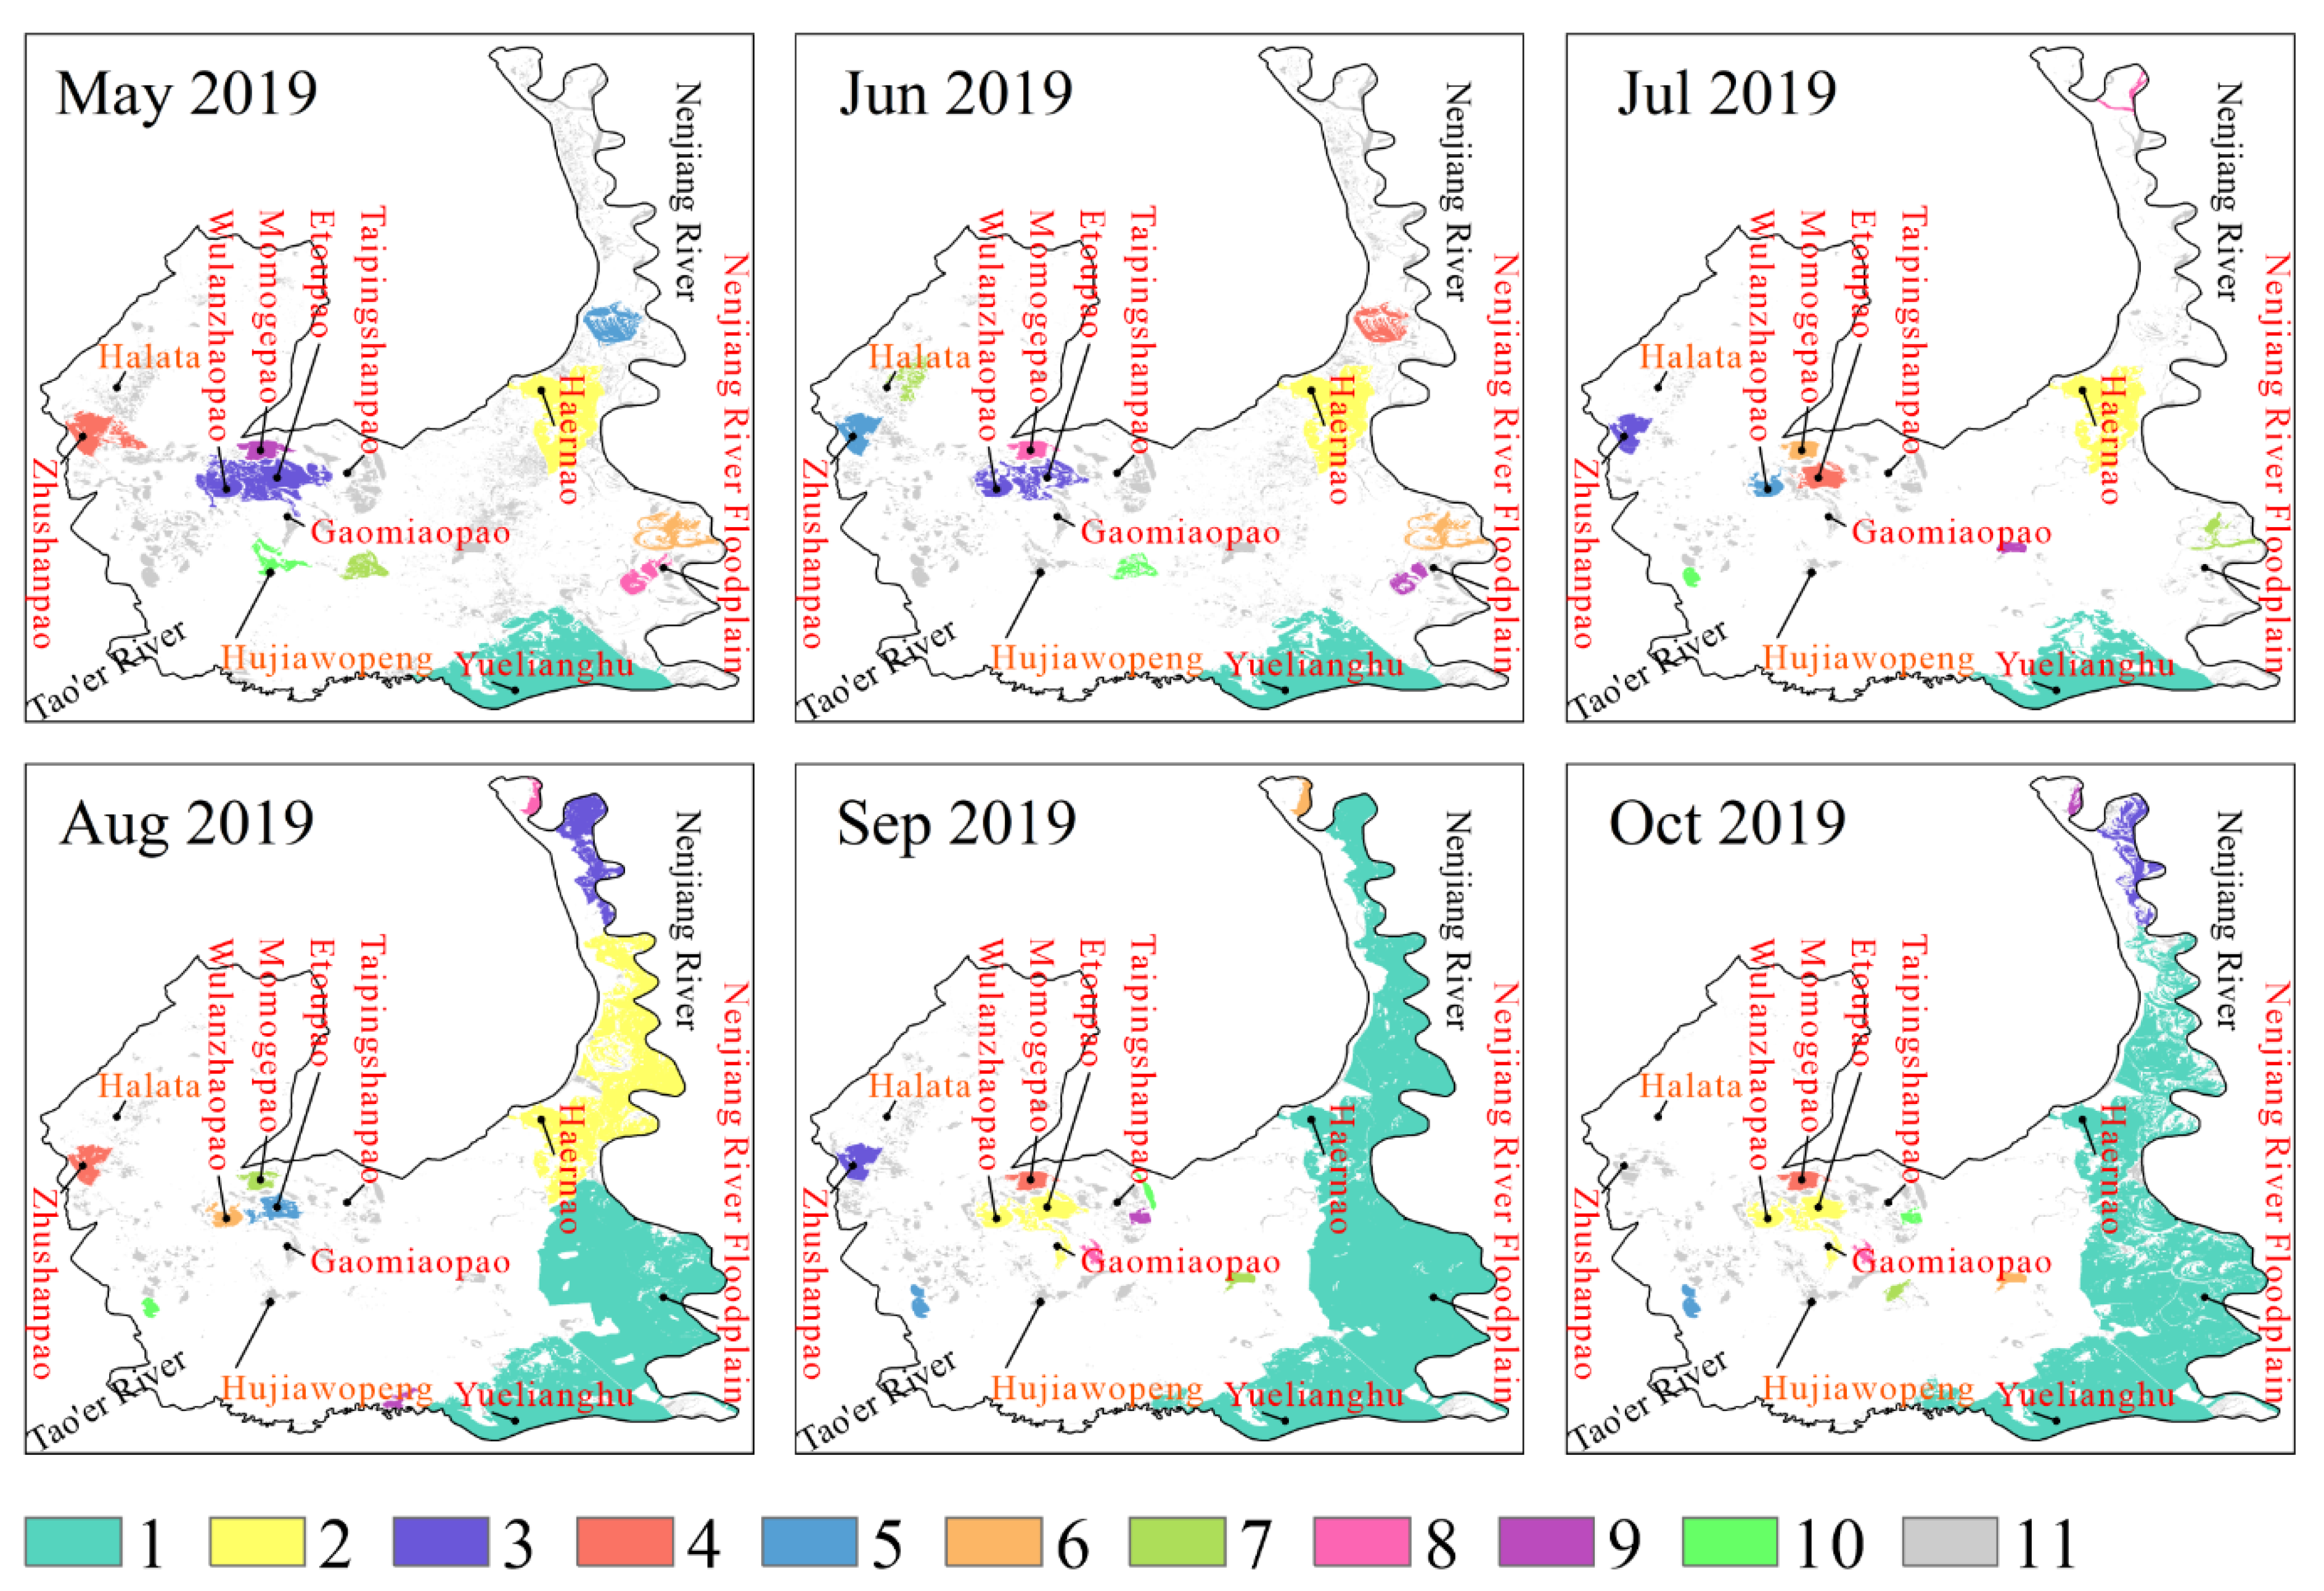
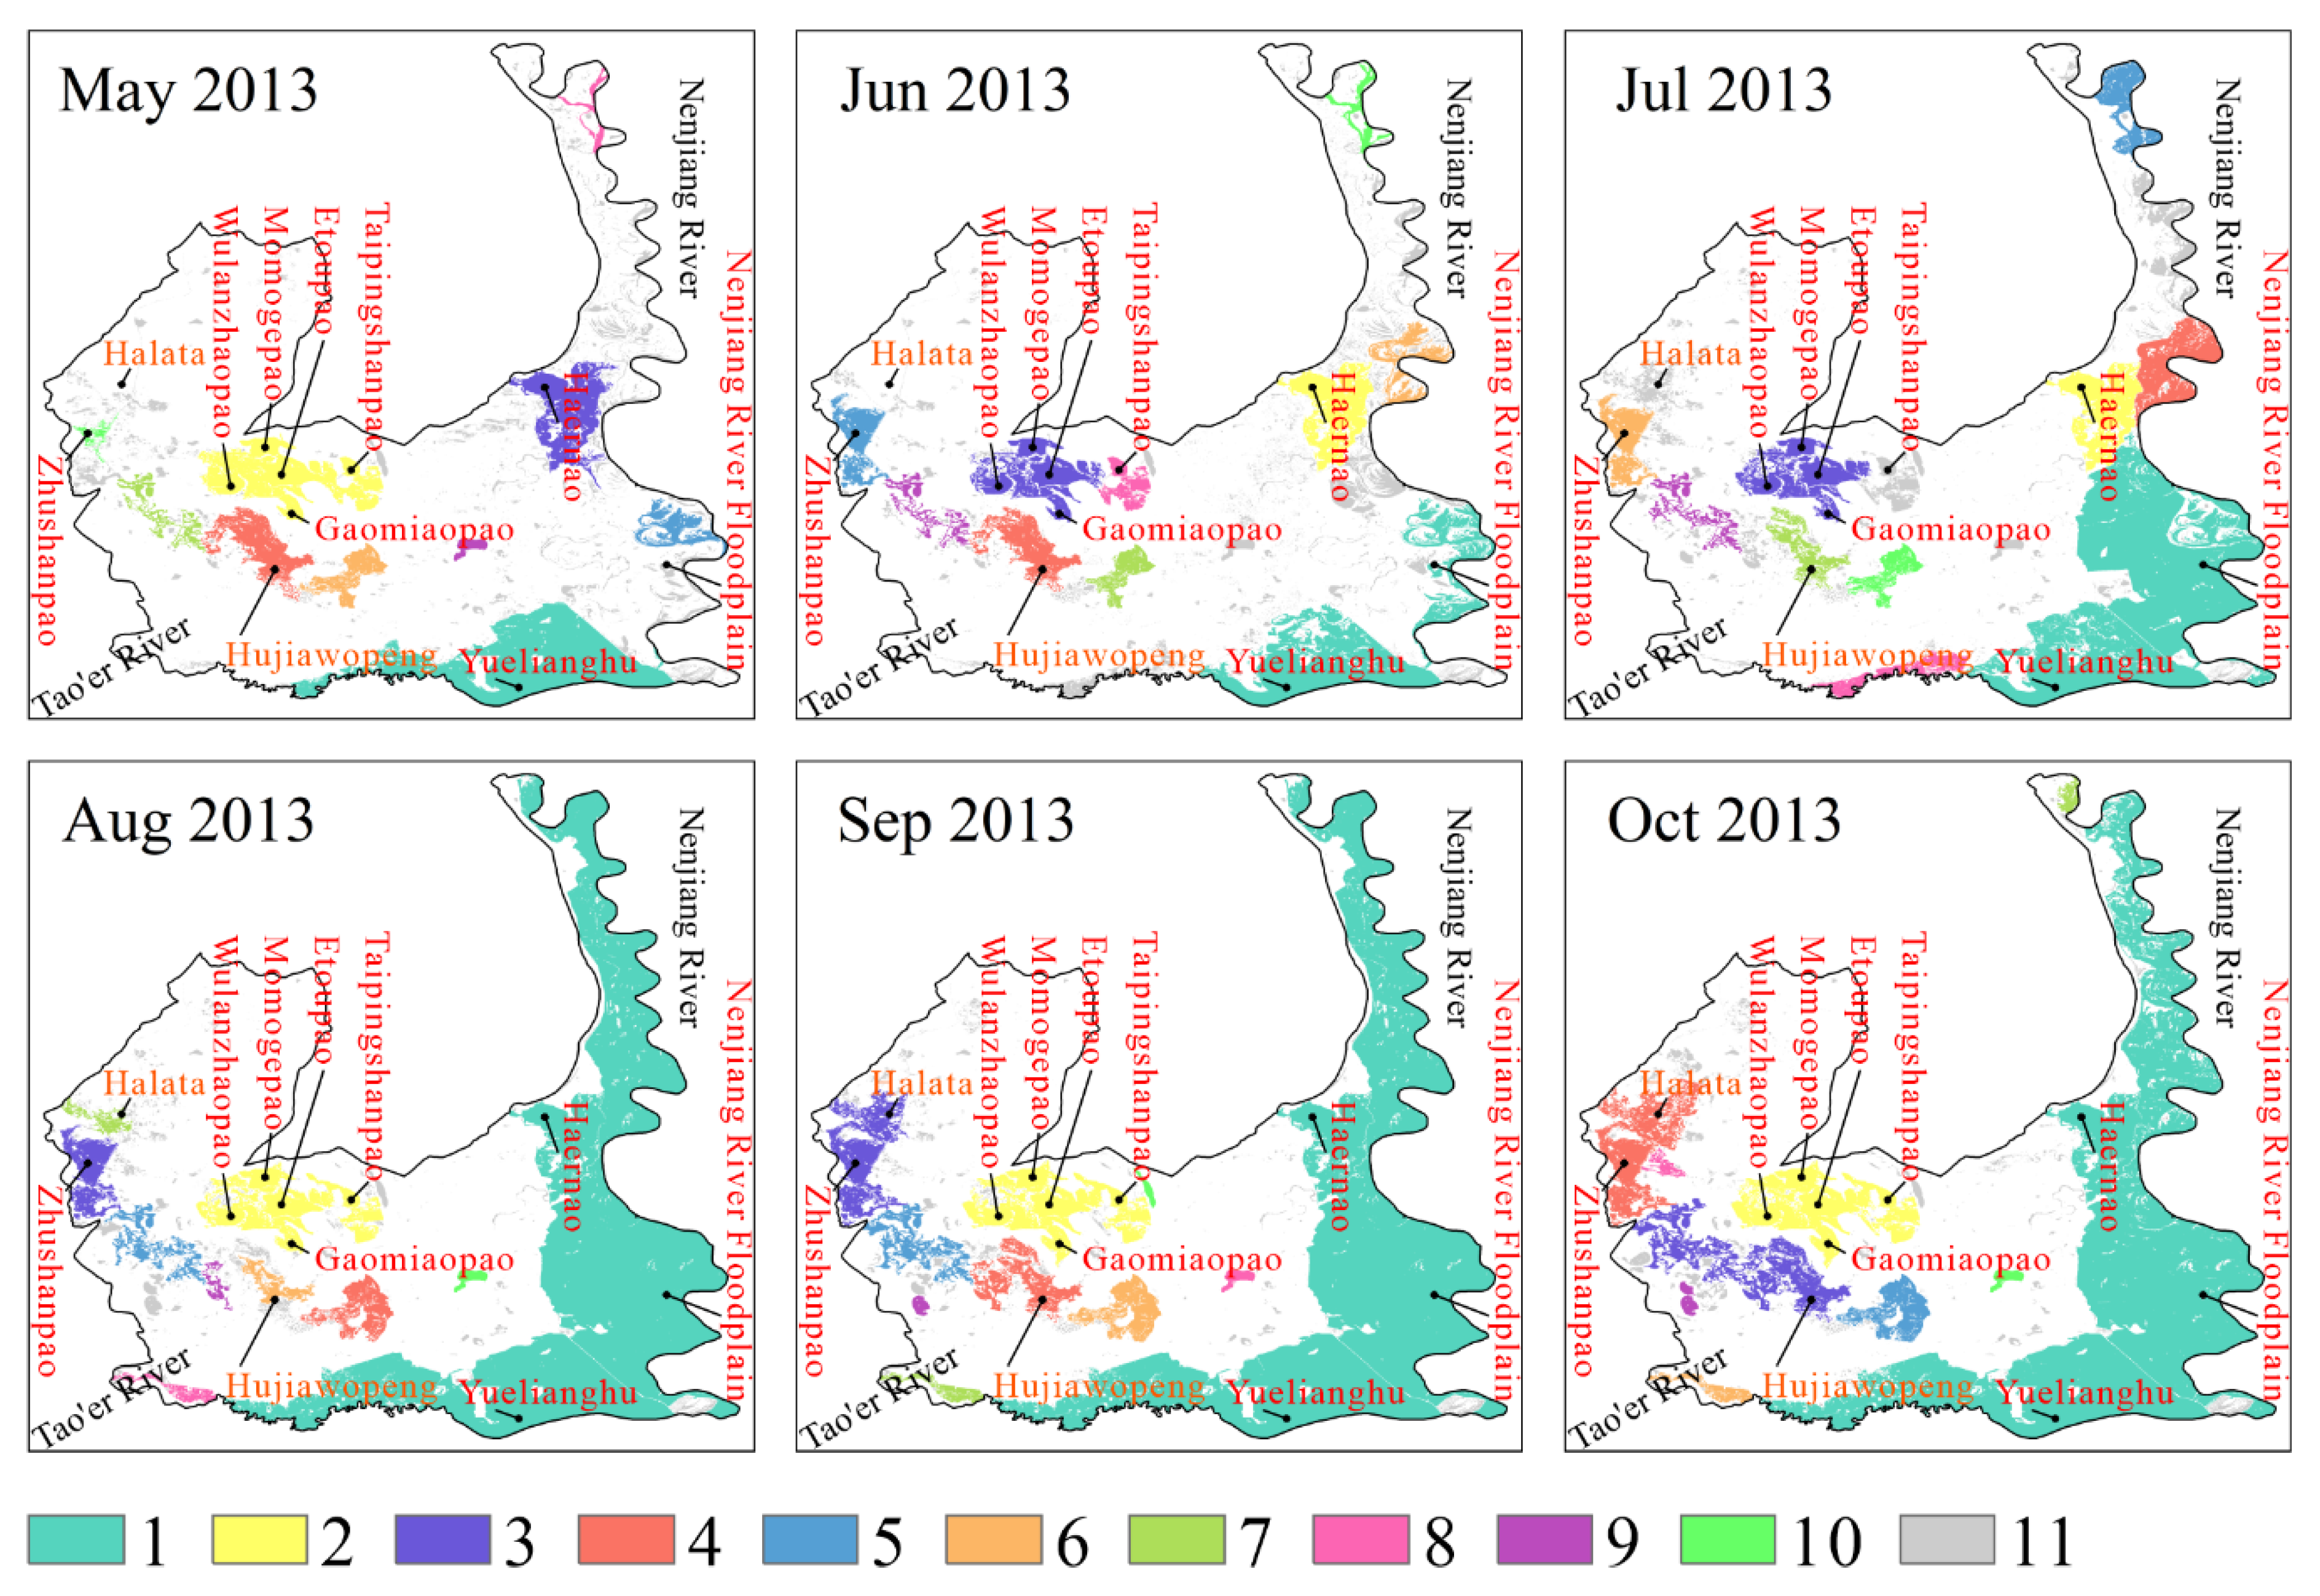
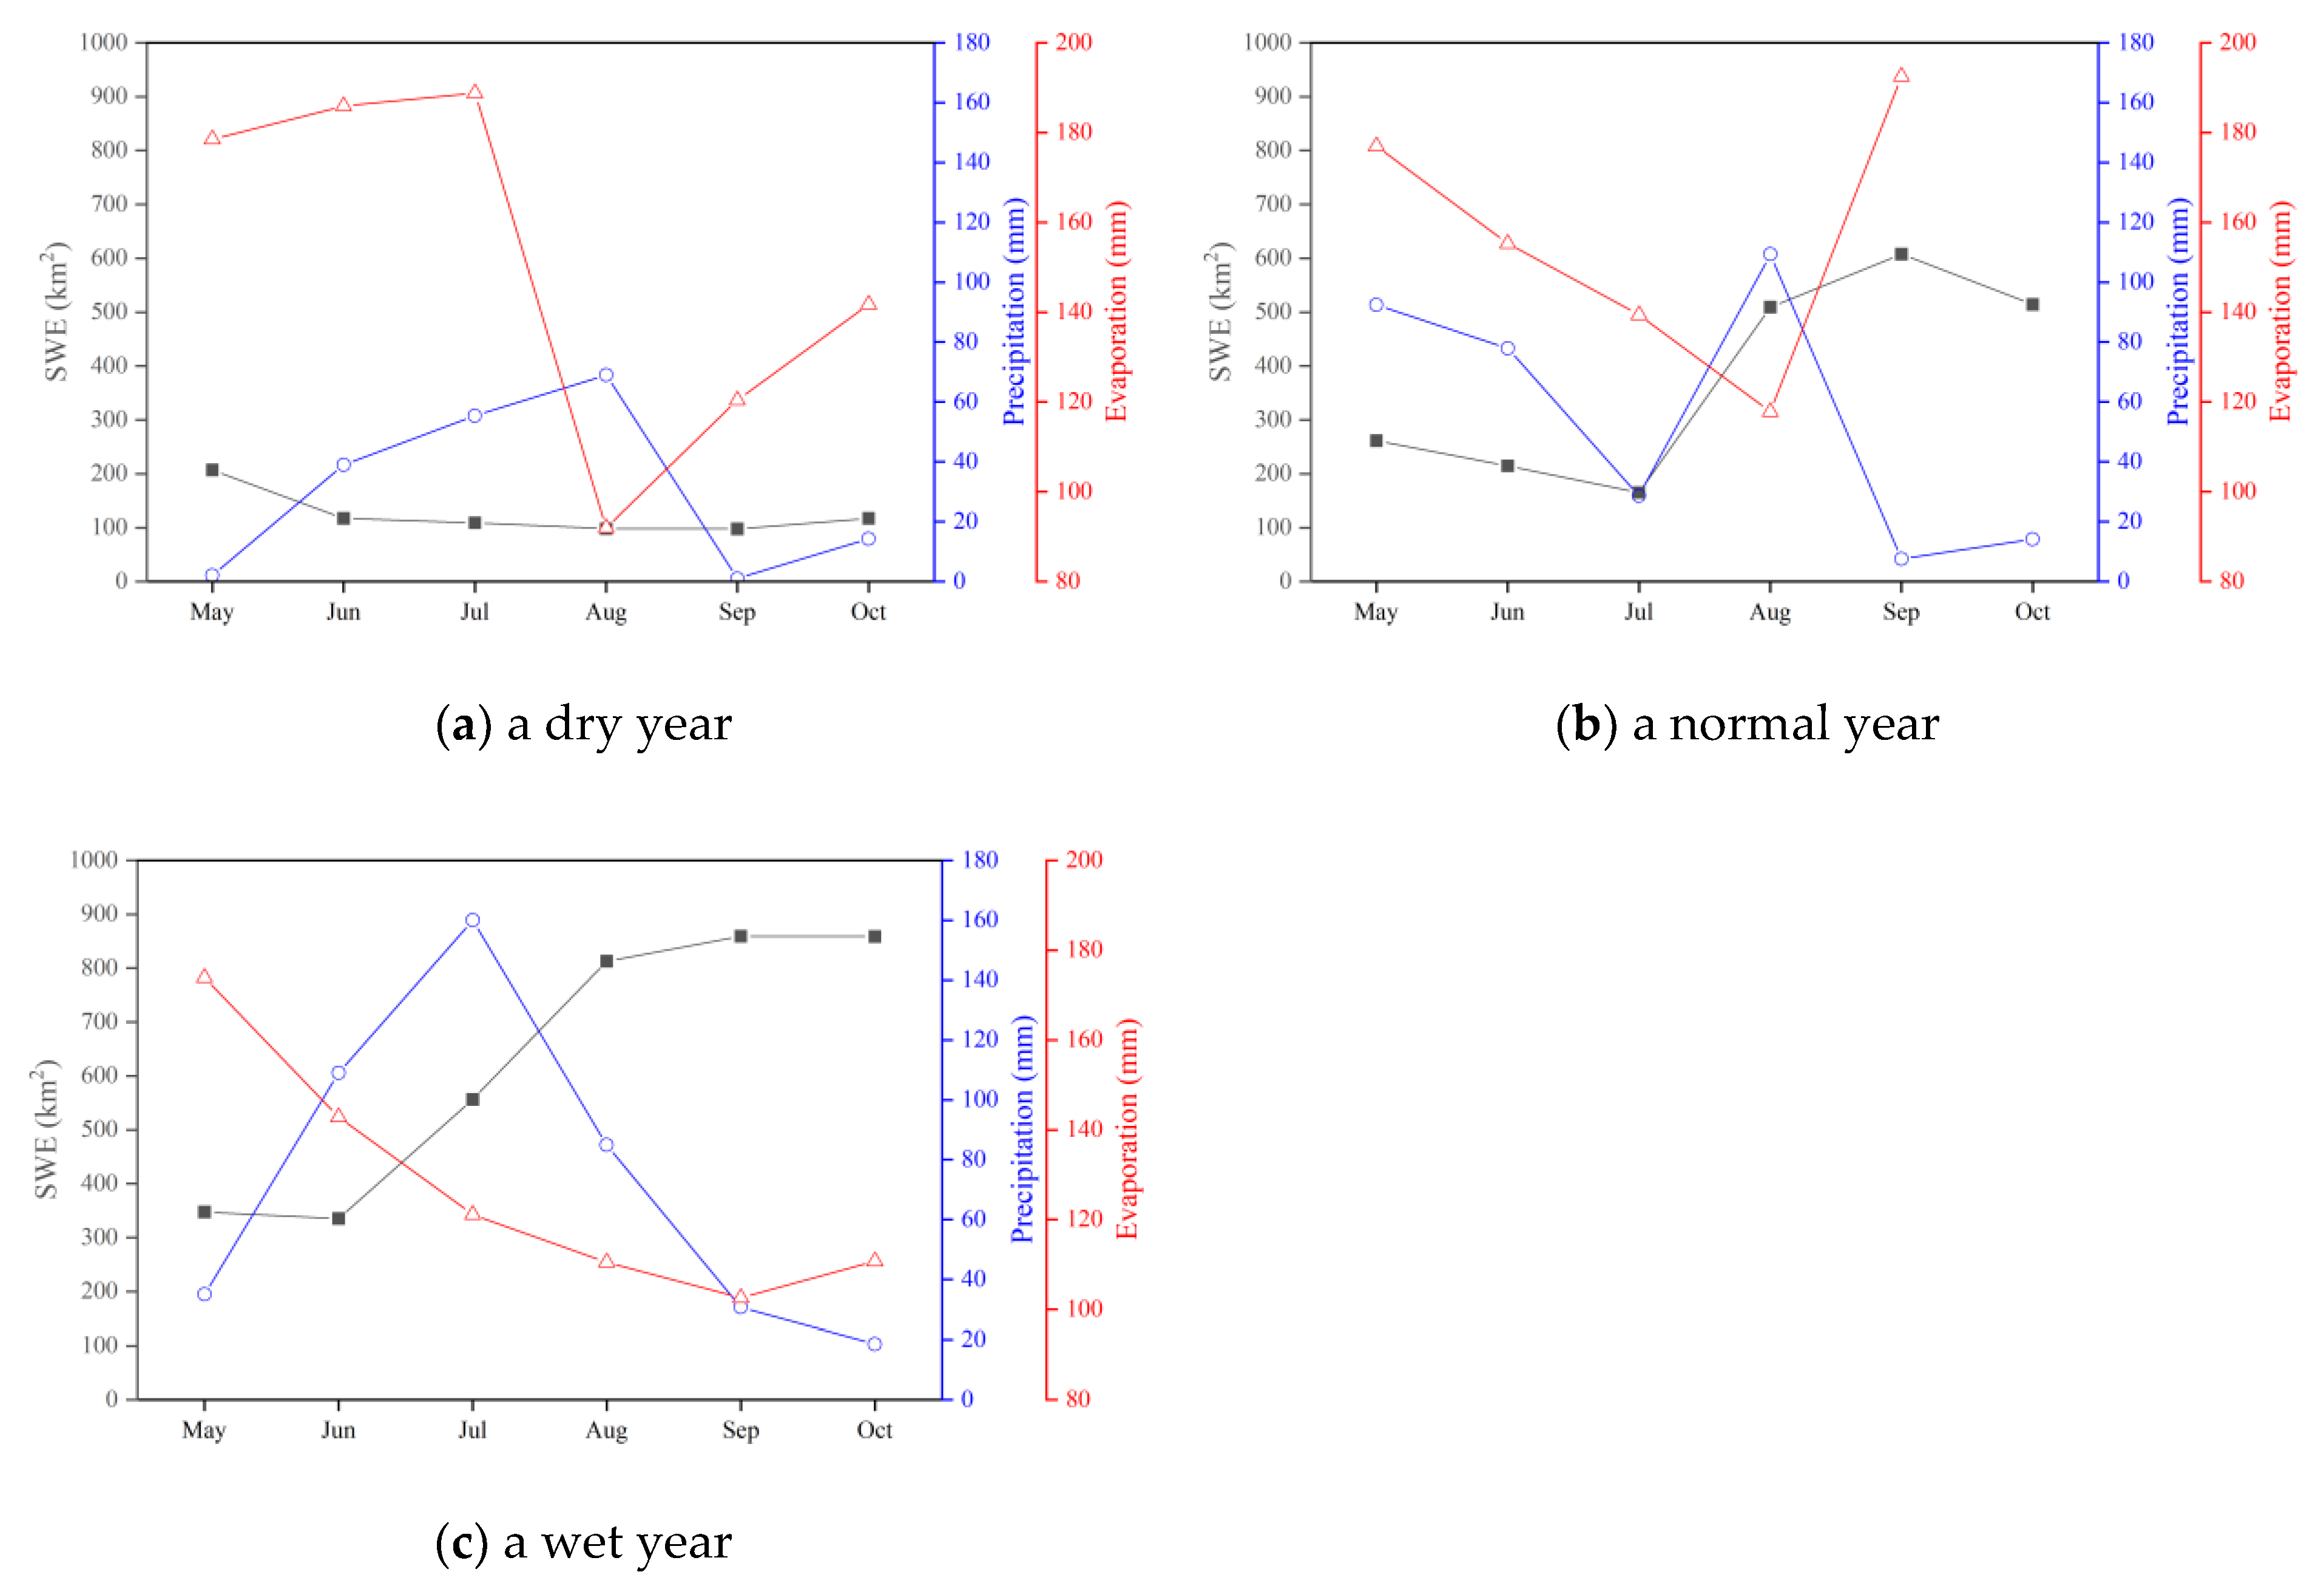
Our results show that the changing trends of the SWE of the top 10 largest connectomes were inconsistent during dry, normal, and wet years (
Table 1). Further analysis found that, during the dry year, the changing trend of SWE was generally opposite to the changing trend of evaporation, and no positive correlation between SWE and precipitation was found (
Figure 7a), indicating that evaporation is one of the main influencing factors of SWE in the dry year. In contrast, during the normal year, the changing trend of SWE was generally consistent with the changing trend of precipitation, and no negative correlation between SWE and evaporation was found (
Figure 7b), indicating that precipitation is one of the main influencing factors of SWE in the normal year. During the wet year, the changing trend of SWE was generally opposite to the changing trend of evaporation, and no positive correlation between SWE and precipitation was found (
Figure 7c), indicating that evaporation is one of the main factors affecting SWE in the wet year. Although there were many differences in the trend of SWE during different hydrological years, one trend was the same, that is, the SWE in May was higher than the corresponding value in June. This is because there were more replenishment water sources in May than in June. These extra water sources in May were snowmelt runoff and artificial water replenishment (i.e., recharged from irrigation and the farmland drainage network). Our results suggest that the surface water extent of the top 10 largest connectomes can be compared with precipitation and evaporation, in order to reveal the impact of precipitation and evaporation on the surface hydrology connectivity between water bodies. However, in terms of normal years, the components and spatial distribution of the top 10 largest connectomes in each month were different from the findings of our previous paper [
15]. This may be due to the difference in temporal resolution (monthly average vs. 6–12 days) and spatial resolution (30 m vs. 10 m) of the dataset (JRC vs. Sentinel-1) used in the two studies.
5. Conclusions
This study demonstrated that the JRC Monthly Water History dataset derived from Landsat imagery is a valuable dataset for assessing the surface water dynamics, especially in ungauged areas. A remarkable advance of the dataset is that it greatly eliminated the impact of clouds on the quality of Landsat images. Using this dataset, geostatistical analysis was applied to quantify the spatiotemporal dynamics of surface hydrological connectivity under the influence of natural and human factors. Surface hydrological connectivity in the large multi-lake system changed along a gradient of wetness. During a dry year, due to lack of water input and geomorphological conditions, the surface hydrological connectivity along the W–E direction was better than that along the N–S direction. In normal and wet years, due to the combined effect of floods and river dam, the surface hydrological connectivity along the W–E direction was worse than that along the N–S direction. Overall, the surface hydrological connectivity in August, September, and October was better than that in May, June, and July. Overall, the surface hydrological connectivity in the east region was better than that in the central region, which in turn was better than that in the west region, and the surface hydrological connectivity in the rest of the region was poor.
Compared with other methods for the evaluation of hydrological connectivity, the main advantages of our approach are as follows: (1) it is completely objective; (2) it does not rely on ground measurement data such as water level and flow; (3) it outputs spatial and temporal distribution maps of hydrological connectivity; (4) it is economical and fast. While we expect that this approach can be applicable to other regions, two limitations should be noted. First, the JRC Monthly Water History dataset is a monthly composite dataset generated by Google on the basis of Landsat images. Although the overall accuracy of the dataset is very high, it actually reduces the temporal resolution of Landsat images. Second, the 30 m spatial resolution of the JRC Monthly Water History dataset applied in this study is still too coarse to detect details of surface hydrological connectivity. Overall, the temporal and spatial resolution of JCR data is lower than that of Sentinel-1 data; thus, it is not as good as Sentinel-1 data [
15] in terms of displaying the details of surface hydrological connectivity. However, the advantage of JCR data is that it can be used directly without mastering professional remote sensing interpretation technology.


