
Global Sensitivity Analysis and Calibration by Differential Evolution Algorithm of HORTSYST Crop Model for Fertigation Management

 ,
,  , and
, and
Abstract
1. Introduction
2. Materials and Methods
2.1. Description of the Experiments
2.2. Model Description
2.3. Global Sensitivity Analysis of the HORTSYST Model
2.4. Sobol Sensitivity Analysis Method
2.5. Differential Evolution Algorithm
2.6. Optimization Problem Description
2.7. Goodness of Fit Performance of Simulations
3. Results and Discussion
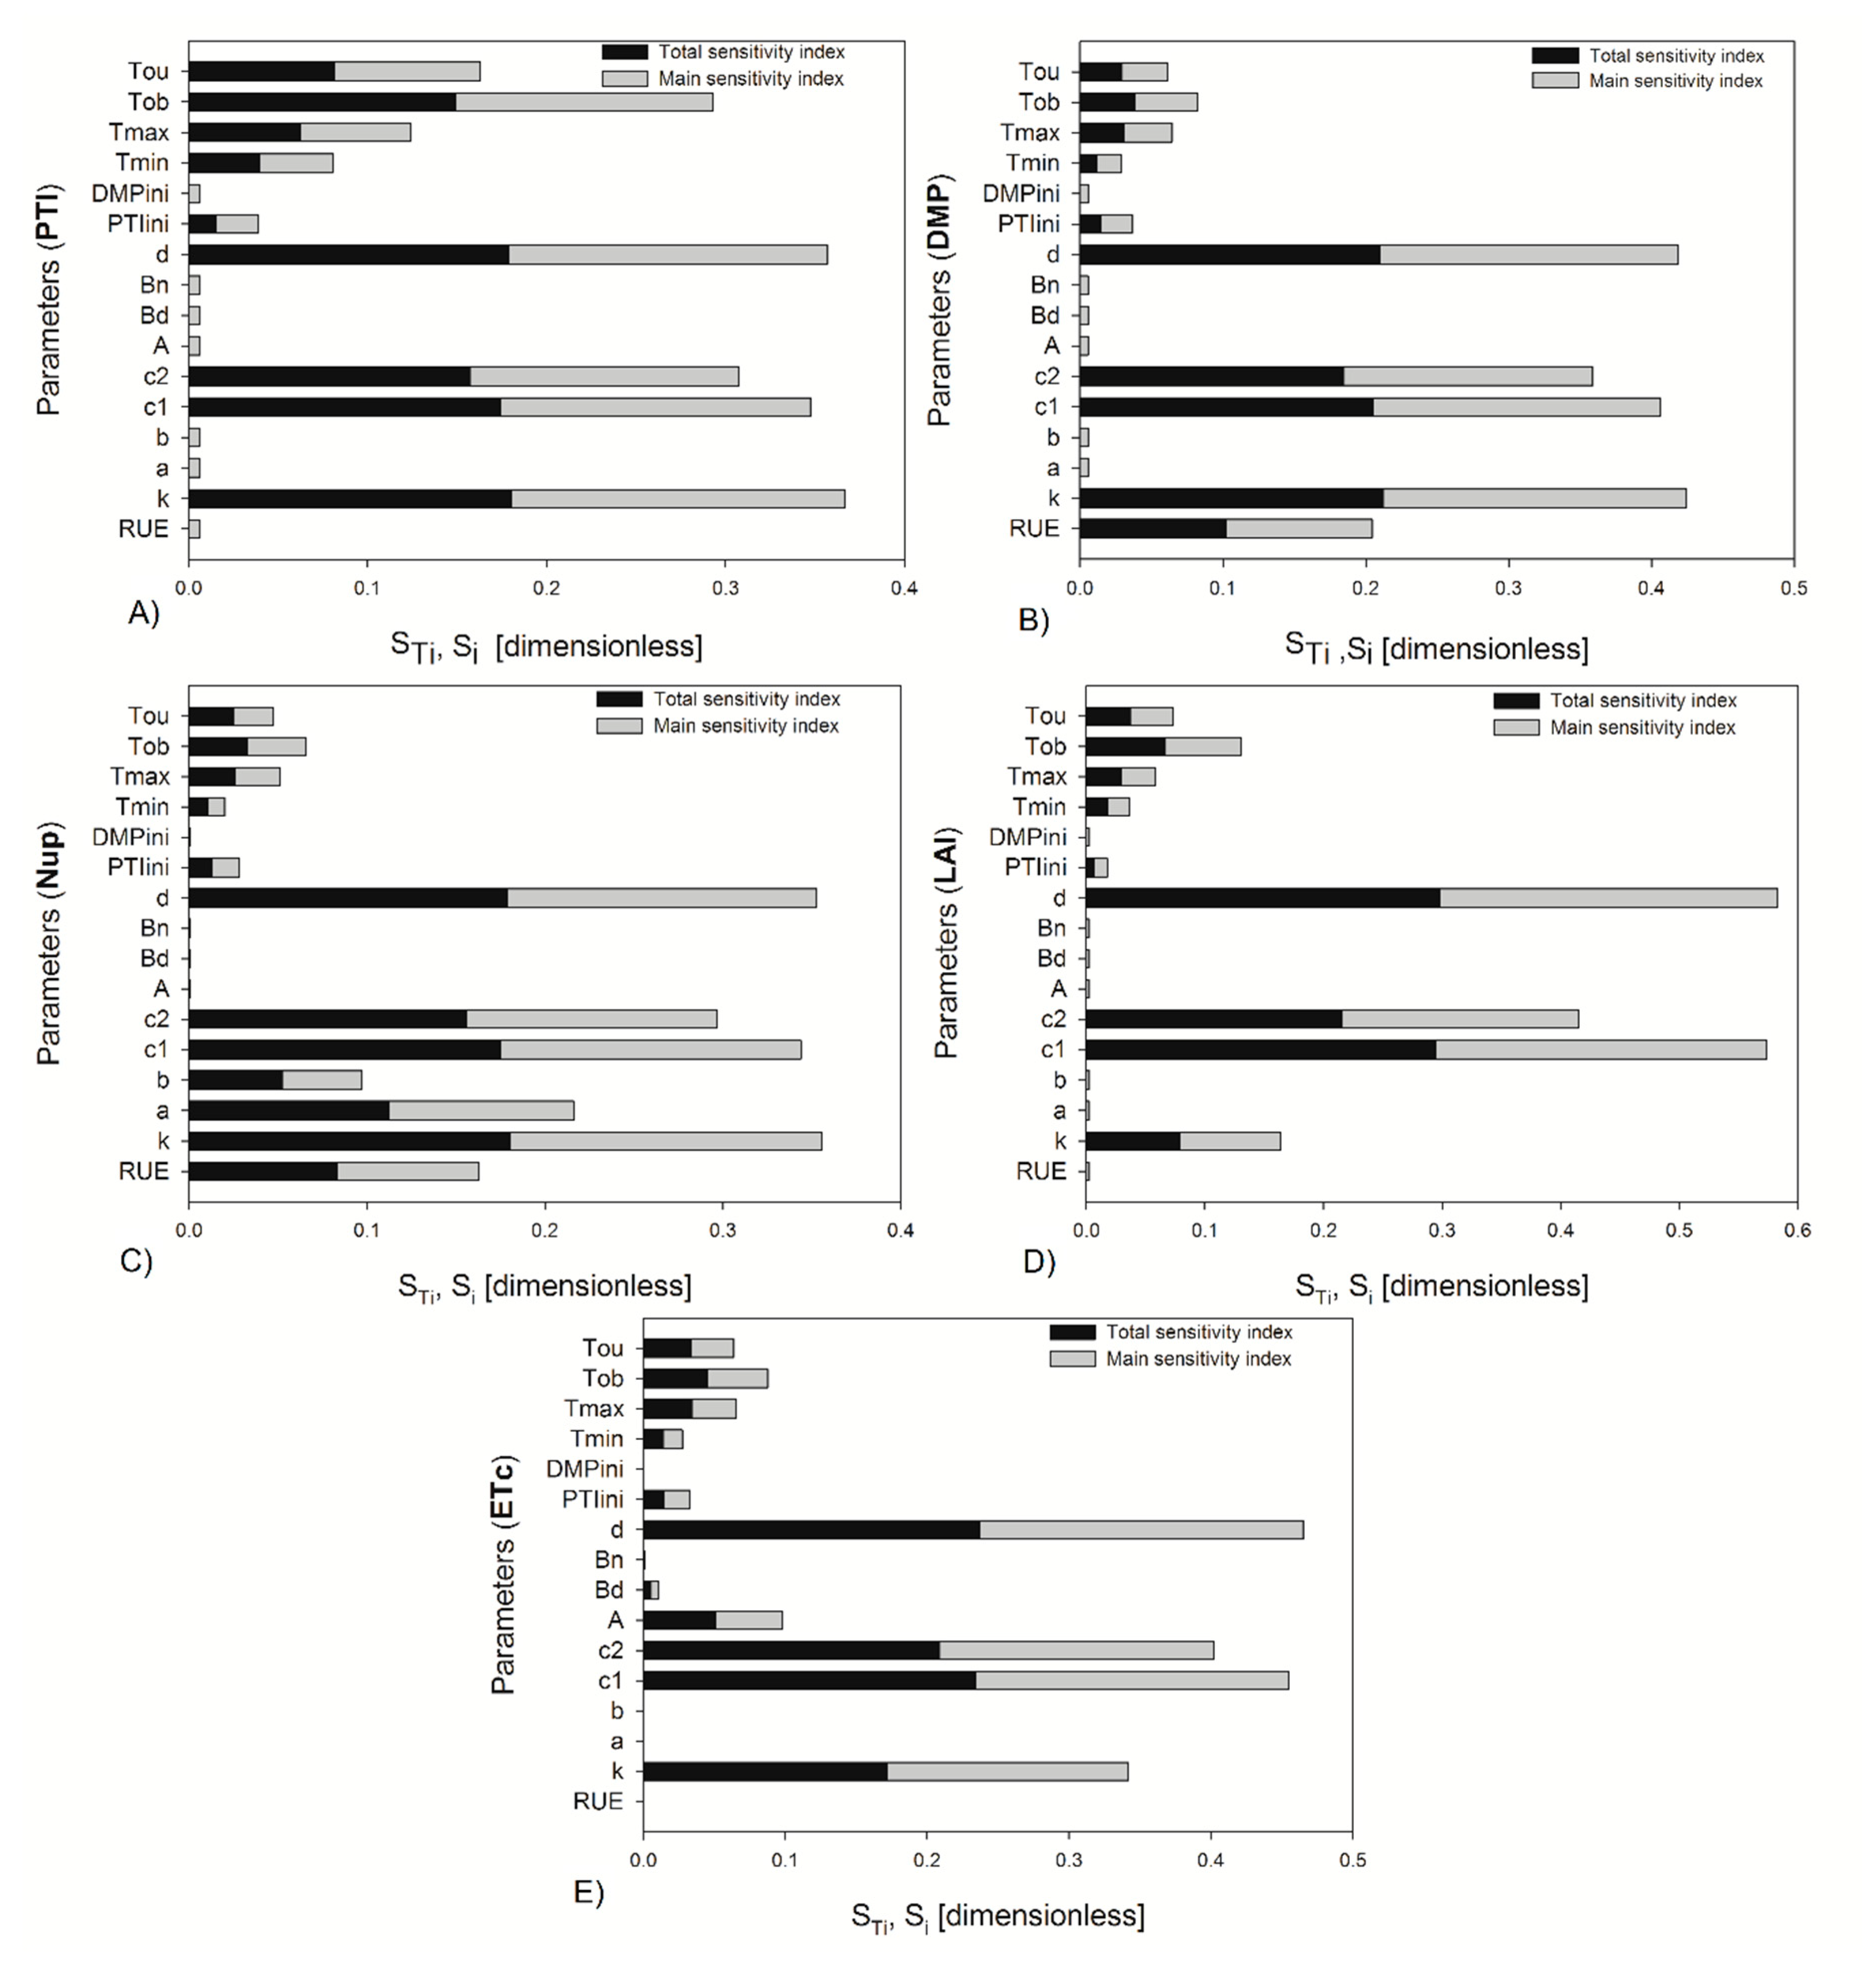
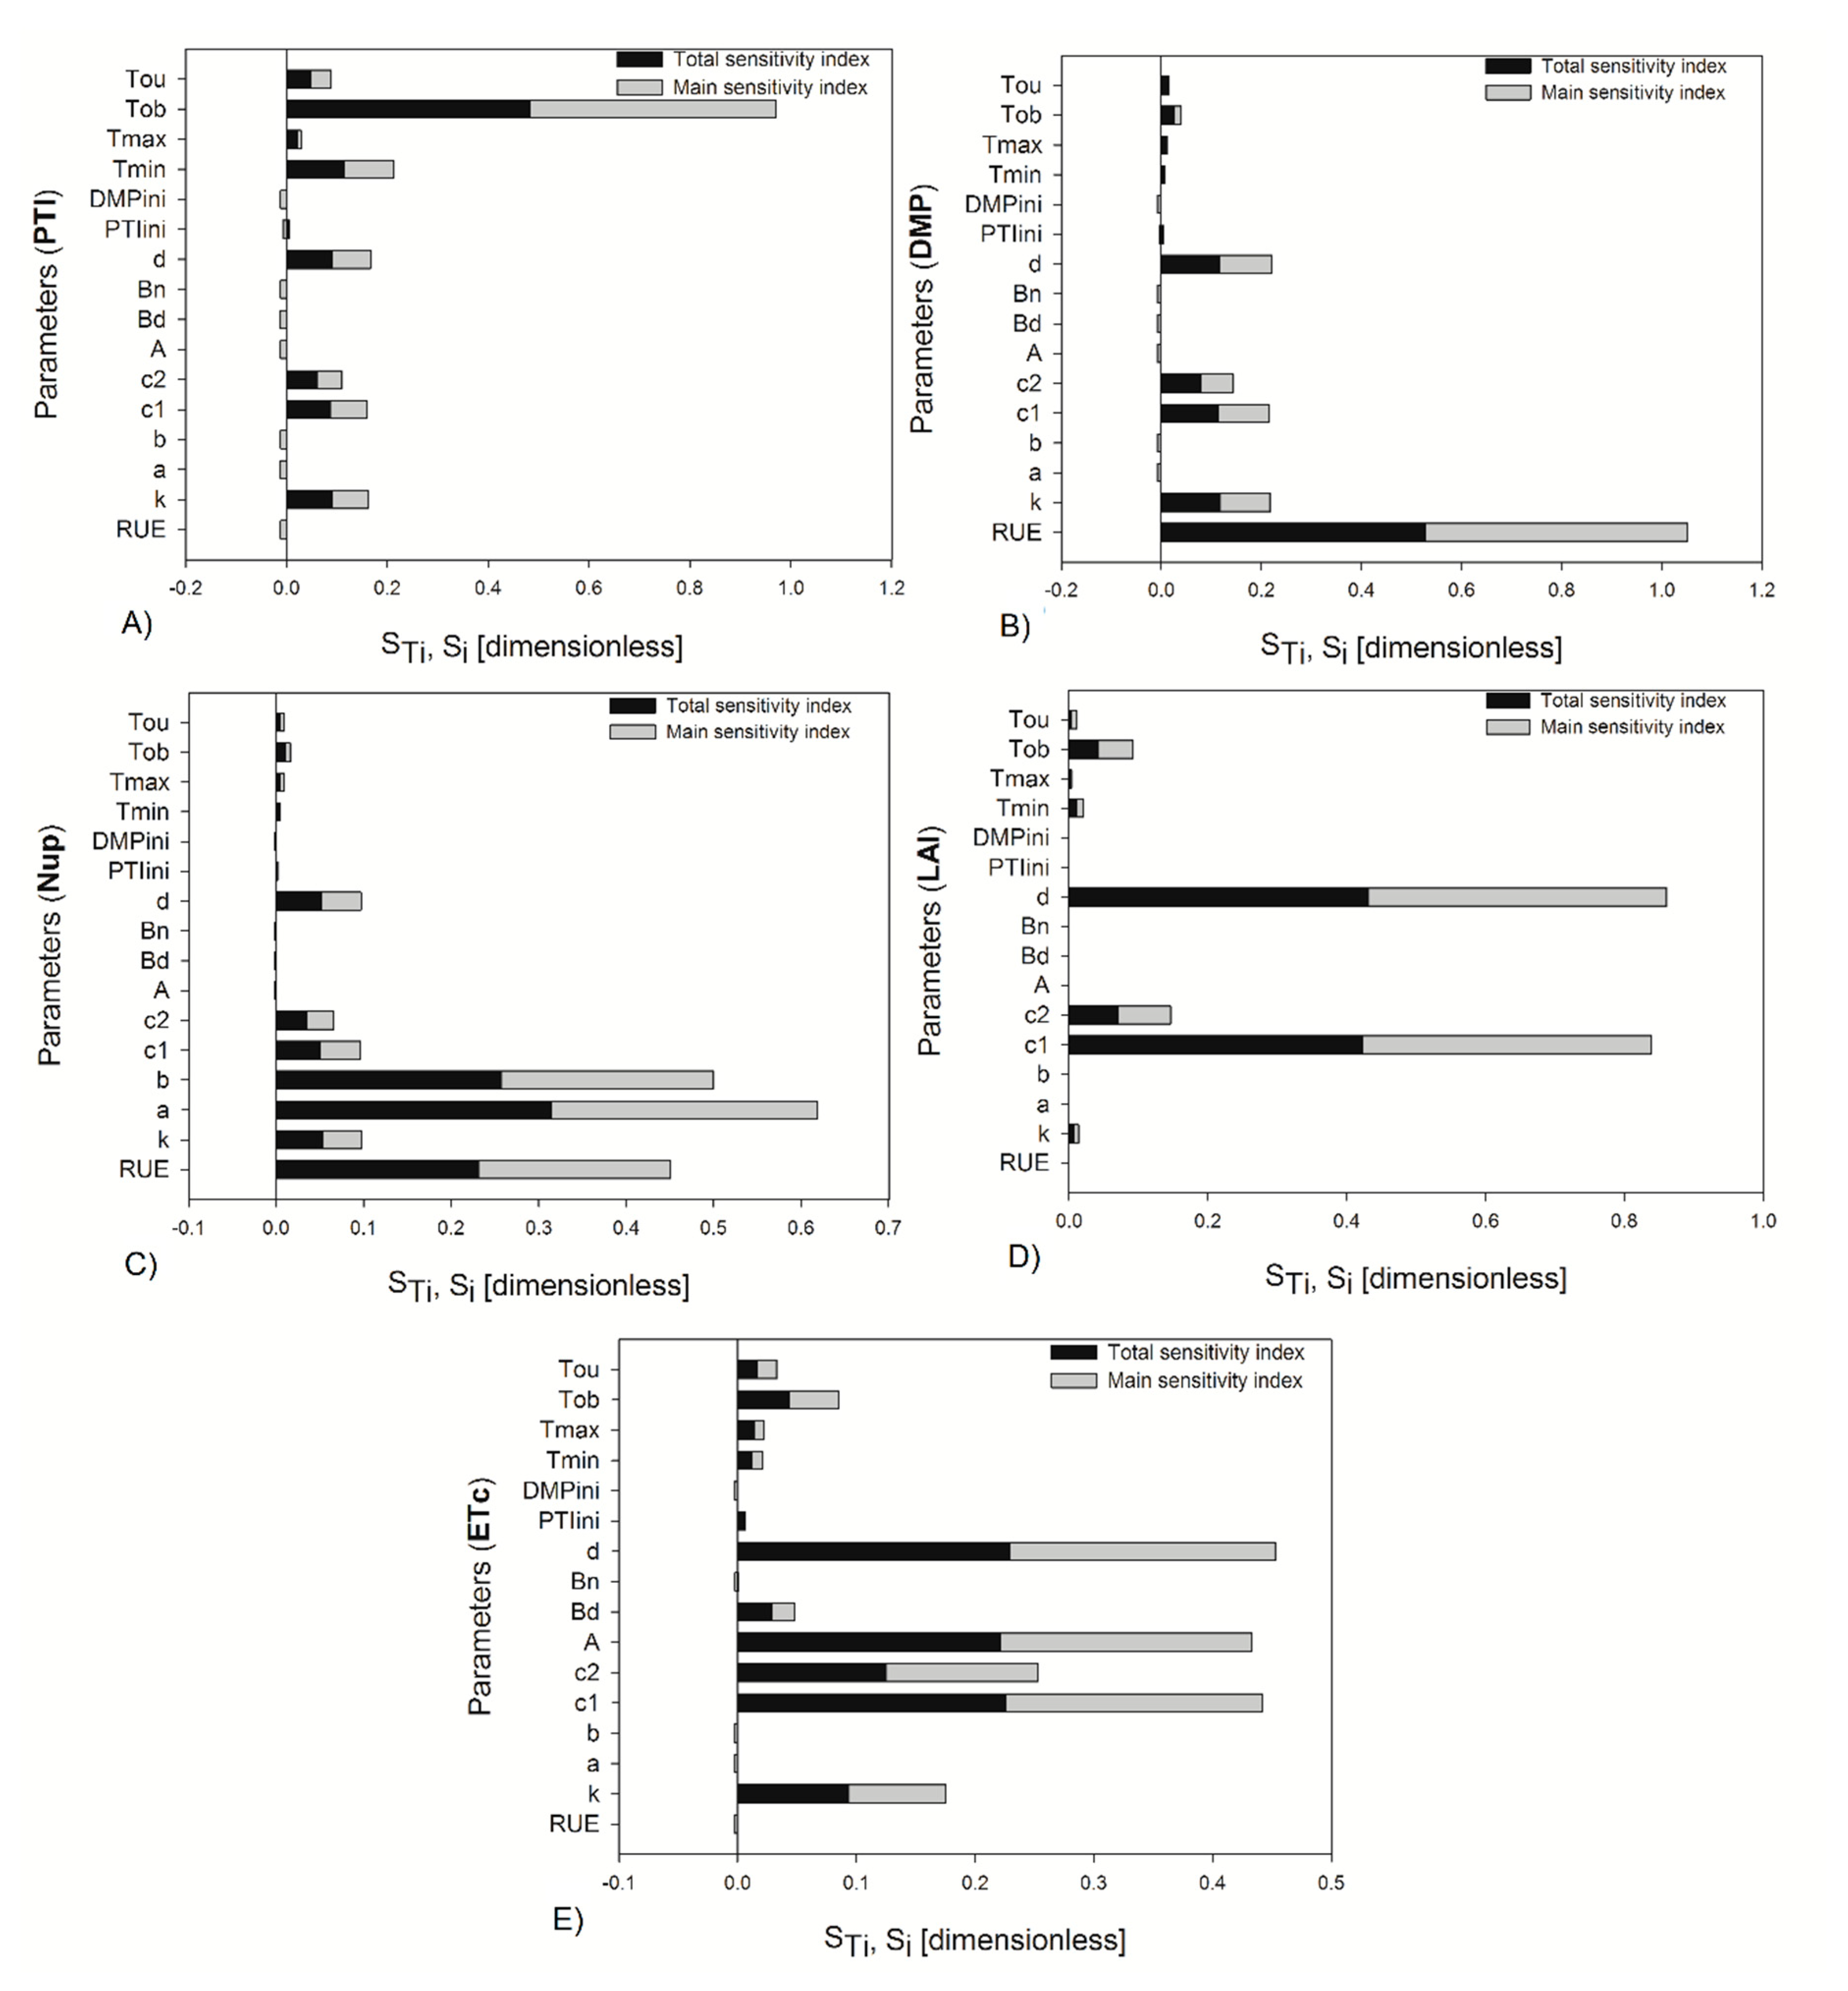
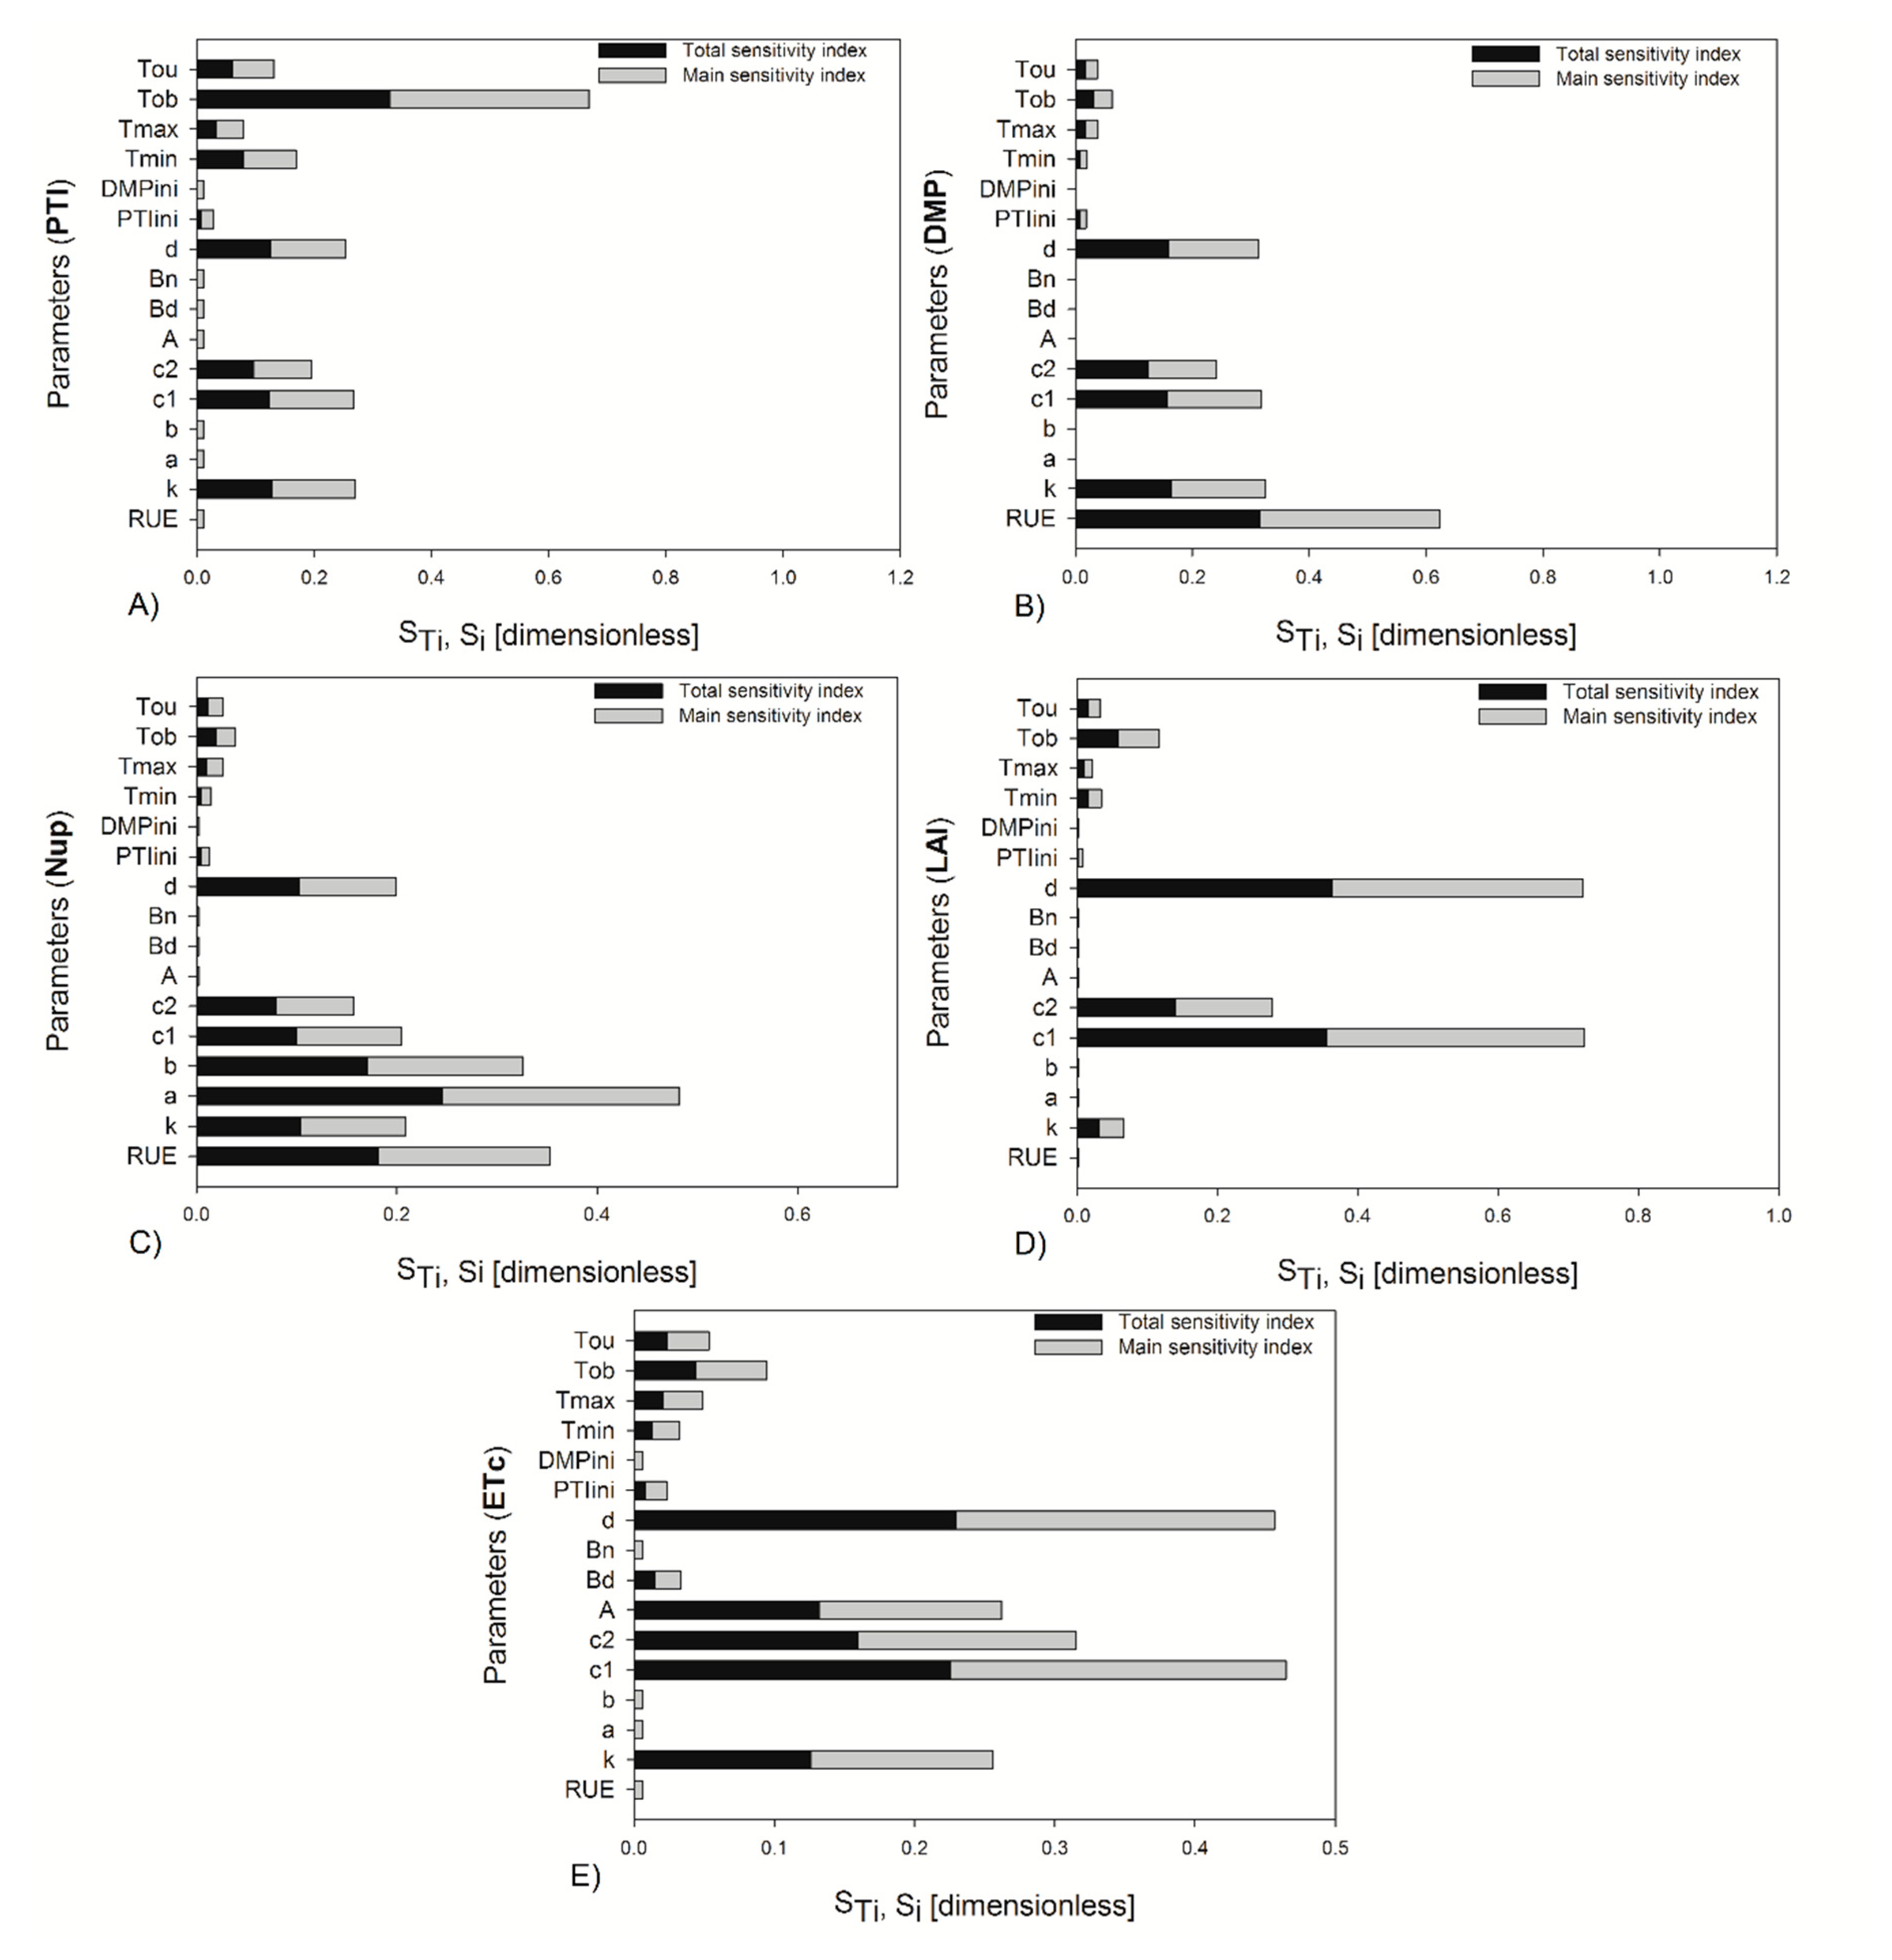
3.1. Sobol’s Sensitivity Analysis Method
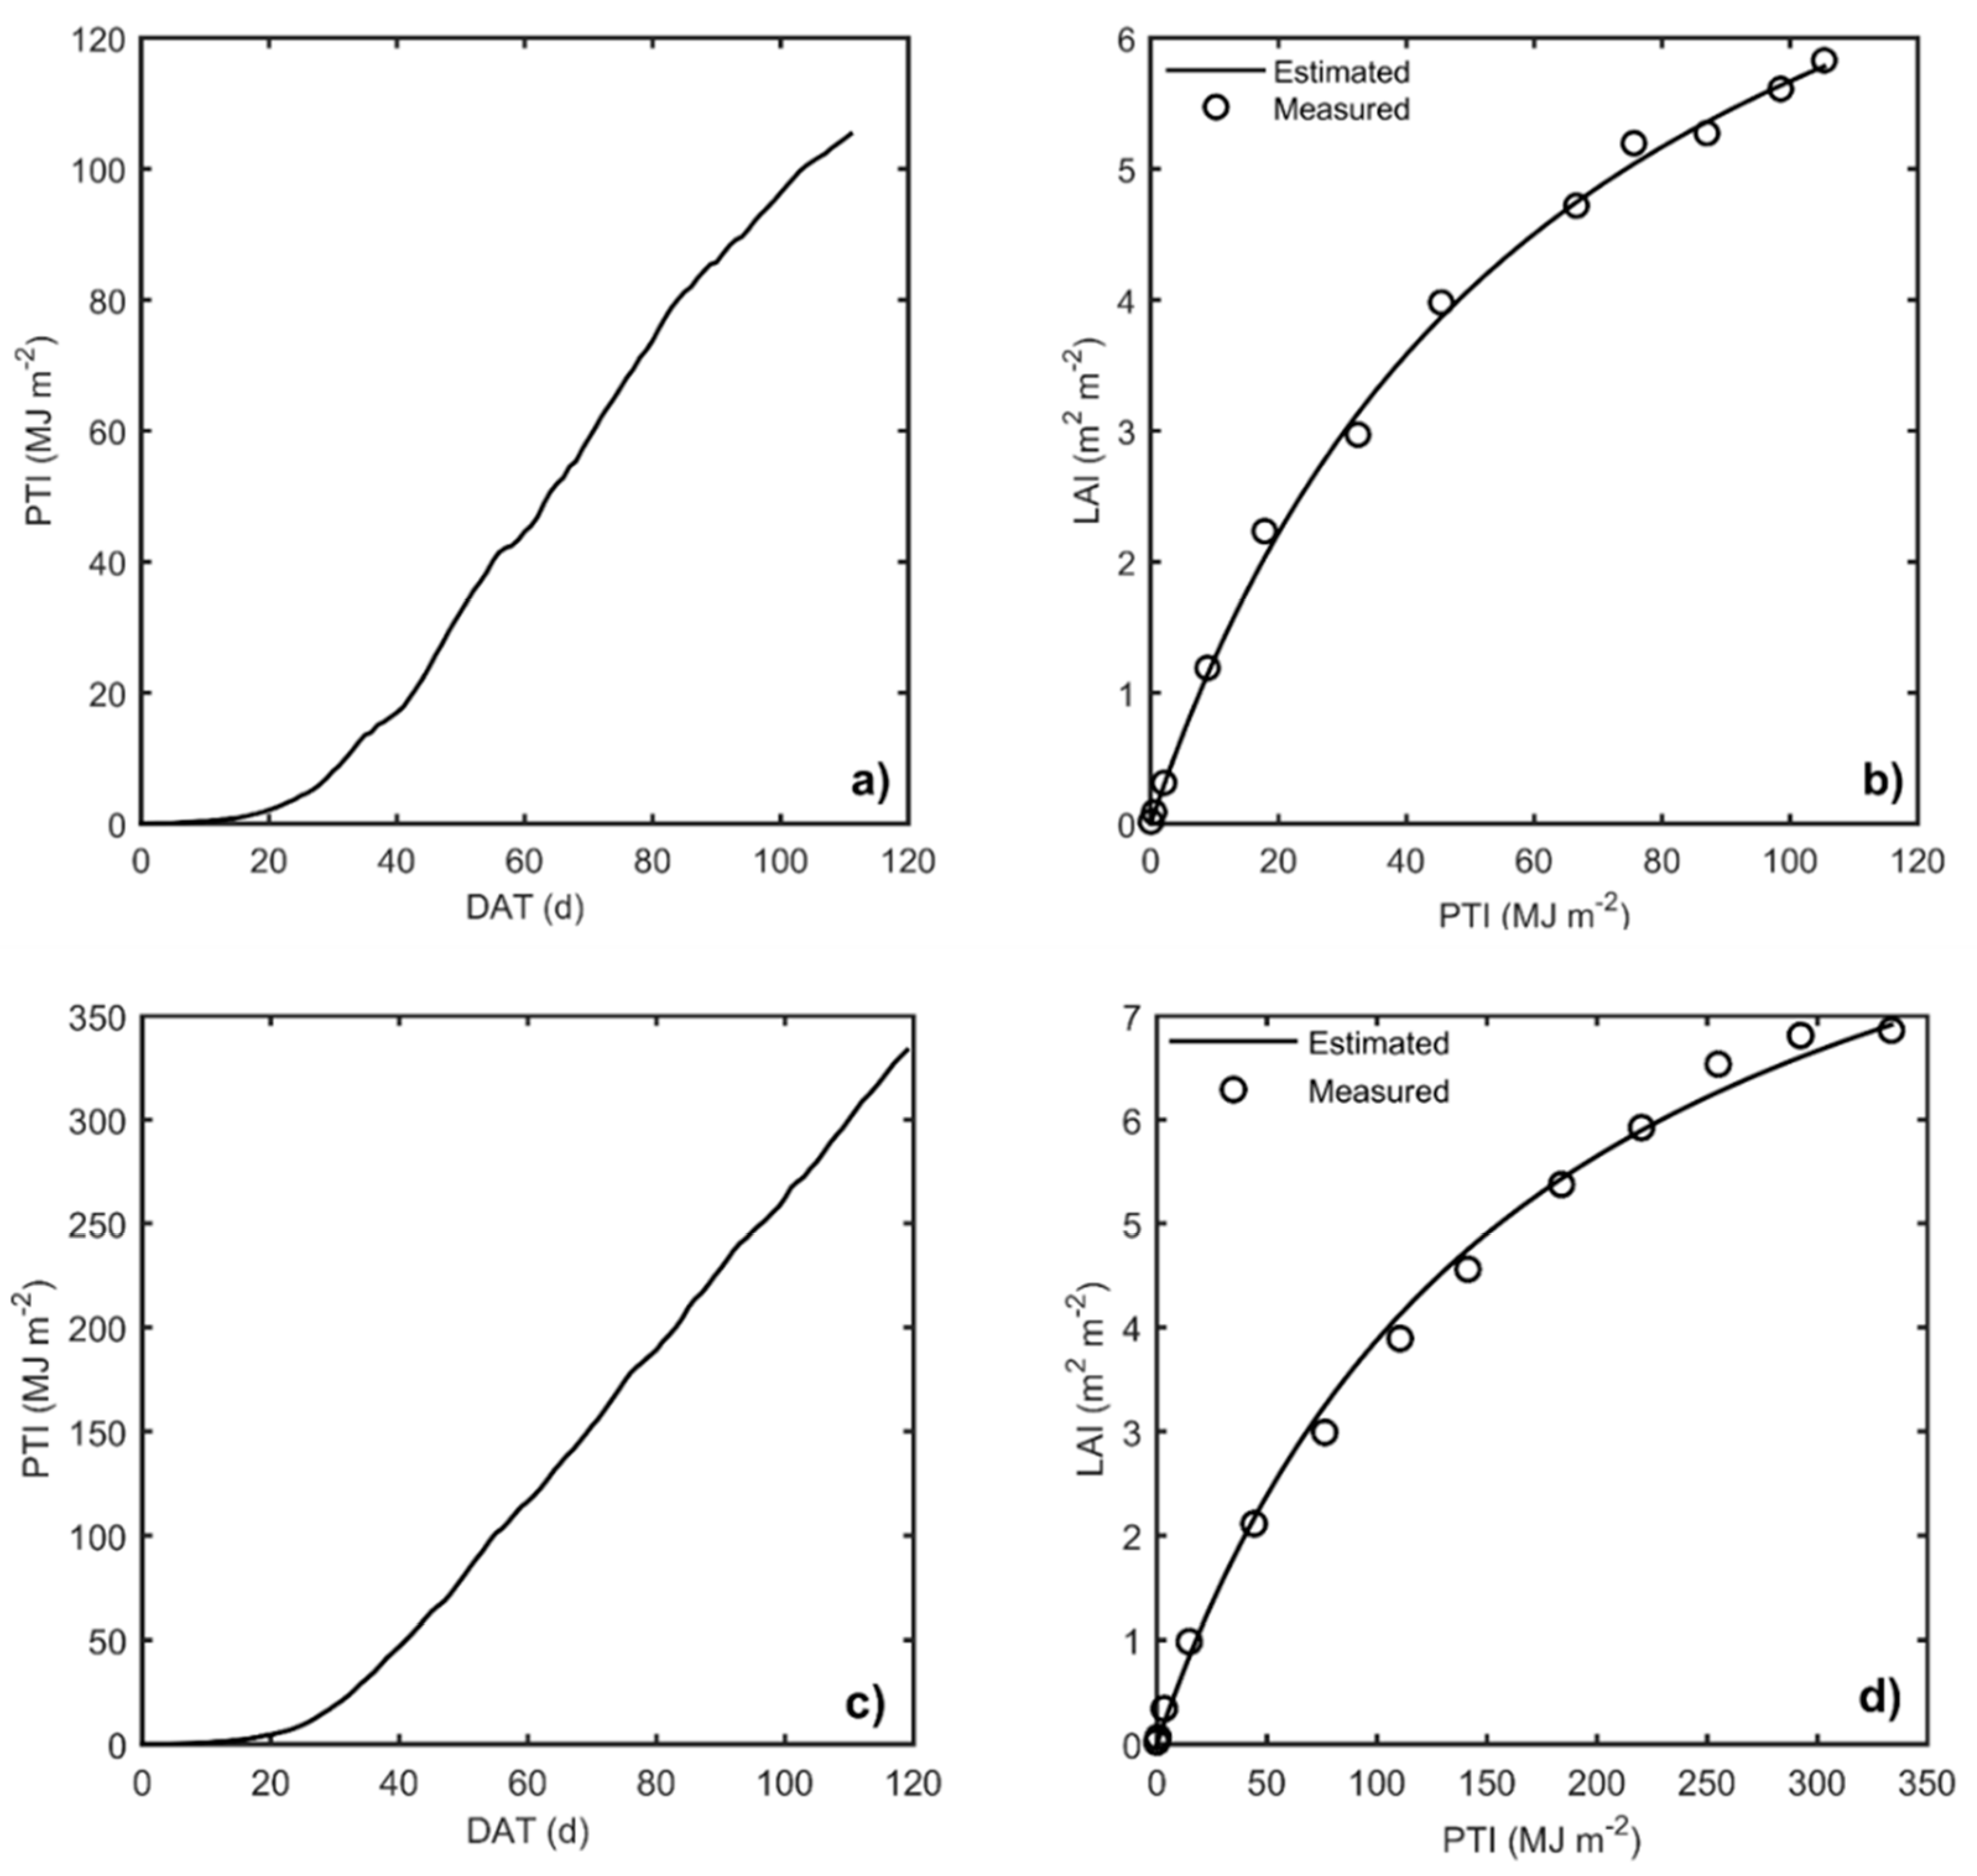
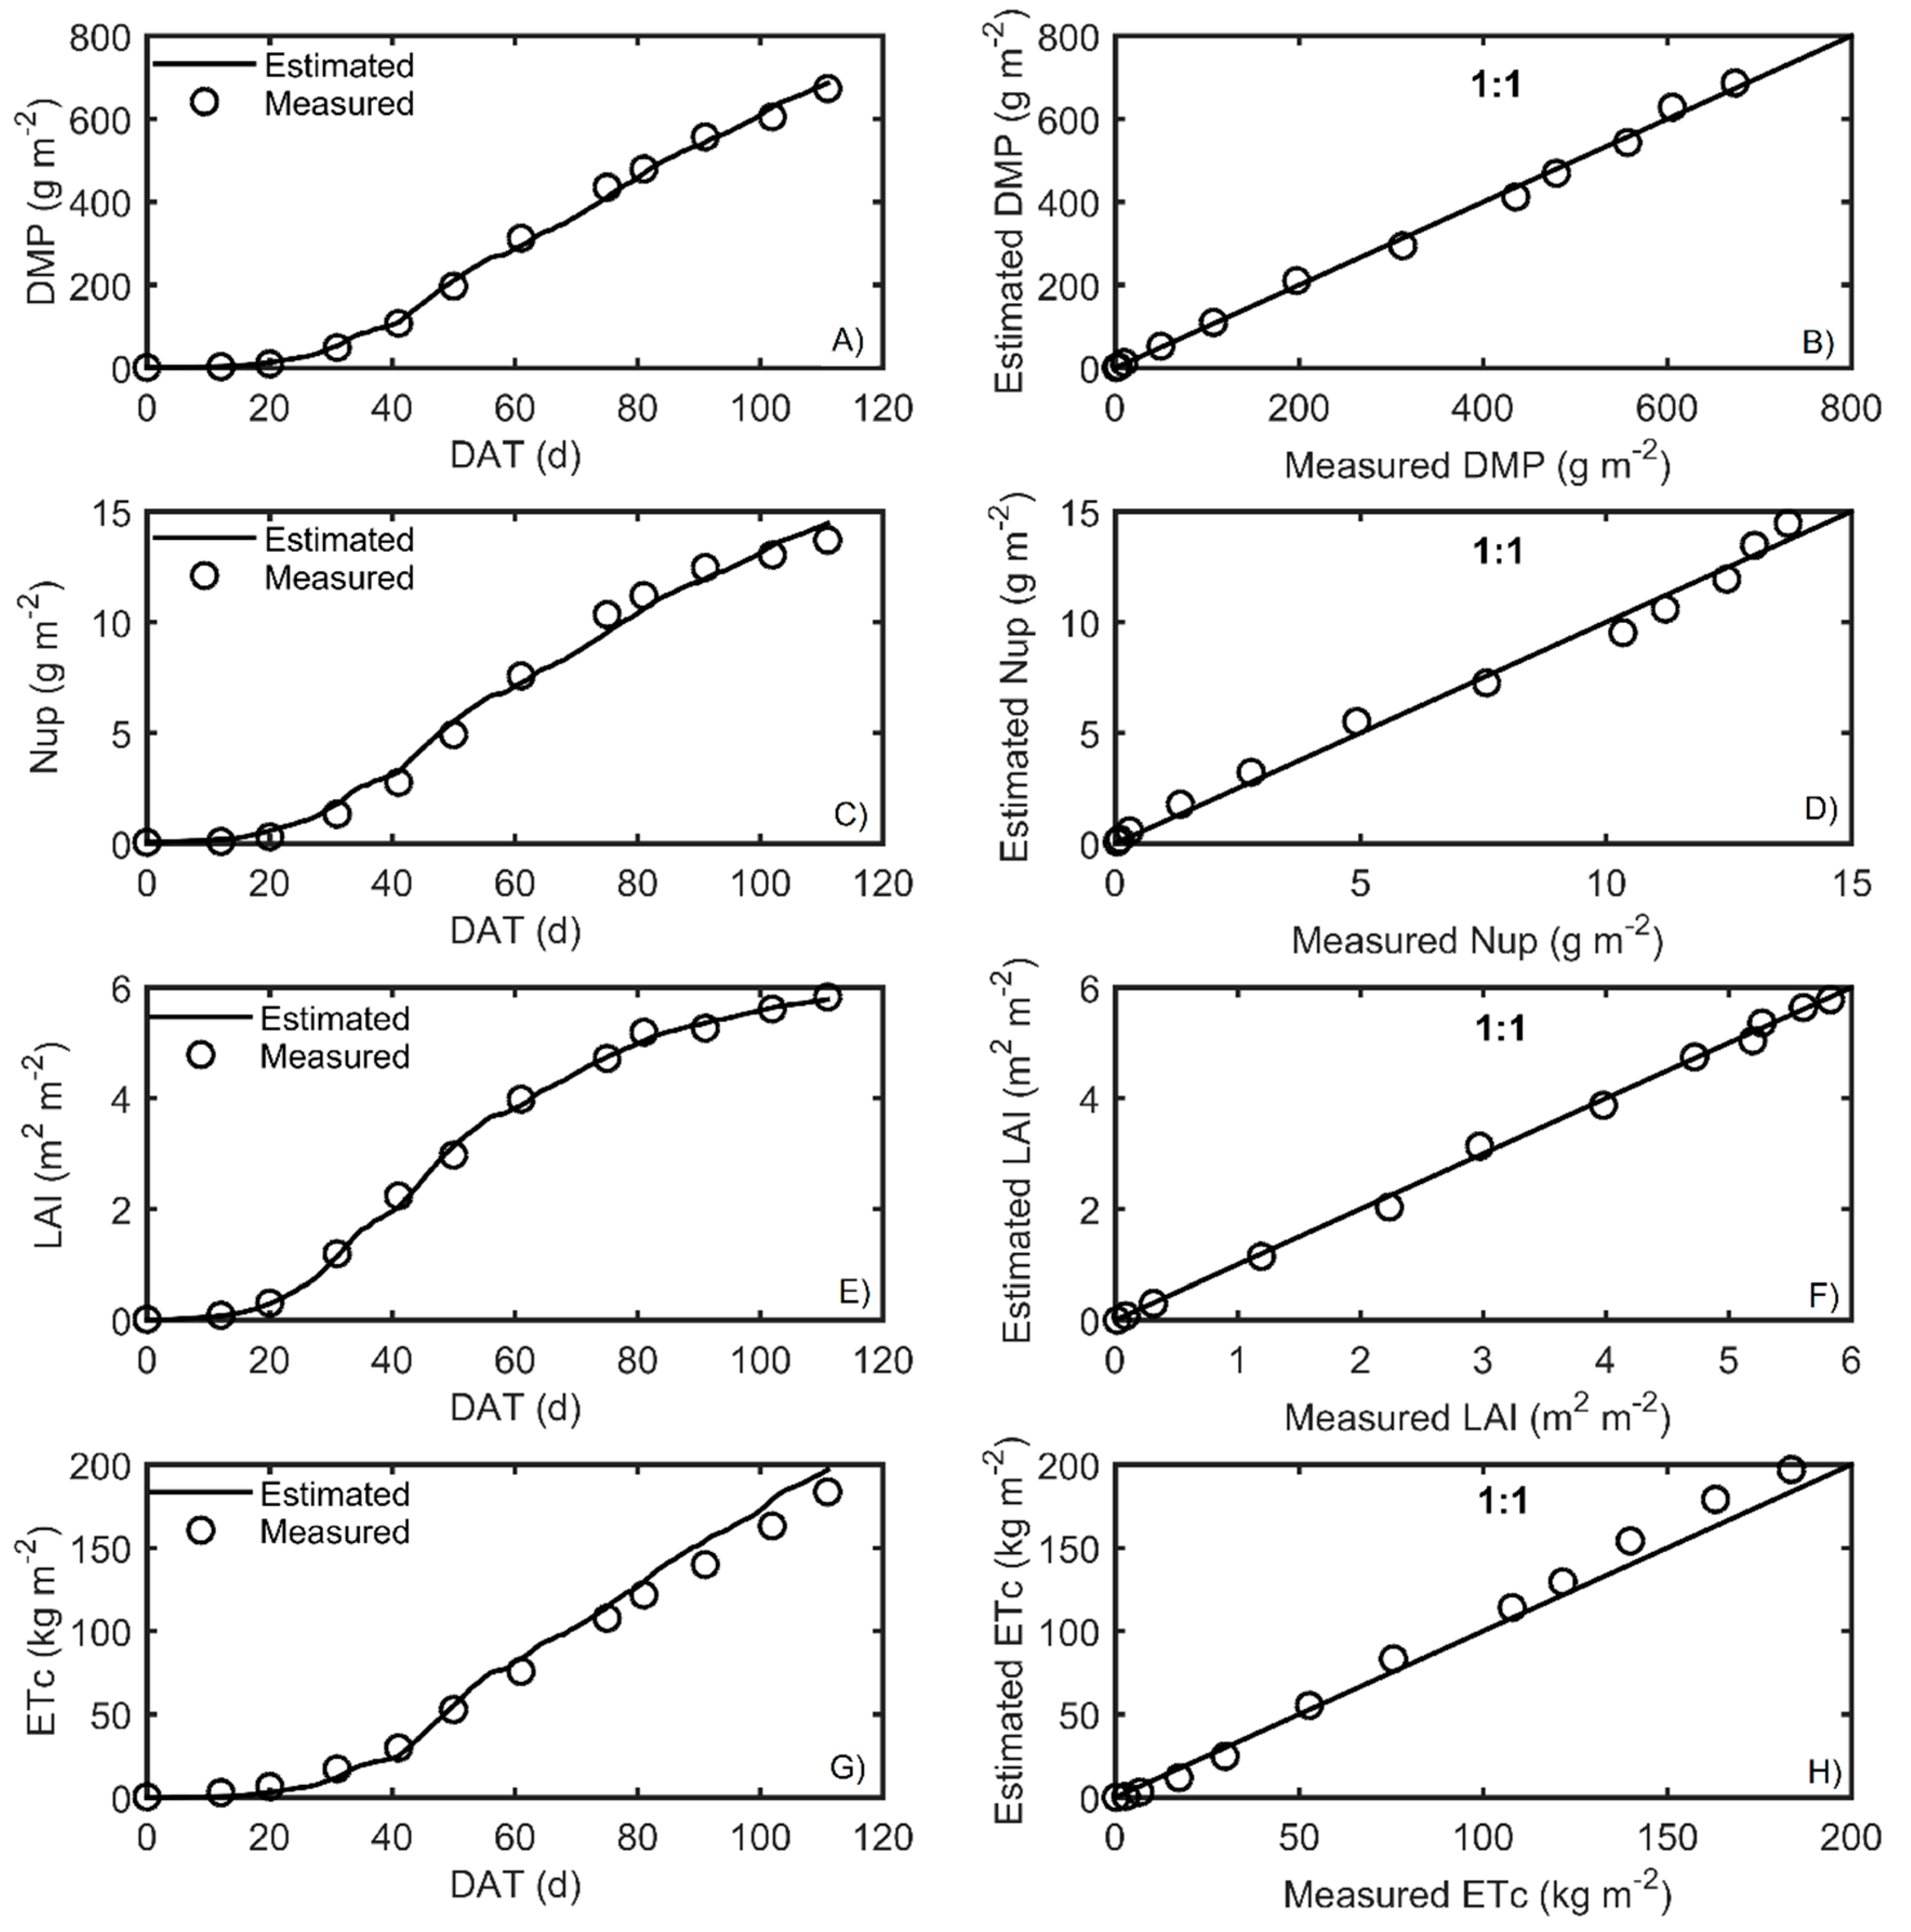
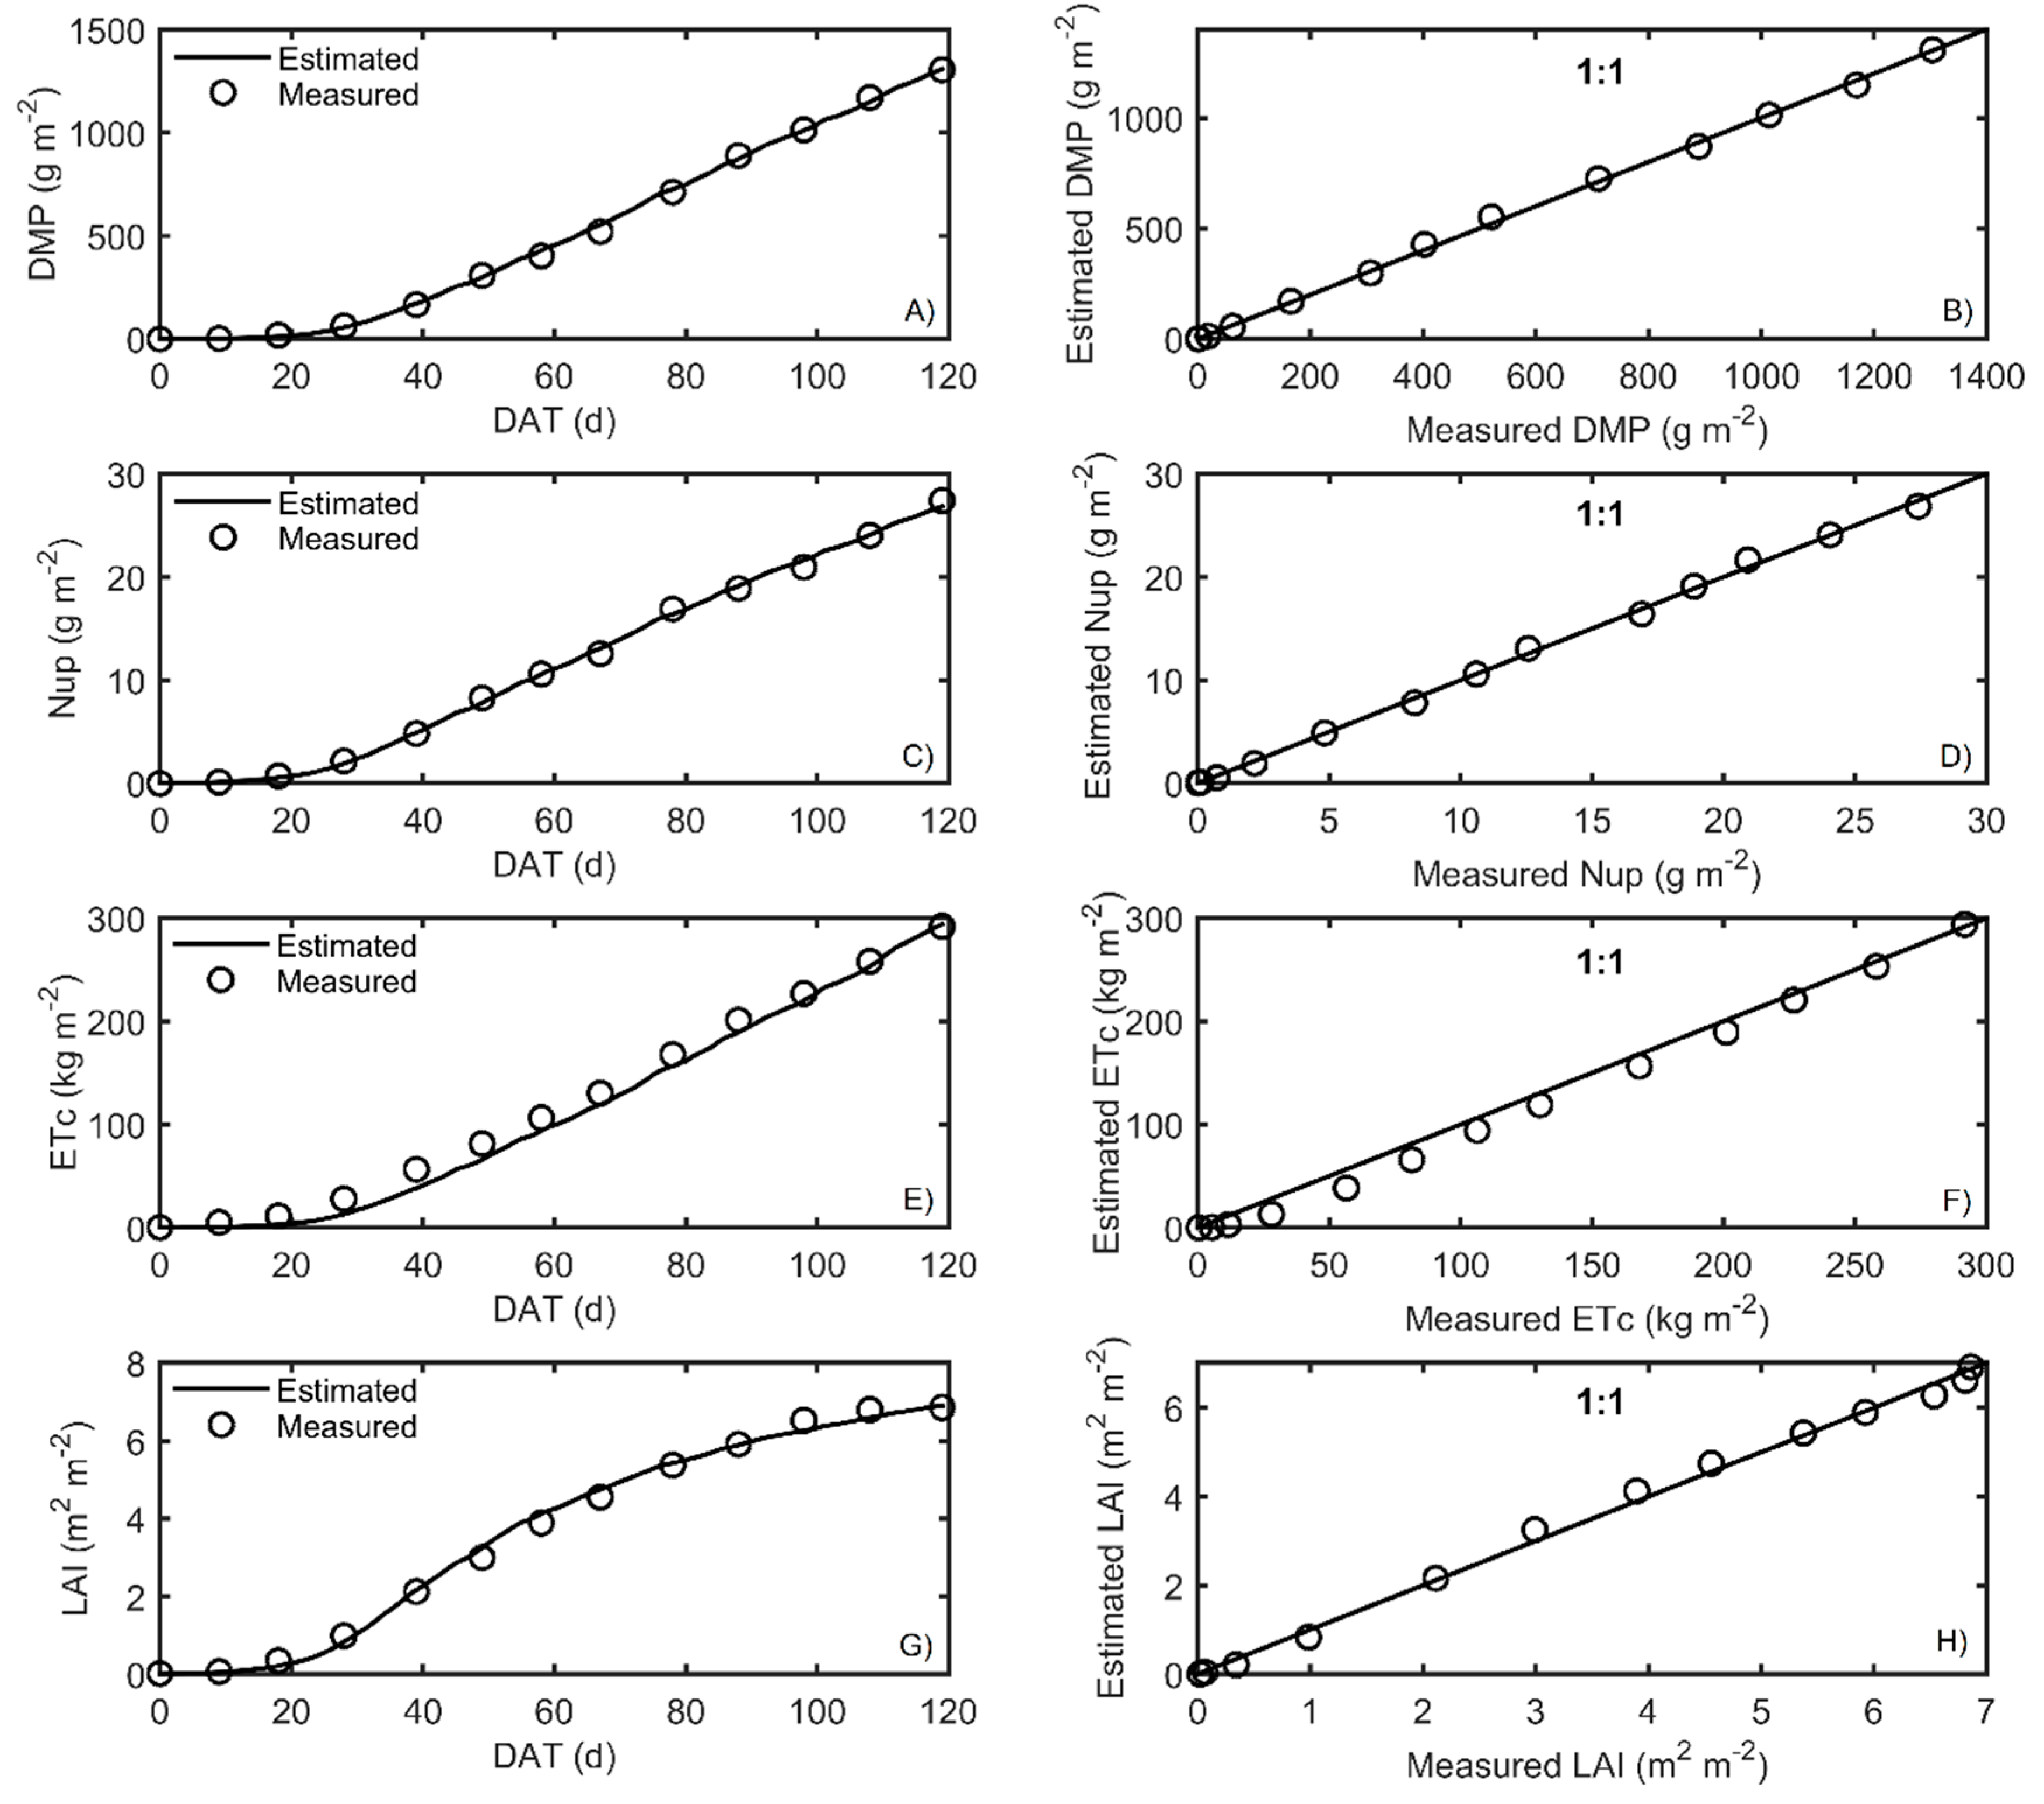
3.2. Calibration of HORTSYST Model by Differential Evolution Algorithm
4. Conclusions
Author Contributions
Funding
Institutional Review Board Statement
Informed Consent Statement
Data Availability Statement
Acknowledgments
Conflicts of Interest
References
- Saltelli, A.; Tarantola, S.; Campolongo, F.; Ratto, M. Sensitivity Analysis in Practice. A Guide to Assesing Scientific Models; John Wiley & Sons, Ltd.: Hoboken, NJ, USA, 2004; 219p. [Google Scholar]
- Saltelli, A.; Ratto, M.; Andres, T.; Campolongo, F.; Cariboni, J.; Gatelli, D.; Saisana, M.; Tarantola, S. Global Sensitivity Analysis. The Primer; John Wiley & Sons, Ltd.: Chichester, UK, 2008; 292p. [Google Scholar] [CrossRef]
- Cooman, A.; Schrevens, E. Sensitivity of the Tomgro Model to Solar Radiation Intensity, Air Temperature and Carbon Dioxide Concentration. Biosyst. Eng. 2007, 96, 249–255. [Google Scholar] [CrossRef]
- Cooman, A.; Schrevens, E. A Monte Carlo Approach for Estimating the Uncertainty of Predictions with the Tomato Plant Growth Model, Tomgro. Biosyst. Eng. 2006, 94, 517–524. [Google Scholar] [CrossRef]
- Saltelli, A.; Andres, T.H.; Homma, T. Sensitivity Analysis of Model Output. Performance of the Iterated Fractional Factorial Design Method. Comput. Stat. Data Anal. 1995, 20, 387–407. [Google Scholar] [CrossRef]
- Francesca, P.; Sarrazin, F.; Wagener, T. A Matlab Toolbox for Global Sensitivity Analysis. Environ. Modell. Softw. 2015, 70, 80–85. [Google Scholar] [CrossRef]
- Saltelli, A.; Ratto, M.; Tarantola, S.; Campolongo, F. Sensitivity analysis practices: Strategies for model-based inference. Reliab. Eng. Syst. Saf. 2006, 91, 1109–1125. [Google Scholar] [CrossRef]
- Morris, M.D. Factorial Sampling Plans for Preliminary Computational Experiments. Technometrics 1991, 33, 161–174. [Google Scholar] [CrossRef]
- Sobol, I.M. Sensitivity Analysis for Nonlinear Mathematical Models. Math. Modeling Comput. Exp. 1993, 1, 407–414. [Google Scholar]
- Saltelli, A.; Tarantola, S.; Chan, K.P.S. A Quantitative Model-Independent Method for Global Sensitivity Analysis of Model Output. Technometrics 1999, 41, 39–56. [Google Scholar] [CrossRef]
- van Straten, G. What Can Systems and Control Theory Do for Agricultural Science? Automatika 2008, 49, 105–117. [Google Scholar]
- Vazquez-Cruz, M.A.; Guzman-Cruz, R.; Lopez-Cruz, I.L.; Cornejo-Perez, O.; Torres-Pacheco, I.; Guevara-Gonzalez, R.G. Global Sensitivity Analysis by Means of EFAST and Sobol’ Methods and Calibration of Reduced State-Variable TOMGRO Model Using Genetic Algorithms. Comput. Electron. Agric. 2014, 100, 1–12. [Google Scholar] [CrossRef]
- Bhar, A.; Kumar, R.; Qi, Z.; Malone, R. Coordinate descent based agricultural model calibration and optimized input management. Comput. Electron. Agric. 2020, 105353. [Google Scholar] [CrossRef]
- Xu, X.; Sun, C.; Huang, G.; Mohanty, B.P. Global sensitivity analysis and calibration of parameters for a physically-based agro-hydrological model. Environ. Modell. Softw. 2016, 88–102. [Google Scholar] [CrossRef]
- Zúñiga, E.C.T.; Cruz, I.L.L.; García, A.R. Parameter estimation for crop growth model using evolutionary and bio-inspired algorithms. Appl. Soft Comput. 2014, 23, 474–482. [Google Scholar] [CrossRef]
- Yue, J.; Feng, H.; Li, Z.; Zhou, C.; Xu, K. Mapping winter-wheat biomass and grain yield based on a crop model and UAV remote sensing. Int. J. Remote Sens. 2021, 42, 1577–1601. [Google Scholar] [CrossRef]
- Dai, C.; Yao, M.; Xie, Z.; Chen, C.; Liu, J. Parameter Optimization for Growth Model of Greenhouse Crop Using Genetic Algorithms. Appl. Soft Comput. 2009, 9, 13–19. [Google Scholar] [CrossRef]
- Price, K.; Storn, R.M.; Lampinen, J.A. Differential Evolution: A Practical Approach to Global Optimization (Natural Computing Series). J. Hered. 2005, 104, 542. [Google Scholar]
- Storn, R.; Price, K. Differential Evolution—A Simple and Efficient Heuristic for Global Optimization over Continuous Spaces. J. Glob. Optim. 1997, 11, 341–359. [Google Scholar] [CrossRef]
- Katsoulas, N.; Peponakis, K.; Ferentinos, K.P.; Kittas, C. Calibration of a Growth Model for Tomato Seedlings (TOMSEED) Based on Heuristic Optimisation. Biosyst. Eng. 2015, 140, 34–47. [Google Scholar] [CrossRef]
- Martínez-Ruiz, A.; López-Cruz, I.L.; Ruiz-García, A.; Pineda-Pineda, J.; Prado-Hernández, J.V. HortSyst: A dynamic model to predict growth, nitrogen uptake, and transpiration of greenhouse tomatoes. Chil. J. Agric. Res. 2019, 79, 89–102. [Google Scholar] [CrossRef]
- Martínez-Ruiz, A.; López-Cruz, I.L.; Ruiz-García, A.; Ramírez-Arias, A. Calibración y validación de un modelo de transpiración para gestión de riegos de jitomate (Solanum lycopersicum L.) en invernadero. Rev. Mex. Cienc. Agric. 2012, 3, 757–766. [Google Scholar]
- Ezui, K.S.; Franke, A.C.; Leffelaar, P.A.; Mando, A.; van Heerwaarden, J.; Sanabria, J.M.S.J.; Giller, K.E. Water and radiation use efficiencies explain the effect of potassium on the productivity of cassava. Eur. J. Agron. 2017, 83, 28–39. [Google Scholar] [CrossRef]
- Debaeke, P.; van Oosterom, E.J.; Justes, E.; Champolivier, L.; Merrien, A.; Aguirrezabal, L.A.N.; Montemurro, F. A species-specific critical nitrogen dilution curve for sunflower (Helianthus annuus L.). Field Crop. Res. 2012, 136, 76–84. [Google Scholar] [CrossRef]
- Gallardo, M.; Fernandez, M.D.; Gimenez, C.; Padilla, F.M.; Thompson, R.B. Revised VegSyst Model to Calculate Dry Matter Production, Critical N Uptake and ETc of Several Vegetable Species Grown in Mediterranean Greenhouses. Agric. Syst. 2016, 146, 30–43. [Google Scholar] [CrossRef]
- Pineda-Pineda, J.; Ramírez-Arias, A.; Sánchez del Castillo, F.; Castillo-Gonzáles, A.M.; Valdez-Aguilar, L.A.; Vargas-Canales, J.M. Extraction and nutrient efficiency during the vegetative growth of tomato under hydroponics conditions. Acta Hortic. 2009, 893, 997–1005. [Google Scholar] [CrossRef]
- Sáez-Plaza, P.; Navas, M.J.; Wybraniec, S.; Michałowski, T.; Asuero, A.G. An overview of the Kjeldahl method of nitrogen determination. Part II. Sample preparation, working scale, instrumental finish, and quality control. Crit. Rev. Anal. Chem. 2013, 43, 224–272. [Google Scholar] [CrossRef]
- Gallardo, M.; Giménez, C.; Martínez-Gaitán, C.; Stöckle, C.O.; Thompson, R.B.; Granadosd, M.R. Evaluation of the VegSyst Model with Muskmelon to Simulate Crop Growth, Nitrogen Uptake and Evapotranspiration. Agric. Water Manag. 2011, 101, 107–117. [Google Scholar] [CrossRef]
- Giménez, C.; Gallardo, M.; Martínez-Gaitán, C.; Stöckle, C.O.; Thompson, R.B.; Granados, M.R. VegSyst, a Simulation Model of Daily Crop Growth, Nitrogen Uptake and Evapotranspiration for Pepper Crops for Use in an on-Farm Decision Support System. Irrig. Sci. 2013, 31, 465–477. [Google Scholar] [CrossRef]
- Gallardo, M.; Thompson, R.B.; Giménez, C.; Padilla, F.M.; Stöckle, C.O. Prototype Decision Support System Based on the VegSyst Simulation Model to Calculate Crop N and Water Requirements for Tomato under Plastic Cover. Irrig. Sci. 2014, 32, 237–253. [Google Scholar] [CrossRef]
- Kang, M.Z.; Cournède, P.H.; de Reffye, P.; Auclair, D.; Hu, B.G. Analytical Study of a Stochastic Plant Growth Model: Application to the GreenLab Model. Math. Comput. Simul. 2008, 78, 57–75. [Google Scholar] [CrossRef]
- Lemaire, S.; Maupas, F.; Cournède, P.; de Reffye, P. A Morphogenetic Crop Model for Sugar-Beet (Beta Vulgaris L.). Int. Symp. Crop Modeling Decis. Support 2008, 5, 19–22. [Google Scholar] [CrossRef]
- De Reffye, P.; Heuvelink, E.; Guo, Y.; Hu, B.G.; Zhang, B.G. Coupling Process-Based Models and Plant Architectural Models: A Key Issue for Simulating Crop Production. Crop Modeling Decis. Support 2009, 4, 130–147. [Google Scholar] [CrossRef]
- Shibu, M.E.; Leffelaar, P.A.; van Keulen, H.; Aggarwal, P.K. LINTUL3, a Simulation Model for Nitrogen-Limited Situations: Application to Rice. Eur. J. Agron. 2010, 32, 255–271. [Google Scholar] [CrossRef]
- Soltani, A.; Sinclair, T.R. Modeling Physiology of Crop Development, Growth and Yield; CABI Publication: Wallingford, UK, 2012; 322p. [Google Scholar] [CrossRef]
- Dai, J.; Luo, W.; Li, Y.; Yuan, C.; Chen, Y.; Ni, J. A Simple Model for Prediction of Biomass Production and Yield of Three Greenhouse Crops. Acta Hortic. 2006, 718, 81–88. [Google Scholar] [CrossRef]
- Xu, R.; Dai, J.; Luo, W.; Yin, X.; Li, Y.; Tai, X. A Photothermal Model of Leaf Area Index for Greenhouse Crops. Agric. For. Meteorol. 2010, 150, 541–552. [Google Scholar] [CrossRef]
- Tei, F.; Benincasa, P.; Guiducci, M. Effect of n availability on growth, n uptake, light interception and photosynthetic activity in processing tomato. Acta Hortic. 2002, 209–216. [Google Scholar] [CrossRef]
- Saltelli, A.; Tarantola, S.; Campolongo, F. Sensitivity Analysis as an Ingredient of Modeling. Stat. Sci. 2000, 15, 377–395. [Google Scholar]
- Chu, J.-X.; Sun, Z.-F.; Du, K.-M.; Jia, Q.; Liu, S. Establishment of Dynamic Model for the Nutrient Uptake and Development about Tomato in Greenhouse. Crop Modeling Decis. Support 2009, 54–58. [Google Scholar] [CrossRef]
- Peet, M.M.; Welles, G. Greenhouse tomato production. Tomatoes 2005. [Google Scholar] [CrossRef]
- Challa, H.; Bakker, M.J. Potential production within the greenhouse environment. Greenh. Ecosyst. 1999, 20, 333–348. [Google Scholar]
- Sánchez, J.A.; Rodríguez, F.; Guzmán, J.L.; Ruiz Arahal, M.; Fernández, M.D. Modelling of Tomato Crop Transpiration Dynamics for Designing New Irrigation Controllers. Acta Hortic. 2011, 893, 729–737. [Google Scholar] [CrossRef]
- Monod, H.; Naud, C.; Makowski, D. Uncertainty and Sensitivity Analysis for Crop Models. Work. Dyn. Crop Models Eval. Anal. Parameterization Appl. 2006, 4, 55–100. [Google Scholar]
- Helton, J.C.; Davis, F.J.; Johnson, J.D. A Comparison of Uncertainty and Sensitivity Analysis Results Obtained with Random and Latin Hypercube Sampling. Eng. Syst. Saf. 2005, 89, 305–330. [Google Scholar] [CrossRef]
- Janon, A.; Klein, T.; Lagnoux, A.; Nodet, M.; Prieur, C. Asymptotic Normality and Efficiency of Two Sobol Index Estimators. ESAIM Probab. Stat. 2014, 18, 342–364. [Google Scholar] [CrossRef]
- Xuan, S.; Shi, C.; Liu, Y.; Zhang, W.; Cao, H.; Xue, C. Parameter Estimation for a Rice Phenology Model Based on the Differential Evolution Algorithm. In Proceedings of the 2016 IEEE International Conference on Functional-Structural Plant Growth Modeling, Simulation, Visualization and Applications (FSPMA), Qingdao, China, 7–11 November 2016; pp. 224–227. [Google Scholar]
- Chakraborty, U. Advances in Differential Evolution. The development and application of the differential evolution (DE); Springer: Berlin/Heidelberg, Germany, 2008; pp. 319–333. [Google Scholar]
- Das, S.; Suganthan, P.N. Differential Evolution: A Survey of the State-of-the-Art. IEEE Trans. Evol. Comput. 2011, 15, 4–31. [Google Scholar] [CrossRef]
- Guzmán-Cruz, R.; Castañeda-Miranda, R.; García-Escalante, J.J.; López-Cruz, I.L.; Lara-Herrera, A.; De la Rosa, J.I. Calibration of a Greenhouse Climate Model Using Evolutionary Algorithms. Biosyst. Eng. 2009, 104, 135–142. [Google Scholar] [CrossRef]
- Wallach, D.; Makowski, D.; Jones, J.W.; Brun, F. Working with Dynamic Crop Models. Methods, Tools and Examples for Agriculture and Environment; Academic Press: Cambridge, MA, USA, 2014; 504p. [Google Scholar] [CrossRef]
- López-Cruz, I.L.; Salazar-Moreno, R.; Rojano-Aguilar, A.; Ruiz-García, A. Análisis de Sensibilidad Global de Un Modelo de Lechugas (Lactuca Sativa L.) Cultivadas En Invernadero. Agrociencia 2012, 46, 383–397. [Google Scholar]
- López-Cruz, I.L.; Rojano-Aguilar, A.; Salazar-Moreno, R.; López-López, R. Análisis de Sensibilidad Global Del Modelo de Cultivos Sucros Aplicado a Tomate de Cáscara. Rev. Fitotec. Mex. 2014, 37, 279–288. [Google Scholar] [CrossRef]
- Wang, J.; Li, X.; Lu, L.; Fang, F. Parameter Sensitivity Analysis of Crop Growth Models Based on the Extended Fourier Amplitude Sensitivity Test Method. Environ. Model. Softw. 2013, 48, 171–182. [Google Scholar] [CrossRef]
- De Jonge, K.C.; Ascough, J.C.; Ahmadi, M.; Andales, A.A.; Arabi, M. Global Sensitivity and Uncertainty Analysis of a Dynamic Agroecosystem Model under Different Irrigation Treatments. Ecol. Model. 2012, 231, 113–125. [Google Scholar] [CrossRef]
- Dzotsi, K.A.; Basso, B.; Jones, J.W. Development, Uncertainty and Sensitivity Analysis of the Simple SALUS Crop Model in DSSAT. Ecol. Model. 2013, 260, 62–76. [Google Scholar] [CrossRef]
- Makowski, D.; Naud, C.; Jeuffroy, M.H.; Barbottin, A.; Monod, H. Global Sensitivity Analysis for Calculating the Contribution of Genetic Parameters to the Variance of Crop Model Prediction. Reliab. Eng. Syst. Saf. 2006, 91, 1142–1147. [Google Scholar] [CrossRef]
- Sánchez, J.A. Modelado de la transpiración de un cultivo de tomate bajo invernadero para el diseño de sistemas de control de riego. In XXIX Jornadas de Automática; España: Tarragona, Spain, 2008; 8p. [Google Scholar]


| Variable | Definition | Equation | Units |
|---|---|---|---|
| Photo–thermal time | |||
| Dry matter production | |||
| Nitrogen uptake | |||
| Daily crop transpiration | |||
| Daily photo–thermal time | |||
| Normalized thermal time | |||
| PAR | |||
| Daily dry matter production | |||
| Intercepted PAR fraction | |||
| Leaf area index | |||
| Nitrogen content | |||
| Daily nitrogen uptake | |||
| Hourly transpiration | |||
| Daily evapotranspiration |
| No | Parameter | Symbol | Range 10% | Range 20% | Reference |
|---|---|---|---|---|---|
| 1 | Top upper temperature (°C) | Tmax | 31.50–38.50 | 28.40–42.00 | [40] |
| 2 | Top bottom temperature (°C) | Tmin | 9.00–11.00 | 8.00–12.00 | [40] |
| 3 | Optimum minimum temperature (°C) | Tob | 15.30–18.70 | 13.60–19.80 | [41] |
| 4 | Optimum maximum temperature (°C) | Tou | 21.60–26.40 | 19.80–28.40 | [41] |
| 5 | Radiation use efficiency (g MJ−1) | RUE | 2.79–3.41 | 2.48–3.72 | [30,42] |
| 6 | Extinction coefficient | k | 0.58–0.70 | 0.51–0.77 | |
| 7 | N concentration in the dry biomass at the end of the exponential growth period (g m−2) | a | 6.79–8.31 | 6.04–9.06 | [30] |
| 8 | Is the slope of the nitrogen uptake vs. dry biomass production function | b | −0.17–(−0.14) | −0.18–(0.12) | [30] |
| 9 | Slope of the curve (m−2) | c1 | 2.76–3.38 | 2.46–3.68 | Estimated |
| 10 | Intersection coefficient | c2 | 158.08–193.2 | 140.51–210.77 | Estimated |
| 11 | Radiative coefficient | A | 0.44–0.54 | 0.39–0.59 | [43] |
| 12 | Aerodynamic coefficient during day (W m−2 kPa−1) | Bd | 10.08–12.32 | 8.96–13.44 | [43] |
| 13 | Aerodynamic coefficient during night (W m−2 kPa−1) | Bn | 7.45–9.11 | 6.62–9.94 | [43] |
| 14 | Initial photo–thermal time (MJ m−2) | PTIini | 0.06–0.07 | 0.05–0.07 | Measured |
| 15 | Initial dry matter production (g m−2) | DMPIni | 0.22–0.27 | 0.20–0.29 | Measured |
| 16 | Plant density (plants m−2) | d | 3.15–3.85 | 2.8–4.2 | Established |
| Climatic Variable | Autumn–Winter Season | Spring–Summer Season | ||||
|---|---|---|---|---|---|---|
| Minimum | Mean | Maximum | Minimum | Mean | Maximum | |
| (MJ m−2) | 0.88 | 3.99 | 8.89 | 5.40 | 10.59 | 14.18 |
| (°C) | 14.12 | 18.31 | 21.83 | 15.31 | 17.84 | 21.94 |
| (%) | 62.59 | 78.58 | 93.98 | 29.47 | 76.82 | 93.16 |
| Output Response | At the Beginning of Fructification | At the End of Crop Growth |
|---|---|---|
| Parameters (10% of variation) | ||
| PTI | , , ,, , | , |
| DMP | , , , , | , , , |
| Nup | , , , , , | , , |
| LAI | , , , , | , , |
| ETc | ,, , | , , , , |
| Parameters (20% of variation) | ||
| PTI | , , , , , , | , |
| DMP | , , , , | , , , |
| Nup | , , , , , | , , |
| LAI | , ,, , | , , |
| ETc | , ,, | , , , , |
| Parameters | Autumn–Winter | Spring–Summer | ||
|---|---|---|---|---|
| Nominal Values | Standard Deviations | Nominal Values | Standard Deviations | |
| PTIini | 0.03 | 0.01 (2.05 × 10⁻⁹) | 0.06 | 0.031 (4.58 × 10⁻⁹) |
| RUE | 4.01 | 4.79 (3.81 × 10⁻⁷) | 3.10 | 2.99 (2.10 × 10⁻⁷) |
| a | 7.55 | 5.89 (1.23 × 10⁻⁵) | 7.55 | 5.68 (7.34 × 10⁻⁶) |
| b | −0.15 | −0.19 (4.06 × 10⁻⁷) | −0.15 | −0.17 (2.23 × 10⁻⁷) |
| c1 | 2.82 | 2.65 (4.02 × 10⁻⁸) | 3.07 | 2.97 (3.52 × 10⁻⁸) |
| c2 | 74.66 | 63.46 (1.26 × 10⁻⁹) | 175.64 | 167.99 (8.85 × 10⁻¹³) |
| A | 0.30 | 0.63 (4.58 × 10⁻⁹) | 0.49 | 0.56 (2.40 × 10⁻⁹) |
| Bd | 18.70 | 28.57 (1.99 × 10⁻⁷) | 11.20 | 15.69 (2.18 × 10⁻⁷) |
| Bn | 8.50 | 4.73 (4.45) | 8.28 | 16.51 (6.13 × 10⁻⁷) |
| Outputs | Autumn–Winter | Spring–Summer | ||||
|---|---|---|---|---|---|---|
| Bias | RMSE | EF | Bias | RMSE | EF | |
| DMP | 0.41566 | 13.3133 | 0.9970 | −1.5437 | 14.7602 | 0.9989 |
| Nup | −0.0708 | 0.5004 | 0.9909 | 0.0287 | 0.3583 | 0.9980 |
| LAI | 0.0249 | 0.0989 | 0.9979 | −0.0007 | 0.1564 | 0.9962 |
| ETc | 3.6465 | 39.3297 | 0.8153 | 1.2918 | 28.2060 | 0.9581 |
Publisher’s Note: MDPI stays neutral with regard to jurisdictional claims in published maps and institutional affiliations. |
© 2021 by the authors. Licensee MDPI, Basel, Switzerland. This article is an open access article distributed under the terms and conditions of the Creative Commons Attribution (CC BY) license (http://creativecommons.org/licenses/by/4.0/).
Share and Cite
Martínez-Ruiz, A.; Ruiz-García, A.; Prado-Hernández, J.V.; López-Cruz, I.L.; Valencia-Islas, J.O.; Pineda-Pineda, J. Global Sensitivity Analysis and Calibration by Differential Evolution Algorithm of HORTSYST Crop Model for Fertigation Management. Water 2021, 13, 610. https://doi.org/10.3390/w13050610
Martínez-Ruiz A, Ruiz-García A, Prado-Hernández JV, López-Cruz IL, Valencia-Islas JO, Pineda-Pineda J. Global Sensitivity Analysis and Calibration by Differential Evolution Algorithm of HORTSYST Crop Model for Fertigation Management. Water. 2021; 13(5):610. https://doi.org/10.3390/w13050610
Chicago/Turabian StyleMartínez-Ruiz, Antonio, Agustín Ruiz-García, J. Víctor Prado-Hernández, Irineo L. López-Cruz, J. Olaf Valencia-Islas, and Joel Pineda-Pineda. 2021. "Global Sensitivity Analysis and Calibration by Differential Evolution Algorithm of HORTSYST Crop Model for Fertigation Management" Water 13, no. 5: 610. https://doi.org/10.3390/w13050610
APA StyleMartínez-Ruiz, A., Ruiz-García, A., Prado-Hernández, J. V., López-Cruz, I. L., Valencia-Islas, J. O., & Pineda-Pineda, J. (2021). Global Sensitivity Analysis and Calibration by Differential Evolution Algorithm of HORTSYST Crop Model for Fertigation Management. Water, 13(5), 610. https://doi.org/10.3390/w13050610