Supply and Demand Forecasting of Water Resource Coupling System in Upstream Yangtze River under Changing Environmental Conditions

Abstract
1. Introduction
2. Materials and Methods
2.1. Analytic Methods for Determining Available Water Supply
2.1.1. Runoff Simulation Method
- Select control sections and determine the basin boundary and river network based on digital elevation model (DEM) data.
- Resample DEM data into several grids at specific latitudes, and number them from west to east and north to south.
- Use ArcGIS to generate grid flow, and manually judge and adjust the resulting grid.
- Determine the distribution of soil type in the upper and lower layers in the control basin and calculate the proportion of different types of vegetation in each grid.
- Sort and interpolate the meteorological data sequence to each grid in the basin. Export the meteorological input file of the flow generation module of the VIC model, and determine the flow generation ratio of the boundary grid.
- Calibrate and test VIC model parameters.
- Select the global climate model and typical emission path to form an emission scenario. Take the downscaling data of meteorological compression in each emission scenario as the input value and run the calibrated VIC model to simulate the future runoff sequence of the basin.
2.1.2. Available Water Supply Forecasting Method
2.2. Water Demand Forecasting Method
- Analyze social and economic factors variation under macro regulation.
- Analyze water use index variation under macro regulation.
- Forecast water demand based on the results of steps 1 and 2.
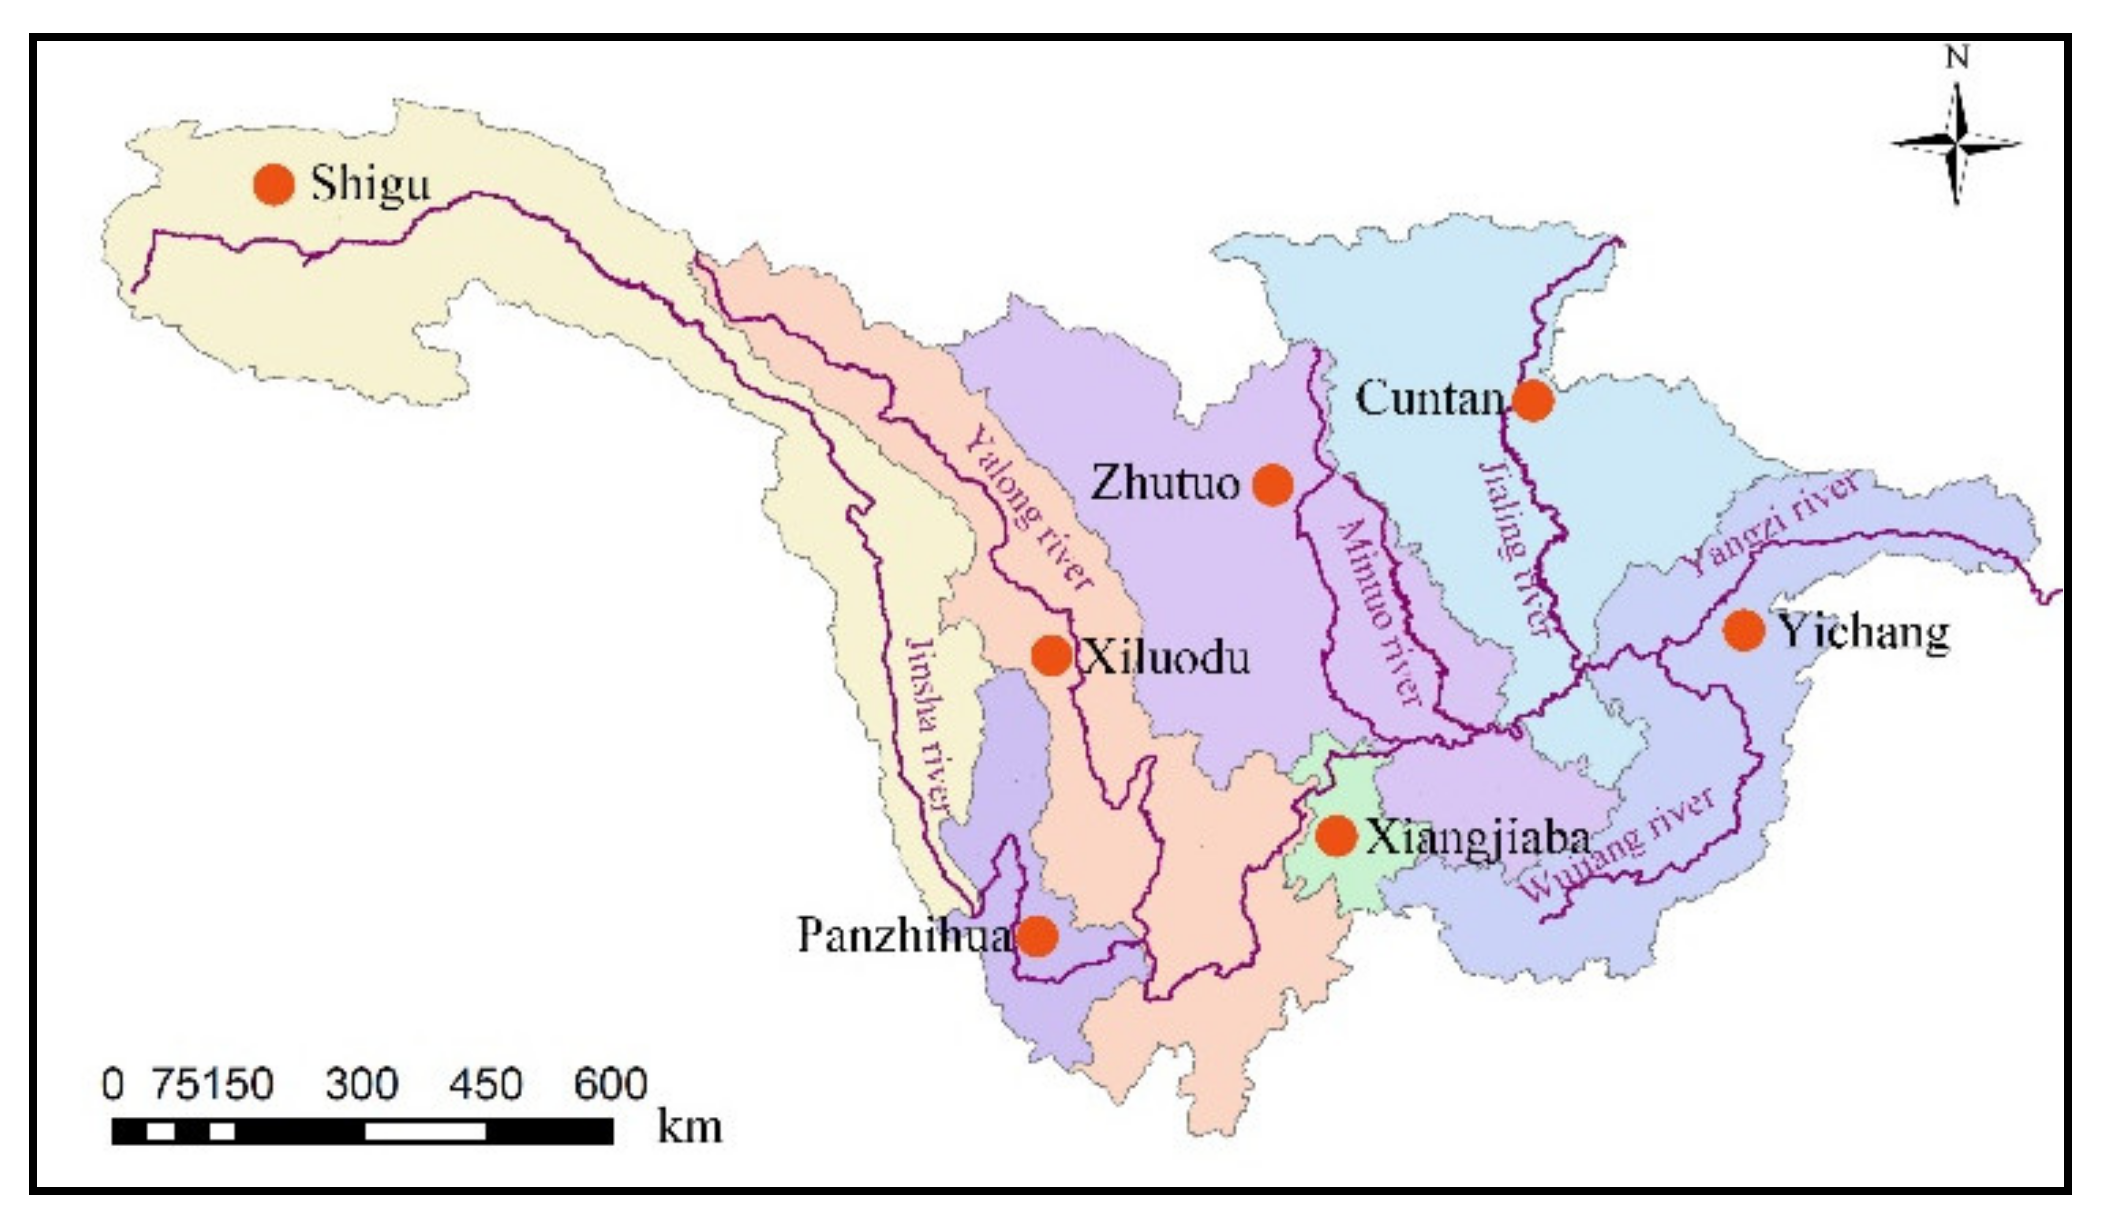
3. Study Area
4. Results and Discussion
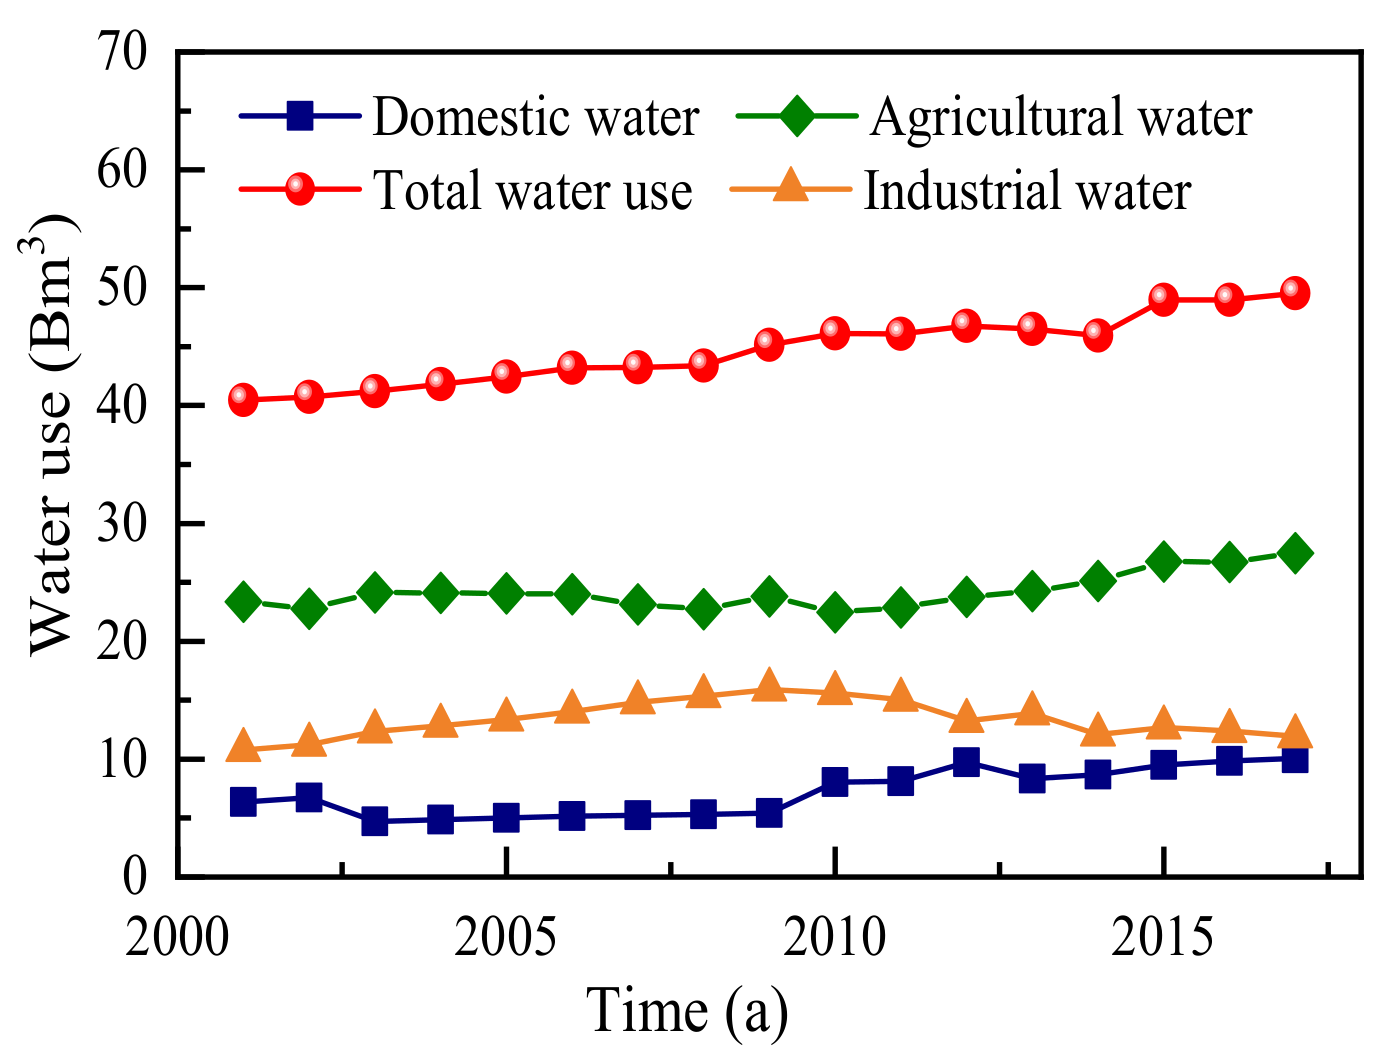
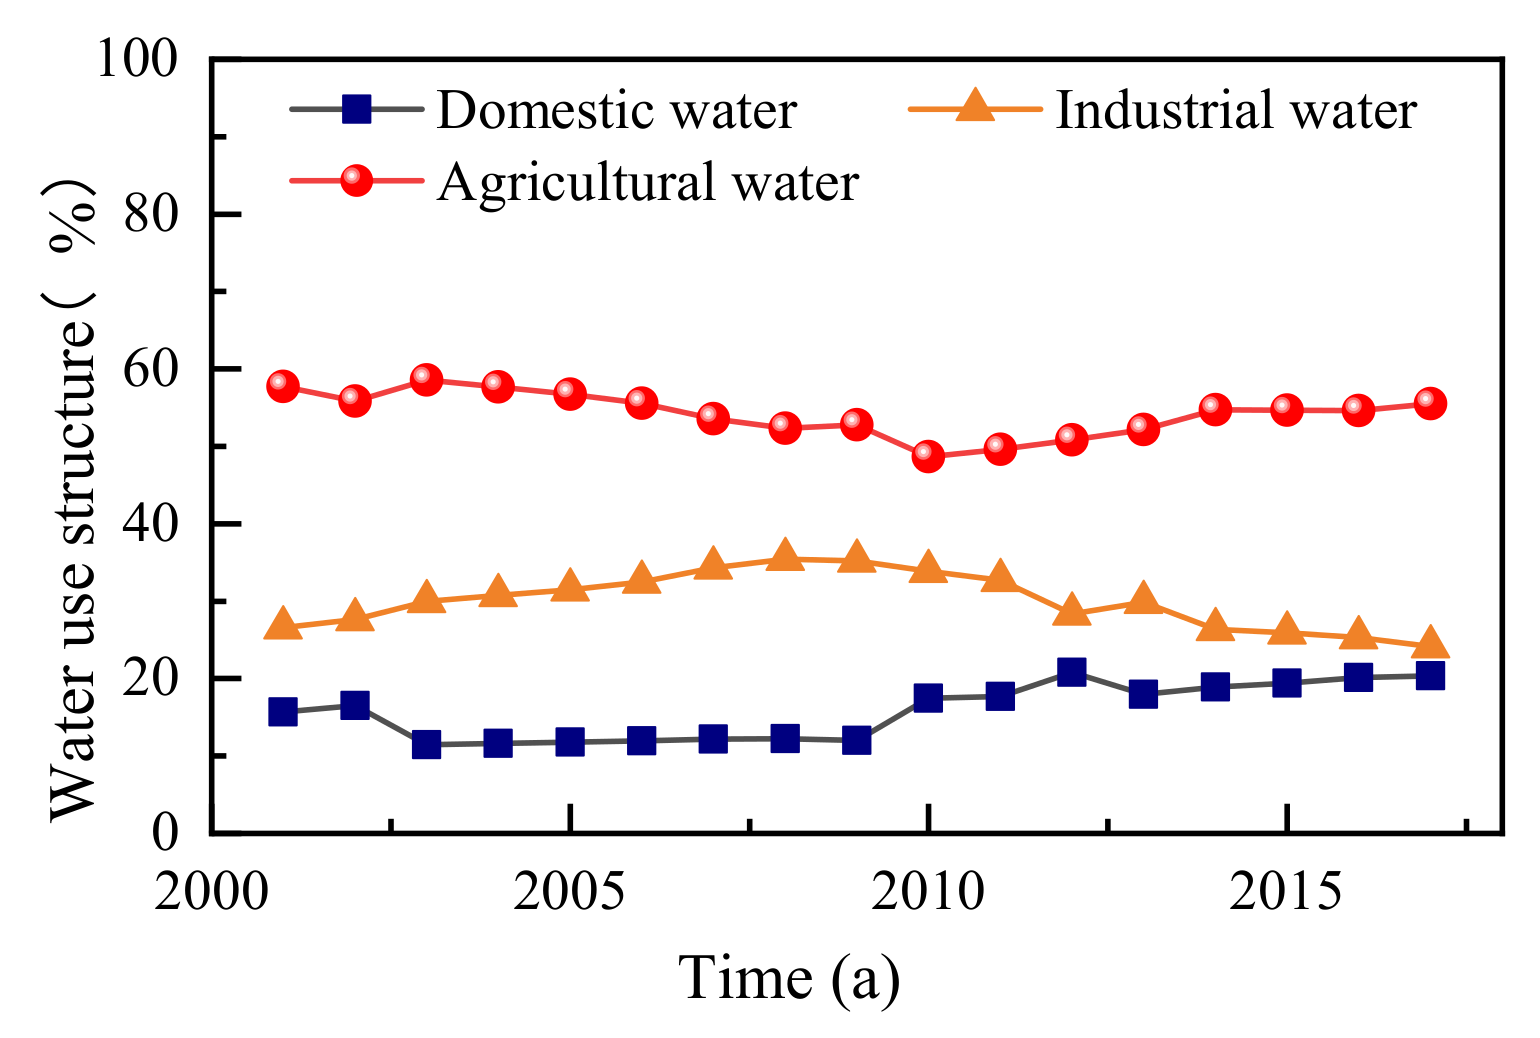
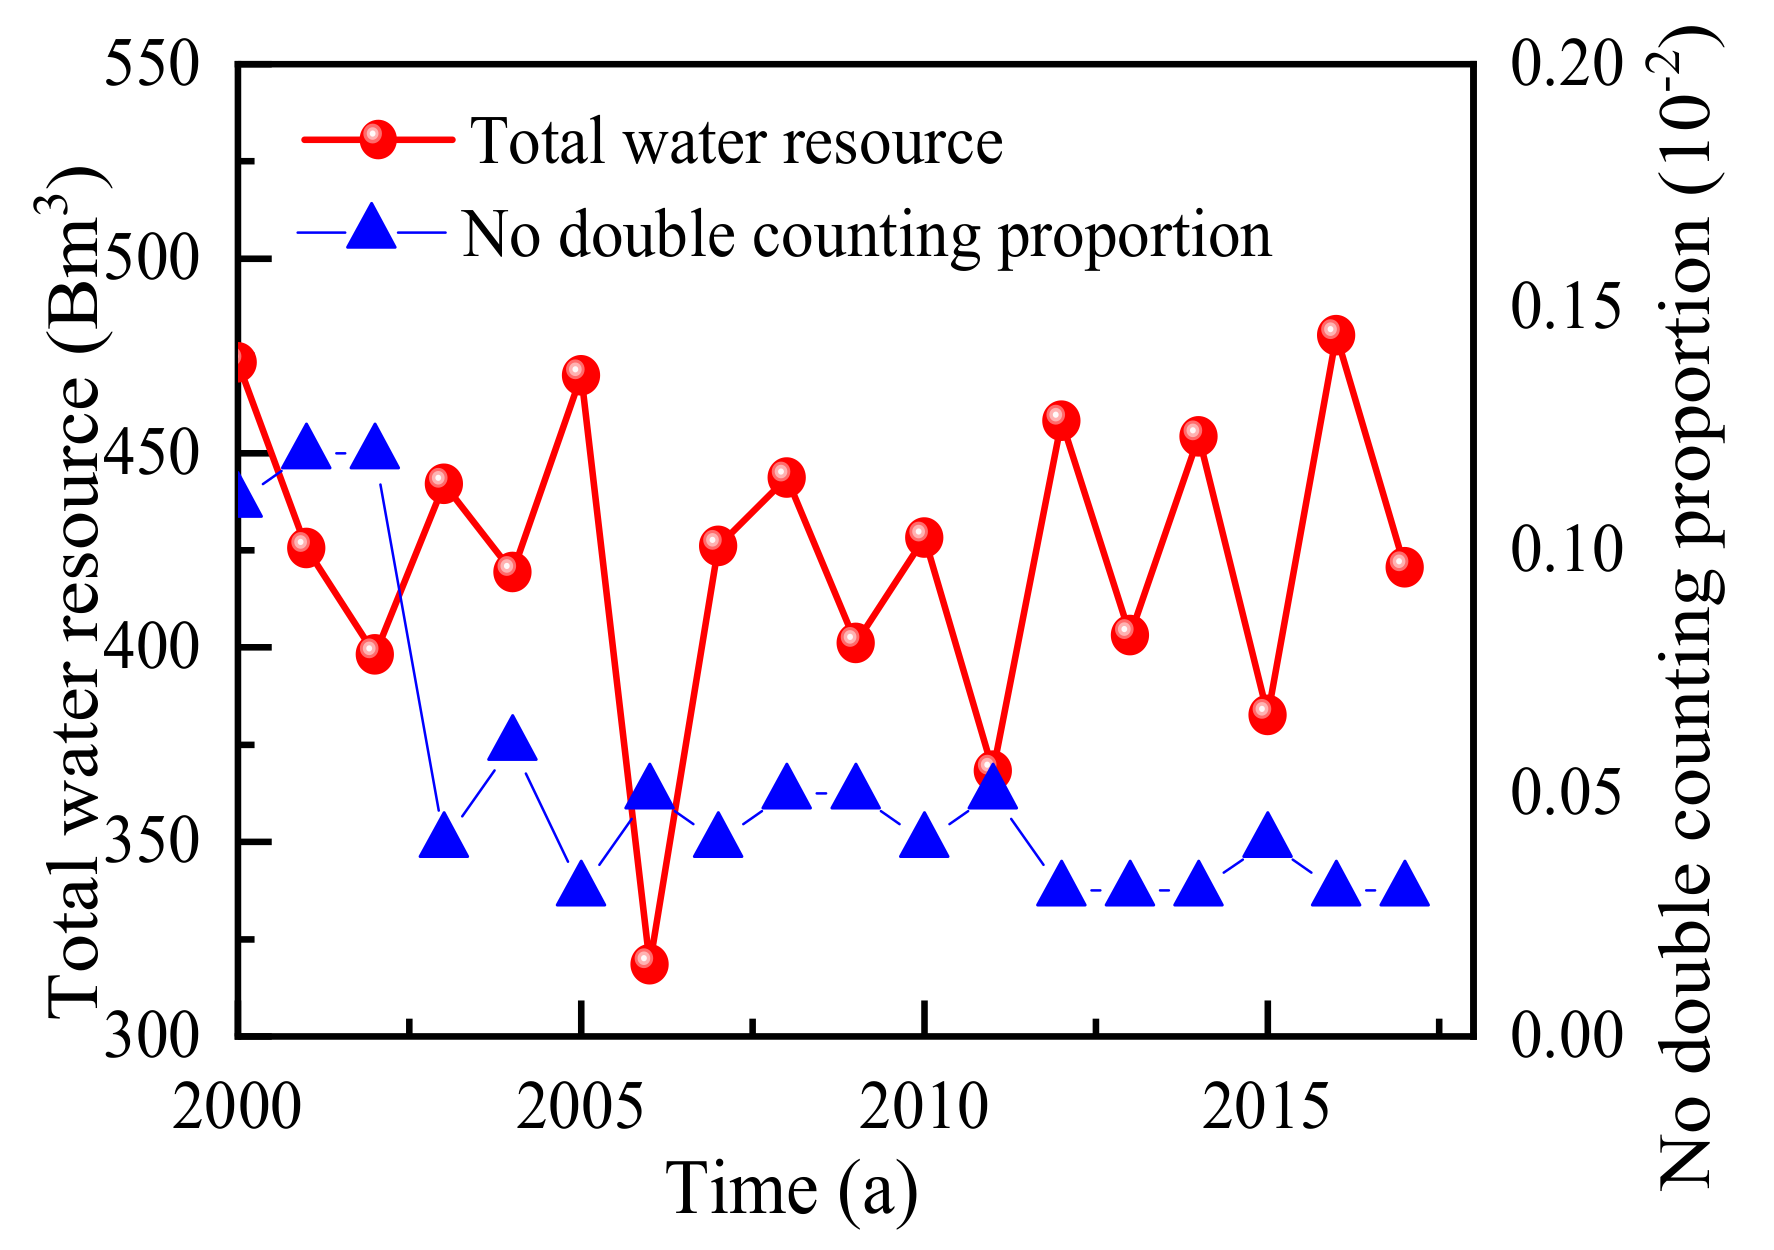
4.1. Analysis of Current Water Supply-Use Pattern
4.2. Analysis of Water Supply Capacity and Utilizable Water
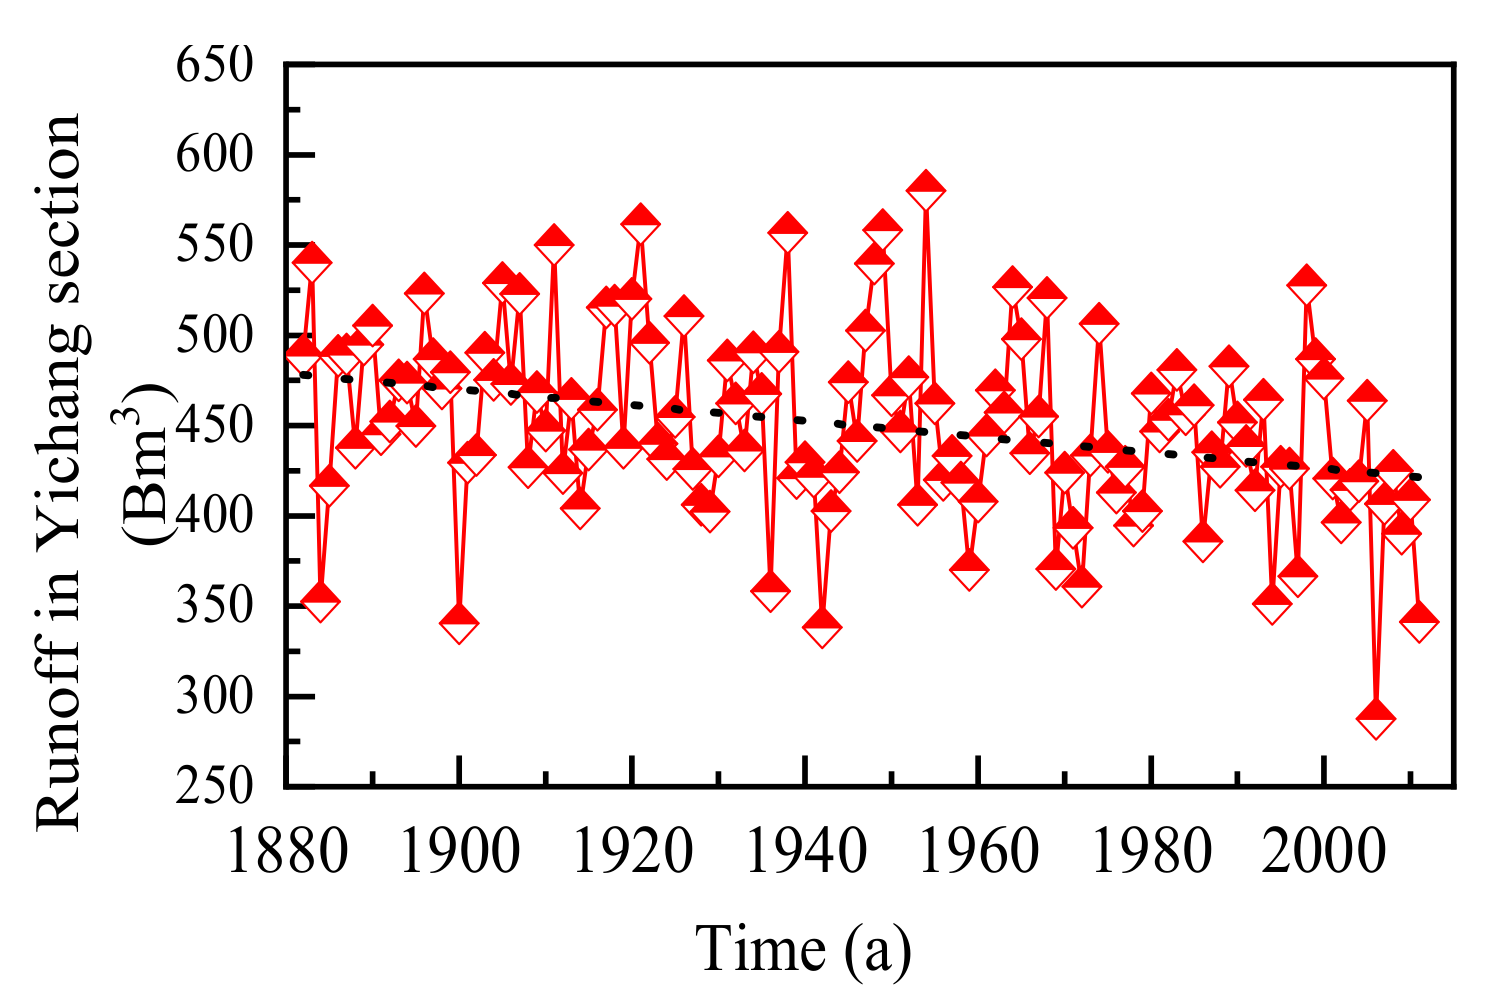
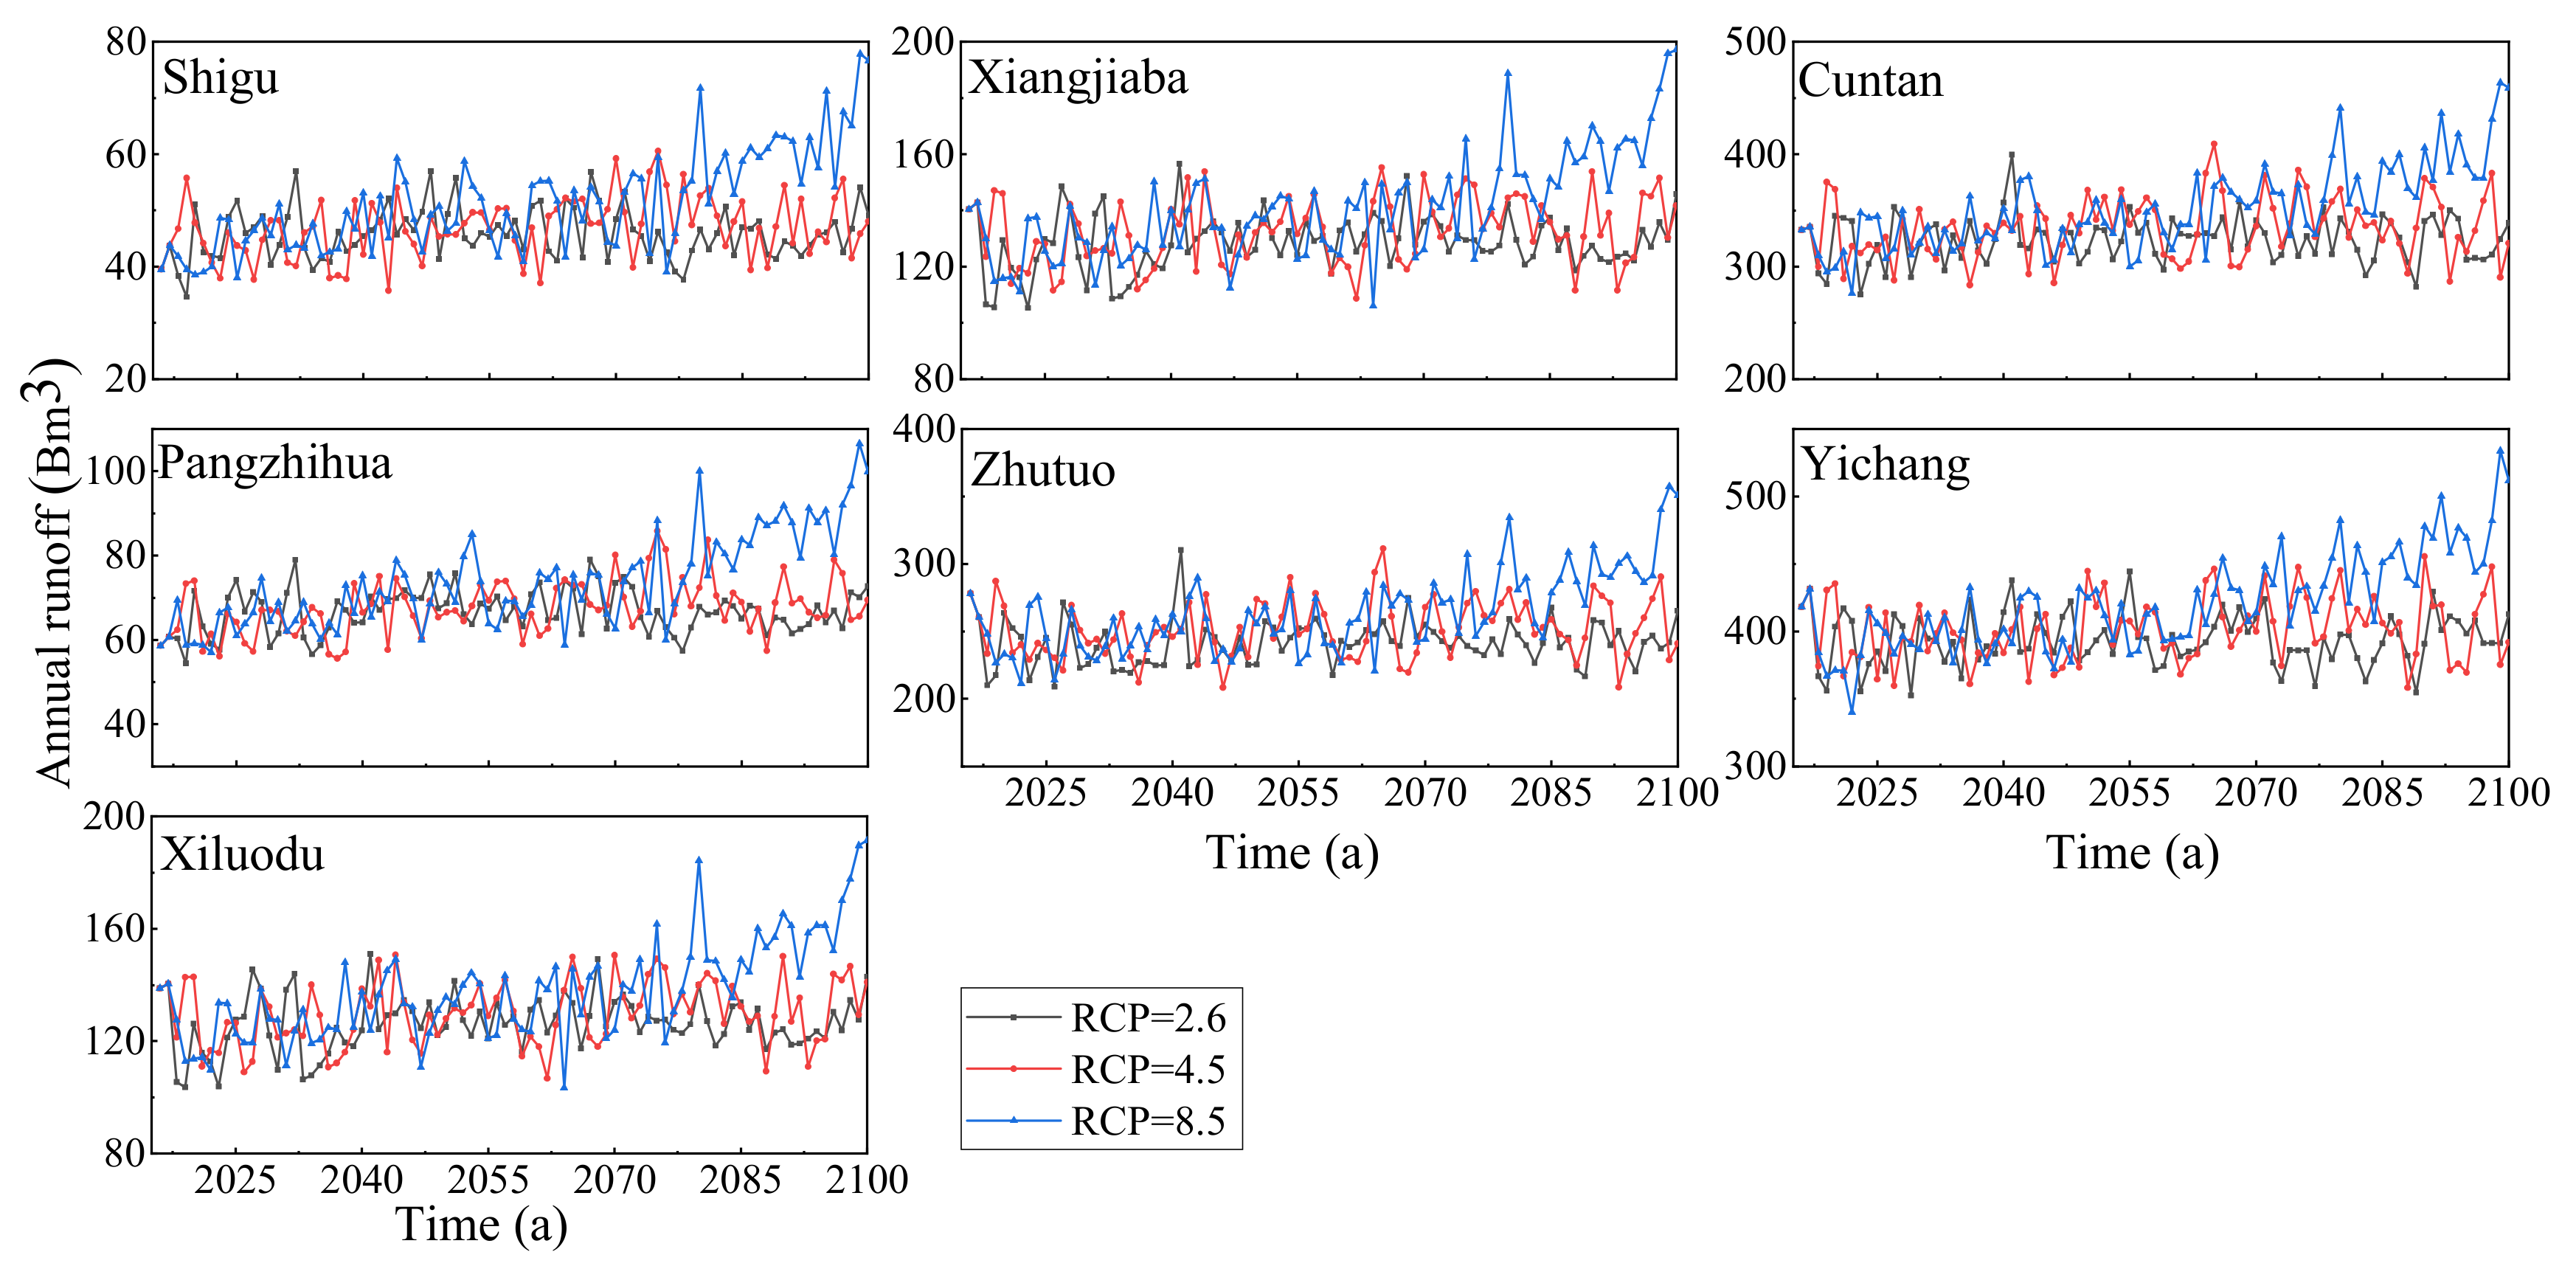
4.2.1. Runoff Simulation of Sub-Basin in Upstream Yangtze River
4.2.2. Forecasting of Utilizable Surface Water Resources in the Upstream Basin
4.2.3. Analysis of Water Supply Structure in Upstream Yangtze River
4.2.4. Analysis of Surface Water Supply Capacity in Upstream Yangtze River
4.3. Water Demand Forecasting
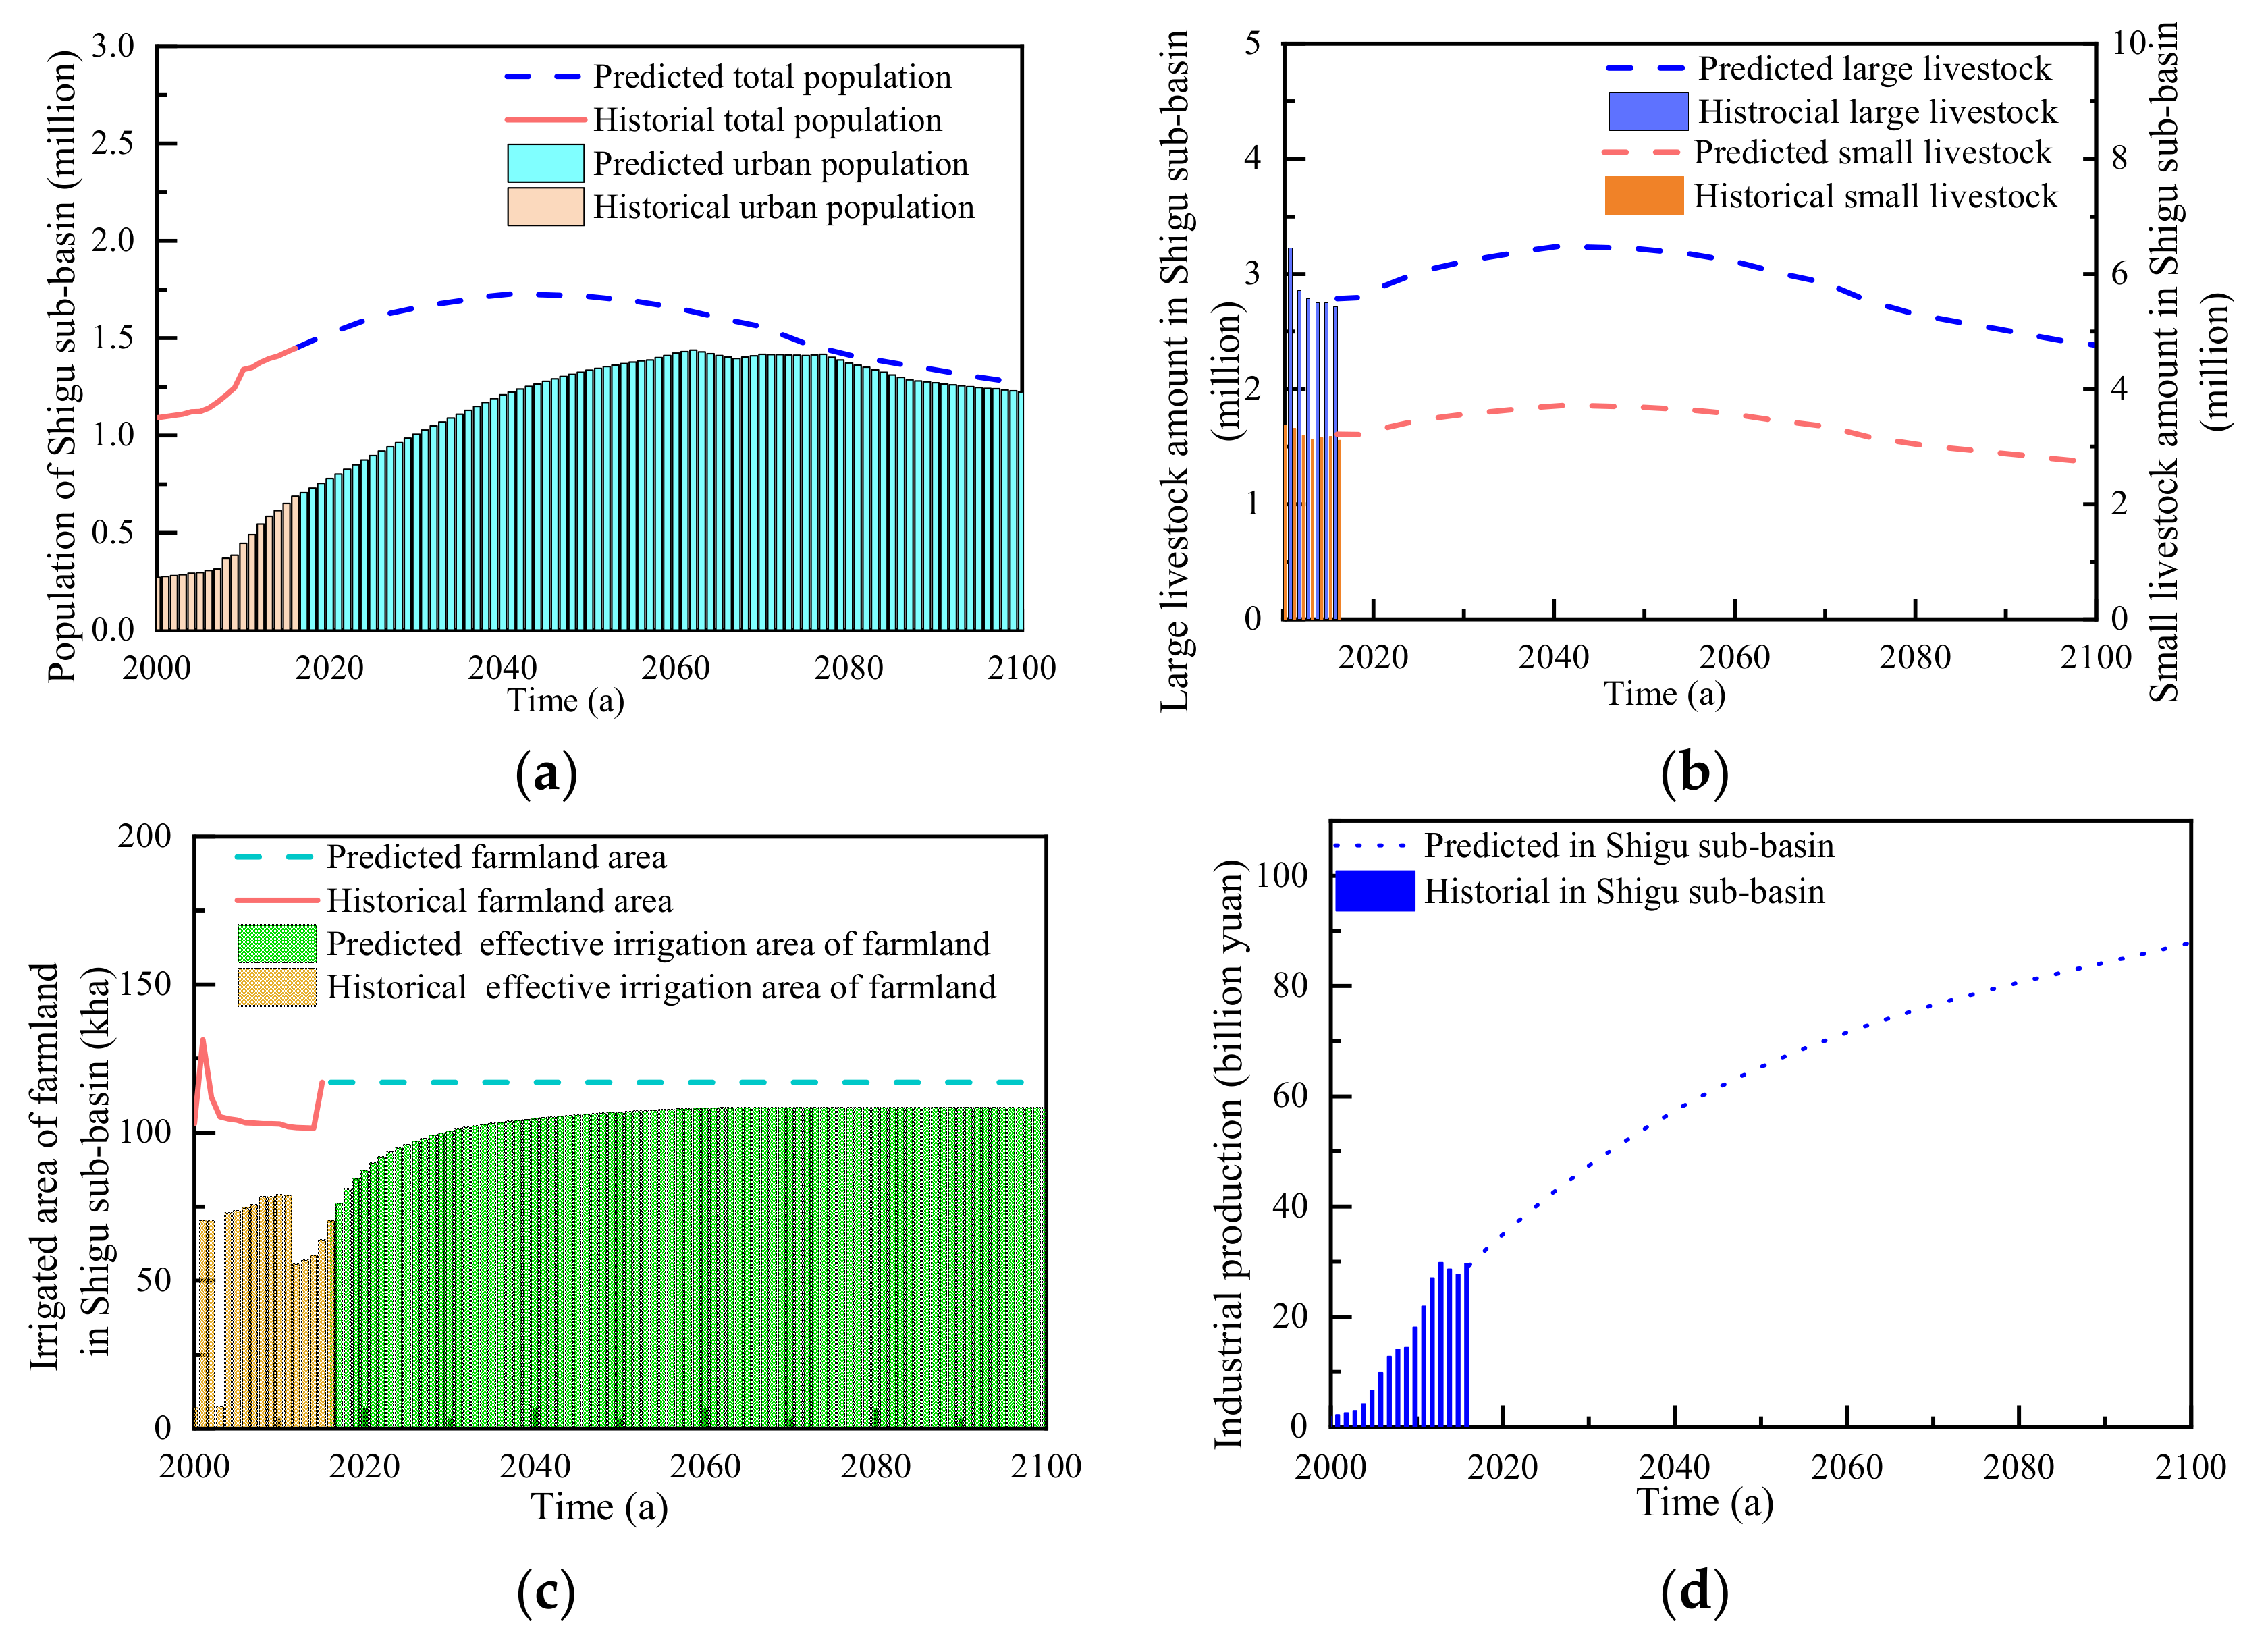
4.3.1. Change Analysis of Social-Economic Factors
4.3.2. Change Forecasting of Water Use Indices
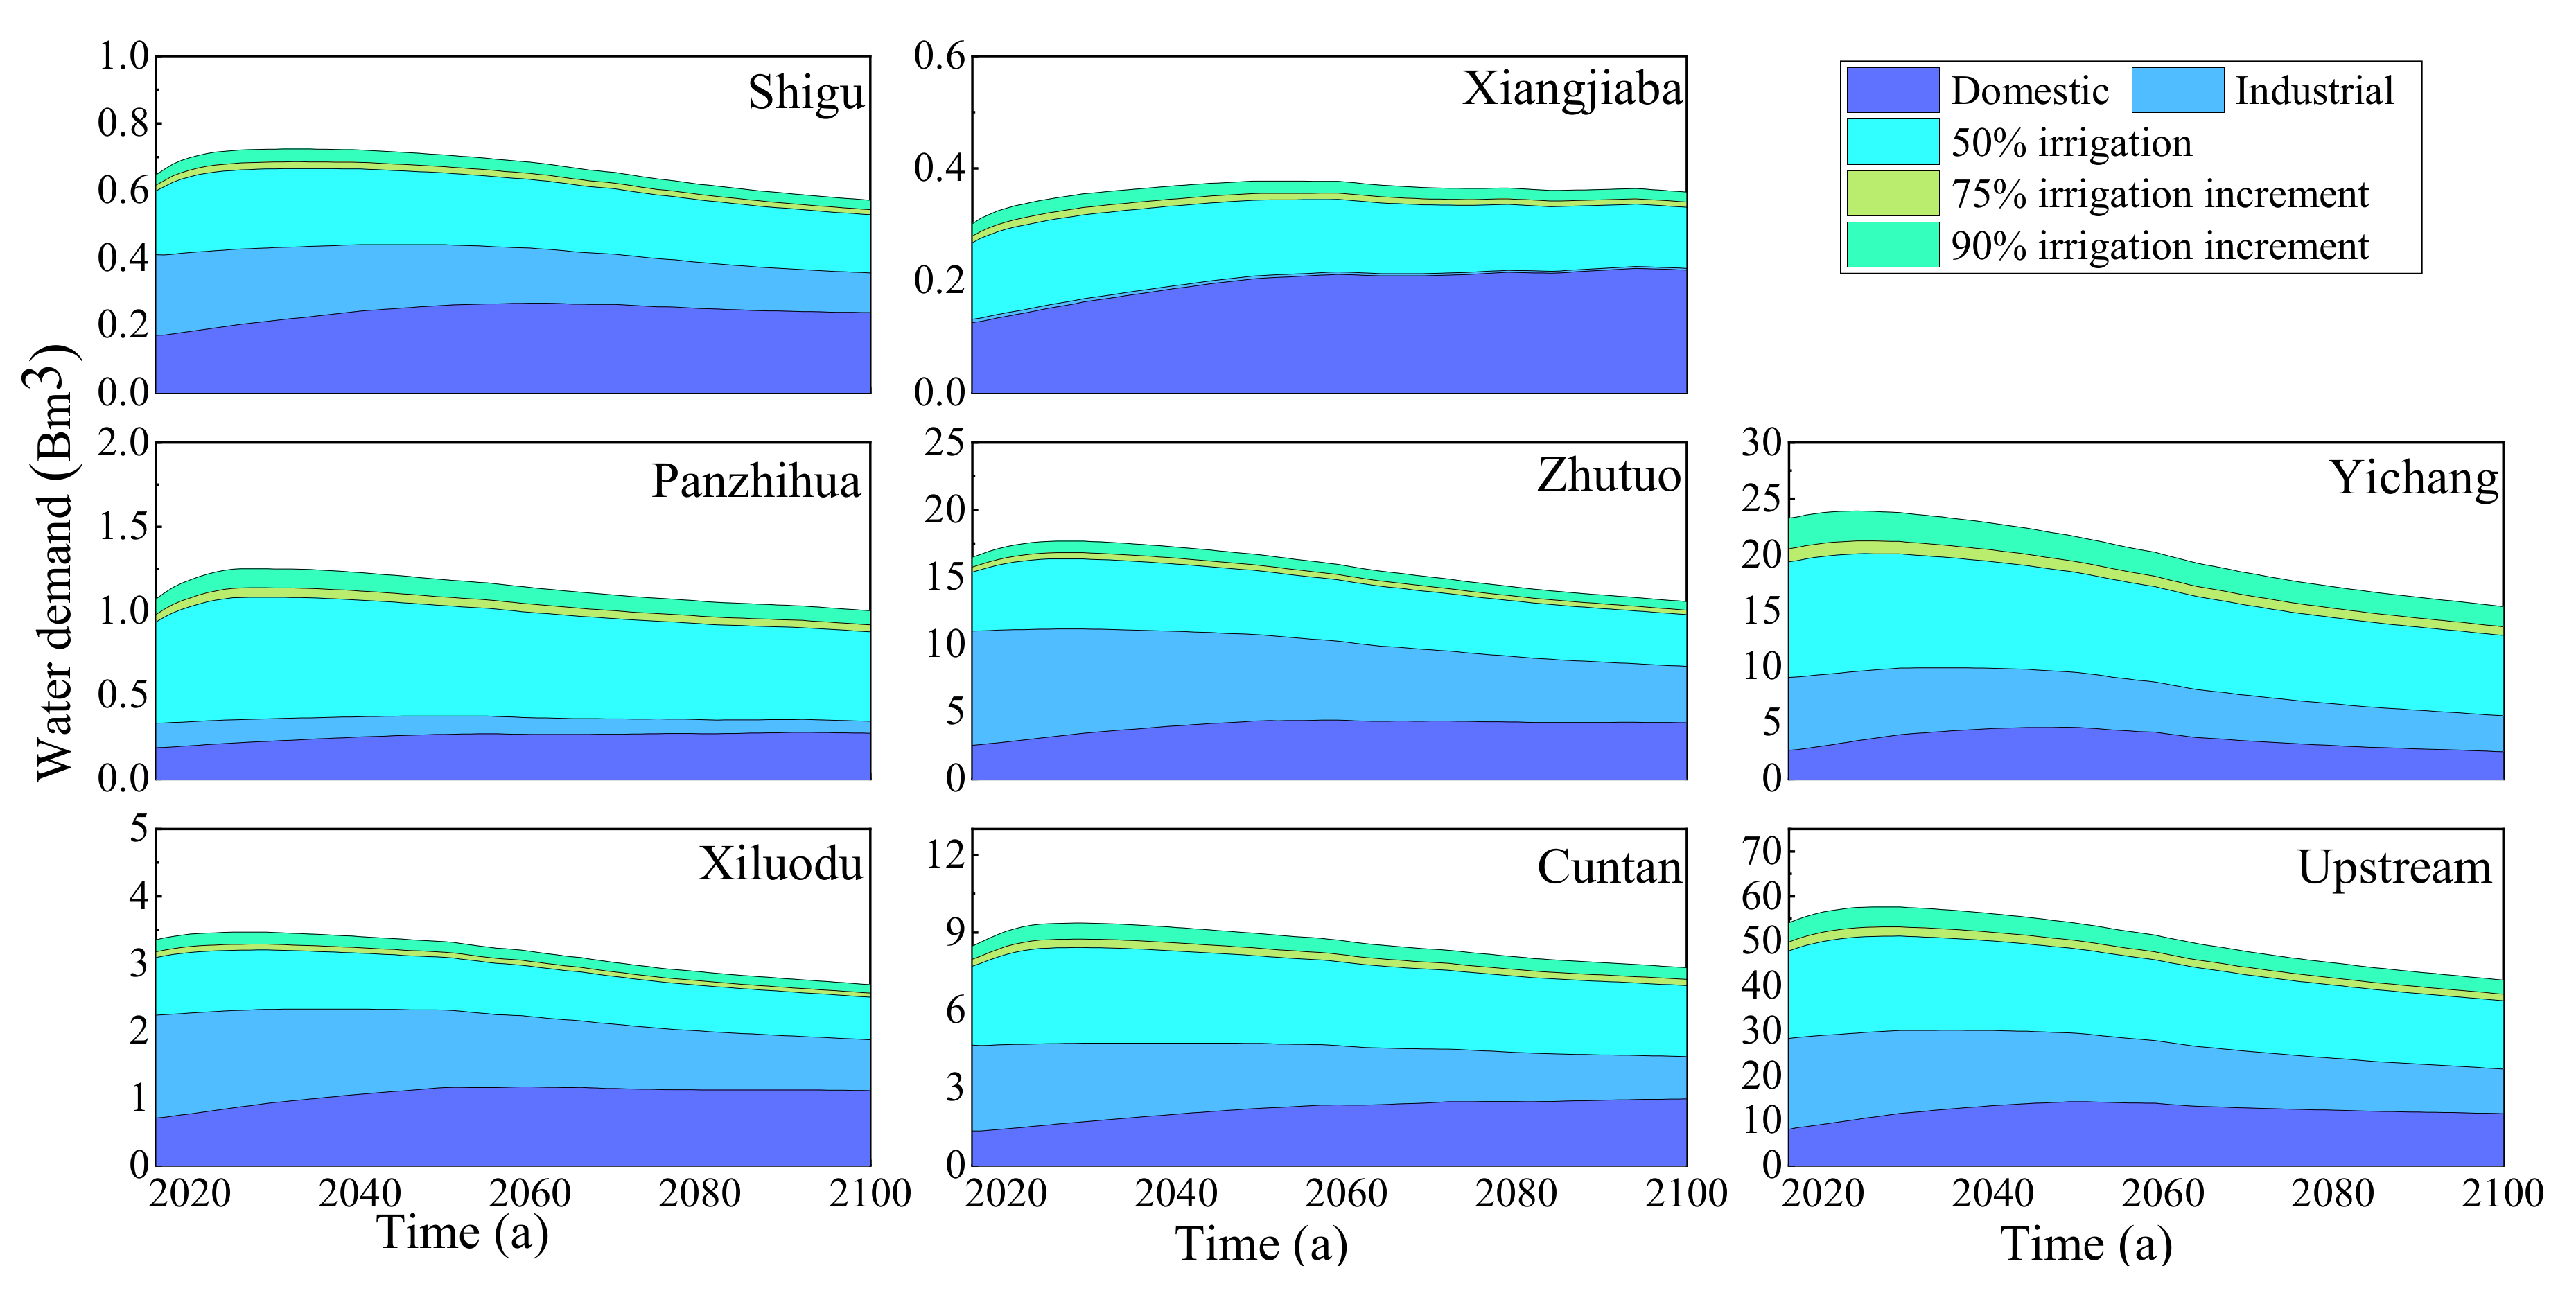
4.3.3. Water Demand Forecast
4.4. Supply Versus Demand Analysis
4.4.1. Supply Capacity Limitation
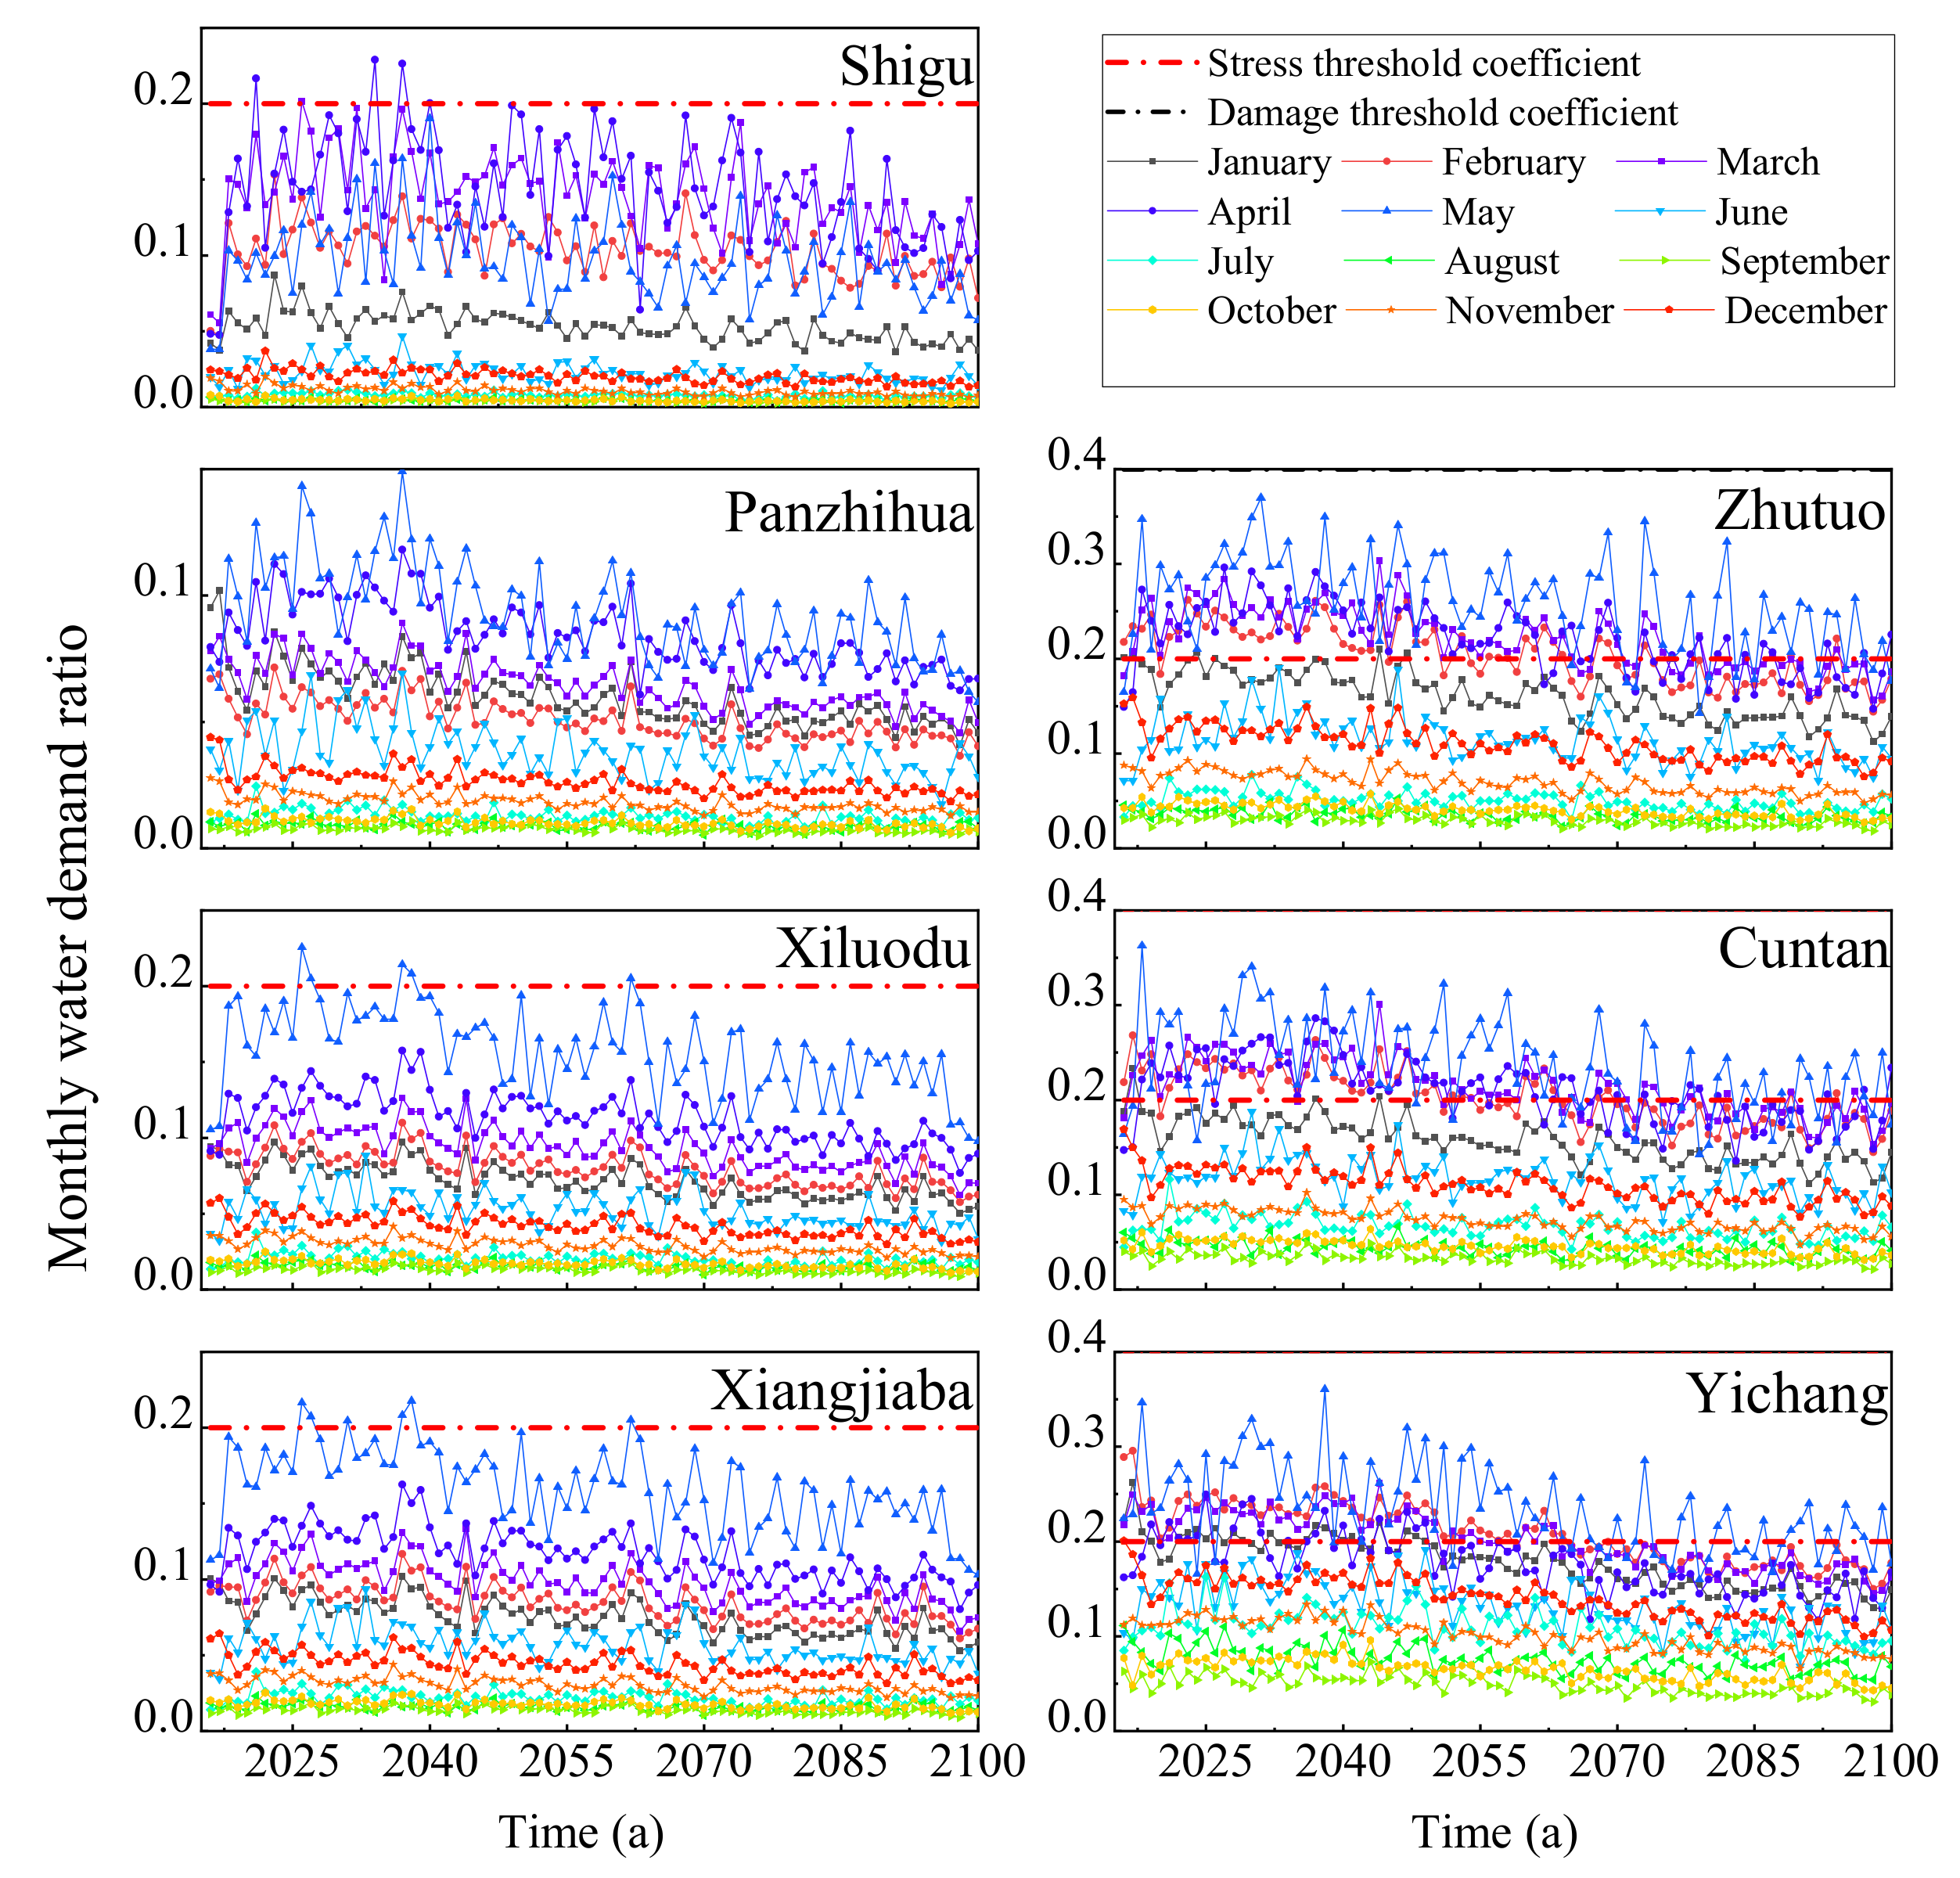
4.4.2. Ecological Condition Limitation
5. Conclusions
Author Contributions
Funding
Institutional Review Board Statement
Informed Consent Statement
Data Availability Statement
Acknowledgments
Conflicts of Interest
References
- Chen, Z.J. The strategic position and the ecological and environmental function of the upper reaches of the Yangtze river. Mt. Res. 2000, 18, 258–262. [Google Scholar]
- Li, Q.; Cheng, G.D.; Shen, Y.P. Climate Change and Its Impact on the Eco-environment in the Source Regions of the Yangtze and Yellow Rivers in recent 40 years. J. Glaciol. Geocryol. 2001, 23, 346–352. [Google Scholar]
- Jiao, D.L.; Wang, D.J.; Lv, H.Y. Effects of human activities on hydrological drought patterns in the Yangtze River Basin, China. Nat. Hazards 2020, 104, 1111–1124. [Google Scholar] [CrossRef]
- Qu, S.; Wang, L.C.; Lin, A.W.; Zhu, H.J.; Yuan, M.X. What drives the vegetation restoration in Yangtze River basin, China: Climate change or anthropogenic factors? Ecol. Indic. 2018, 90, 438–450. [Google Scholar] [CrossRef]
- Huang, C.B.; Teng, M.J.; Zeng, L.X.; Zhou, Z.X.; Wang, P.C. Long-term changes of land use/cover in the Three Gorges Reservoir Area of the Yangtze River, China. Chin. J. Appl. Ecol. 2018, 29, 1585–1596. [Google Scholar]
- Dai, M.L. Hydrological Regime Changes Considering Mega Reservoirs in Upper Yangtze River Basin; Huazhong University of Science & Technology: Wuhan, China, 2017. [Google Scholar]
- Ran, R.P. On the Coordinative Development of Environment and Economy in the Upper Reaches of Yangtze River; Southwest University: Chongqing, China, 2003. [Google Scholar]
- Gonzalez, P.; Neilson, R.P.; Lenihan, J.M.; Drapek, R.J. Global patterns in the vulnerability of ecosystems to vegetation shifts due to climate change. Glob. Ecol. Biogeogr. 2010, 19, 756–768. [Google Scholar] [CrossRef]
- Meinshausen, M.; Smith, S.J.; Calvin, K.; Daniel, J.S.; Kainuma, M.L.T.; Lamarque, J.; Matsumoto, K.; Montzka, S.A.; Raper, S.C.B.; Riahi, K.; et al. The RCP greenhouse gas concentrations and their extensions from 1765 to 2300. Clim. Chang. 2011, 109, 213. [Google Scholar] [CrossRef]
- Taylor, K.E.; Stouffer, R.J.; Meehl, G.A. An overview of CMIP5 and the experiment design. Bull. Am. Meteorol. Soc. 2012, 93, 486–498. [Google Scholar] [CrossRef]
- Siew, J.H.; Tangang, F.T.; Juneng, L. Evaluation of CMIP5 coupled atmosphere-ocean general circulation models and projection of the Southeast Asian winter monsoon in the 21st century. Int. J. Climatol. 2014, 34, 2872–2884. [Google Scholar] [CrossRef]
- Mimikou, M.A.; Baltas, E.; Varanou, E.; Pantazis, K. Regional impacts of climate change on water resources quantity and quality indicators. J. Hydrol. 2000, 234, 96–109. [Google Scholar] [CrossRef]
- Tung, C.P.; Haith, D.A. Global-Warming effects on new york streamflows. J. Water Resour. Plan Manag. 1995, 121, 216–225. [Google Scholar] [CrossRef]
- Matondo, J.I.; Peter, G.; Msibi, K.M. Evaluation of the impact of climate change on hydrology and water resources in Swaziland: Part II. Phys. Chem. Earth 2004, 29, 1193–1202. [Google Scholar] [CrossRef]
- Li, L.; Hao, Z.C.; Wang, J.H.; Wang, Z.H.; Yu, Z.B. Impact of future climate change on runoff in the head region of the Yellow River. J. Hydrol. Eng. 2008, 13, 347–354. [Google Scholar] [CrossRef]
- He, Z.L. Climate Change Impacts on Stream Flow of the Upper San Joaquin River Headwater Watershed California, America; Northwest A&F University: Xianyang, China, 2012. [Google Scholar]
- Ekins, P. The Kuznets curve for the environment and economic growth: Examining the evidence. Environ. Plan A 1997, 29, 805–830. [Google Scholar] [CrossRef]
- Katz, D. Water use and economic growth: Reconsidering the Environmental Kuznets Curve relationship. J. Clean. Prod. 2015, 88, 205–213. [Google Scholar] [CrossRef]
- Aitken, C.K.; Duncan, H.; McMahon, T.A. A cross-sectional regression analysis of residential water demand in Melbourne, Australia. Appl. Geogr. 1991, 11, 157–165. [Google Scholar] [CrossRef]
- Sebri, M. Forecasting urban water demand: A meta-regression analysis. J. Environ. Manag. 2016, 183, 777–785. [Google Scholar] [CrossRef]
- Yasar, A.; Bilgili, M.; Simsek, E. Water Demand Forecasting Based on Stepwise Multiple Nonlinear Regression Analysis. Arab. J. Sci. Eng. 2012, 37, 2333–2341. [Google Scholar] [CrossRef]
- Jing, Y.P.; Xin, Z.; Yan, L. Forecasting of urban water demand based on combining Grey and BP neural network with Markov chain model. J. Northwest A F Univ. 2011, 39, 229–234. [Google Scholar]
- Guo, F.Q. Prediction of City Industrial Water Demand Based on Grey GM (1,1) model. Ground Water. 2010. Available online: https://en.cnki.com.cn/Article_en/CJFDTotal-DXSU201003045.htm (accessed on 24 April 2020).
- Wa, D.A. Application of Gray Model to Prediction of Water Demand in Tibet. China Water Wastewater. 2010. Available online: https://en.cnki.com.cn/Article_en/CJFDTotal-GSPS201001017.htm (accessed on 24 April 2020).
- Campisi-Pinto, S.; Adamowski, J.; Oron, G. Forecasting Urban Water Demand Via Wavelet-Denoising and Neural Network Models. Case Study: City of Syracuse, Italy. Water Resour. Manag. 2012, 26, 3539–3558. [Google Scholar] [CrossRef]
- Kofinas, D.; Papageorgiou, E.; Laspidou, C.; Mellios, N.; Kokkinos, K. Daily multivariate forecasting of water demand in a touristic island with the use of artificial neural network and adaptive neuro-fuzzy inference system. In Proceedings of the 2016 International Workshop on Cyber-physical Systems for Smart Water Networks, CySWater 2016, Vienna, Austria, 11 April 2016. [Google Scholar]
- Tiwari, M.K.; Adamowski, J. Urban water demand forecasting and uncertainty assessment using ensemble wavelet-bootstrap-neural network models. Water Resour. Res. 2013, 49, 6486–6507. [Google Scholar] [CrossRef]
- Xu, T.Y.; Qin, X.S. A Sequential Fuzzy Model with General-Shaped Parameters for Water Supply–Demand Analysis. Water Resour. Manag. 2015, 29, 1431–1446. [Google Scholar] [CrossRef]
- Yang, S.N.; Guo, H.; Li, Y.; Liu, J.L. The Application of System Dynamics Model of City Water Demand Forecasting. Appl. Mech. Mater. 2014, 535, 440–445. [Google Scholar] [CrossRef]
- Qi, C.; Chang, N. Bin System dynamics modeling for municipal water demand estimation in an urban region under uncertain economic impacts. J. Environ. Manage. 2011, 92, 1628–1641. [Google Scholar] [CrossRef] [PubMed]
- Brooks, R.; Corey, A. Hydraulic Properties of Porous Media; Hydrology Paper; Colorado State University: Fort Collins, CO, USA, 1964. [Google Scholar]
- Franchini, M.; Pacciani, M. Comparative analysis of several conceptual rainfall-runoff models. J. Hydrol. 1991, 122, 161–219. [Google Scholar] [CrossRef]
- Tennant, D.L. Instream flow regimens for fish, wildlife, recreation and related environmental resources. Fisheries 1976, 1, 6–10. [Google Scholar] [CrossRef]
- Kirshen, P.H.; Strzepek, K.M. Comprehensive assessment of the freshwater resources of the world. In Proceedings of the Congress of the International Association of Hydraulic Research, IAHR 1997, San Francisco, CA, USA, 10–15 August 1997; pp. 393–398. [Google Scholar]
- Lane, M.E.; Kirshen, P.H.; Vogel, R.M. Indicators of impacts of global climate change on US Water resources. J. Water Resour. Plann. Manag. 1999, 125, 194–204. [Google Scholar] [CrossRef]
- Fan, L.L.; Wang, H.R.; Liu, F.L.; Lai, W.L.; Hong, S.Y. Water scarcity analysis of river basins in china based on Water Exploitation Index Plus. J. Yangtze River Sci. Res. Inst. 2017, 34, 9–14. [Google Scholar]
- Faergemann, H. Update on water scarcity and droughts indicator development. In EC Expert Group on Water Scarcity & Droughts; European Environment Agency: Brussels, Belgium, 2012; pp. 1–23. [Google Scholar]
- Casadei, S.; Peppoloni, F.; Pierleoni, A. A New Approach to Calculate the Water Exploitation Index (WEI+). Water 2020, 12, 3227. [Google Scholar] [CrossRef]
- Li, X.N.; Zhao, X.J.; Shen, X.M.; Wei, Z.X. Prediction of water demand in Gui’ an city of Guizhou province in China. In Proceedings of the 2015 International Forum on Energy, Environment Science and Materials 2015, Shenzhen, China, 25–26 September 2015; pp. 1353–1358. [Google Scholar]
- Gong, L.L.; Huang, Q.; Dong, J.Z.; Zhao, L. Forcast of Water Requirement of Shaanxi Province in 2020. J. Arid Land Resour. Environ. 2008, 22, 169–173. [Google Scholar]
- Huang, S. Upper Yangtze Annual Runoff Analysis and Its Forecast; Sichuan University: Chengdu, China, 2006. [Google Scholar]
- Wang, W.P.; Chen, Y.F.; Liu, B. Regional climatic trend analysis in upper Yangtze river with Consideration of both temporal and spatial correlation. J. HoHai Univ. 2016, 45, 14–21. [Google Scholar]
- Guan, Y.H. Extreme Climate Change and Its Trend Prediction in the Yangtze River Basin; Northwest A&F University: Xianyang, China, 2015. [Google Scholar]
- National Bureau of Statistics of China. China Statistical Yearbook-2011~2015; China Statistics Press: Beijing, China, 2016.
- Changjiang Water Resources Commission of the Ministry of Water Resources. Changjiang and Southwest Rivers Water Resources Bulletin 1998–2017; Changjiang Water Resources Commission of the Ministry of Water Resources: Wuhan, China, 2018.
- Ministry of Water Resources of China. China Water Resources Bulletin; Ministry of Water Resources of China: Beijing, China, 2015.
- Feng, J. Simulation and Projection for Regional Climate in China by Multiple Global Climate Models; Nanjing University of Information Science & Technology: Nanjing, China, 2012. [Google Scholar]
- Ministry of Water Resources of China. National Comprehensive Plan for Water Resources; Ministry of Water Resources of China: Beijing, China, 2008.
- National Development and Reform Commission of China. Outline of the 13th Five-Year Plan for the National Economic and Social Development of the People’s Republic of China; National Development and Reform Commission of China: Beijing, China, 2016.
- Center for China and World Economics, Tsinghua University. 2017–2018 China Macroeconomic Analysis and Forecast—China’s Economy after the 19th CPC National Congress 2018 2035 2050; Center for China and World Economics, Tsinghua University: Beijing, China, 2017. [Google Scholar]
- Ministry of Water Resources of China. The 13th Five-Year Plan for water Conservancy Development and Reform; Ministry of Water Resources of China: Beijing, China, 2016.
- Ministry of Water Resources of China. The 13th Five-Year Plan for Building a Water-Conserving Society; Ministry of Water Resources of China: Beijing, China, 2017.


| Section | Parameters | Calibration | Validation | ||||||||
|---|---|---|---|---|---|---|---|---|---|---|---|
| B | Ds | Dm | Ws | d1 | d2 | d3 | NSE | ER | NSE | ER | |
| Shigu | 0.39 | 0.27 | 12.51 | 0.31 | 0.035 | 0.274 | 0.51 | 0.835 | 0.145 | 0.843 | 0.060 |
| Panzhihua | 0.48 | 0.11 | 15.25 | 0.31 | 0.047 | 0.215 | 1.18 | 0.822 | 0.040 | 0.850 | 0.028 |
| Xiluodu | 0.49 | 0.84 | 12.11 | 0.99 | 0.044 | 0.284 | 2.41 | 0.861 | 0.035 | 0.878 | 0.041 |
| Xiangjiaba | 0.47 | 0.75 | 112.61 | 0.89 | 0.076 | 0.302 | 2.42 | 0.859 | 0.012 | 0.874 | 0.055 |
| Zhutuo | 0.62 | 0.88 | 15.05 | 0.89 | 0.013 | 0.304 | 3.21 | 0.885 | 0.021 | 0.875 | 0.060 |
| Cuntan | 0.62 | 0.80 | 13.23 | 0.95 | 0.054 | 0.284 | 2.73 | 0.891 | 0.025 | 0.885 | 0.055 |
| Yichang | 0.55 | 0.33 | 13.22 | 0.98 | 0.079 | 0.305 | 3.01 | 0.722 | 0.004 | 0.765 | 0.039 |
| Water System | Supply Capacity of Large or Middle Reservoirs | Capacity of Other Water Supply Project | Total Capacity | Actual Supply | Utilization Rate | ||||
|---|---|---|---|---|---|---|---|---|---|
| Number | Capacity | Small Reservoir | Pond | Diversion | Lifting | ||||
| Jinsha river | 63 | 1.23 | 1.37 | 0.31 | 3.85 | 1.73 | 8.49 | 6.06 | 71% |
| Mintuo river | 39 | 0.87 | 0.91 | 0.74 | 7.00 | 1.74 | 11.47 | 11.47 | 100% |
| Jialing river | 61 | 1.54 | 1.1 | 1.31 | 1.42 | 2.81 | 8.18 | 6.64 | 81% |
| Wujiang river | 26 | 1.22 | 1.02 | 0.13 | 0.96 | 1.13 | 4.46 | 3.92 | 88% |
| Yiban to Yichang | 30 | 0.32 | 1.08 | 0.87 | 0.95 | 3.79 | 7.01 | 6.17 | 88% |
| Dongting lake | 284 | 7.62 | 6.16 | 5.16 | 7.25 | 12.32 | 38.51 | 33.54 | 87% |
| Hanjiang river | 144 | 5.11 | 0.76 | 1.37 | 4.69 | 4.11 | 16.04 | 11.12 | 69% |
| Yichang to Hukou | 153 | 5.05 | 1.55 | 1.9 | 4.49 | 6.95 | 19.94 | 16.47 | 83% |
| Poyang lake | 210 | 4.65 | 4.16 | 1.61 | 5.06 | 7.07 | 22.55 | 19.22 | 85% |
| Taihu lake | 20 | 0.51 | 0.16 | 0.24 | 10.47 | 26.21 | 37.59 | 34.66 | 92% |
| Below Hukou | 76 | 2.78 | 1.12 | 3.45 | 10.62 | 9 | 26.97 | 14.81 | 55% |
| Upstream | 219 | 5.18 | 5.48 | 3.36 | 14.18 | 11.2 | 39.61 | 34.27 | 87% |
| Middle and downstream | 887 | 25.72 | 13.91 | 13.73 | 42.58 | 65.66 | 161.6 | 129.82 | 80% |
| Entire Yangtzi River | 1106 | 30.90 | 19.39 | 17.09 | 56.76 | 76.86 | 201.21 | 164.09 | 82% |
| Sub-Basin | Utilization Rate | Actual Supply (Bm3) | Capacity (Bm3) | Cumulative Capacity (Bm3) |
|---|---|---|---|---|
| Shigu | 80% | 0.54 | 0.67 | 0.67 |
| Panzhihua | 80% | 0.83 | 1.04 | 1.71 |
| Xiluodu | 80% | 2.77 | 3.46 | 5.17 |
| Xiangjiaba | 80% | 0.24 | 0.30 | 5.47 |
| Zhutuo | 90% | 13.76 | 15.29 | 20.76 |
| Cuntan | 85% | 7.34 | 8.64 | 29.40 |
| Yichang | 90% | 17.34 | 19.27 | 48.66 |
| Upstream Yangtze River | 88% | 42.82 | 48.66 | 48.66 |
| Control Year | 2015 | 2020 | 2030 | 2050 | 2100 | |
|---|---|---|---|---|---|---|
| Prediction Index | ||||||
| Urban /rural population | Growth rate of total population /% | 0.5 | 0.43 | −0.43 | −0.54 | |
| Urbanization rate /% | 43 | 48 | 58 | 75 | 95 | |
| Irrigated Area of farmland | Irrigated ratio of farmland/% | 35 | 45 | 55 | 55 | |
| Industrial product | GDP growth rate in China /% | 9 | 6 | 4 | 3 | 1.5 |
| GDP growth rate in the basin/% | 10 | 7 | 5 | 4 | 1.5 | |
| Industrial production growth rate /% | 5 | 3.5 | 2.5 | 2 | 0.5 |
| Time Point | 2015 | 2020 | 2030 | 2050 | 2100 | |
|---|---|---|---|---|---|---|
| Index | ||||||
| Annual growth of urban domestic water /L | 2 | 2 | 2 | 1.5 | 1.5 | |
| Annual growth rate of rural domestic water /L | 1 | 1 | 1 | 1 | 1 | |
| EUC for irrigation | 0.5 | 0.54 | 0.6 | 0.7 | 0.875 | |
| Industrial water use per 1000-yuan production/ m3 | 11.8 | 7 | 5.6 | 3 | 1.5 | |
| Reuse rate of industrial water /% | 72 | 86 | 90 | 95 | ||
| Sub-Basin | 50% Runoff Frequency | 75% Runoff Frequency | 90% Runoff Frequency | |||
|---|---|---|---|---|---|---|
| Peak Demand (Bm3) | Time | Peak Demand (Bm3) | Time | Peak Demand (Bm3) | Time | |
| Shigu | 6.66 | 2033 | 6.86 | 2032 | 7.24 | 2032 |
| Panzhihua | 10.81 | 2028 | 11.37 | 2028 | 12.51 | 2027 |
| Xiluodu | 32.03 | 2029 | 32.89 | 2029 | 34.68 | 2027 |
| Xiangjiaba | 3.45 | 2059 | 3.65 | 2059 | 3.77 | 2050 |
| Zhutuo | 163.64 | 2027 | 168.19 | 2027 | 176.77 | 2027 |
| Cuntan | 94.75 | 2034 | 97.96 | 2034 | 104.07 | 2034 |
| Yichang | 200.9 | 2025 | 212.38 | 2025 | 238.98 | 2024 |
| Upstream | 511.35 | 2029 | 532.06 | 2029 | 576.22 | 2028 |
Publisher’s Note: MDPI stays neutral with regard to jurisdictional claims in published maps and institutional affiliations. |
© 2021 by the authors. Licensee MDPI, Basel, Switzerland. This article is an open access article distributed under the terms and conditions of the Creative Commons Attribution (CC BY) license (http://creativecommons.org/licenses/by/4.0/).
Share and Cite
Lou, S.; Mo, L.; Zhou, J.; Wang, Y.; He, W. Supply and Demand Forecasting of Water Resource Coupling System in Upstream Yangtze River under Changing Environmental Conditions. Water 2021, 13, 640. https://doi.org/10.3390/w13050640
Lou S, Mo L, Zhou J, Wang Y, He W. Supply and Demand Forecasting of Water Resource Coupling System in Upstream Yangtze River under Changing Environmental Conditions. Water. 2021; 13(5):640. https://doi.org/10.3390/w13050640
Chicago/Turabian StyleLou, Sijing, Li Mo, Jianzhong Zhou, Yongqiang Wang, and Wenhao He. 2021. "Supply and Demand Forecasting of Water Resource Coupling System in Upstream Yangtze River under Changing Environmental Conditions" Water 13, no. 5: 640. https://doi.org/10.3390/w13050640
APA StyleLou, S., Mo, L., Zhou, J., Wang, Y., & He, W. (2021). Supply and Demand Forecasting of Water Resource Coupling System in Upstream Yangtze River under Changing Environmental Conditions. Water, 13(5), 640. https://doi.org/10.3390/w13050640