1. Introduction
Accurate river stage forecasting is a crucial component in the flood early warning system and plays a key role in flood disaster mitigation. Taiwan had an average of four to five typhoons per year over the past 10 years [
1]. Typhoon-induced floods can frequently cause considerable social and economic losses. For example, Typhoon Morakot hit Taiwan in 2009, resulting in a torrential rainfall of 2748 mm in only 72 h [
2]. Such an extreme rainfall caused compound hazards, such as floods, river overflows, landslides, river embankment failures, and driftwood accumulation. Typhoon Morakot caused approximately 680 casualties and approximately NT
$90 billion in expenses for direct damage [
3]. Since Typhoon Morakot, more intensive investigations, analyses, and developments for disaster prevention have been conducted to better understand disaster risk assessment. The flood warning system is a vital mitigation technique during natural disasters that can be used by river managers to make decisions before the arrival of a typhoon. Therefore, studies on accurate and reliable river stage forecasting are required to reduce the impact of flood disasters.
Two main approaches are used to establish flood prediction models. The first approach involves the use of a flood dynamic process to perform mathematical modeling. This approach produces physics-based models, such as the Hydrologic Engineering Centers River Analysis System [
4], the SOBEK model developed by Deltares [
5], and Watershed Systems of 1D Stream-River Network, 2D Overland Regime, and 3D Subsurface Media [
6]. A physics-based model requires cross-sectional bed elevation data or digital elevation model data for establishing the simulation domain; therefore, simulation results obtained using a physics-based model are highly dependent on the quality of topographic survey data [
7,
8]. In addition, because the parameters in a physics-based model may affect the simulation results, the parameters must be calibrated. An alternative approach is the use of a data-driven model, which is based on the collection and analysis of data [
9,
10]. Currently, machine learning (ML) techniques, such as artificial neural networks (ANNs), K-nearest neighbors (KNNs), support vector regression (SVR), random forest regression (RFR), and multilayer perceptron regression (MLPR), are some of the most widely used approaches for data-driven models. Compared with a physics-based model, a data-driven model does not require bed elevation data and prevents numerical instability without any additional treatment.
In the last decade, data-driven models based on ML techniques have been proposed and extensively used for hydrology and flood-related predictions, including those related to rainfall runoff, reservoir inflow, river stage, urban inundation, and water quality simulation. For instance, Maity et al. [
11] employed SVR to predict the monthly streamflow in the Mahanadi River in India. Chen et al. [
12,
13] applied ANNs to predict the typhoon-induced storm surge tide and estuarine water stage and compared their results with those obtained using 2D and 3D hydrodynamic models. Lin et al. [
14] adopted SVR and the K-means clustering algorithm to develop a regional-inundation forecasting model. In their model, three main processes were adopted: classification, point forecasting, and spatial expansion. Wu et al. [
15] proposed an improved streamflow forecasting model based on SVR by using a self-organizing map (SOM) and demonstrated that the proposed model could accurately forecast the hourly streamflow. Furthermore, Hosseini and Mahjouri [
16] combined SVR with ANNs for daily rainfall-runoff modeling. They reported that the prediction accuracy was higher when integrated SVR was used than when conventional ANNs were used. Jhong et al. [
17] proposed a two-stage approach based on SVR for urban inundation forecasting. Their approach could provide accurate flood maps with lead times of 1–6 h during typhoons. Applying SVR and the genetic algorithm, Seo et al. [
18] performed daily river stage modeling in the Chogang Watershed, South Korea. Jhong et al. [
19] combined back-propagation networks (BPNs) and SOMs to propose a hybrid neural network model for typhoon flood forecasting. Muñoz et al. [
20] proposed a stepwise methodology for rainfall-runoff forecasting in an Andean mountain. In their proposed methodology, RFR was applied for short-term forecasting with different lead times of 4, 8, 12, 18, and 24 h. Wu et al. [
21] applied SVR to forecast flash floods in the small catchment Anhe in China. Kim and Han [
22] employed SVR and SOMs for predicting inundation maps in the Gangnam District, Seoul, South Korea. Nguyen and Chen [
23] developed a probabilistic forecasting model based on SVR, KNN, and a fuzzy inference model, and the developed model was applied to forecast floods with a lead time of 1–3 h. Chen et al. [
24] used ANNs to model the dissolved oxygen concentration in a reservoir in Taiwan.
The aforementioned studies have indicated that a data-driven model with ML techniques can effectively learn the nonlinear relationship between input and output variables without requiring explicit knowledge regarding the physical process. In flood forecasting using ML techniques, several factors can affect the prediction accuracy, including the combinations of input vectors, employed parameters, and different ML techniques. Hence, several attempts have been made using different strategies to improve the accuracy. For example, Lin et al. [
25] employed SVR and BPNs to forecast hourly reservoir inflows. Their results indicated that SVR was more accurate than BPNs. Nguyen et al. [
26] applied the least absolute shrinkage and selection operator, RFR, and SVR to forecast the daily time series of water levels at the Thakhek station of Mekong River. Li et al. [
27] compared the performance of RFR, SVR, ANNs, and a linear model for forecasting lake water levels. In addition, they investigated the effects of previous water levels at different time lags on the forecasting accuracy. They reported that RFR exhibited the most satisfactory performance among the tested models. Furthermore, the combination of input vectors involving the discharge in the previous four days and the average water level in the previous week was robust and accurate for daily forecasting. Panagoulia et al. [
28] investigated the nonlinear relationship between river flow and input variables selected using ANNs. Yang et al. [
29] employed RFR, SVR, and ANNs to forecast monthly reservoir inflow and found that RFR exhibited the most satisfactory performance. In addition, their results indicated that the optimal input variables were precipitation in the previous three days and river flow in the previous four days. Pini et al. [
30] evaluated three ML techniques (ANNs, RFR, and SVR) to forecast stream inflow in Lake Como, Italy. Their results indicated that the streamflow prediction accuracy was higher when ANNs were used than when SVR and RFR were used. Ebrahimi and Shourian [
31] employed the particle swarm optimization algorithm to develop a dynamic KNN model for predicting daily river flow in the Gheshlagh reservoir in Iran. Compared with the classic KNN, ANNs, RFR, and SVR, their proposed model had a higher prediction accuracy. Maspo et al. [
32] systematically reviewed the flood prediction evaluation performance of existing ML techniques. They also identified notable input parameters that can serve as guidelines for flood forecasting.
With the development and improvement of ML techniques, data-driven models are rapidly becoming a key approach for flood mitigation. More recently, a few advanced ML techniques have been proposed. For instance, Chen and Guestrin [
33] proposed the extreme gradient boosting (XGBoost) algorithm based on the framework of the gradient boosting decision tree (GBDT) method. Because the XGBoost model is applied in a learning system, it uses a level-wise method to construct a decision tree, resulting in its favorable performance in several fields [
34,
35,
36,
37,
38]. However, the XGBoost algorithm may exert a negative effect on big data treatment and requires more time during the learning process [
39,
40]. To reduce the high computational cost, the light gradient boosting machine regression (LGBMR) for time-series forecasting was proposed by Microsoft Research [
41]. LGBMR is an ensemble ML technique that uses the new GBDT framework to handle big data with high accuracy. The LGBMR model is a relatively new ML technique that has demonstrated favorable performance in various fields, such as wind turbine operation [
39], blood glucose prediction [
40], human activity recognition [
42], and particulate matter concentration prediction [
43]. LGBMR has several advantages; for example, it has high computational efficiency, can prevent the overfitting problem, can make accurate global predictions, and can solve both classification and regression problems. Although some studies have used LGBMR to solve various time-series regression-type problems, few studies have used it for river stage forecasting. Hence, this study applied LGBMR to forecast floods and compared its performance with that of other ML techniques.
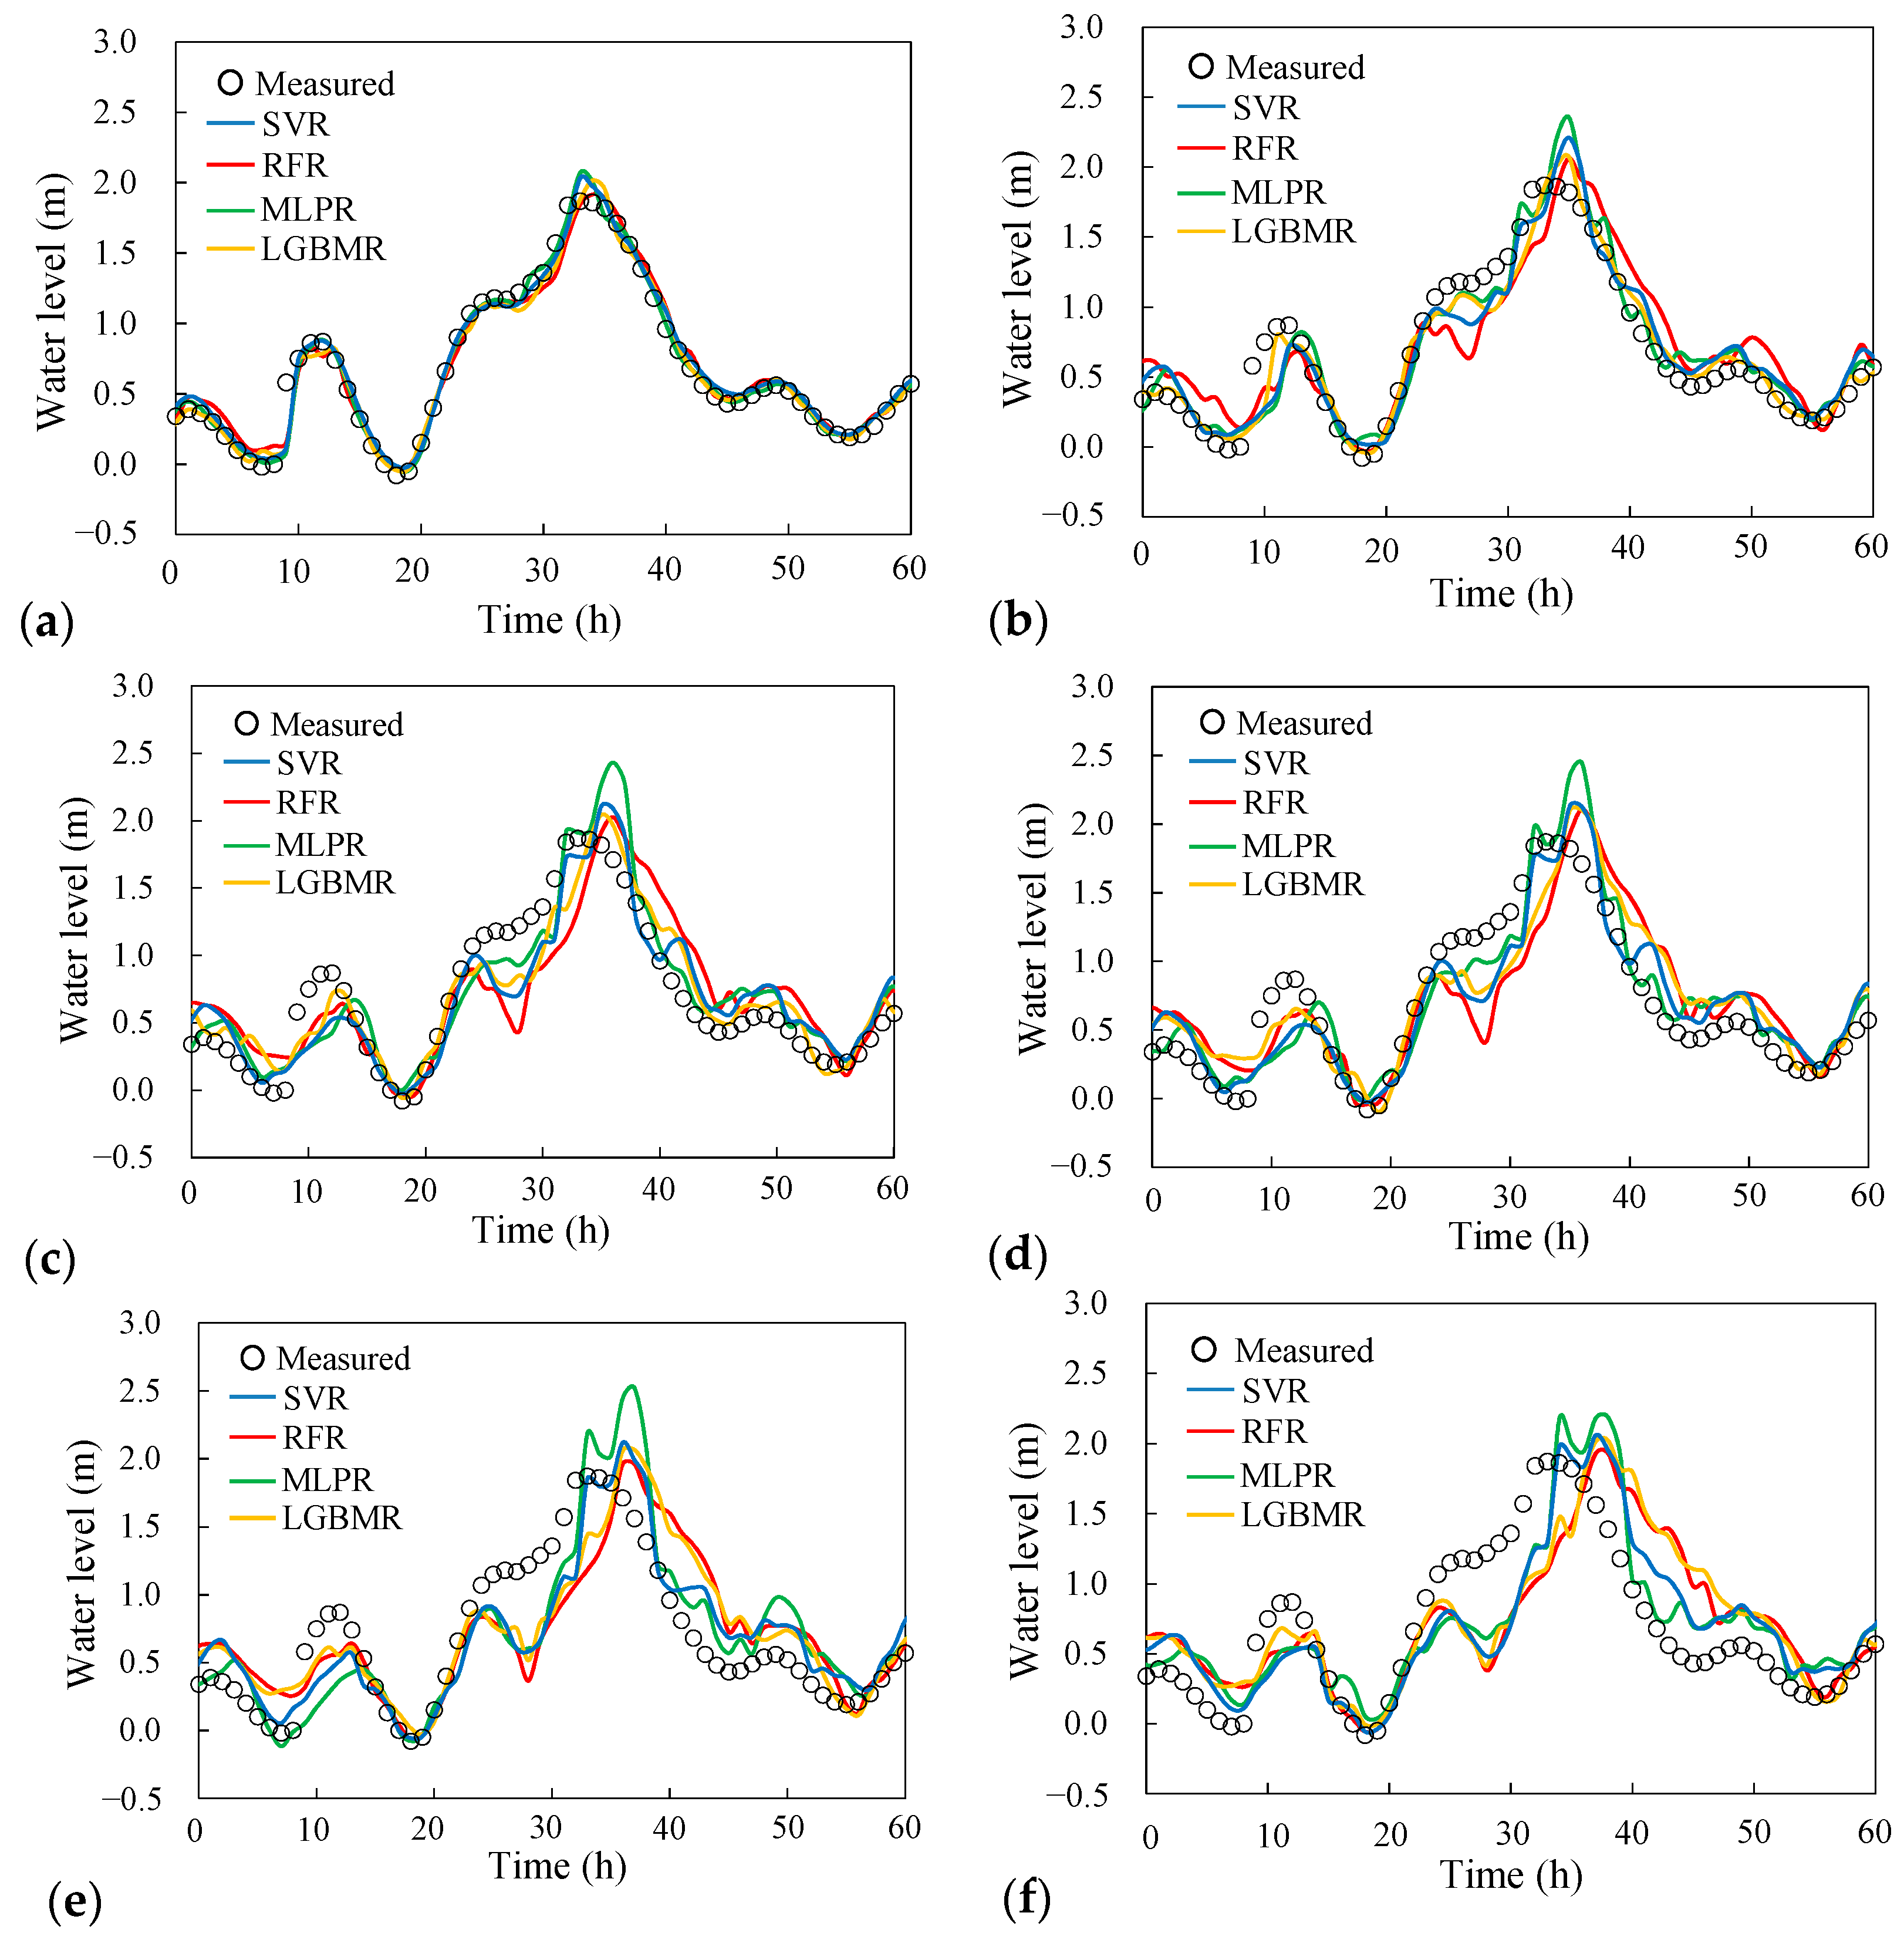
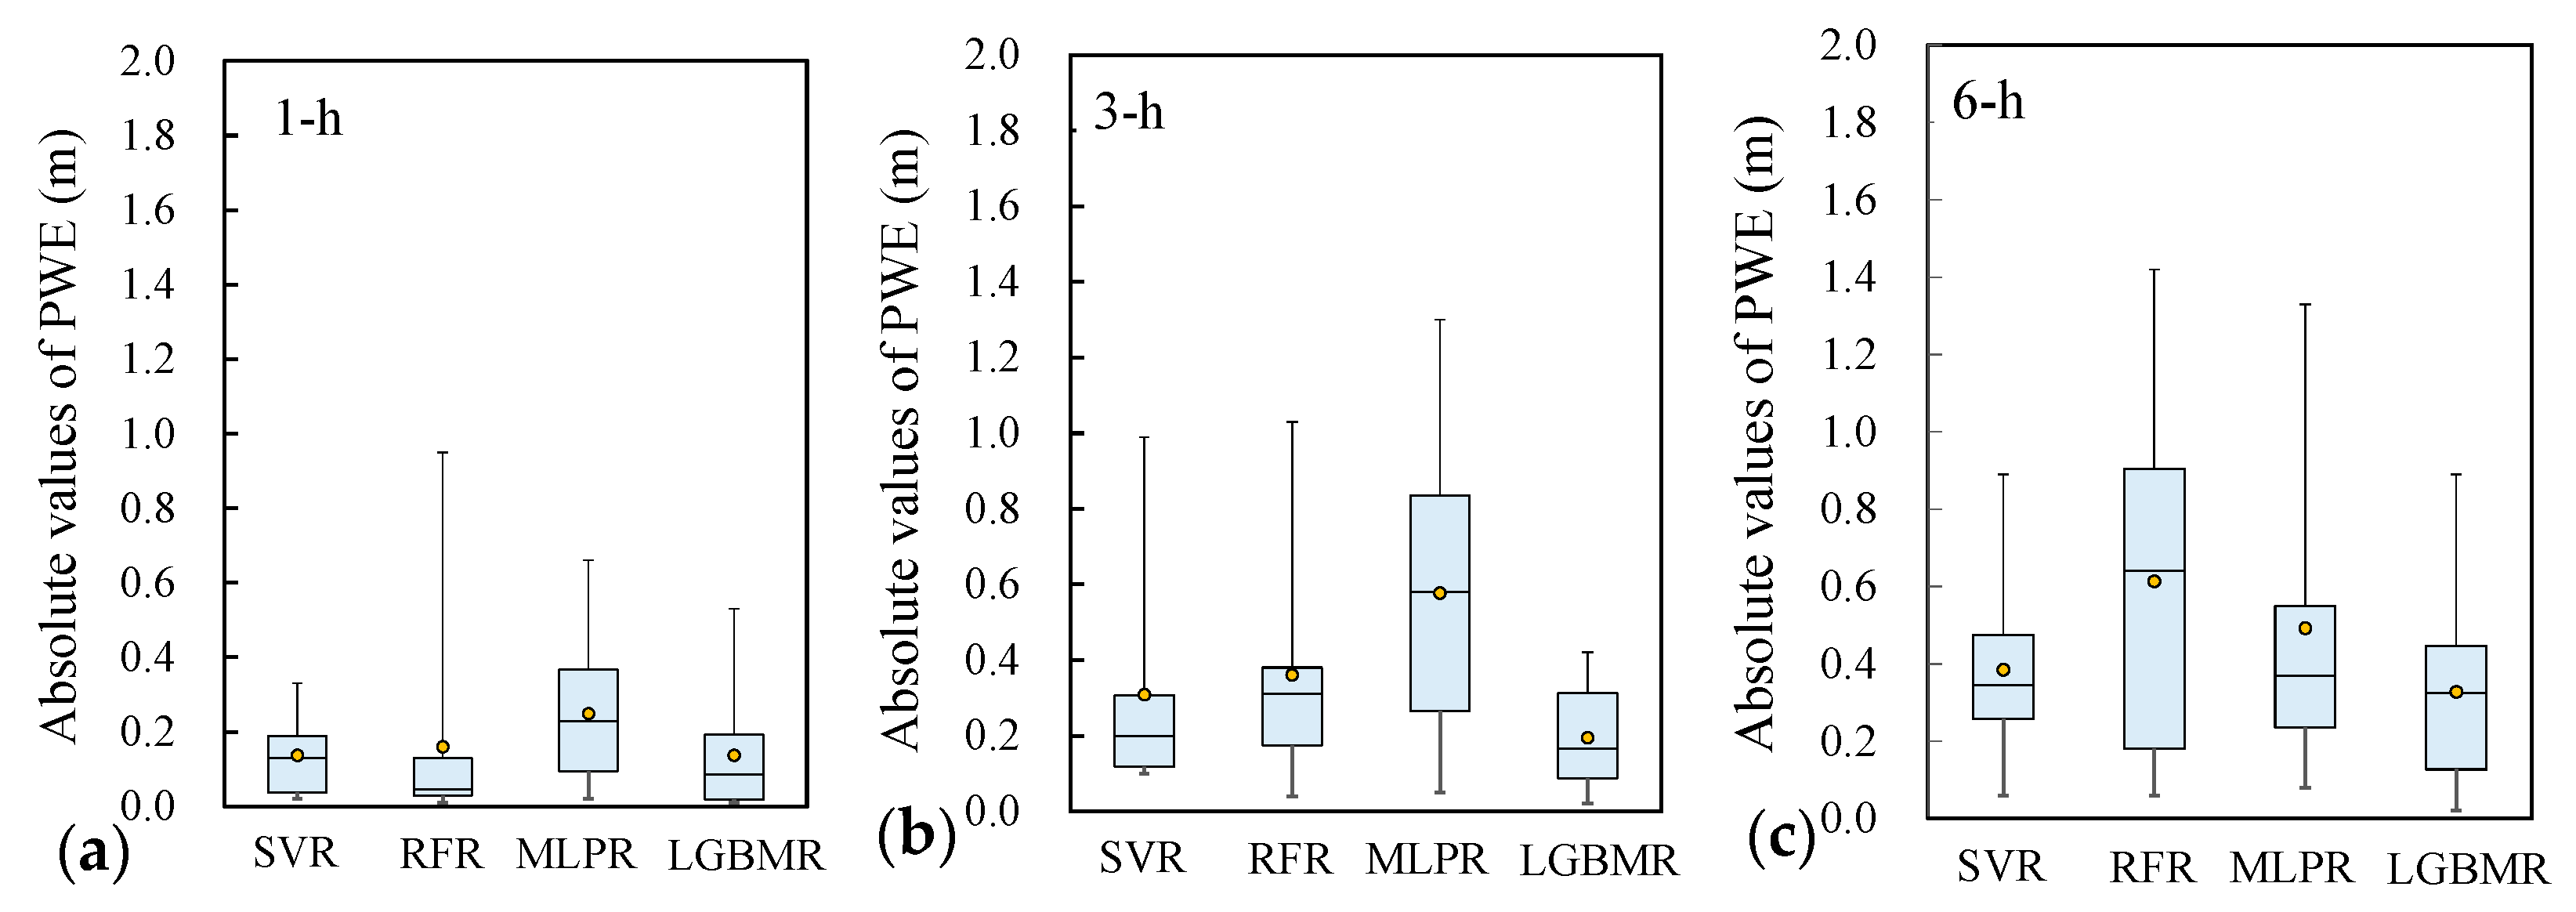
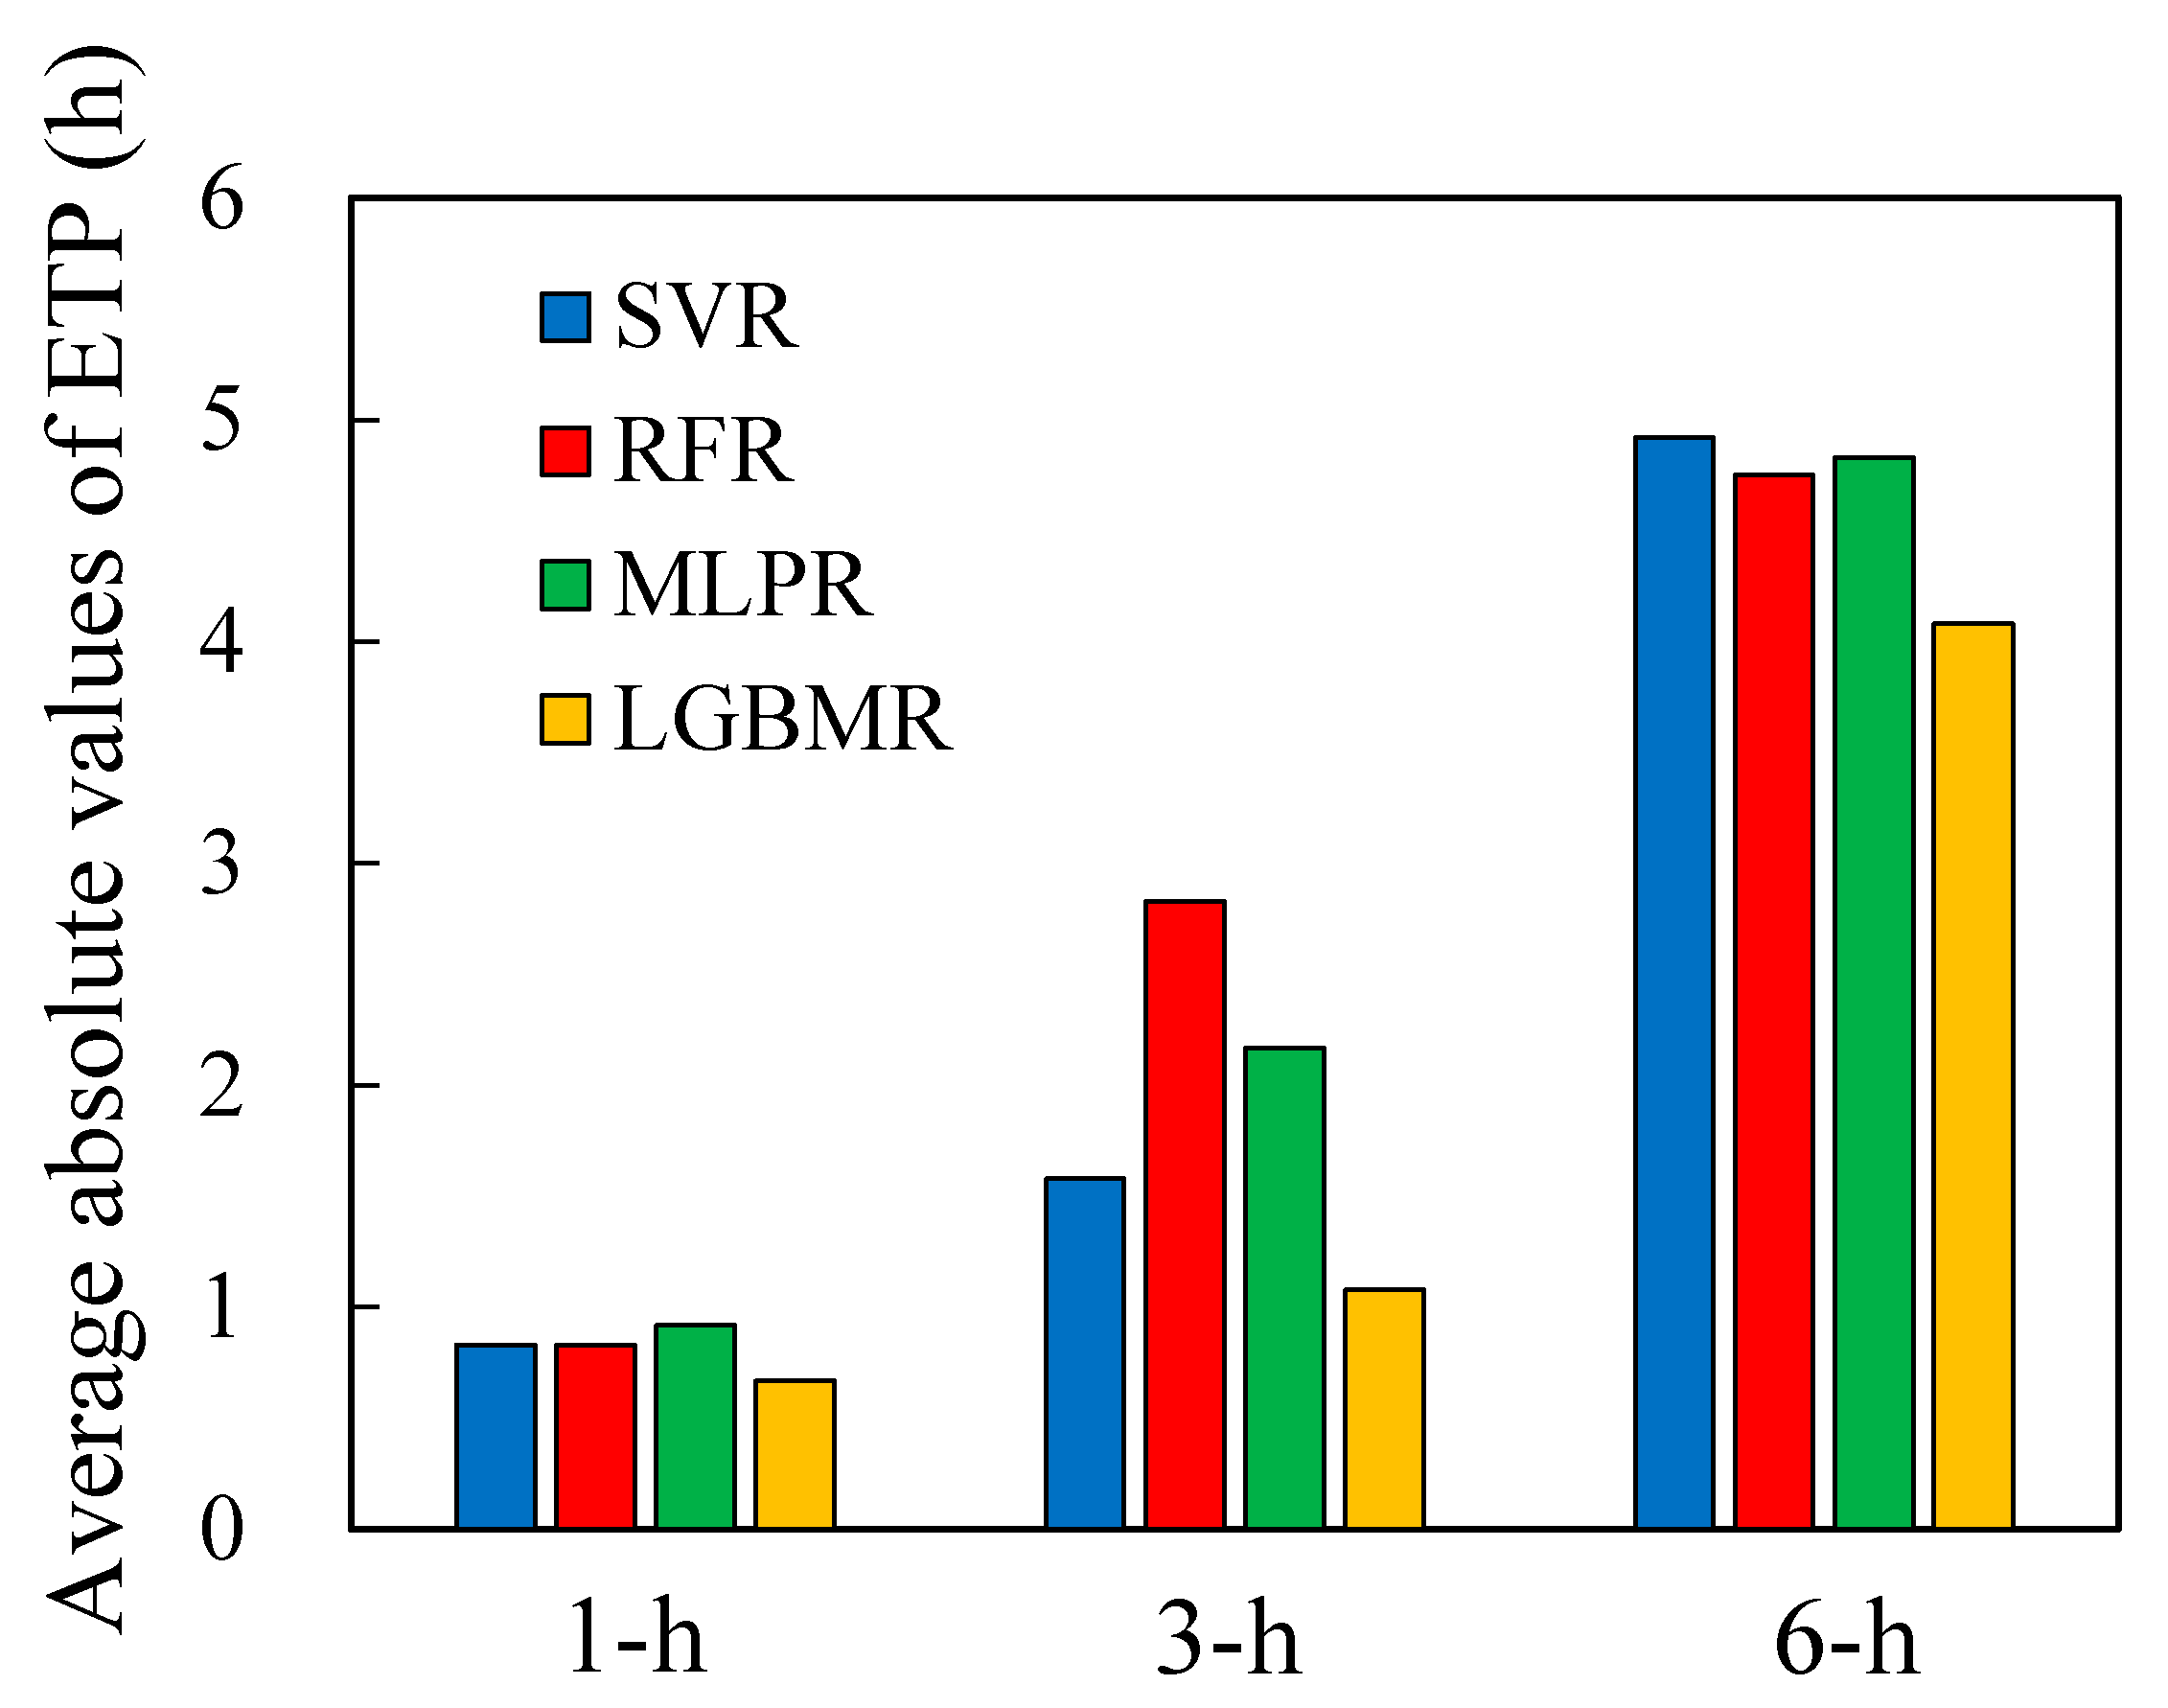
The present study developed four data-driven ML models (SVR, RFR, MLPR, and LGBMR models) for direct multistep forecasting; among these models, the LGBMR model is relatively new and has rarely been applied for the prediction of river floods. To determine the relationship between time-series input and output variables, hourly hydrological data measured from 2004 to 2017 at the Lan-Yang River were collected and divided into training and testing datasets. An accurate flood forecasting model should consider significant factors, such as rainfall, river stage, and discharge. However, few studies have considered the effects of the status of the previous tidal stage while forecasting river floods. Hence, to improve the accuracy of flood forecasting in a tidal river, hydrological records, such as rainfall, water level, and tidal stage data, for the previous 1–6 h were used as input vectors for training the constructed model. To achieve optimal inputs, the effects of the different combinations of input variables on the prediction results were examined in this study. On the basis of optimal inputs, optimal parameters were determined through Bayesian optimization and through the use of 10 cross-validation sets in the training phase. After the establishment of the four models, the test dataset was used to predict the river stage with a lead time of 1–6 h. According to the evaluation criteria, the forecasting performance of the four models was evaluated and compared for both the training and test results.
The primary contributions of this study are summarized as follows:
This study contributes to improving forecasting performance by revealing the optimal combinations of input variables, such as rainfall, water level, and tidal stage.
This is the first study to propose a direct multistep forecasting model based on LGBMR with Bayesian optimization for flood forecasting with a lead time of 1–6 h.
The present study comprehensively assessed and compared the performance of four models (SVR, RFR, MLPR, and LGBMR) for forecasting the water level in a tidal river.
3. Study Area and Data
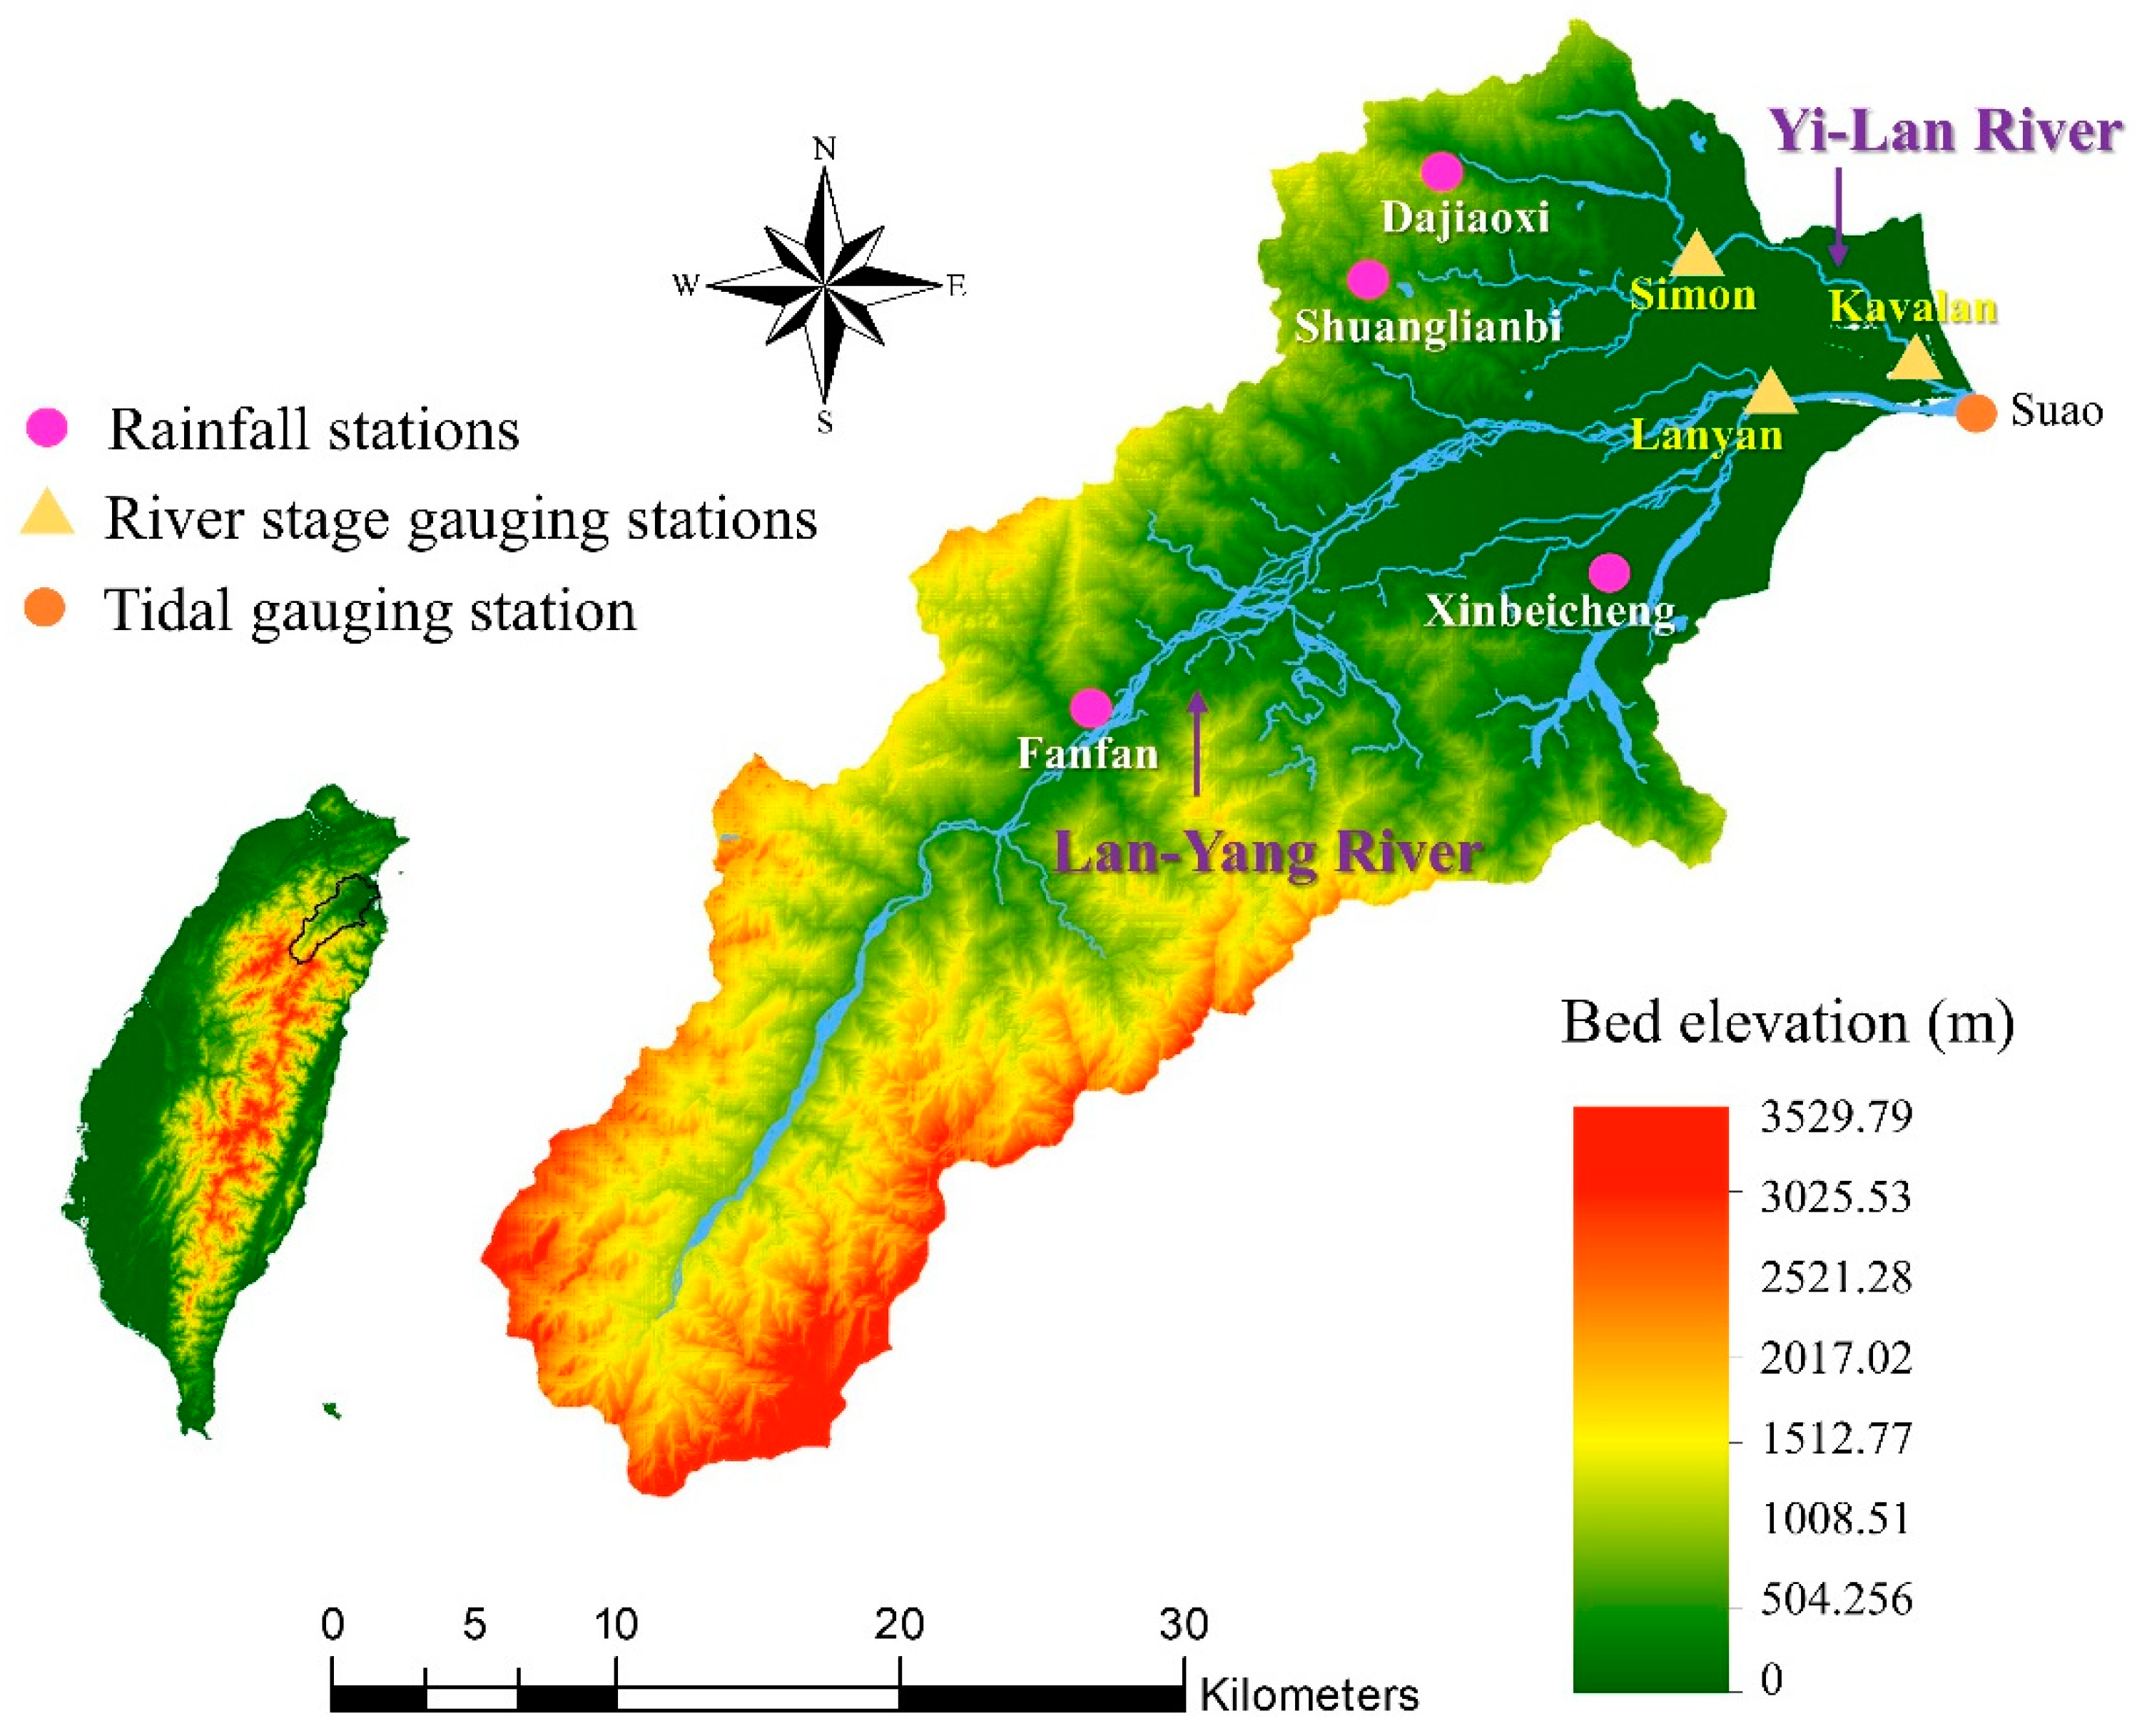
The Lan-Yang River basin, which has a watershed area of 978 km
2, is located in the northeast part of Taiwan (
Figure 3). The main river reach of the Lan-Yang River has a length of 73 km and an average slope of 1/55. The Yi-Lan River, with a length of 17.25 km, is a tributary of Lan-Yang River.
Figure 3 shows the locations of hydrological stations, namely four rainfall gauging stations, three river stage gauging stations, and one tidal gauging station. The four models were constructed to forecast river stages at the Lanyan, Simon, and Kavalan stations with a lead time of 1–6 h. The Kavalan station is located at the Yi-Lan River and is situated near the estuary. The river stage at the Kavalan station may be affected by the upstream discharge and tidal level. Therefore, this study considered the tidal effect while predicting the river stage at the Kavalan station.
In this study, data regarding hourly rainfall, river stage, and tidal level at each station were collected for two types of events, namely typhoons and storms.
Table 1 lists data collected from June 2004 to October 2017 as well as the maximum water level at the three stations. The total collected data of 37 events were considered for both Lanyan and Simon stations. Because the Kavalan station had limited available data and some missing data, the collected data of 20 events were used. As shown in
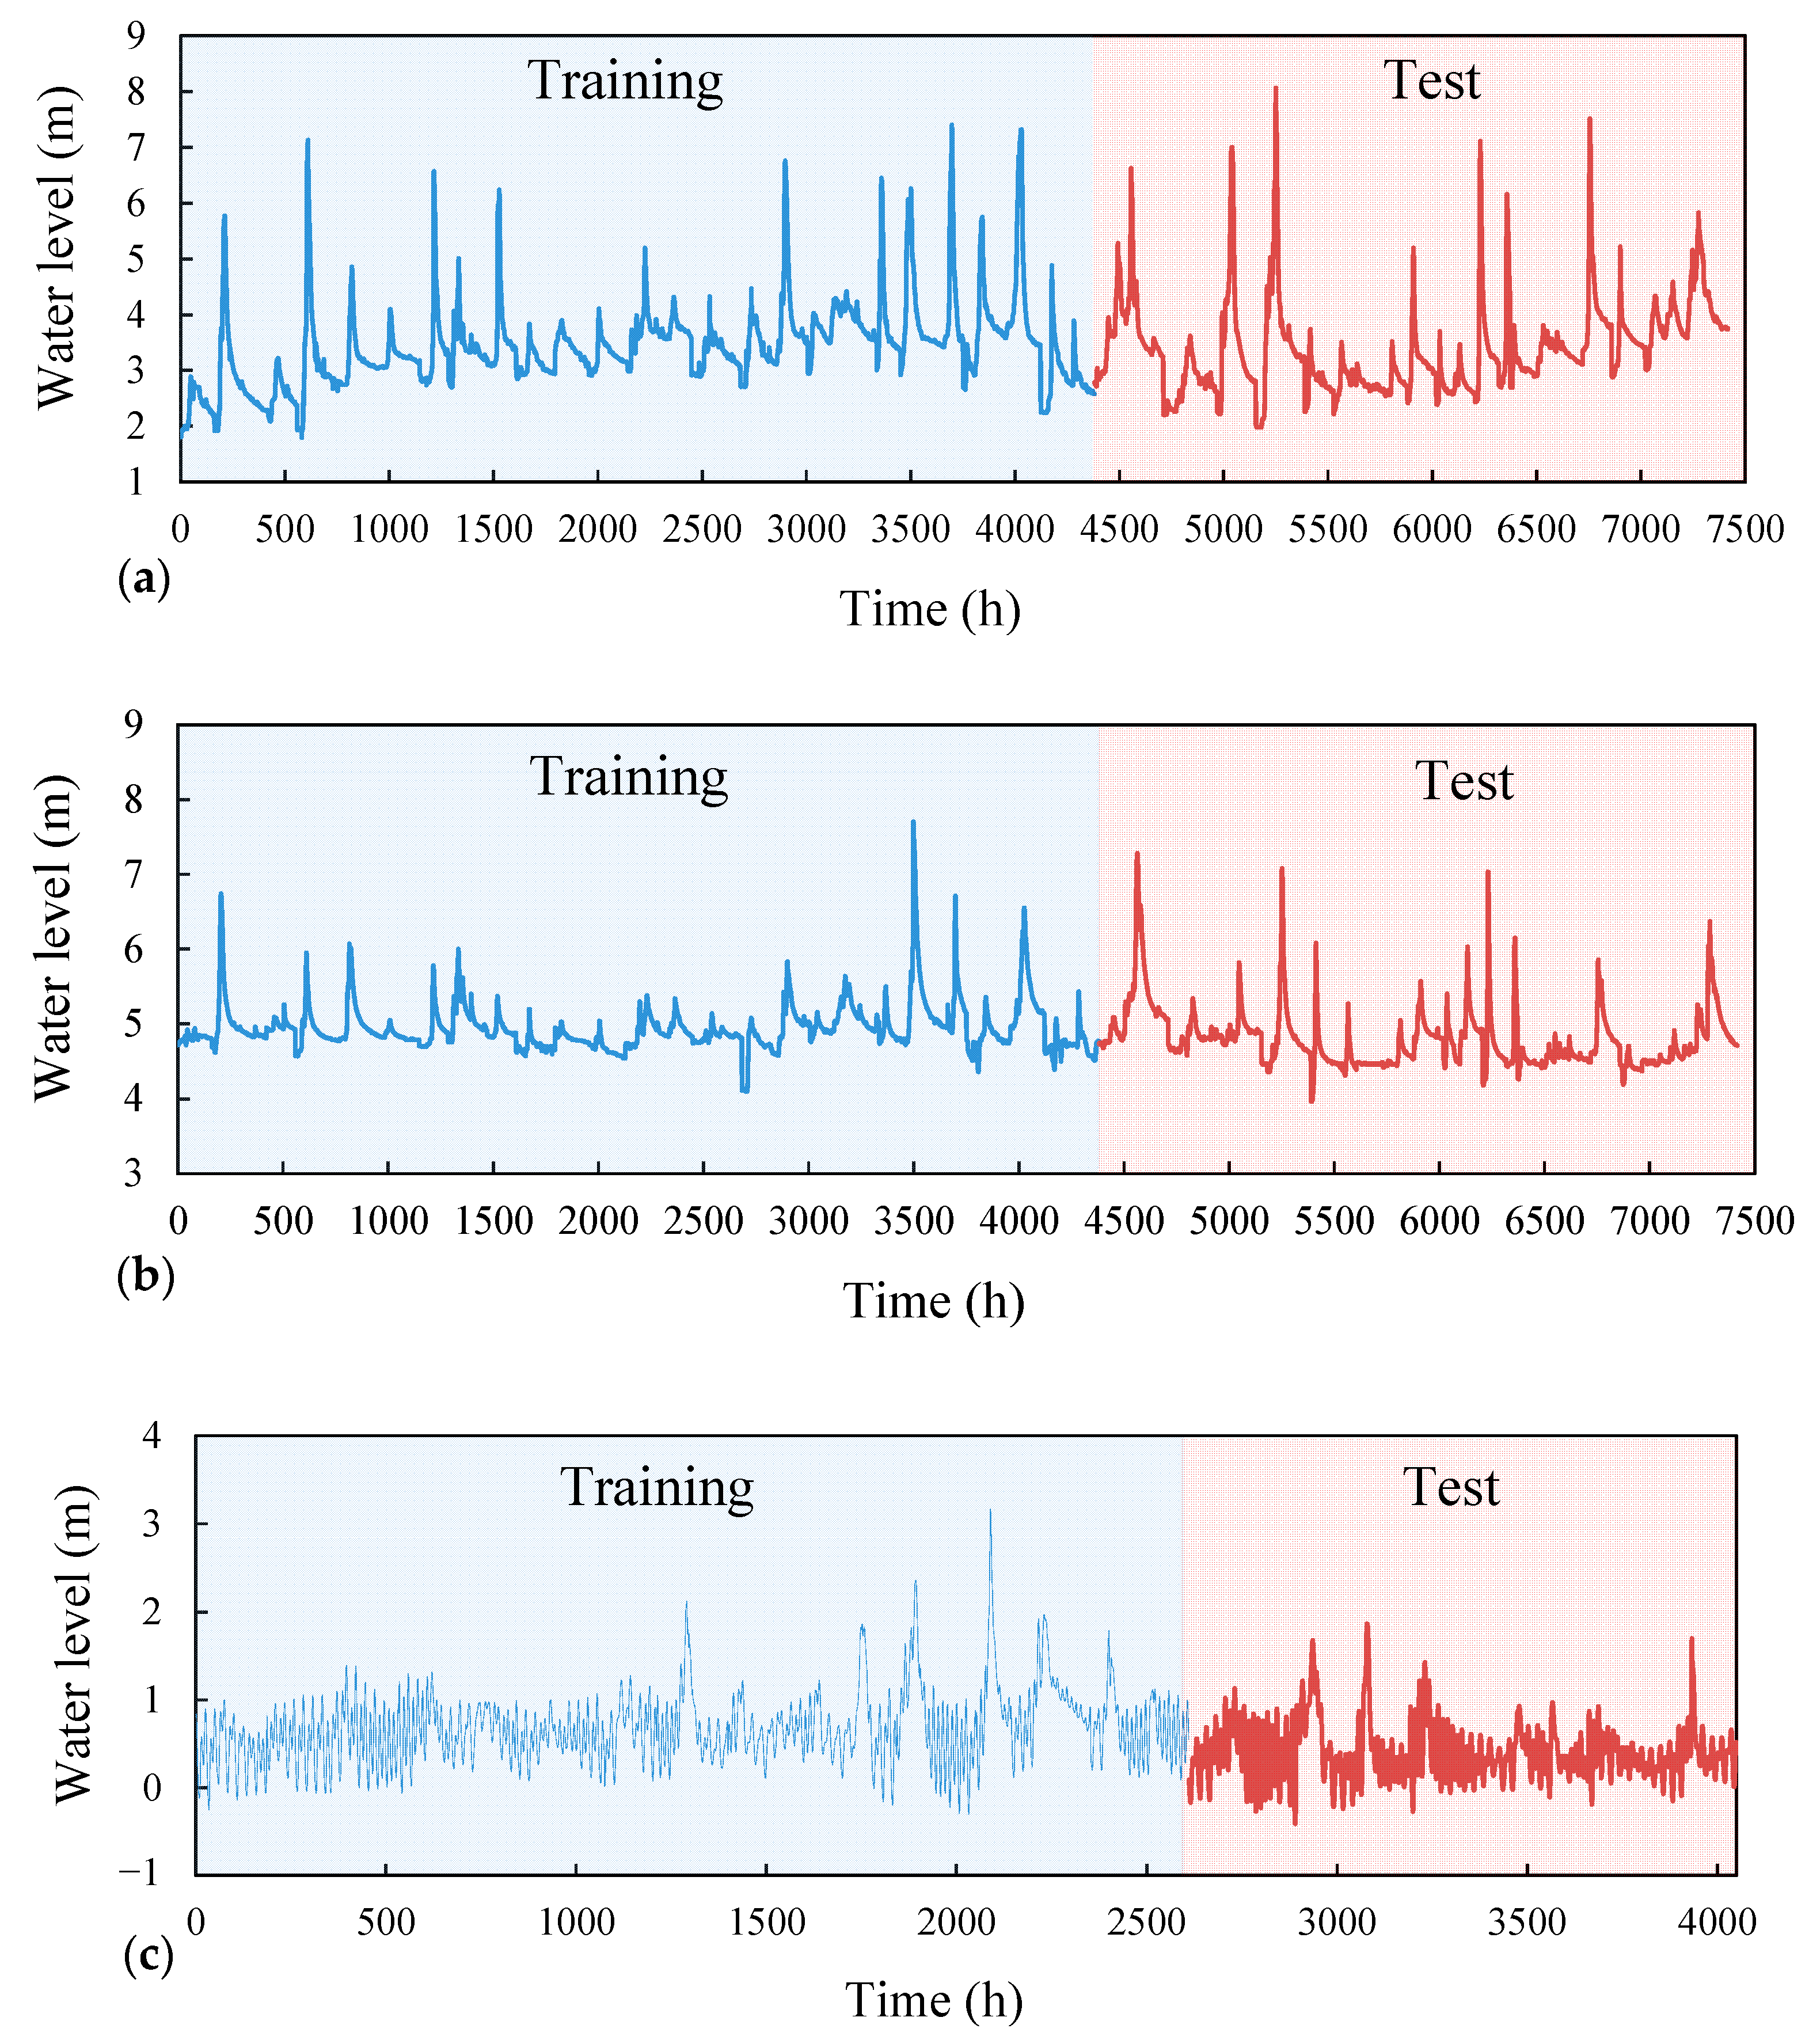
Table 1, the maximum values of recorded river stages at the Lanyan, Simon, and Kavalan stations were 8.06, 7.54, and 3.11 m, respectively. To further examine the hydrology statistics,
Table 2 lists the characteristic based on collected data from 2004 to 2017. For the training data sets of Lanyan station, the result indicates that the water level ranged from 1.80 m to 7.40 m, and the mean water level is 3.42 m.
To construct and assess the four models, the total collected data were separated into training and test datasets.
Figure 4 shows the measured river stage data used for the Lanyan, Simon, and Kavalan stations. Significant increases and decreases in the river stage usually occur from May to October. In addition, the river stages at the Lanyan and Simon stations were unaffected by the tidal current, whereas the river stage at the Kavalan station was significantly affected by the tidal current.
Figure 4 displays the employed datasets, in which 70% (Event No. 1–22) was used for training and the remaining 30% (Event No. 23–37) was utilized for testing.


