

Assessment of Critical Shear Stress and Threshold Velocity in Shallow Flow with Sand Particles

Abstract
1. Introduction
2. Theoretical Background
2.1. Threshold Average Velocity Equations
2.2. Threshold Near-Bed Velocity Equation
2.3. Shields Approach
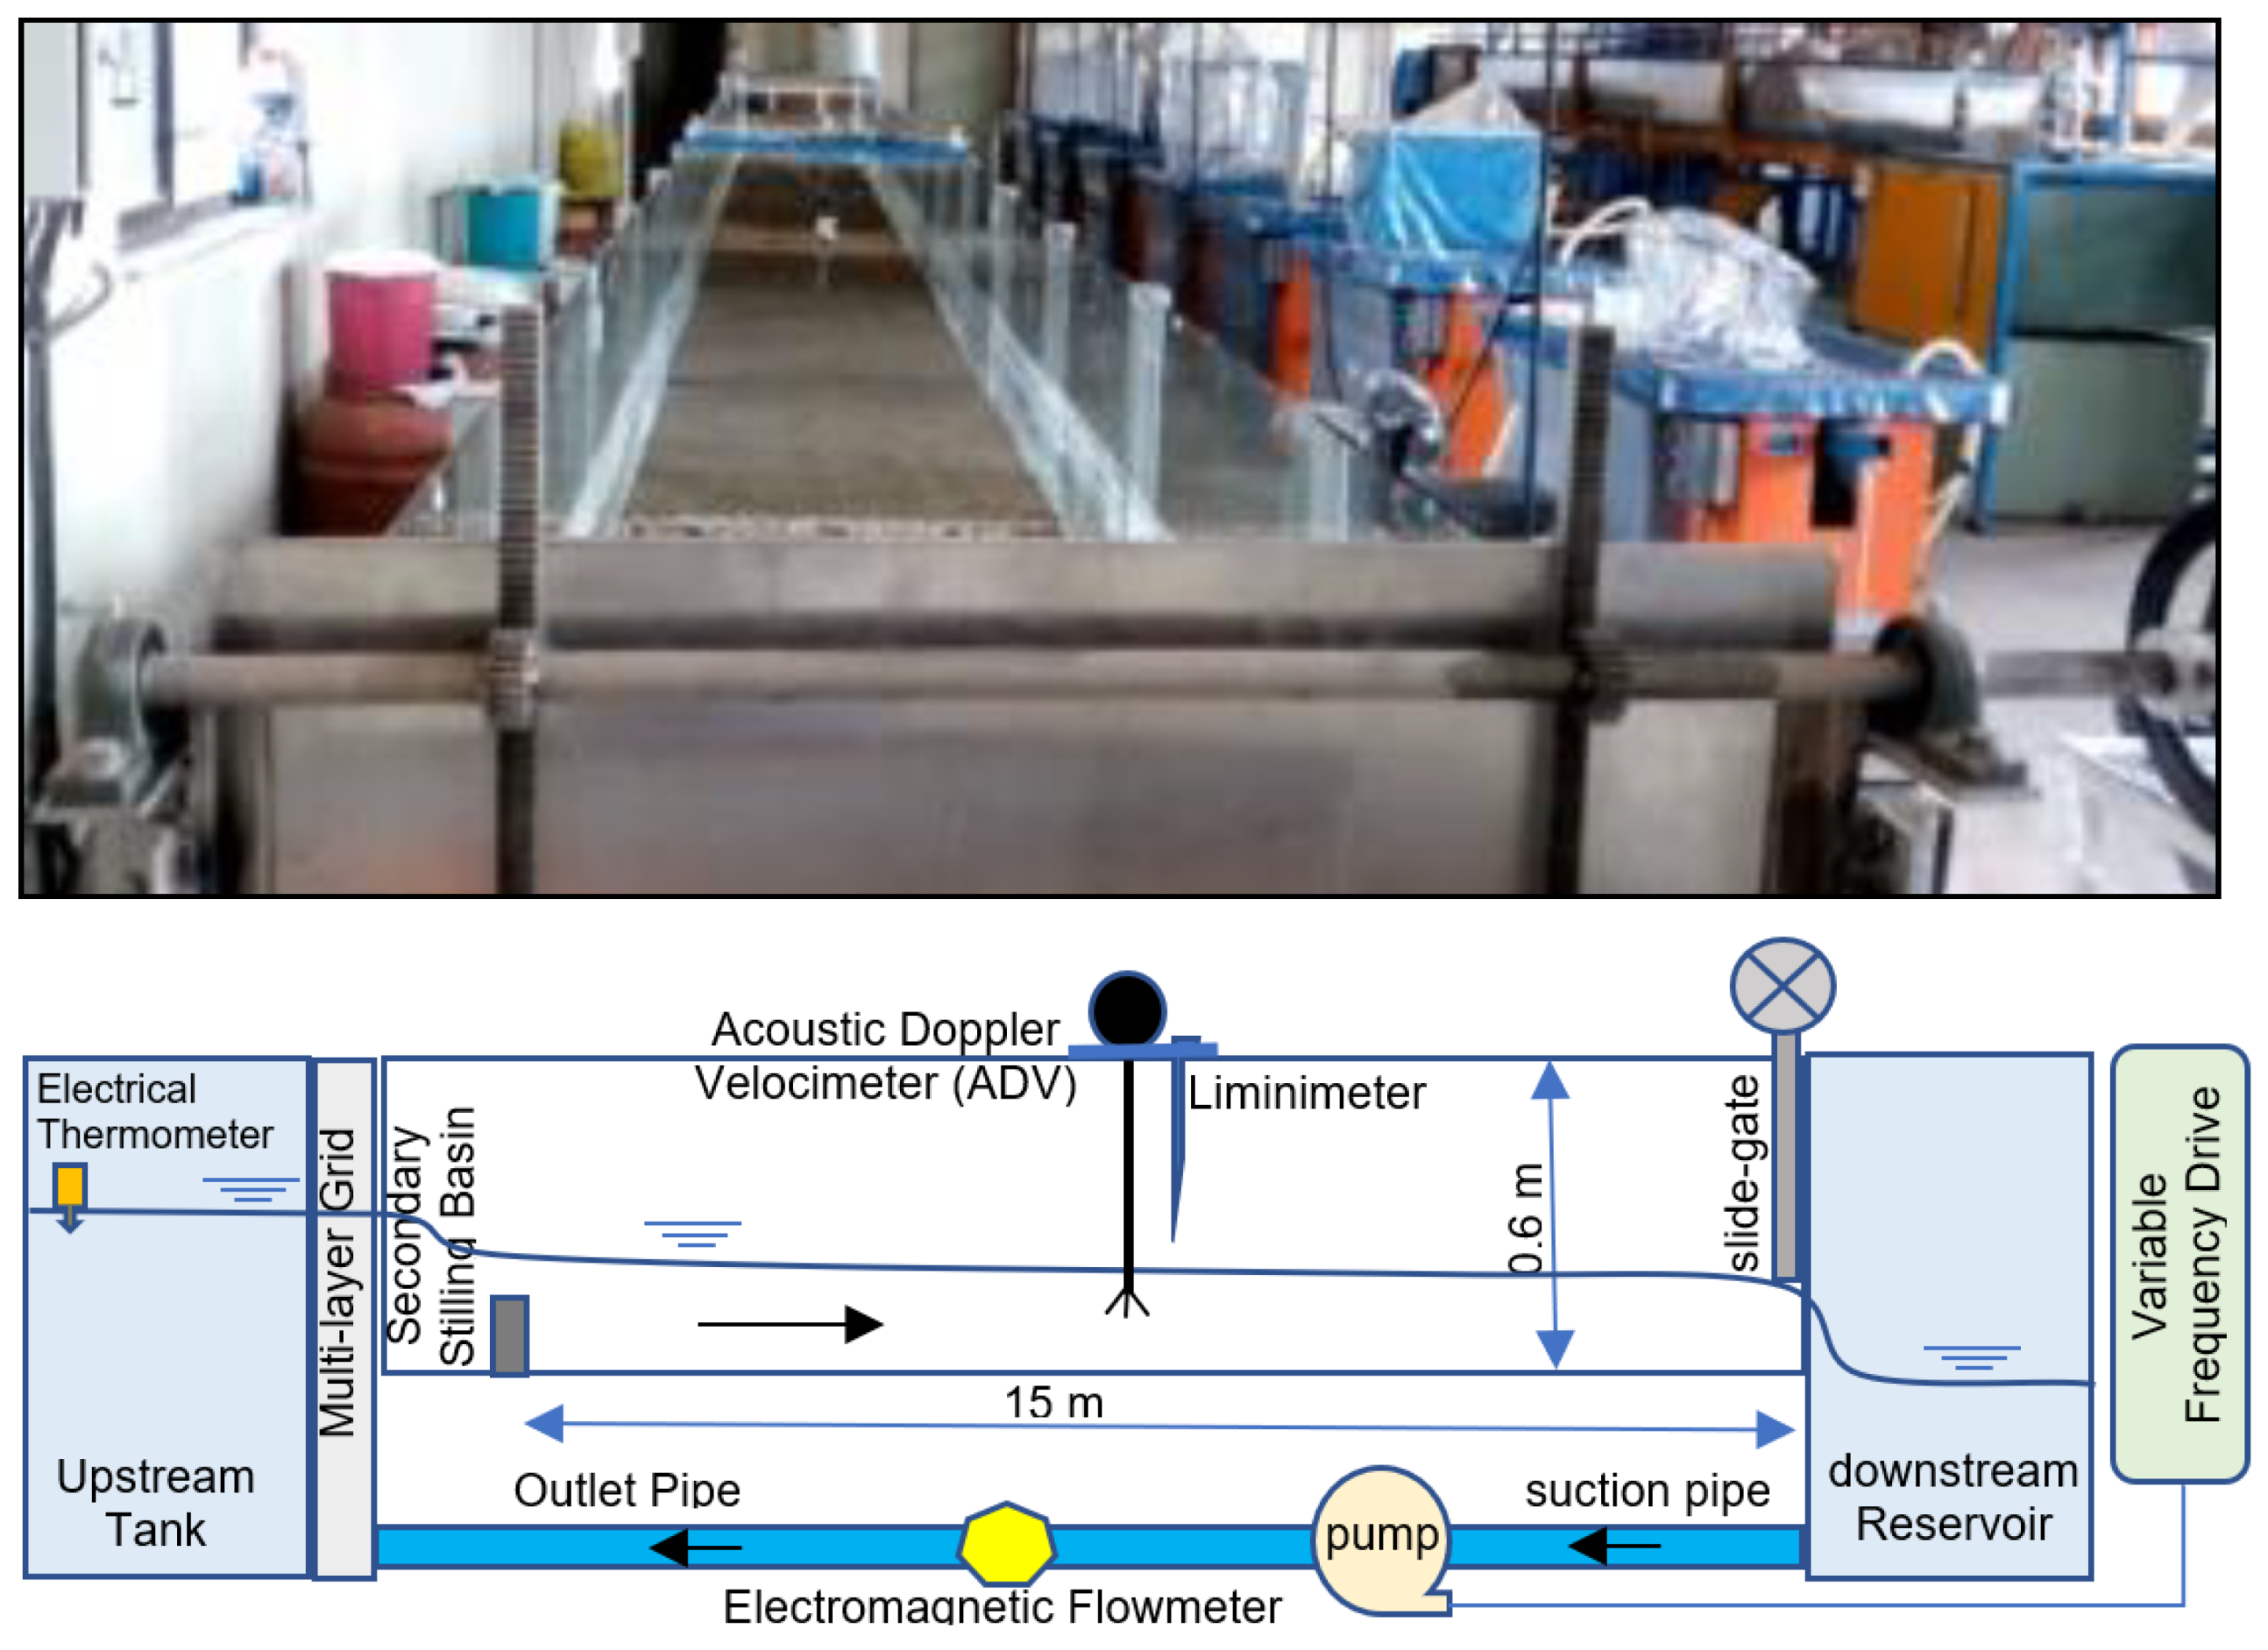
3. Materials and Methods
4. Results
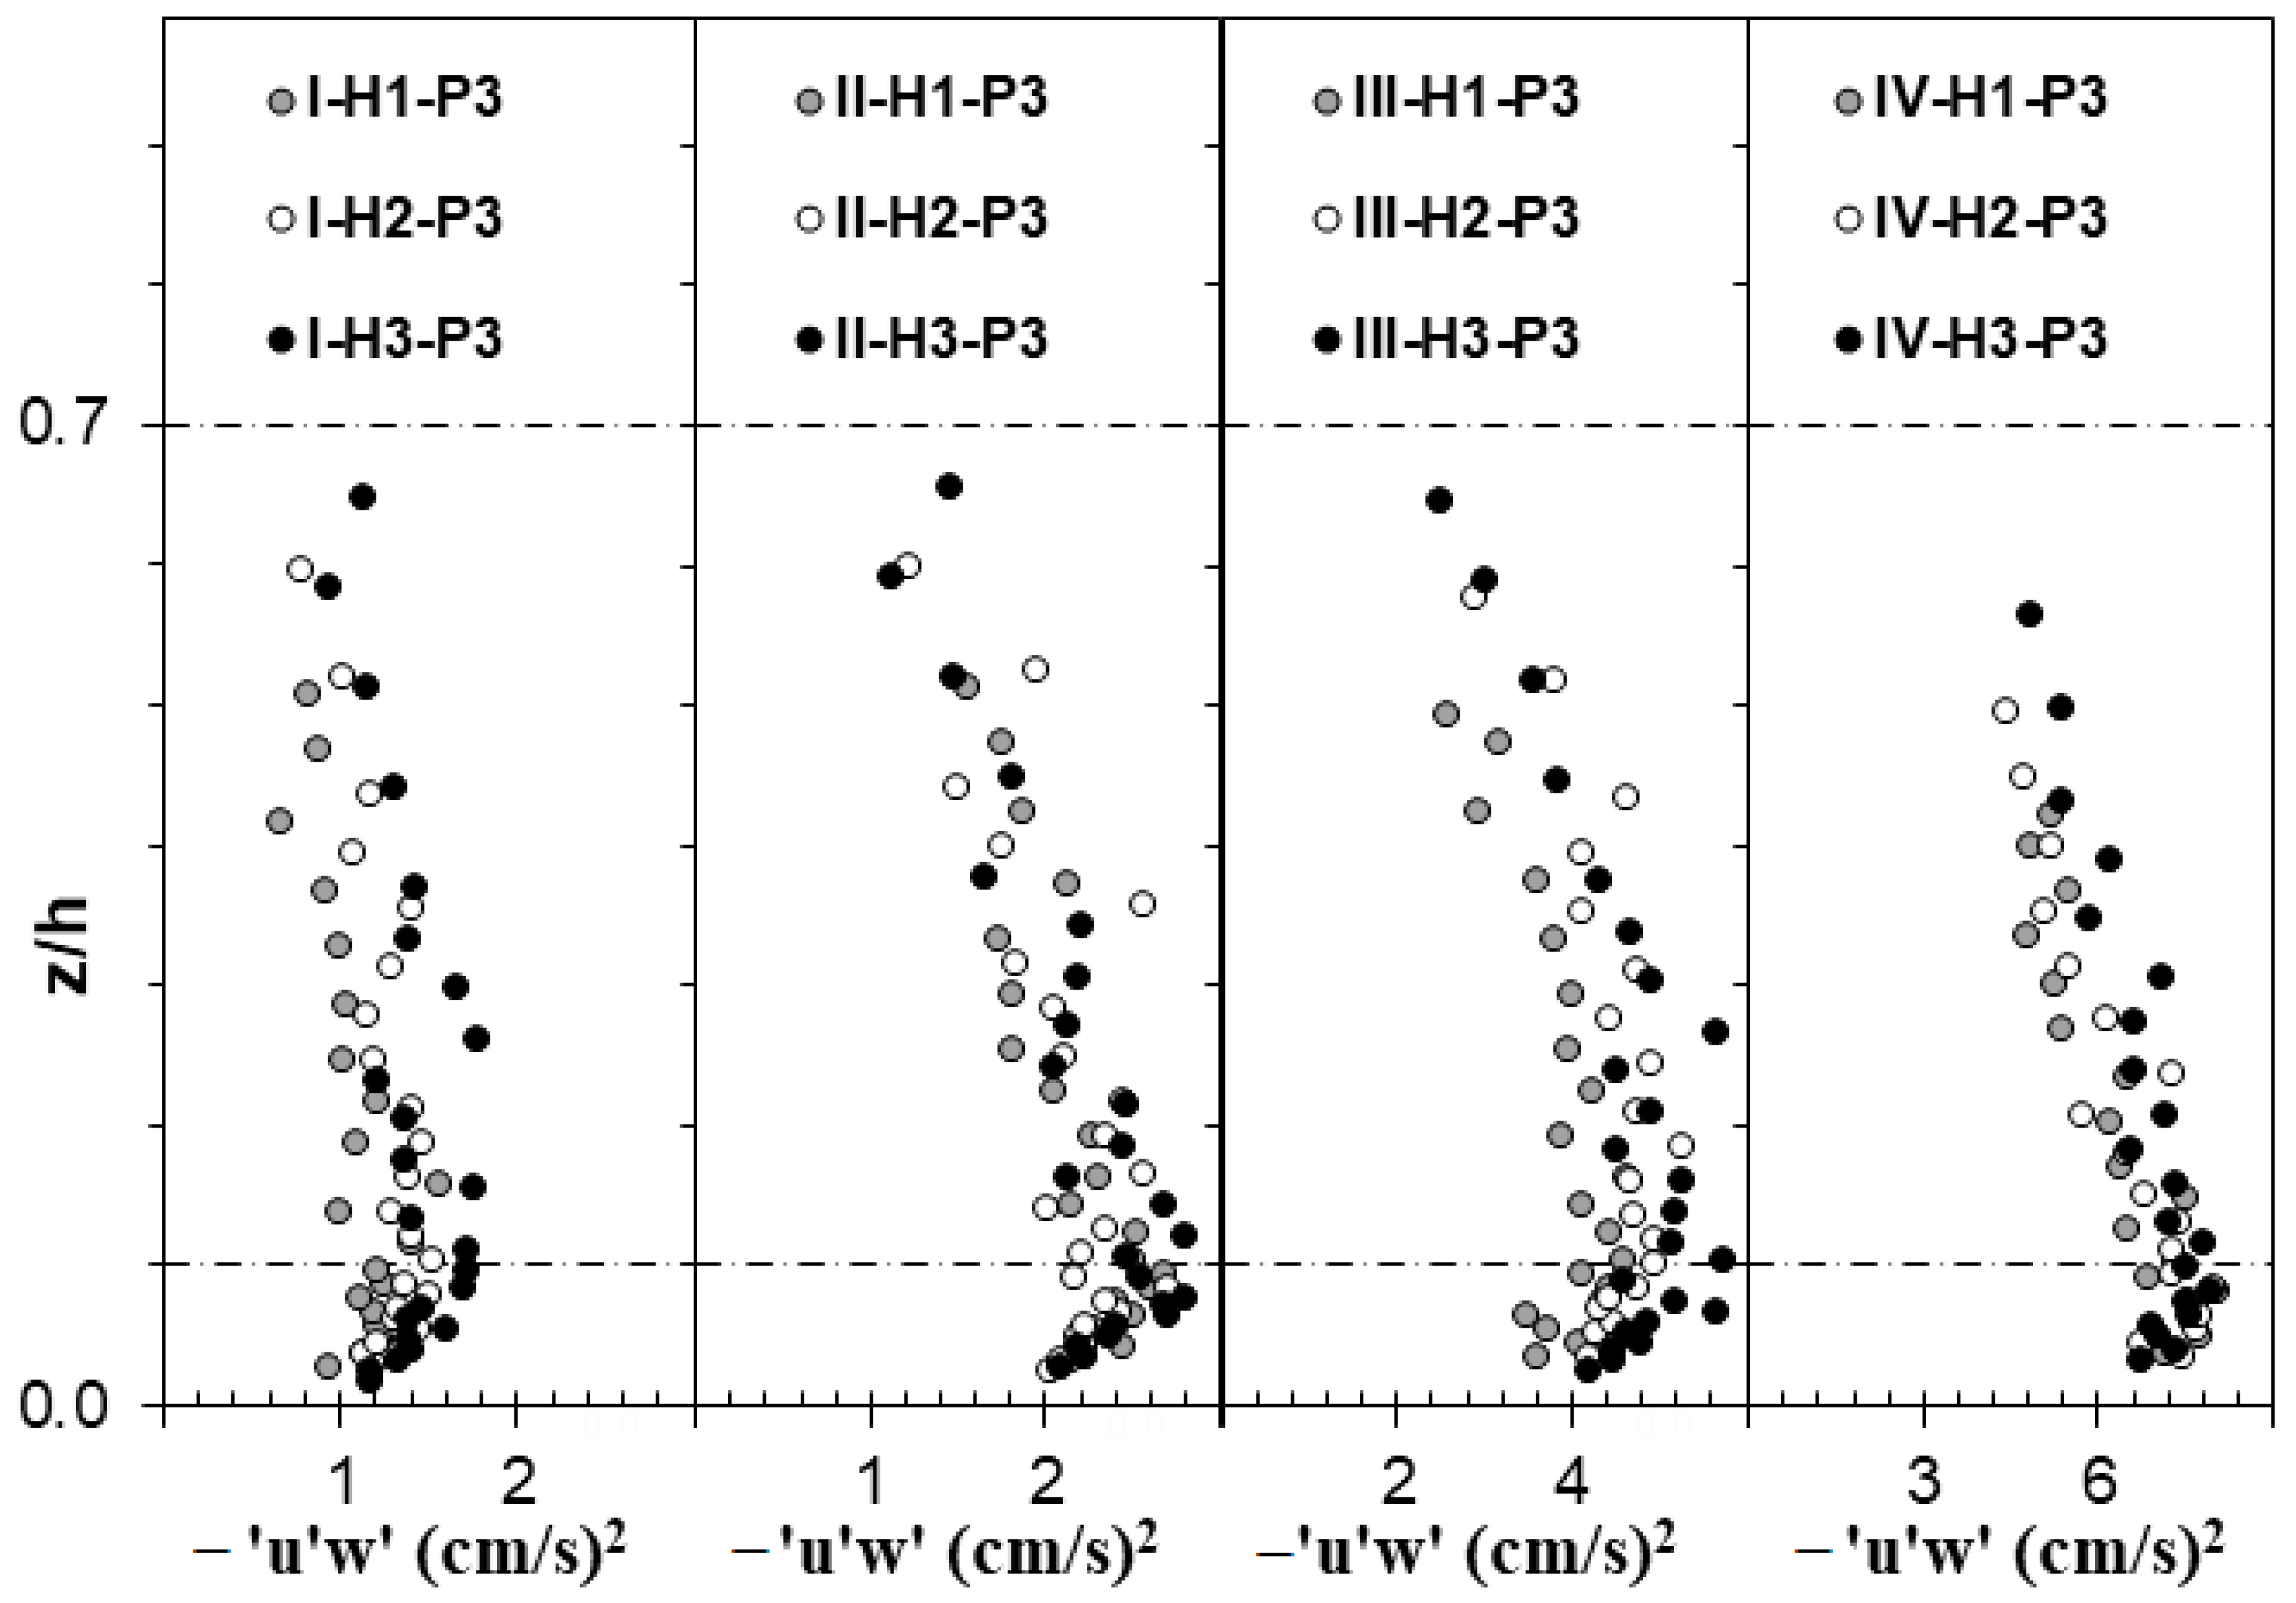
4.1. Characteristics of Flow over the Sand Bed
4.2. Threshold Average Velocity
4.3. Threshold Near-Bed Velocity
4.4. Shields Diagram
5. Discussion
5.1. Characteristics of Flow over the Sand Bed
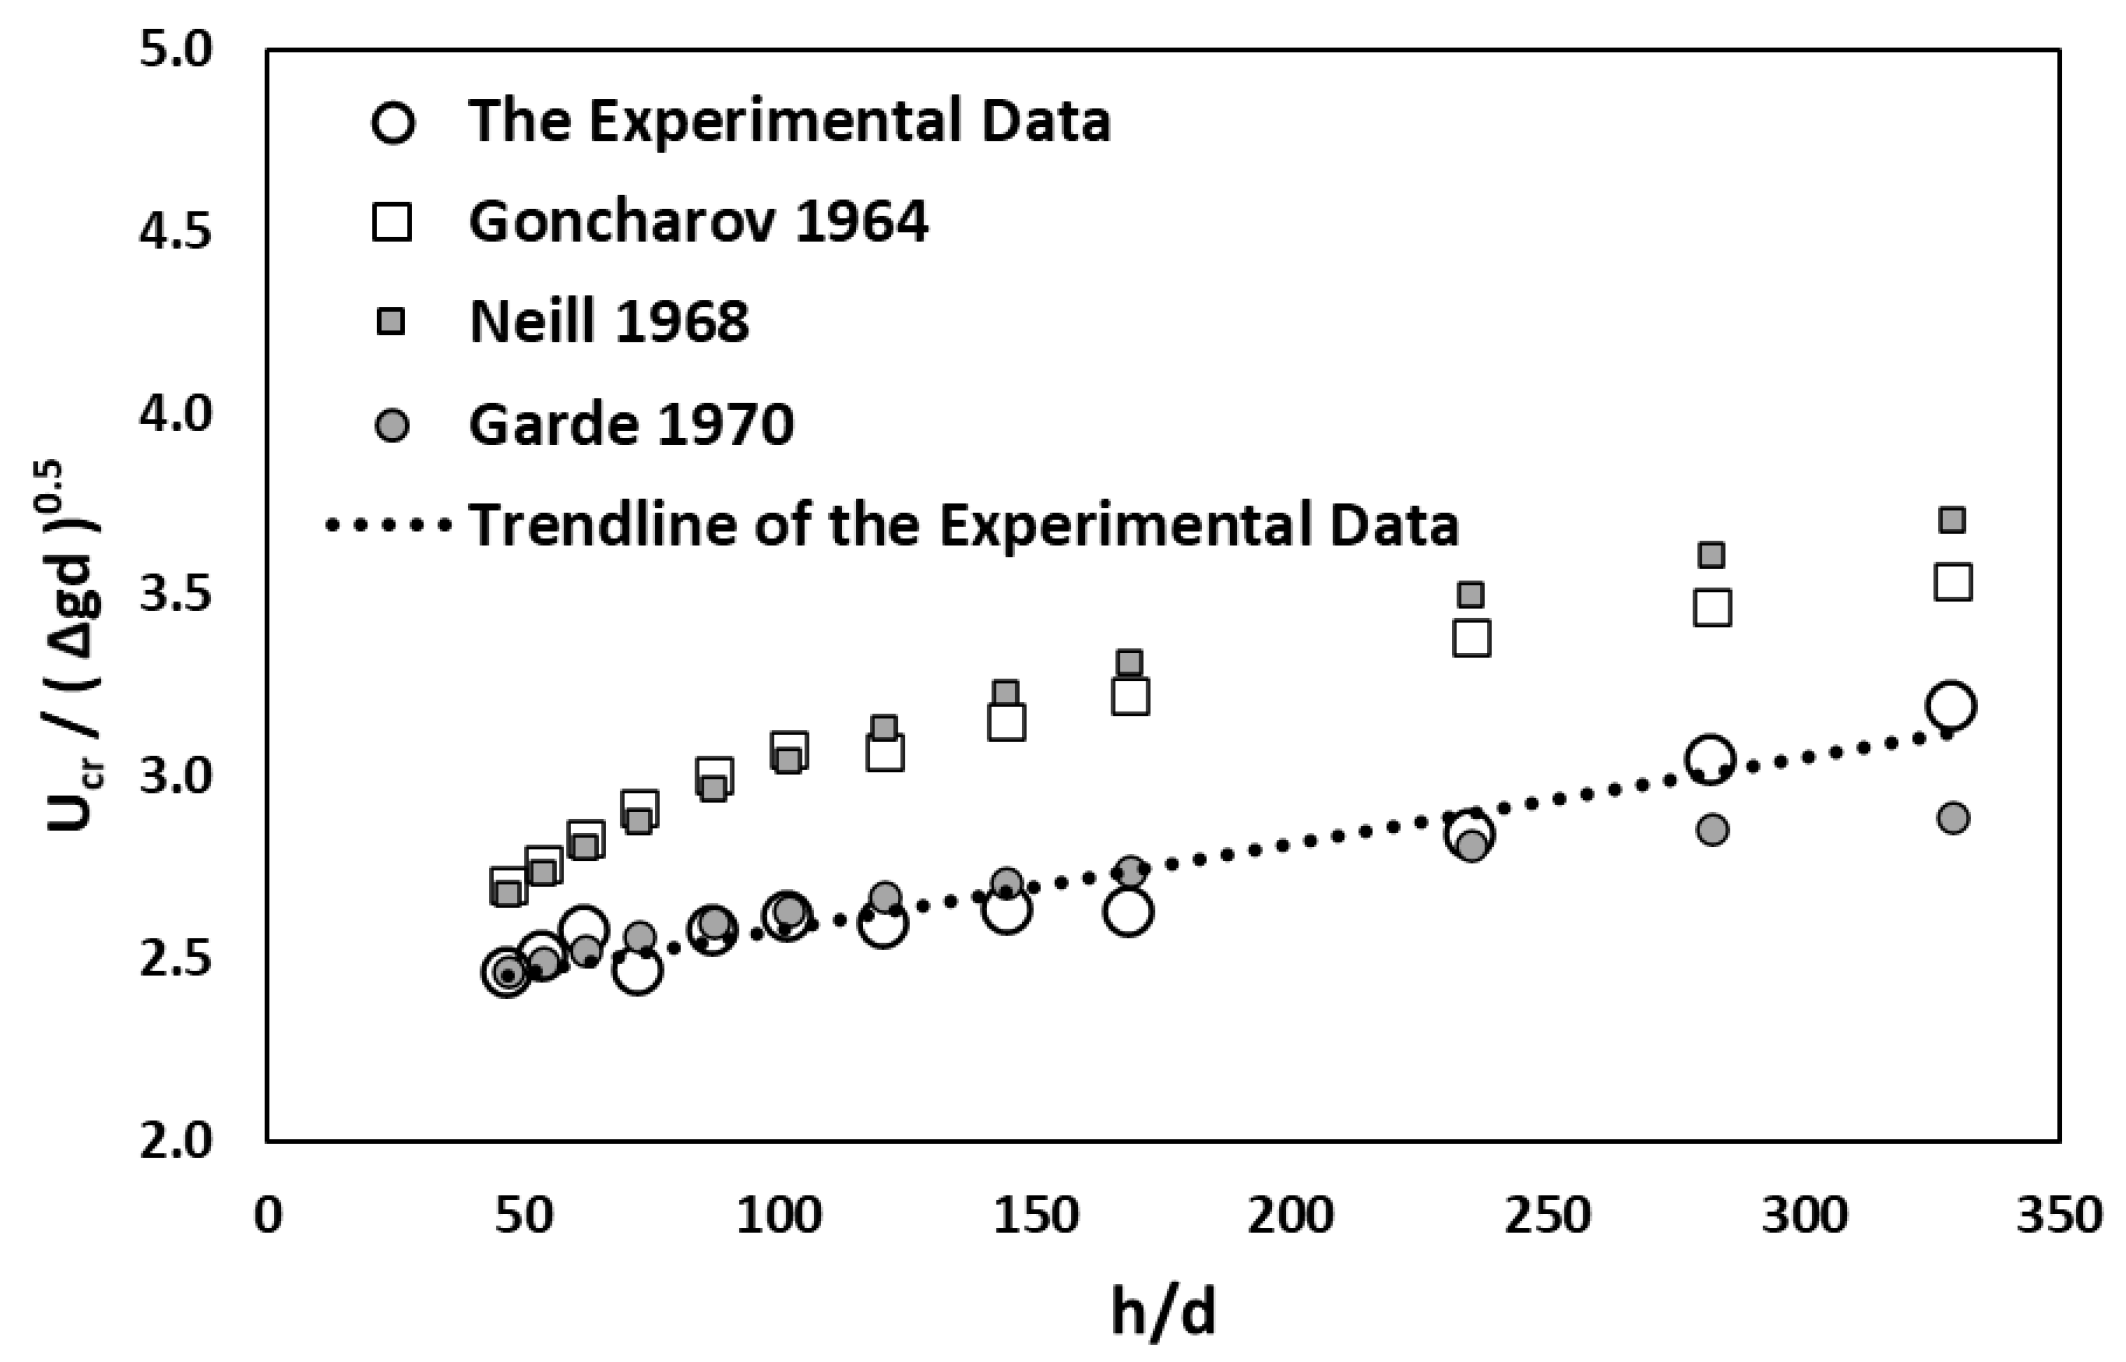
5.2. Threshold Average Velocity
5.3. Threshold Near-Bed Velocity
5.4. Shields Diagram
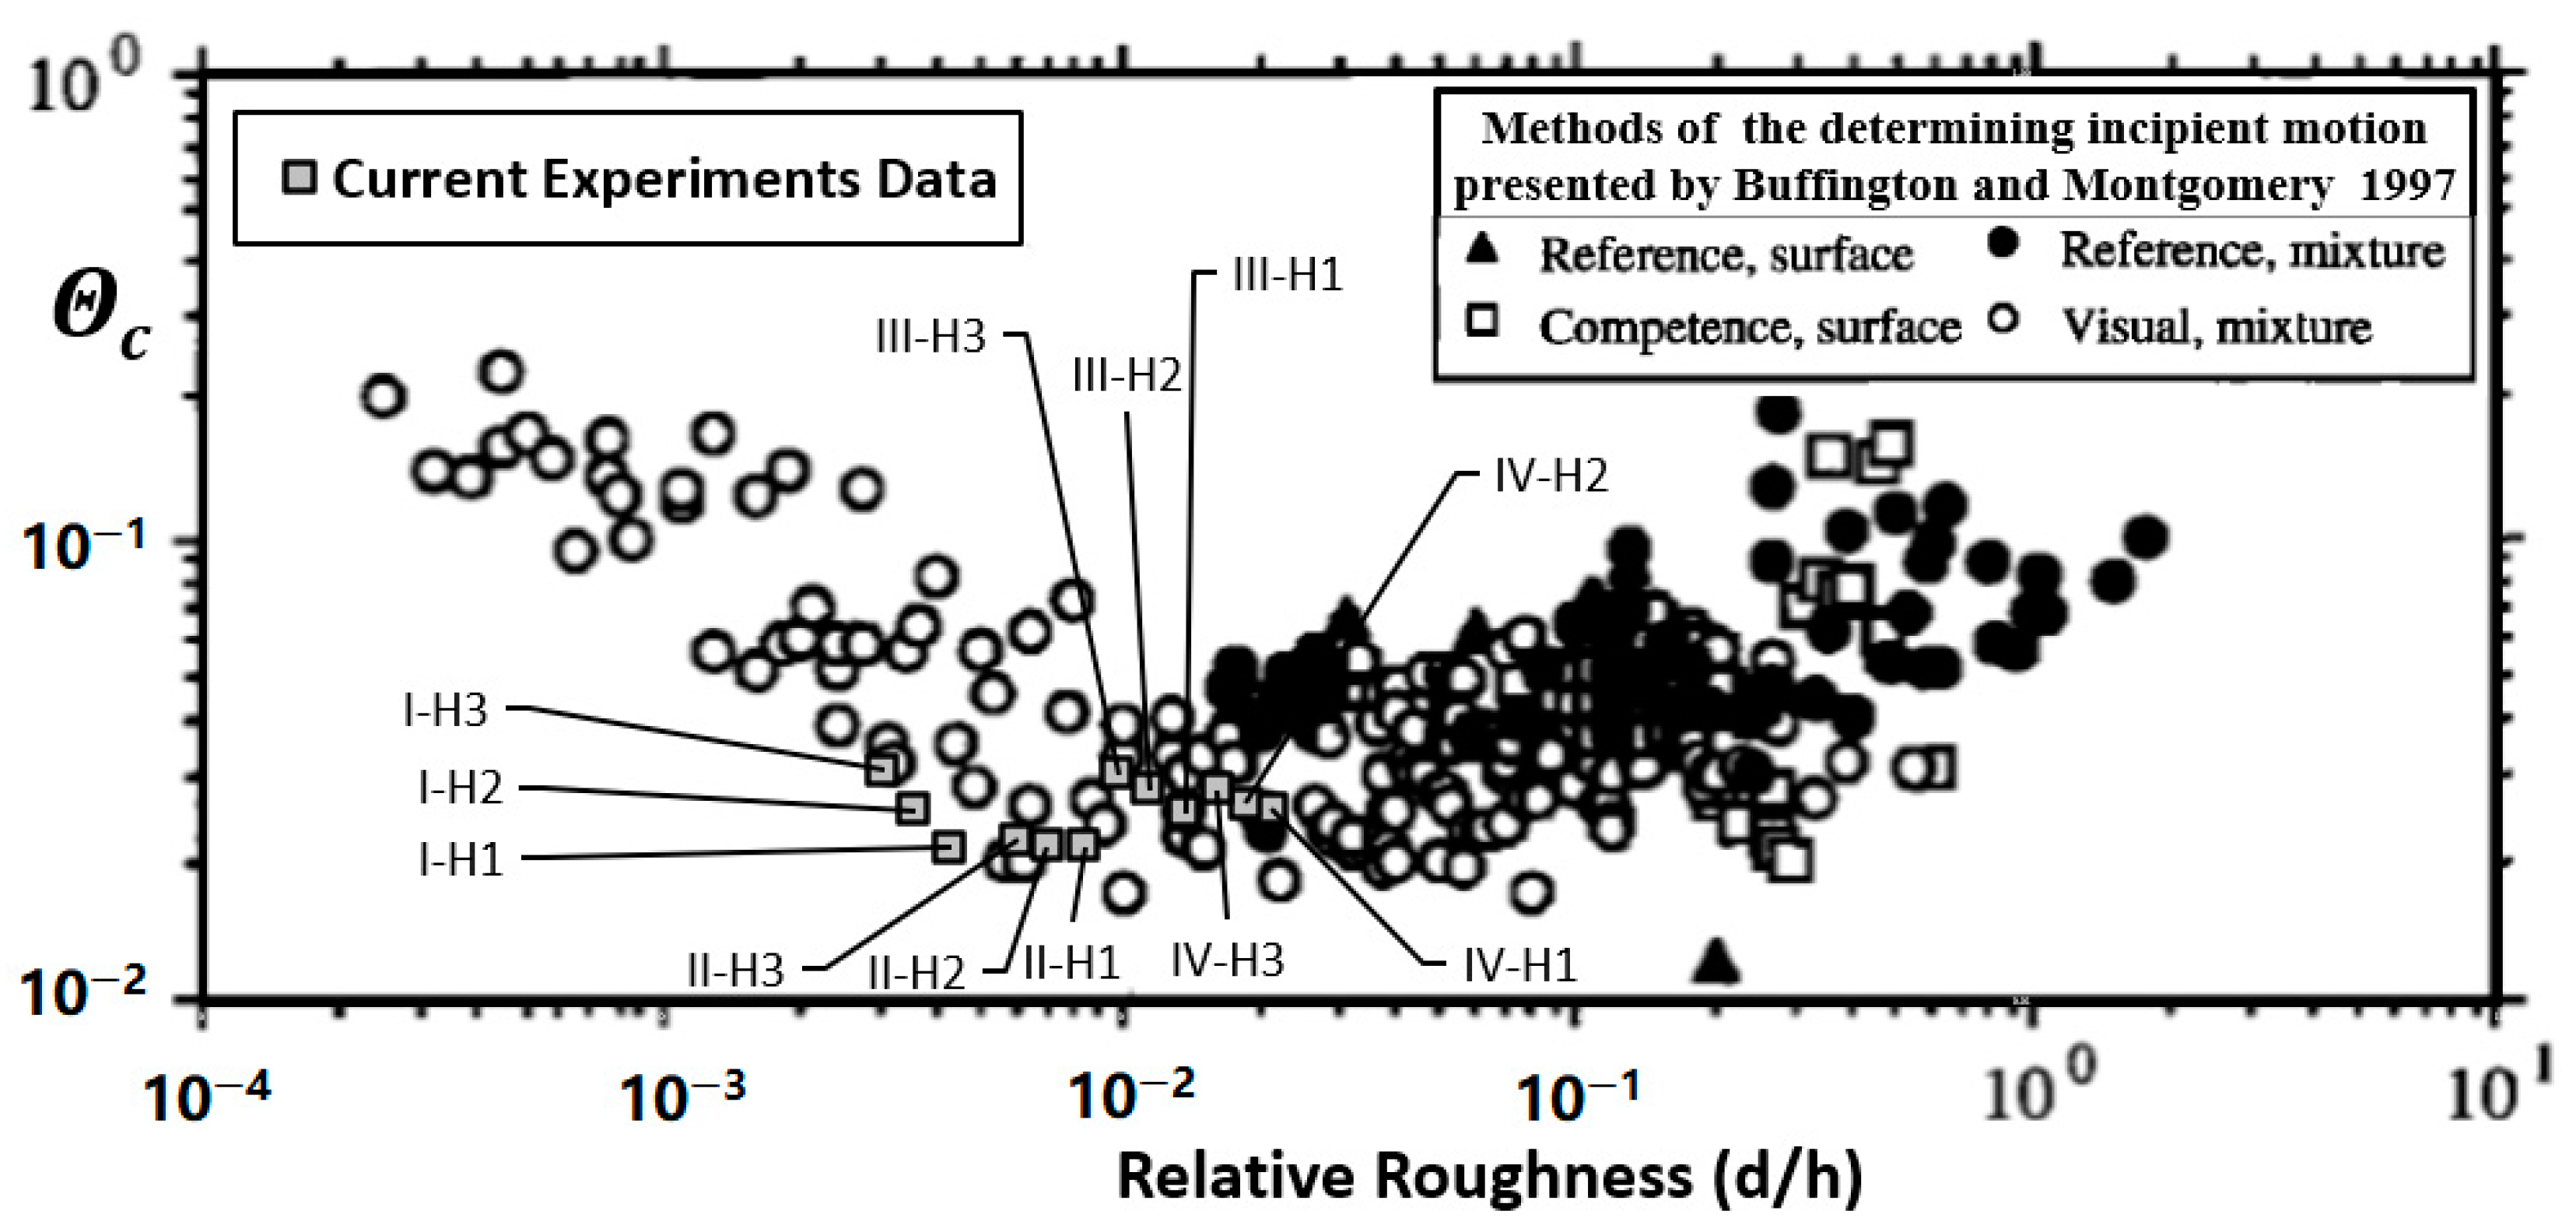
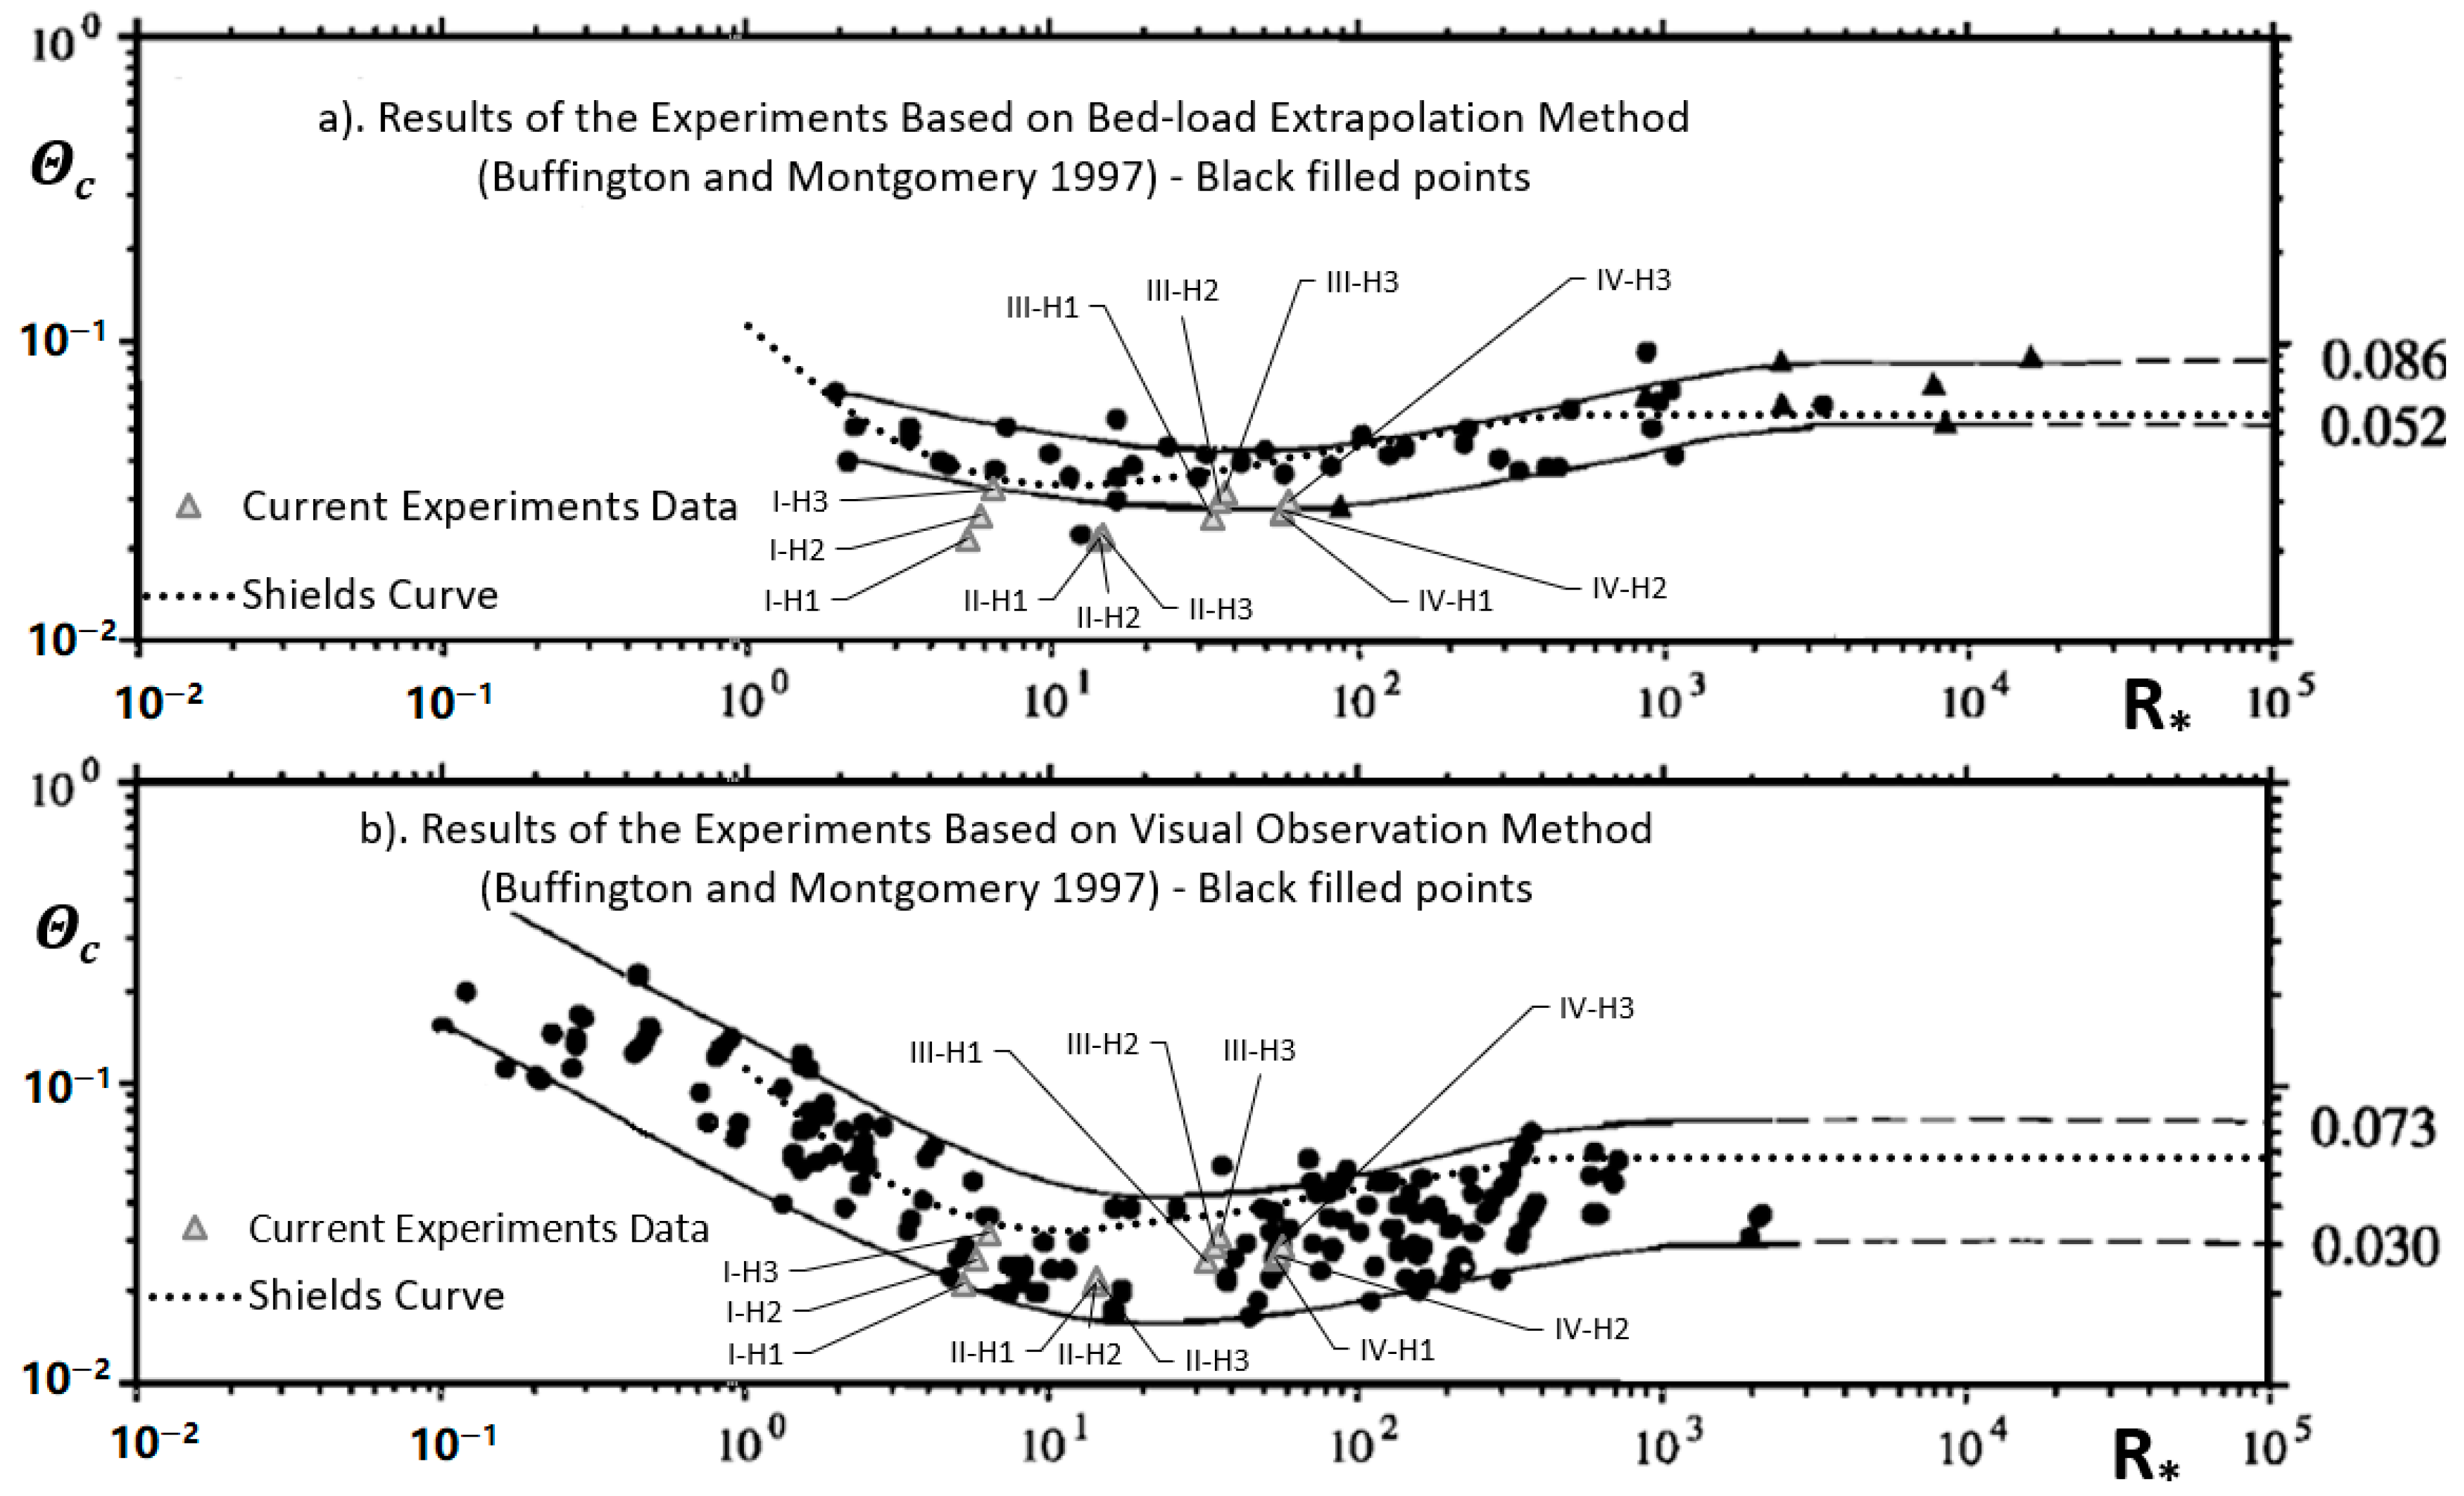
- Method for the definition of the threshold condition: Although Shields did not clearly explain the method, he used to determine the threshold conditions in his experiments, Kennedy [43] claimed that he probably applied Kramer’s general motion criteria. Generally, there is an agreement that he used the bed-load extrapolation method to estimate the critical shear stress [23,44,45]. In the present experiments, the medium transport criterion of the Kramer visual observation method without any bed form was used. Different methods for threshold definition could yield different values of critical shear stress. Based on a lot of different studies, Buffington and Montgomery [5] clearly showed that the bed-load extrapolation method overestimated the critical Shields parameter, compared to the visual observation method. Comparing the results of the critical Shields parameters in the present experimental study to those presented by Buffington and Montgomery [5], it clearly showed in Figure 12 that although the critical Shields parameters of the present experiments are a little smaller than those of the bed-load extrapolation method (Figure 12a), they are in agreement with those of experiments based on the visual observation method (Figure 12b). Therefore, an overestimation of the critical Shields parameters using the bed-load extrapolation method could be expected. The main reasons for the overestimation of the critical Shields parameters based on the bed-load extrapolation could be related to more probable bedform creation in the bed-load extrapolation experiments because of the method’s inherent condition [46]. Bedforms influence both the bed shear stress and sediment transport by exerting more drag force and turbulence [47]. It can dissipate bed shear stress [48,49,50], causing significant overestimation of the bed shear stress. In addition, the negligible change of water depth owing to bedform can lead to some overestimation [47];
- Experimental measuring tools: Nowadays, the tools for acquiring vertical distributions of velocities and Reynolds shear stress in the hydraulic laboratory are more advanced, compared to those used by Shields [22] a long time ago, as also reported by Buffington and Montgomery [5]. Using an ADV in the present experimental study, it was possible to determine the critical shear stress more precisely, leading to more precise and reliable results with some expected differences from those reported by Shields [22] and Buffington and Montgomery [5];
- Sediment characteristics: The differences in sediment characteristics, such as size, shape, roundness, sorting, packing, and mass density, can affect the results of incipient motion [47,51,52,53]. Shields used four types of sediment including nearly uniform grains of brown coal, amber cuttings, crushed barite, and crushed granite, with the mass density ranging from 1060 to 4300 kg/m3 and the median grain size ranging from 0.36 to 3.44 mm, which were sub-angular to very angular [47]. In this experimental study, naturally rounded quartz particles were used. Obviously, both crushed and angular particles cause more resistance to incipient motion due to higher friction of the particles [11], and this leads to an increase in the critical shear stress.
6. Conclusions
Author Contributions
Funding
Institutional Review Board Statement
Informed Consent Statement
Data Availability Statement
Conflicts of Interest
Notation
| Reynolds shear stress | |
| τoc | Critical shear stress |
| U | Average velocity |
| Ucr | Threshold average velocity (under threshold condition) |
| ucr | Threshold near-bed velocity (at the sediment particles level) |
| d16 | The size of which is finer than 16% of the sediment particles |
| d35 | The size of which is finer than 35% of the sediment particles |
| d50ord | Sediment median grain size (the size of which is finer than 50% of the particles) |
| d86 | The size of which is finer than 86% of the sediment particles |
| D95 | The size of which is finer than 95% of the sediment particles |
| σg | Geometric standard deviation of sediment particles, σg = (d84/d16)0.5 |
| g | Gravitational acceleration (981 cm3/s) |
| υ | Coefficient of water kinematic viscosity (equal to 0.01 cm2/s) |
| ρ | Mass density of water (equal to 1.0 g/cm3) |
| ρs | Mass density of sediment particles (equal to 2.65 g/cm3) |
| S | Relative mass density of sediment particles (S = ρs/ρ, is equal to 2.65) |
| Δ | Submerged relative mass density of sediment particles (Δ = S − 1 = 1.65 for quarts) |
| ks | Nikuradse’s equivalent roughness |
| R* | Particle shear Reynolds number |
| Θc | Critical Shields parameter (non-dimensional critical shear stress) |
| ADV | Acoustic Doppler velocimeter |
| h | Water depth |
| h/d | Relative submergence of sediment particles |
| d/h | Relative roughness of sediment particles |
| B | Flume width (is equal to 90 cm) |
| B/h | Aspect ratio (the ratio between the flow width to the water depth) |
| Q | Flow rate (water discharge measured by electromagnetic flowmeter) |
| Re | Reynolds number |
| Fr | Froude number |
References
- Dey, S. Fluvial Hydrodynamics: Hydrodynamic and Sediment Transport Phenomena; Springer: Berlin/Heidelberg, Germany, 2014. [Google Scholar]
- Wang, J.; Sui, J.; Karney, B.W. Incipient motion of non-cohesive sediment under ice cover-an experimental study. J. Hydrodyn. 2008, 20, 117–124. [Google Scholar] [CrossRef]
- Sui, J.; Afzalimehr, H.; Kabiri Samani, A.; Maherani, M. Clear-water scour around semi-elliptical abutments with armored beds. Int. J. Sediment Res. 2010, 25, 233–245. [Google Scholar] [CrossRef]
- Shahmohammadi, R.; Afzalimehr, H.; Sui, J. Impacts of turbulent flow over channel bed with vegetation patch on the incipient motion of sediment. Can. J. Civ. Eng. 2018, 45, 803–816. [Google Scholar] [CrossRef]
- Buffington, J.M.; Montgomery, D.R. A systematic analysis of eight decades of incipient motion studies, with special reference to gravel-bedded rivers. Water Resour. Res. 1997, 33, 1993–2029. [Google Scholar] [CrossRef]
- Diplas, P. Bed load transport in gravel-bed streams. J. Hydraul. Eng. 1987, 113, 277–292. [Google Scholar] [CrossRef]
- Wilcock, P.R. Methods for estimating the critical shear stress of individual fractions in mixed-size sediment. Water Resour. Res. 1988, 24, 1127–1135. [Google Scholar] [CrossRef]
- Abbott, J.E.; Francis, J.R.D. Saltation and suspension trajectories of solid grains in a water stream. Philos. Trans. R. Soc. Lond. Ser. A Math. Phys. Sci. 1977, 284, 225–254. [Google Scholar]
- Kramer, H. Sand mixtures and sand movement in fluvial model. Trans. Am. Soc. Civ. Eng. 1935, 100, 798–838. [Google Scholar] [CrossRef]
- Paintal, A. Concept of critical shear stress in loose boundary open channels. J. Hydraul. Res. 1971, 9, 91–113. [Google Scholar] [CrossRef]
- Afzalimehr, H.; Dey, S.; Rasoulianfar, P. Influence of decelerating flow on incipient motion of gravel-bed streams. Sadhana Acad. Proc. Eng. Sci. 2007, 32, 545–559. [Google Scholar] [CrossRef]
- Dey, S.; Sarkar, S.; Solari, L. Near-bed turbulence characteristics at the entrainment threshold of sediment beds. J. Hydraul. Eng. 2011, 137, 945–958. [Google Scholar] [CrossRef]
- Bialik, R.J. Numerical study of near-bed turbulence structures influence on the initiation of saltating grains movement. J. Hydrol. Hydromech. 2013, 61, 202–207. [Google Scholar] [CrossRef]
- Nikora, V.I.; Sukhodolov, A.N.; Rowinski, P.M. Statistical sand wave dynamics in one-directional water flows. J. Fluid Mech. 1997, 351, 17–39. [Google Scholar] [CrossRef]
- Goncharov, V.N. Dynamics of Channel Flow; Israel Programme for Scientific Translation: Moscow, Russia, 1964. [Google Scholar]
- Neill, C.R. Note on initial movement of coarse uniform bed-material. J. Hydraul. Res. 1968, 6, 173–176. [Google Scholar] [CrossRef]
- Garde, R.J. Initiation of motion on a hydrodynamically rough surface, critical water velocity approach. J. Irrig. Power 1970, 27, 271–282. [Google Scholar]
- Einstein, H.A. The Bed-Load Function for Sediment Transportation in Open Channel Flows; Technical bulletin number 1026; Department of Agriculture, Soil Conservation Service: Washington, DC, USA, 1950.
- Velikanov, M.A. Dynamics of Alluvial Stream; State Publishing House of Theoretical and Technical Literature: Moscow, Russia, 1955; Volume 2. [Google Scholar]
- Yalin, M.S. An expression for bed-load transportation. J. Hydraul. Div. 1963, 89, 221–250. [Google Scholar] [CrossRef]
- Ling, C.H. Criteria for incipient motion of spherical sediment particles. J. Hydraul. Eng. 1995, 121, 472–478. [Google Scholar] [CrossRef]
- Shields, A.F. Application of Similarity Principles and Turbulence Research to Bed-Load Movement; Mitteilungen der Preussischen Versuchsanstalt für Wasserbau und Schiffbau: Berlin, Germany, 1936; Volume 26, pp. 5–24. [Google Scholar]
- Miller, M.C.; McCave, I.N.; Komar, P.D. Threshold of sediment motion under unidirectional currents. Sedimentology 1977, 24, 507–527. [Google Scholar] [CrossRef]
- Paphitis, D. Sediment movement under unidirectional flows: An assessment of empirical threshold curves. Coast Eng. 2001, 43, 227–245. [Google Scholar] [CrossRef]
- Dey, S.; Papanicolaou, A. Sediment threshold under stream flow: A state-of-the-art review. KSCE J. Civ. Eng. 2008, 12, 45–60. [Google Scholar] [CrossRef]
- Emadzadeh, A.; Chiew, Y.M.; Afzalimehr, H. Effect of accelerating flow on incipient motion in a gravel-bed stream. Adv. Water Resour. 2010, 33, 1094–1104. [Google Scholar] [CrossRef]
- Bolhassani, R.; Afzalimehr, H.; Dey, S. Effects of relative submergence and bed slope on sediment incipient motion under decelerating flows. J. Hydrol. Hydromech. 2015, 63, 295–302. [Google Scholar] [CrossRef]
- García, M.H. Sedimentation Engineering: Processes, Measurements, Modeling, and Practice. ASCE Manuals and Reports on Engineering Practice, no. 110; ASCE: Reston, VA, USA, 2008. [Google Scholar]
- Neill, C.R. Note on initial movement of coarse uniform material. J. Hydraul. Res. 1968, 6, 157–184. [Google Scholar]
- Gessler, J. Beginning and ceasing of sediment motion. In River Mechanics; Shen, H.W., Ed.; Water Resources Publications: Littleton, CO, USA, 1971; Chapter 7. [Google Scholar]
- Yalin, M.S.; Karahan, E. Inception of sediment transport. J. Hydraul. Div. 1979, 105, 1433–1443. [Google Scholar] [CrossRef]
- White, C.M. The equilibrium of grains on the bed of a stream. Philos. Trans. R. Soc. Lond. 1940, 174, 322–338. [Google Scholar]
- Iwagaki, Y. Fundamental study on critical tractive force. Trans. Jpn. Soc. Civ. Eng. 1956, 41, 1–21. [Google Scholar]
- Wiberg, P.L.; Smith, J.D. Calculations of the critical shear stress for motion of uniform and heterogeneous sediments. Water Resour. Res. 1987, 23, 1471–1480. [Google Scholar]
- Miller, R.L.; Byrne, R.J. The angle of repose for a single grain on a fixed rough bed. Sedimentology 1966, 6, 303–314. [Google Scholar] [CrossRef]
- Dey, S. Sediment threshold. Appl. Math. Model. 1999, 23, 399–417. [Google Scholar] [CrossRef]
- Nikora, V.I.; Goring, D.G.; Biggs, B.J.F. Silverstream eco-hydraulics flume: Hydraulic design and tests. N. Z. J. Mar. Freshwater Res. 1998, 32, 607–620. [Google Scholar] [CrossRef]
- Goring, D.G.; Nikora, V.I. Despiking acoustic doppler velocimeter data. J. Hydraul. Eng. 2002, 128, 117–126. [Google Scholar] [CrossRef]
- Wahl, T.L. Discussion of “Despiking acoustic doppler velocimeter data” by Derek G. Goring and Vladimir I. Nikora. J. Hydraul. Eng. 2003, 129, 484–487. [Google Scholar] [CrossRef]
- Lane, E.W. Report of the subcommittee on sediment terminology. Trans. Am. Geophys. Union 1947, 28, 936–938. [Google Scholar] [CrossRef]
- Török, G.T.; Józsa, J.; Baranya, S. A shear reynolds number-based classification method of the nonuniform bed load transport. Water 2019, 11, 73. [Google Scholar] [CrossRef]
- Dey, S.; Sarkar, A. Scour downstream of an apron due to submerged horizontal jets. J. Hydraul. Eng. 2006, 132, 246–257. [Google Scholar] [CrossRef]
- Kennedy, J.F. The Albert Shields story. J. Hydraul. Eng. 1995, 121, 766–772. [Google Scholar] [CrossRef]
- Mantz, P.A. Incipient transport of fine grains are flakes by fluids—Extended Shields diagram. J. Hydraul. Div. 1977, 103, 601–615. [Google Scholar] [CrossRef]
- Lavelle, J.W.; Mofjeld, H.O. Do critical stresses for incipient motion and erosion really exist? J. Hydraul. Eng. 1987, 113, 370–385. [Google Scholar] [CrossRef]
- Wilcock, P.R.; Southard, J.B. Experimental study of incipient motion in mixed-size sediment. Water Resour. Res. 1988, 24, 1137–1151. [Google Scholar] [CrossRef]
- Buffington, J.M. The legend of A.F. Shields. J. Hydraul. Eng. 1999, 125, 376–387. [Google Scholar] [CrossRef]
- Parker, G.; Peterson, A.W. Bar resistance of gravel-bed streams. J. Hydraul. Div. 1980, 106, 1559–1575. [Google Scholar] [CrossRef]
- Prestegaard, K.L. Bar resistance in gravel bed streams at bankfull stage. Water Resour. Res. 1983, 19, 473–476. [Google Scholar] [CrossRef]
- Hey, R.D. Bar form resistance in gravel-bed rivers. J. Hydraul. Eng. 1988, 114, 1498–1508. [Google Scholar] [CrossRef]
- Li, Z.; Komar, P.D. Laboratory measurements of pivoting angles for applications to selective entrainment of gravel in a current. Sedimentology 1986, 33, 413–423. [Google Scholar] [CrossRef]
- Kirchner, J.W.; Dietrich, W.E.; Iseya, F.; Ikeda, H. The variability of critical shear stress, friction angle, and grain protrusion in water worked sediments. Sedimentology 1990, 37, 647–672. [Google Scholar] [CrossRef]
- Buffington, J.M.; Dietrich, W.E.; Kirchner, J.W. Friction angle measurements on a naturally formed gravel streambed: Implications for critical boundary shear stress. Water Resour. Res. 1992, 28, 411–425. [Google Scholar] [CrossRef]


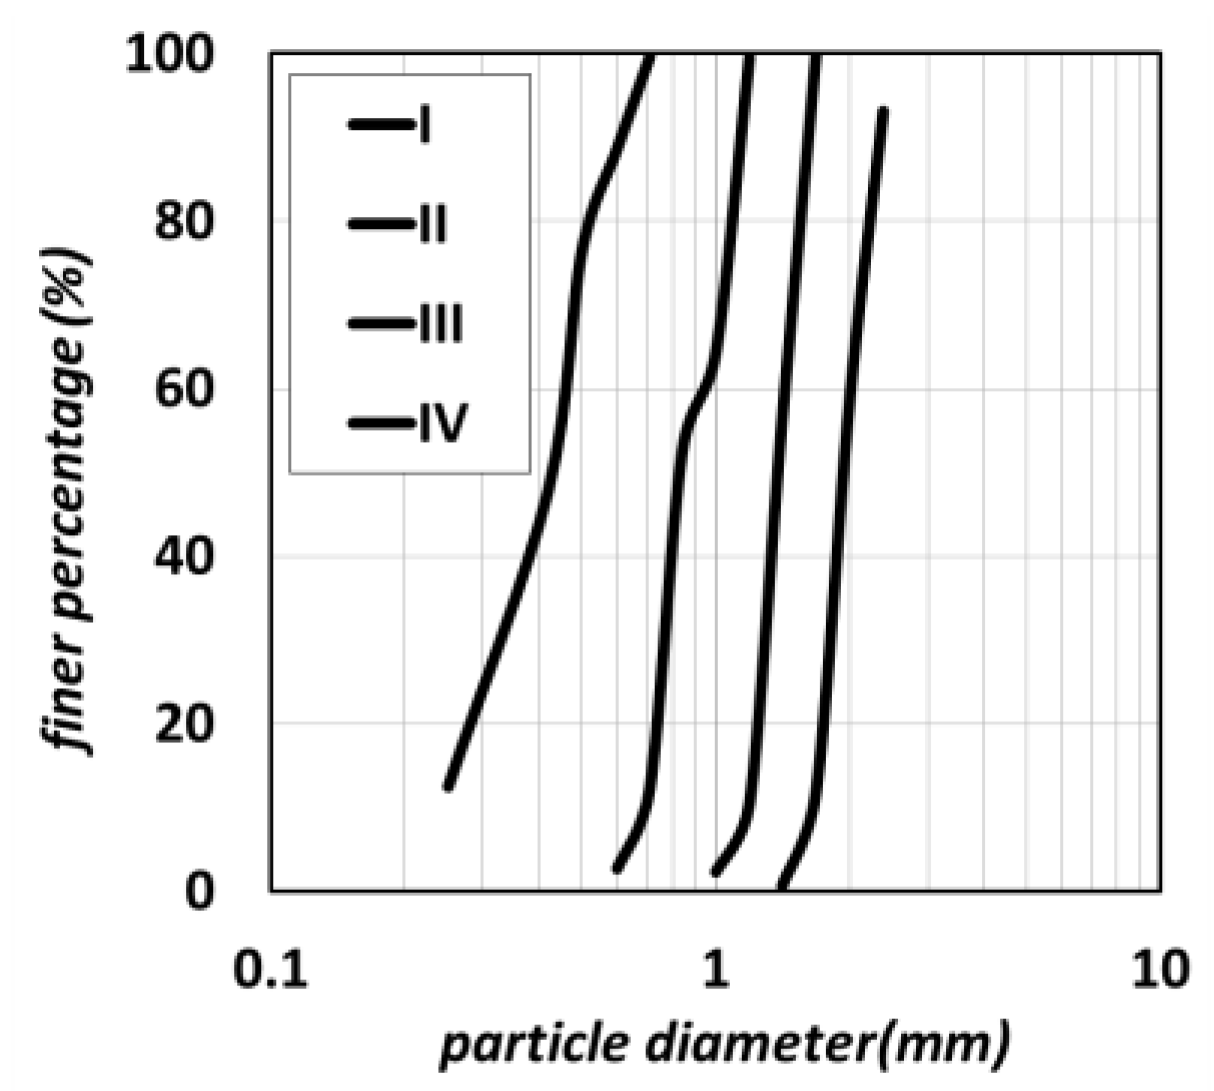
| Sediment | Class | d16 | d35 | d50 | d84 | σg |
|---|---|---|---|---|---|---|
| I | Medium Sand | 0.27 | 0.36 | 0.43 | 0.56 | 1.45 |
| II | Coarse Sand | 0.72 | 0.78 | 0.83 | 1.11 | 1.24 |
| III | Very Coarse Sand | 1.22 | 1.31 | 1.38 | 1.58 | 1.14 |
| IV | Very Coarse Sand | 1.71 | 1.84 | 1.94 | 2.28 | 1.16 |
| Experiment Name: | I (d = 0.43 mm) | II (d = 0.83 mm) | III (d = 1.38 mm) | IV (d = 1.94 mm) | ||||||||
|---|---|---|---|---|---|---|---|---|---|---|---|---|
| H1 | H2 | H3 | H1 | H2 | H3 | H1 | H2 | H3 | H1 | H2 | H3 | |
| Water Depth (h)—mm | 100 | 120 | 140 | 100 | 120 | 140 | 100 | 120 | 140 | 91 | 104 | 120 |
| Relative Submergence (h/d) | 235 | 282 | 329 | 120 | 144 | 168 | 72 | 87 | 101 | 47 | 54 | 62 |
| Relative Roughness (d/h) × 10−3 | 4 | 4 | 3 | 8 | 7 | 6 | 14 | 11 | 10 | 21 | 19 | 16 |
| Aspect Ratio (B/h) | 9.0 | 7.5 | 6.4 | 9.0 | 7.5 | 6.4 | 9.0 | 7.5 | 6.4 | 9.9 | 8.7 | 7.5 |
| Water Temperature—°C | 17 | 15 | 19 | 18 | 20 | 19 | 21 | 22 | 17 | 24 | 24 | 21 |
| Discharge (Q)—L/s | 21.3 | 27.3 | 33.4 | 27.1 | 33.0 | 38.5 | 33.2 | 41.6 | 49.3 | 35.7 | 41.6 | 49.3 |
| Ucr = Q/(Bh)—cm/s | 23.6 | 25.3 | 26.5 | 30.1 | 30.6 | 30.6 | 36.9 | 38.5 | 39.1 | 43.6 | 44.4 | 45.7 |
| Re = Uh/ν × 103 | 24 | 30 | 37 | 30 | 37 | 43 | 37 | 46 | 55 | 40 | 46 | 55 |
| Fr = U/(gh)0.5 | 0.24 | 0.21 | 0.19 | 0.31 | 0.26 | 0.22 | 0.38 | 0.33 | 0.28 | 0.49 | 0.44 | 0.39 |
| Experiment: | I (d = 0.43) | II (d = 0.83) | III (d = 1.38) | IV (d = 1.94) | |||||||||
|---|---|---|---|---|---|---|---|---|---|---|---|---|---|
| H1 | H2 | H3 | H1 | H2 | H3 | H1 | H2 | H3 | H1 | H2 | H3 | ||
| Experimental Data | 23.6 | 25.3 | 26.5 | 30.1 | 30.6 | 30.6 | 36.9 | 38.5 | 39.1 | 43.6 | 44.4 | 45.7 | |
| Extracted Equation (Equation (7)) | 24.1 | 25.0 | 26.0 | 30.5 | 31.2 | 31.8 | 37.6 | 38.1 | 38.6 | 43.5 | 43.7 | 44.1 | |
| Goncharov | Value | 28.1 | 28.8 | 29.4 | 35.6 | 36.6 | 37.4 | 43.6 | 44.9 | 46.0 | 47.9 | 49.0 | 50.2 |
| Difference with Equation (7) | −14% | −13% | −12% | −14% | −15% | −15% | −14% | −15% | −16% | −9% | −11% | −12% | |
| Neill | Value | 29.1 | 30.0 | 30.8 | 36.3 | 37.5 | 38.4 | 43.0 | 44.4 | 45.5 | 47.5 | 48.5 | 49.7 |
| Difference with Equation (7) | −17% | −16% | −16% | −16% | −17% | −17% | −13% | −14% | −15% | −8% | −10% | −11% | |
| Garde | Value | 23.4 | 23.7 | 24.0 | 31.0 | 31.4 | 31.8 | 38.3 | 38.8 | 39.3 | 43.7 | 44.2 | 44.8 |
| Difference with Equation (7) | 3% | 6% | 8% | −2% | −1% | 0% | −2% | −2% | −2% | −1% | −1% | −1% | |
| Experiment | I (d = 0.43 mm) | II (d = 0.83 mm) | III (d = 1.38 mm) | IV (d = 1.94 mm) | ||||||||
|---|---|---|---|---|---|---|---|---|---|---|---|---|
| H1 | H2 | H3 | H1 | H2 | H3 | H1 | H2 | H3 | H1 | H2 | H3 | |
| ucr (cm/s) | 18.1 | 18.2 | 19.0 | 21.5 | 20.2 | 19.6 | 22.2 | 23.5 | 24.1 | 25.3 | 24.9 | 24.8 |
| Sediment Group: | I (d = 0.43) | II (d = 0.83) | III (d = 1.38) | IV (d = 1.94) | |
|---|---|---|---|---|---|
| Averaged Experimental Data | 18.4 | 20.4 | 23.2 | 25.0 | |
| Extracted Equation (Equatiuon (8)) | 18.6 | 20.4 | 22.8 | 25.3 | |
| Garde [17] (Equatiuon (4)) | Value | 12.6 | 17.5 | 22.6 | 26.8 |
| Difference with Equatiuon (8) | 48% | 16% | 1% | −6% | |
| Experiment | I (d = 0.43 mm) | II (d = 0.83 mm) | III (d = 1.38 mm) | IV (d = 1.94 mm) | ||||||||
|---|---|---|---|---|---|---|---|---|---|---|---|---|
| H1 | H2 | H3 | H1 | H2 | H3 | H1 | H2 | H3 | H1 | H2 | H3 | |
| τoc (cm/s)2 | 1.5 | 1.8 | 2.2 | 2.9 | 2.9 | 3.0 | 5.7 | 6.4 | 6.9 | 8.2 | 8.4 | 9.0 |
| R* | 5.3 | 5.8 | 6.4 | 14.1 | 14.1 | 14.4 | 32.9 | 34.9 | 36.2 | 55.6 | 56.2 | 58.2 |
| Θc | 0.022 | 0.026 | 0.032 | 0.022 | 0.022 | 0.022 | 0.026 | 0.029 | 0.031 | 0.026 | 0.027 | 0.029 |
Publisher’s Note: MDPI stays neutral with regard to jurisdictional claims in published maps and institutional affiliations. |
© 2021 by the authors. Licensee MDPI, Basel, Switzerland. This article is an open access article distributed under the terms and conditions of the Creative Commons Attribution (CC BY) license (https://creativecommons.org/licenses/by/4.0/).
Share and Cite
Shahmohammadi, R.; Afzalimehr, H.; Sui, J. Assessment of Critical Shear Stress and Threshold Velocity in Shallow Flow with Sand Particles. Water 2021, 13, 994. https://doi.org/10.3390/w13070994
Shahmohammadi R, Afzalimehr H, Sui J. Assessment of Critical Shear Stress and Threshold Velocity in Shallow Flow with Sand Particles. Water. 2021; 13(7):994. https://doi.org/10.3390/w13070994
Chicago/Turabian StyleShahmohammadi, Reza, Hossein Afzalimehr, and Jueyi Sui. 2021. "Assessment of Critical Shear Stress and Threshold Velocity in Shallow Flow with Sand Particles" Water 13, no. 7: 994. https://doi.org/10.3390/w13070994
APA StyleShahmohammadi, R., Afzalimehr, H., & Sui, J. (2021). Assessment of Critical Shear Stress and Threshold Velocity in Shallow Flow with Sand Particles. Water, 13(7), 994. https://doi.org/10.3390/w13070994