3.1. Water Quality
Five samples of TWW were taken on a monthly basis from March 2018 to November 2018. The mean values for each chemical and biological water quality parameter for TWW are presented in
Table 2. The clogging risk was evaluated according to the classification proposed by the water quality criteria for emitter clogging [
12,
20,
21]. The water quality parameters of pH (8.2), TDS, Mn, and Fe were used as a guide to determine the potential of emitter clogging. The pH values show a severe potential to cause emitter clogging for any water type. This is consistent with the findings of Al-Mefleh et al., and Al-Mefleh and Al-Raja [
21,
22]. However, the hardness characteristic (Ca and Mg) is another factor that might cause the precipitation of carbonate, leading to an increase in the potential of emitter clogging. The hardness value of the TWW was estimated to be about 428 mg/L, which is defined as hard water (>200 mg/L). Increasing the pH and temperature can increase the precipitation of Ca and Mg in drip irrigation systems.
The mean values of EC varied from 2.5 to 2.61 dS/m and the TDS from 1625 to 1697 ppm. According to the classification proposed by the water quality criteria for emitter clogging [
20], these values had a moderate potential for emitter clogging, as shown through the results of Capra and Scicolone, and Al-Mefleh and Al-Raja [
12,
23]. However, Al-Mefleh et al. indicated that the salt concentration in the TWW does not cause emitter clogging because the EC values of the TWW are low [
21]. The mean values of Mn (0.50 mg/L), Ca (98.6 mg/L), and Fe (0.11 mg/L) have a low amount of emitter clogging potential.
The analysis of TWW shows that the mean value of the concentrations of BOD
5 (16 mg/L) has a low clogging potential of emitters, based on the classification by Capra and Scicolone, which may be attributed due to low concentration of suspended solids and organic matter [
21,
23]. Overall, the water quality analysis signifies the need for proper irrigation system design, operation, and maintenance when TWW is used and explains farmers’ hesitation from utilizing TWW.
3.2. Emitter Characteristics
Initial values of emitter characteristics include the manufacturer emitter discharge (
Manuf. Qavg), initial emitter field discharge (
Qin), emitter discharge exponent (
Xin), discharge coefficient (
Kdin), initial variation coefficient (
CVin), initial emission uniformity (
EUin), and Christiansen uniformity coefficient (
CUin).
Table 3 displays these values for the different emitter types. The initial average discharge of the emitters was measured in the field at varying operating pressure levels (0.25, 0.50, and 1.00 bar). Mostly, it was found that the
Qavg increased in correlation with an increase in operational pressure. The final values of emitter characteristics consist of average discharge (
Qavg), emitter discharge exponent (
Xfi), discharge coefficient (
Kdfi), coefficient of variation (
CVfi), emission uniformity (
EUfi), and Christiansen uniformity coefficient (
CUfi) at each treatment level. By comparing the initial and final values of
CV at the same operating pressure for each emitter, it was found that the final values of
CV decreased.
Additionally, in respect to the initial
EU values for each emitter at the same operational pressure, the final EU values increased. According to the classification by Özekici and Sneed, the
CV values were classified as excellent (<5%), average (5–7%), marginal (7–11%), poor (11–15%), and unacceptable (>15) [
24]. This study found that the initial value of variation coefficient (
CVin) values were 0.3, 0.14, and 0.11 for the LP emitter, and 0.34, 0.08, and 0.17 for the SP emitter at operating pressures of 0.25, 0.50, and 1.00 bar, respectively. These results were considered unacceptable at 0.25 bar for both types of emitters, poor at 0.50 bar for the LP emitter, and marginal for the SP emitter. The results were marginal at 1.00 bar for the LP emitter and unacceptable for the SP emitter.
The final field emitter discharge of Qavg, Xfi, Kdfi, CVfi, EUfi, and CUfi were estimated after 160 h of operational time at the end of the experiment. The initial emitter discharge exponent (Xi) ranging from 0.00 to 1.00 tested the relation between the flow regime and operating pressure. Since the Xi value is less than 0.5, less discharge is affected by changing the pressure, and vice versa if Xi is greater than 0.5. Since the Xi values for the proposed emitter are around 0.1, they are considered fully compensated emitters.
3.3. Average Emitter Discharge (Qavg)
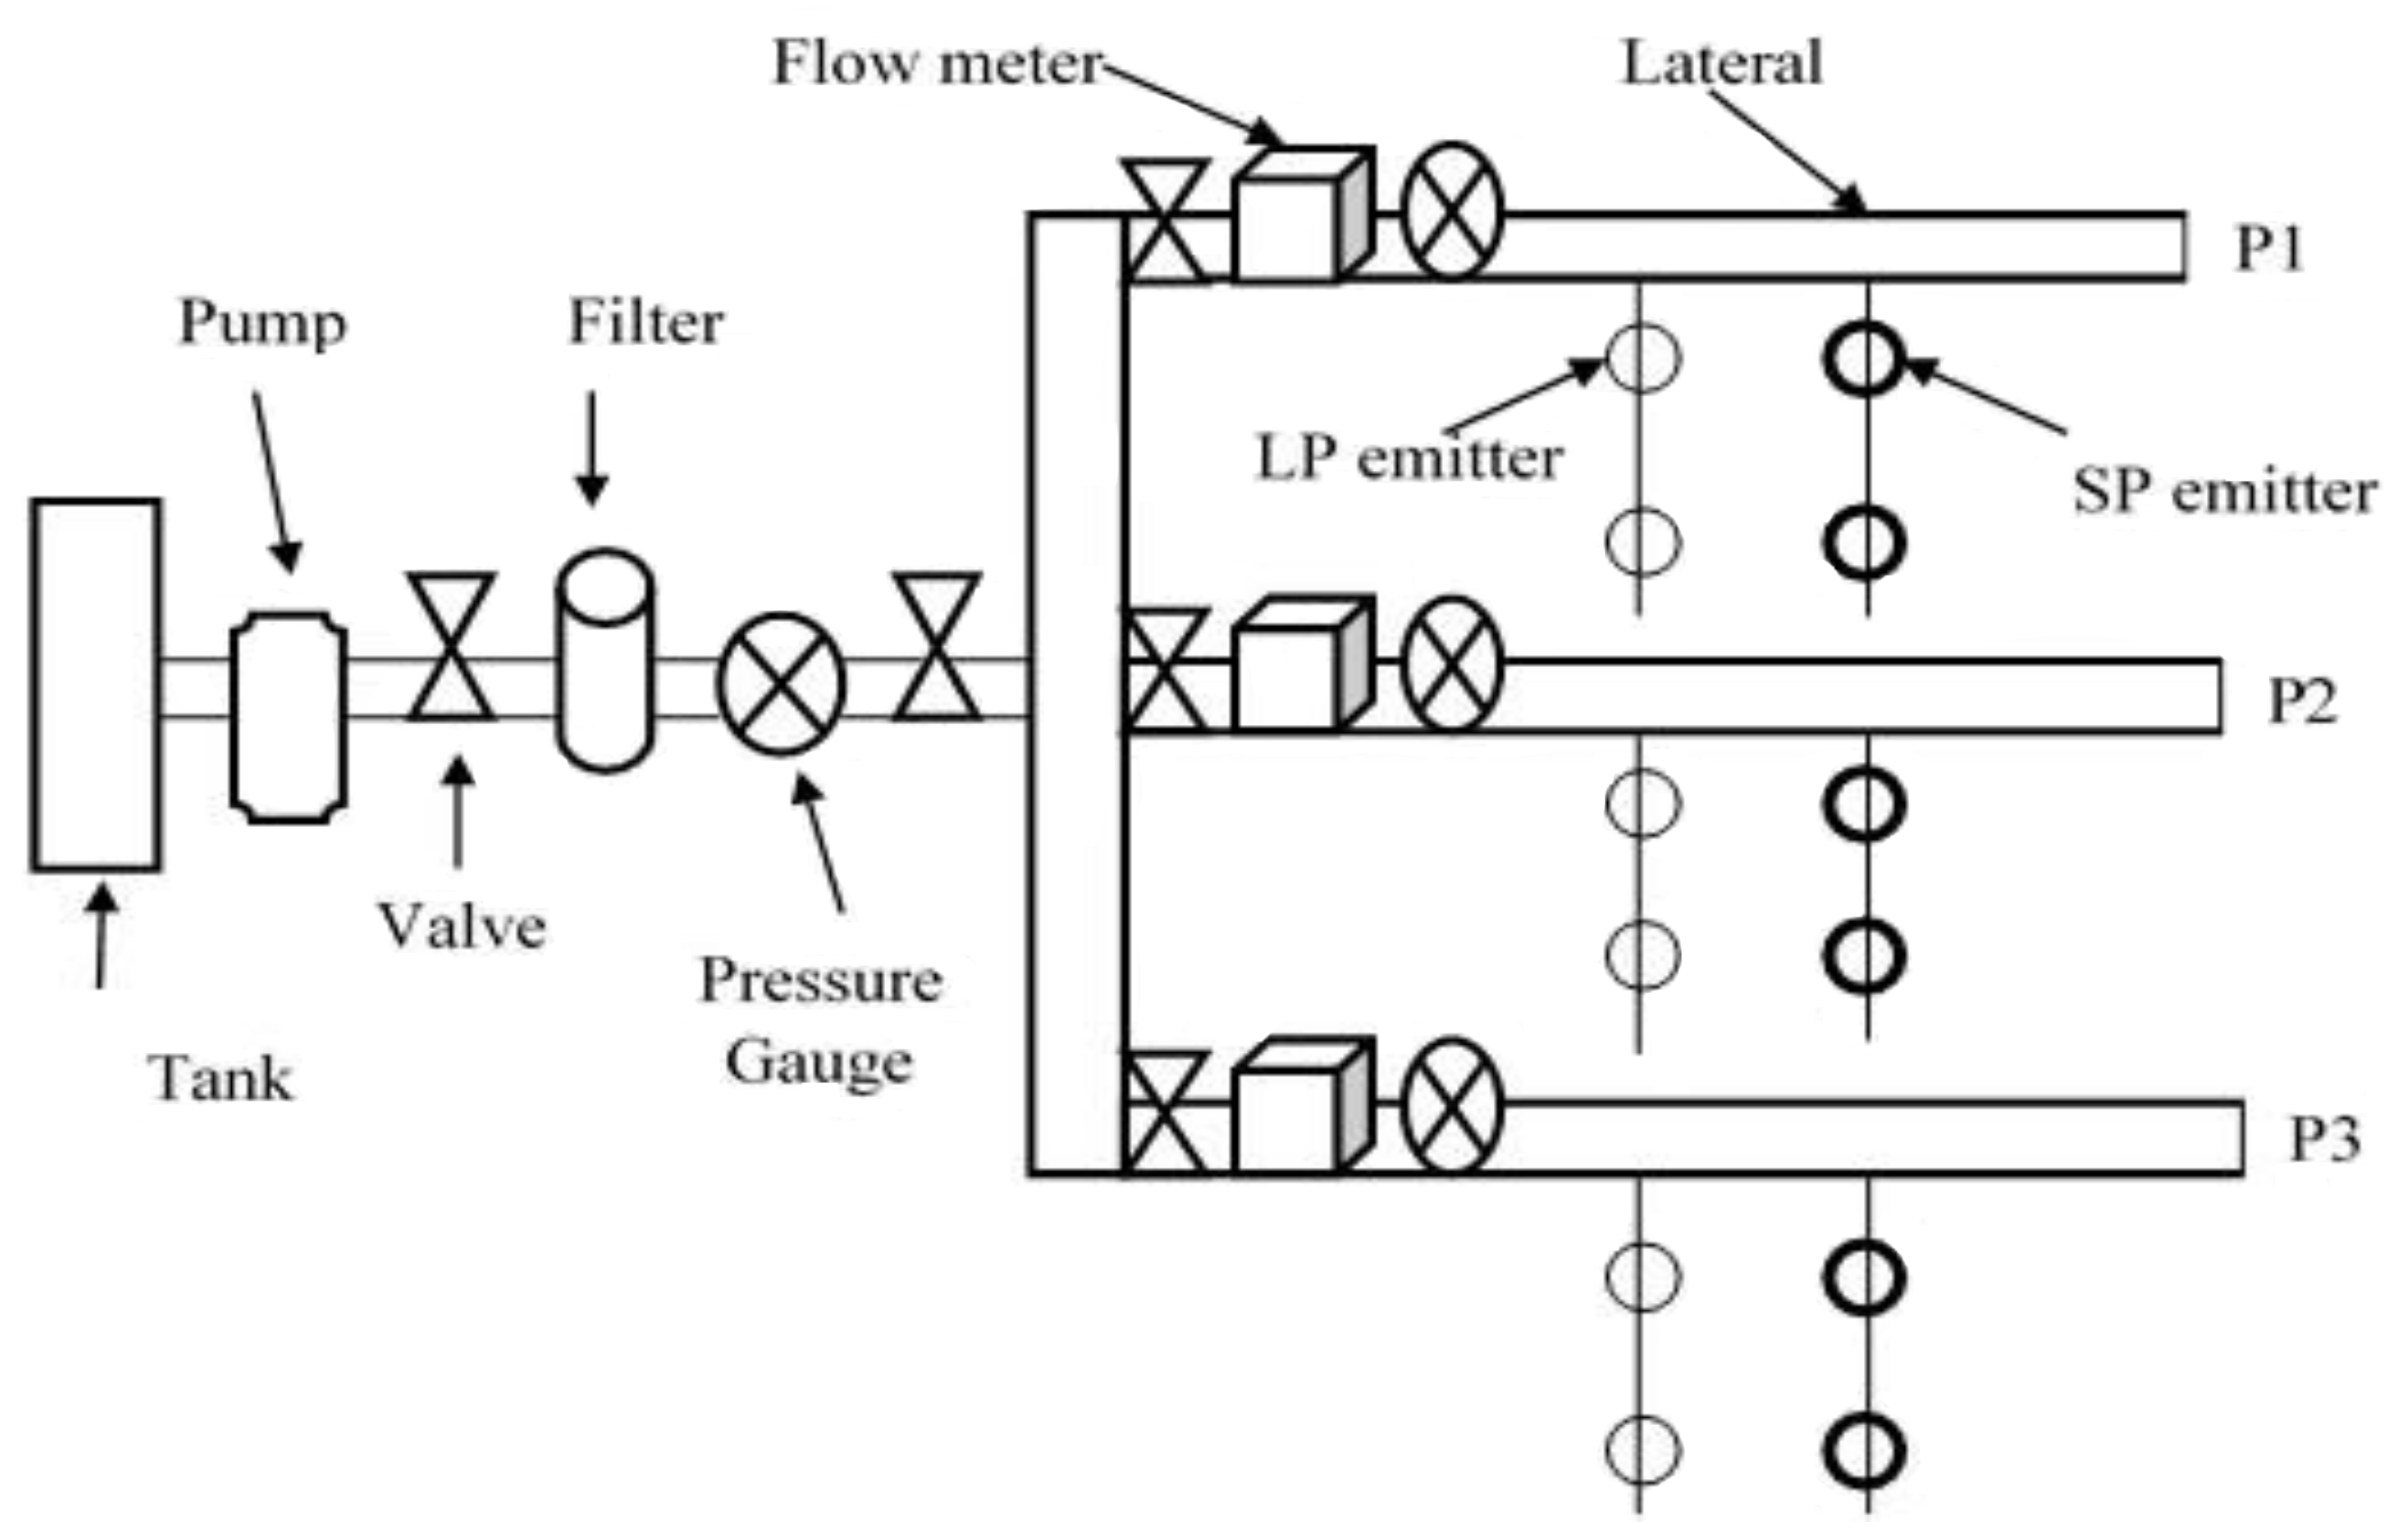
Two types of emitters, LP and SP, were used in order to measure the emitter discharge under three sets of operating pressures (P1 = 0.25, P2 = 0.50, and P3 = 1.00 bars) over a 160-h total operational time consisting of 20-h intervals using TWW. Statistical analysis was carried out for the average discharge (
Qavg) of each emitter type under different operating pressures and operational times. The main effect of emitter type on
Qavg was not significant (
p < 0.05). The main effect of interaction for the emitter type, operating pressure, and operational times on
Qavg was significant (
p < 0.05). The results of
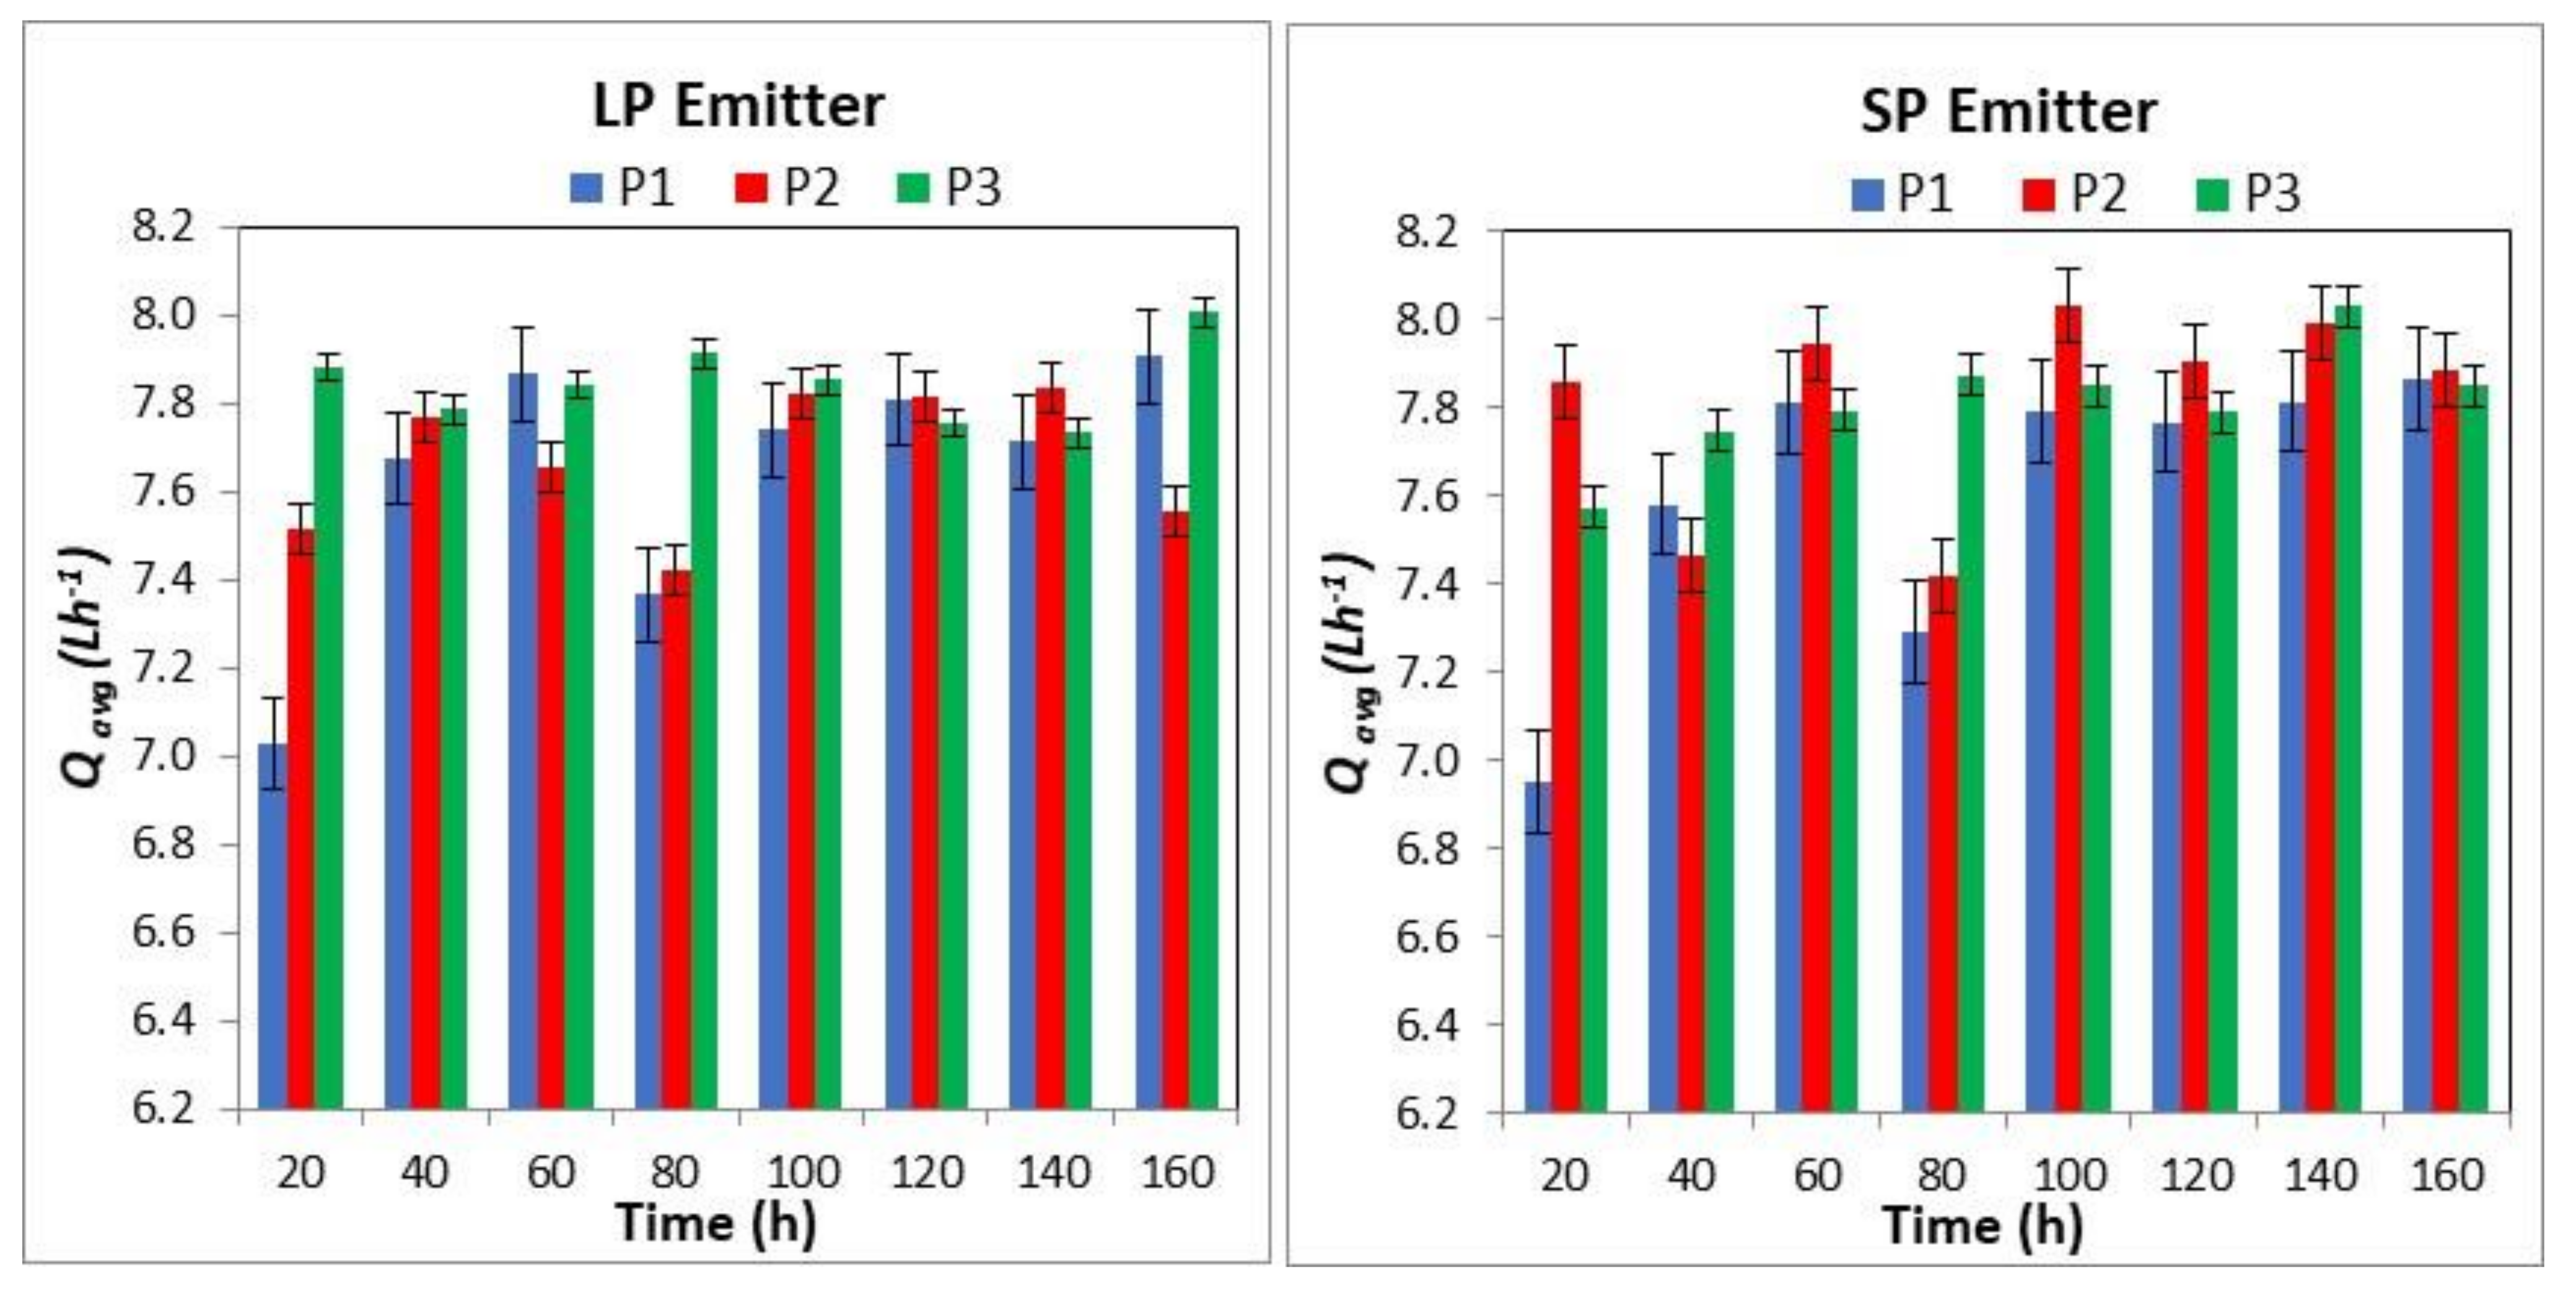
Qavg for the LP and SP emitters under different pressure values over the operational times are presented in
Figure 2. For the LP emitter, the values of
Qavg at 0.25 bar and operational times were different from each other. However, the values of
Qavg at each operating pressure of 0.50 bar and 1.00 bar over the operational times did not vary from one another. For the LP emitter at a pressure of 0.25 bar, the
Qavg fell into three groups of operational times: the first group was 20 and 80 h, the second group was 60 and 160 h, and the third group was 40, 100, 120, and 140 h. The
Qavg values were not different within each group, but they varied between the groups. For the LP emitter, the lowest values of
Qavg were 7.03, 7.42, and 7.73 Lh
−1 at 0.25, 0.5, and 1.0 bar, respectively. While the maximum values of
Qavg were 7.91, 7.83, and 8.00 Lh
−1, at 0.25, 0.50, and 1.00 bar, respectively.
For the SP emitter, the behavior trend of Qavg values at each operational pressure and operational time was similar to Qavg values for the LP emitter. For the SP emitter at a pressure of 0.25 bar, the Qavg fell into the same three groups of operational times as the LP emitter. Similar to the LP emitter, the Qavg values were not different within each group but were different between the groups. For the SP emitter at 0.25 bar, the lowest values of Qavg were 6.95, 7.41, 7.57 Lh−1 at 0.25, 0.50, and 1.0 bar, respectively. While the highest values of Qavg were 7.86, 8.00, 8.00 Lh−1 at 0.25, 0.50, and 1.00 bar, respectively. This study noticed that emitter discharge increased slightly as the operating pressure is increased from 0.50 bar to 1.00 bar. The results of Qavg for both emitter types show that increasing the pressure can decrease the clogging potential of emitter discharge over the operational times.
For the LP emitter, the overall average emitter discharge (from eight measures with 20-h intervals) was 7.6, 7.7, and 7.8 Lh−1 at 0.25, 0.50, and 1.00 bar, respectively. For the SP emitter, the overall average emitter discharge was 7.6, 7.8, and 7.8 Lh−1 at 0.25, 0.50, and 1.00 bar, respectively. Based on these results, the deviations of emitter discharge for the LP emitter at 0.25, 0.50, and 1.00 bar from the recommended value (8 Lh−1) by manufacturers were found to be 0.4, 0.3, and 0.2 Lh−1, respectively. For the SP emitter at 0.25, 0.50, and 1.00 bar, the deviations from the recommended value (8 Lh−1) were 0.4, 0.2, and 0.2 Lh−1, respectively. With respect to manufacturing emitter discharge (8 Lh−1) for the LP emitter, the Qavg (from eight measures with 20-h intervals) decreased by 5%, 3.75%, and 2.5% at 0.25, 0.50, and 1.0 bar, respectively. Additionally, for the SP emitter, the Qavg decreased by 5%, 2.5%, and 2.5% at 0.25, 0.50, and 1.0 bar, respectively. Based on the above results for both types of emitters (SP and LP), it was found that the Qavg (from eight measures with 20-h intervals) at each operating pressure was reduced by 2% to 5% from the original values of emitter discharge tested by the manufacturer. For all of the emitter assessments, Qavg was above 7.0 Lh−1 during the whole experiment, and they were 0.97 to 1.5 Lh−1 lower than that of the manufacturing discharge (8.0 Lh−1).
3.4. Coefficient of Variation (CV)
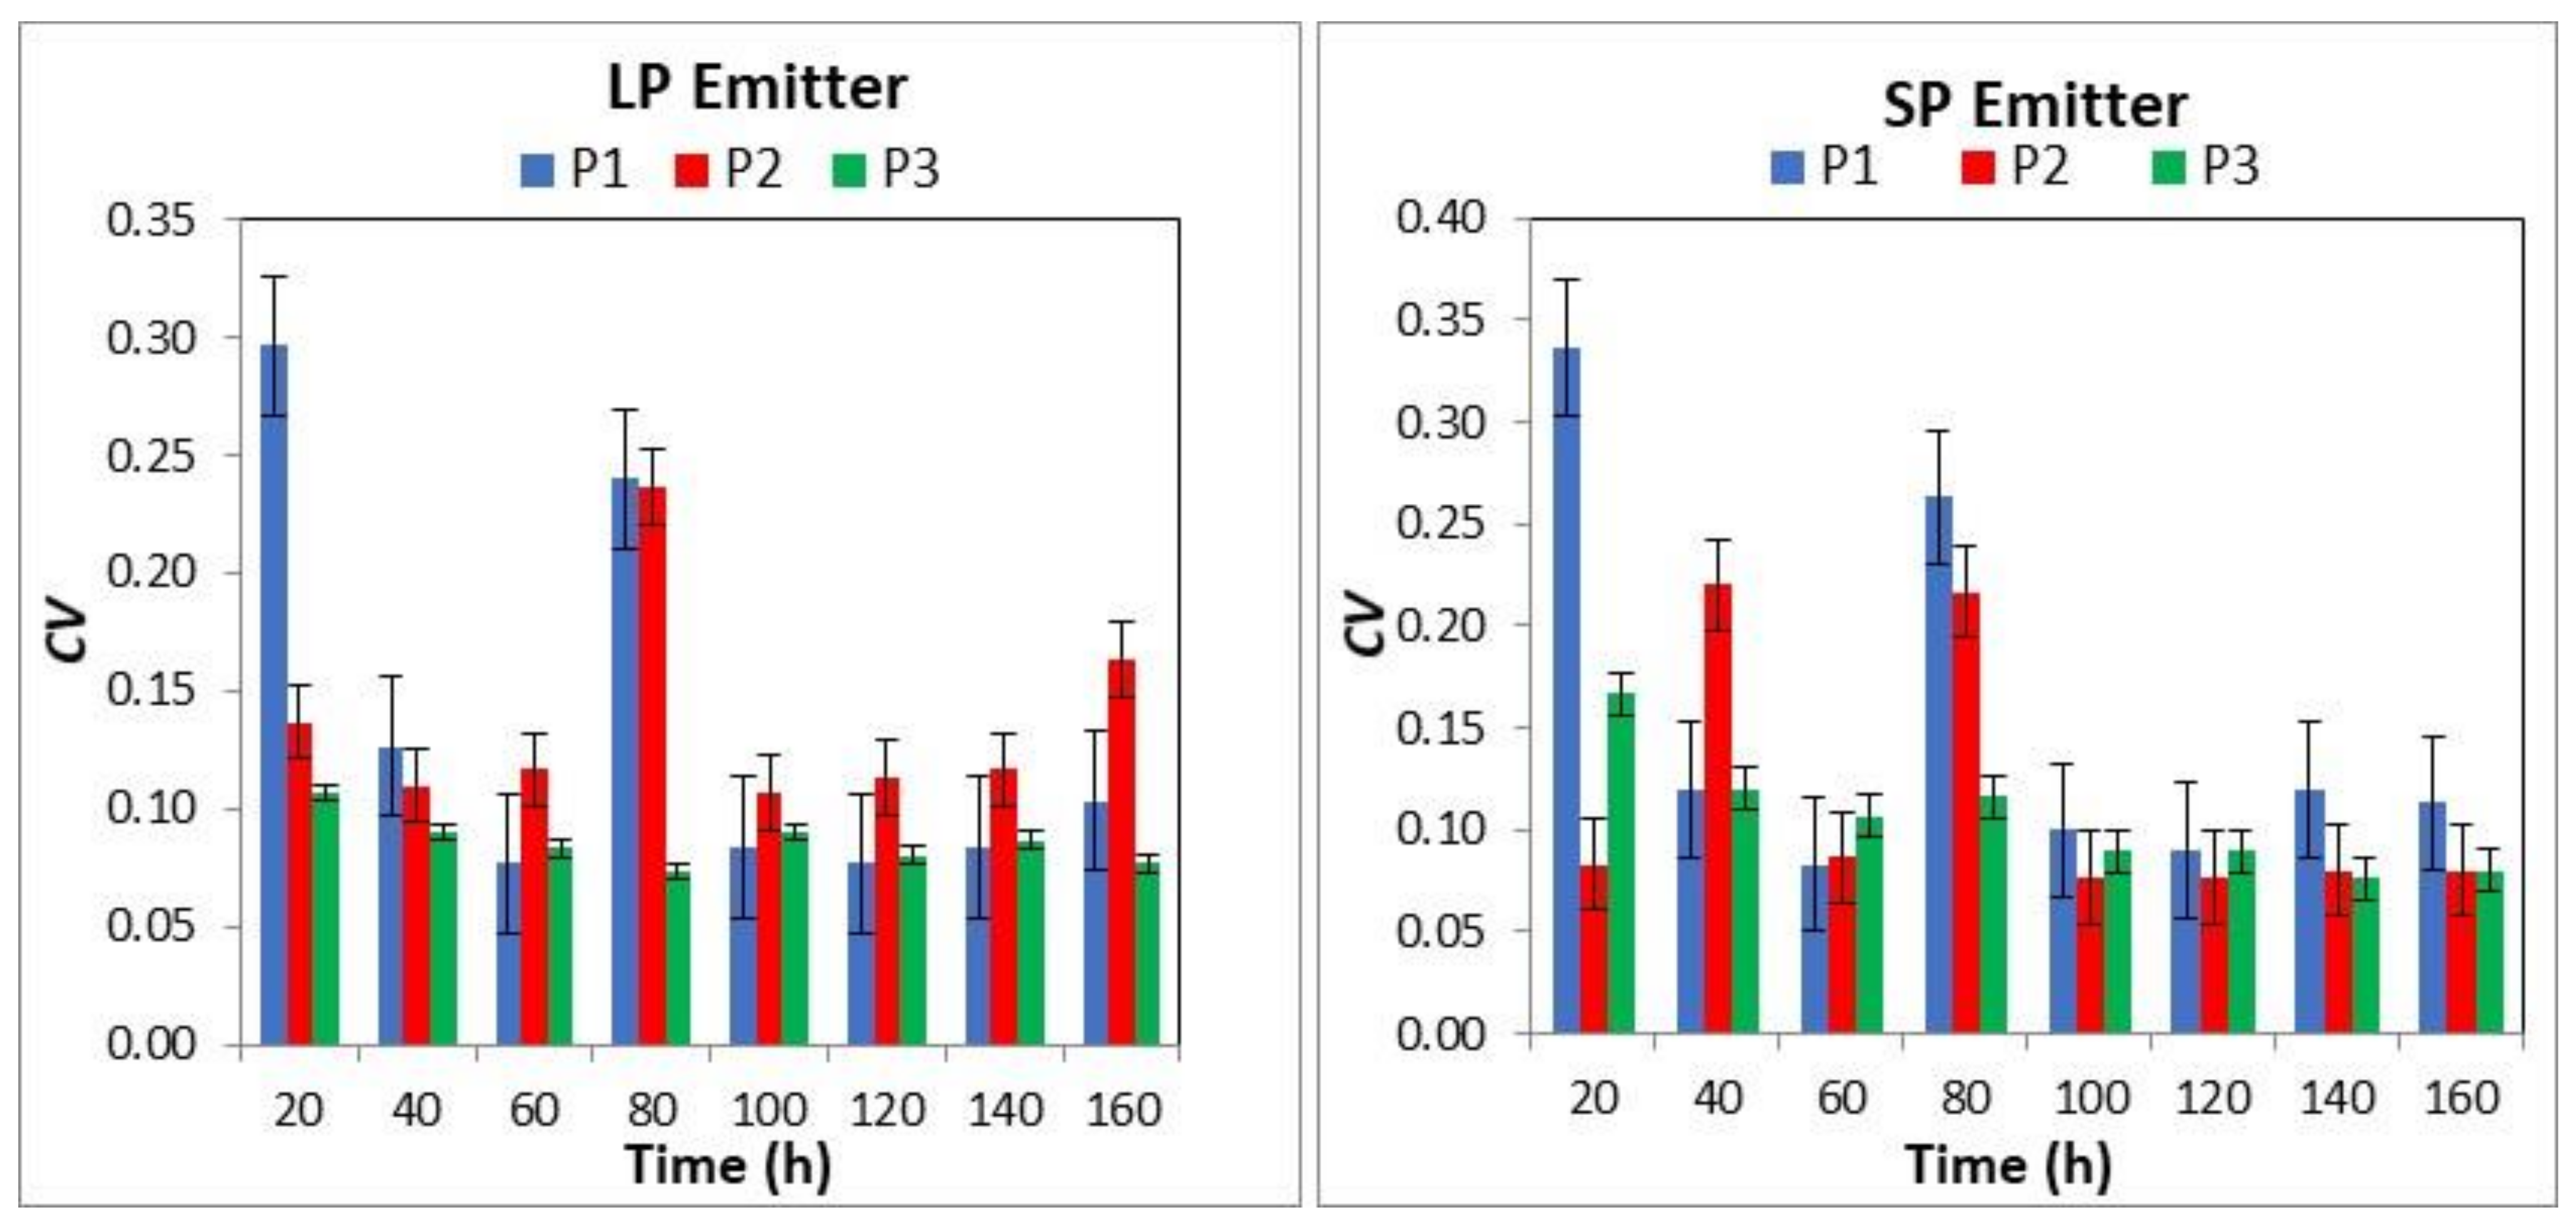
The
CV values of the emitter types (LP and SP) under different operating pressure values (0.25, 0.50, and 1.00 bar) and over varying operational times are presented in
Figure 3. The main effect of interaction for the emitter types, operating pressure, and operational time on the
CV was significant (
p < 0.05). Each combination of operating pressure with operational time and emitter type with operating pressure had a significant effect (
p < 0.05) on the
CV. However, the main effect of emitter type on
CV values was not significant. Under each type of emitter (LP and SP), the
CV values at an operating pressure of 1.00 bar and over different operational times were not different from each other. For the LP emitter at each operating pressure of 0.25 bar and 0.50 bar,
CV values at 20 and 80 h were not different from each other, but they did vary from other values at different operational times. For the SP emitter at 0.25 bar, the
CV values at 20 h of operational time were different from that of 80 h, and both of them were different from the
CV values at the rest of the operational times. At 1.00 bar, the
CV values at 40 h of operational time were different than that of 80 h, and both values were different from the
CV values at the rest of the operational times. For the LP emitter, the
CV values under 0.25, 0.50, and 1.00 bar over operational times varied from 10 to 30%, 13 to 16%, and 8 to 11%, respectively. The
CV values of the SP emitter under 0.25, 0.50, and 1.00 bar over operational times varied from 11 to 33%, 8 to 22%, and 8 to 17%, respectively.
Overall, the average values of
CV in the eight tests for the LP emitter were 14, 14, and 9% at pressures of 0.25, 0.50, and 1.00 bar, respectively. The average values of
CV for the SP emitter were 15, 12, and 11% at a pressure of 0.25, 0.50, and 1.00 bar, respectively. It was found that the
CV values for LP and SP emitters at 0.25 bar are close to each other. According to Bralts and
American Society of Agricultural Engineers (ASAE EP405.1), the values of
CV for the LP emitter were classified as low, moderate, and good at pressures of 0.25, 0.50, and 1.00 bar, respectively. The good
CV at the highest pressure might be attributed to the fact that adequate pressure offsets the effects of factors affecting the variation in emitters discharge throughout the system, which is important to consider when designing irrigation systems, especially if TWW is used. The SP emitter
CV values fell into the category of moderate at each pressure of 0.25, 0.50, and 1.00 bar, respectively [
25,
26]. This reflects a robust emitter manufacturing design and characteristics, which also indicates probably LP emitters’ manufacturing characteristics need improvement in order to achieve consistent
CV values at varying operational conditions.
The time tests of
CV results for LP and SP emitters under different operational pressures were classified according to Bralts and ASAE EP405.1 classification (
Table 4) [
25,
26]. These classifications show that the majority of tests for the LP emitter are considered to be in the category of low to moderate, medium, and low at 0.25, 0.50, 1.00 bar, respectively. For the SP emitter, the majority of tests are considered to be in the category of moderate, low, and low to moderate at 0.25, 0.50, 1.00 bar, respectively. However, Hezarjaribi et al. stated that if the emitters’
CVs are less than 5%, they give a realistic uniformity of water application [
27]. Other studies indicated that the typical range values for
CVs vary from 2 to 15% [
28,
29,
30].
3.5. Emission Uniformity (EU)
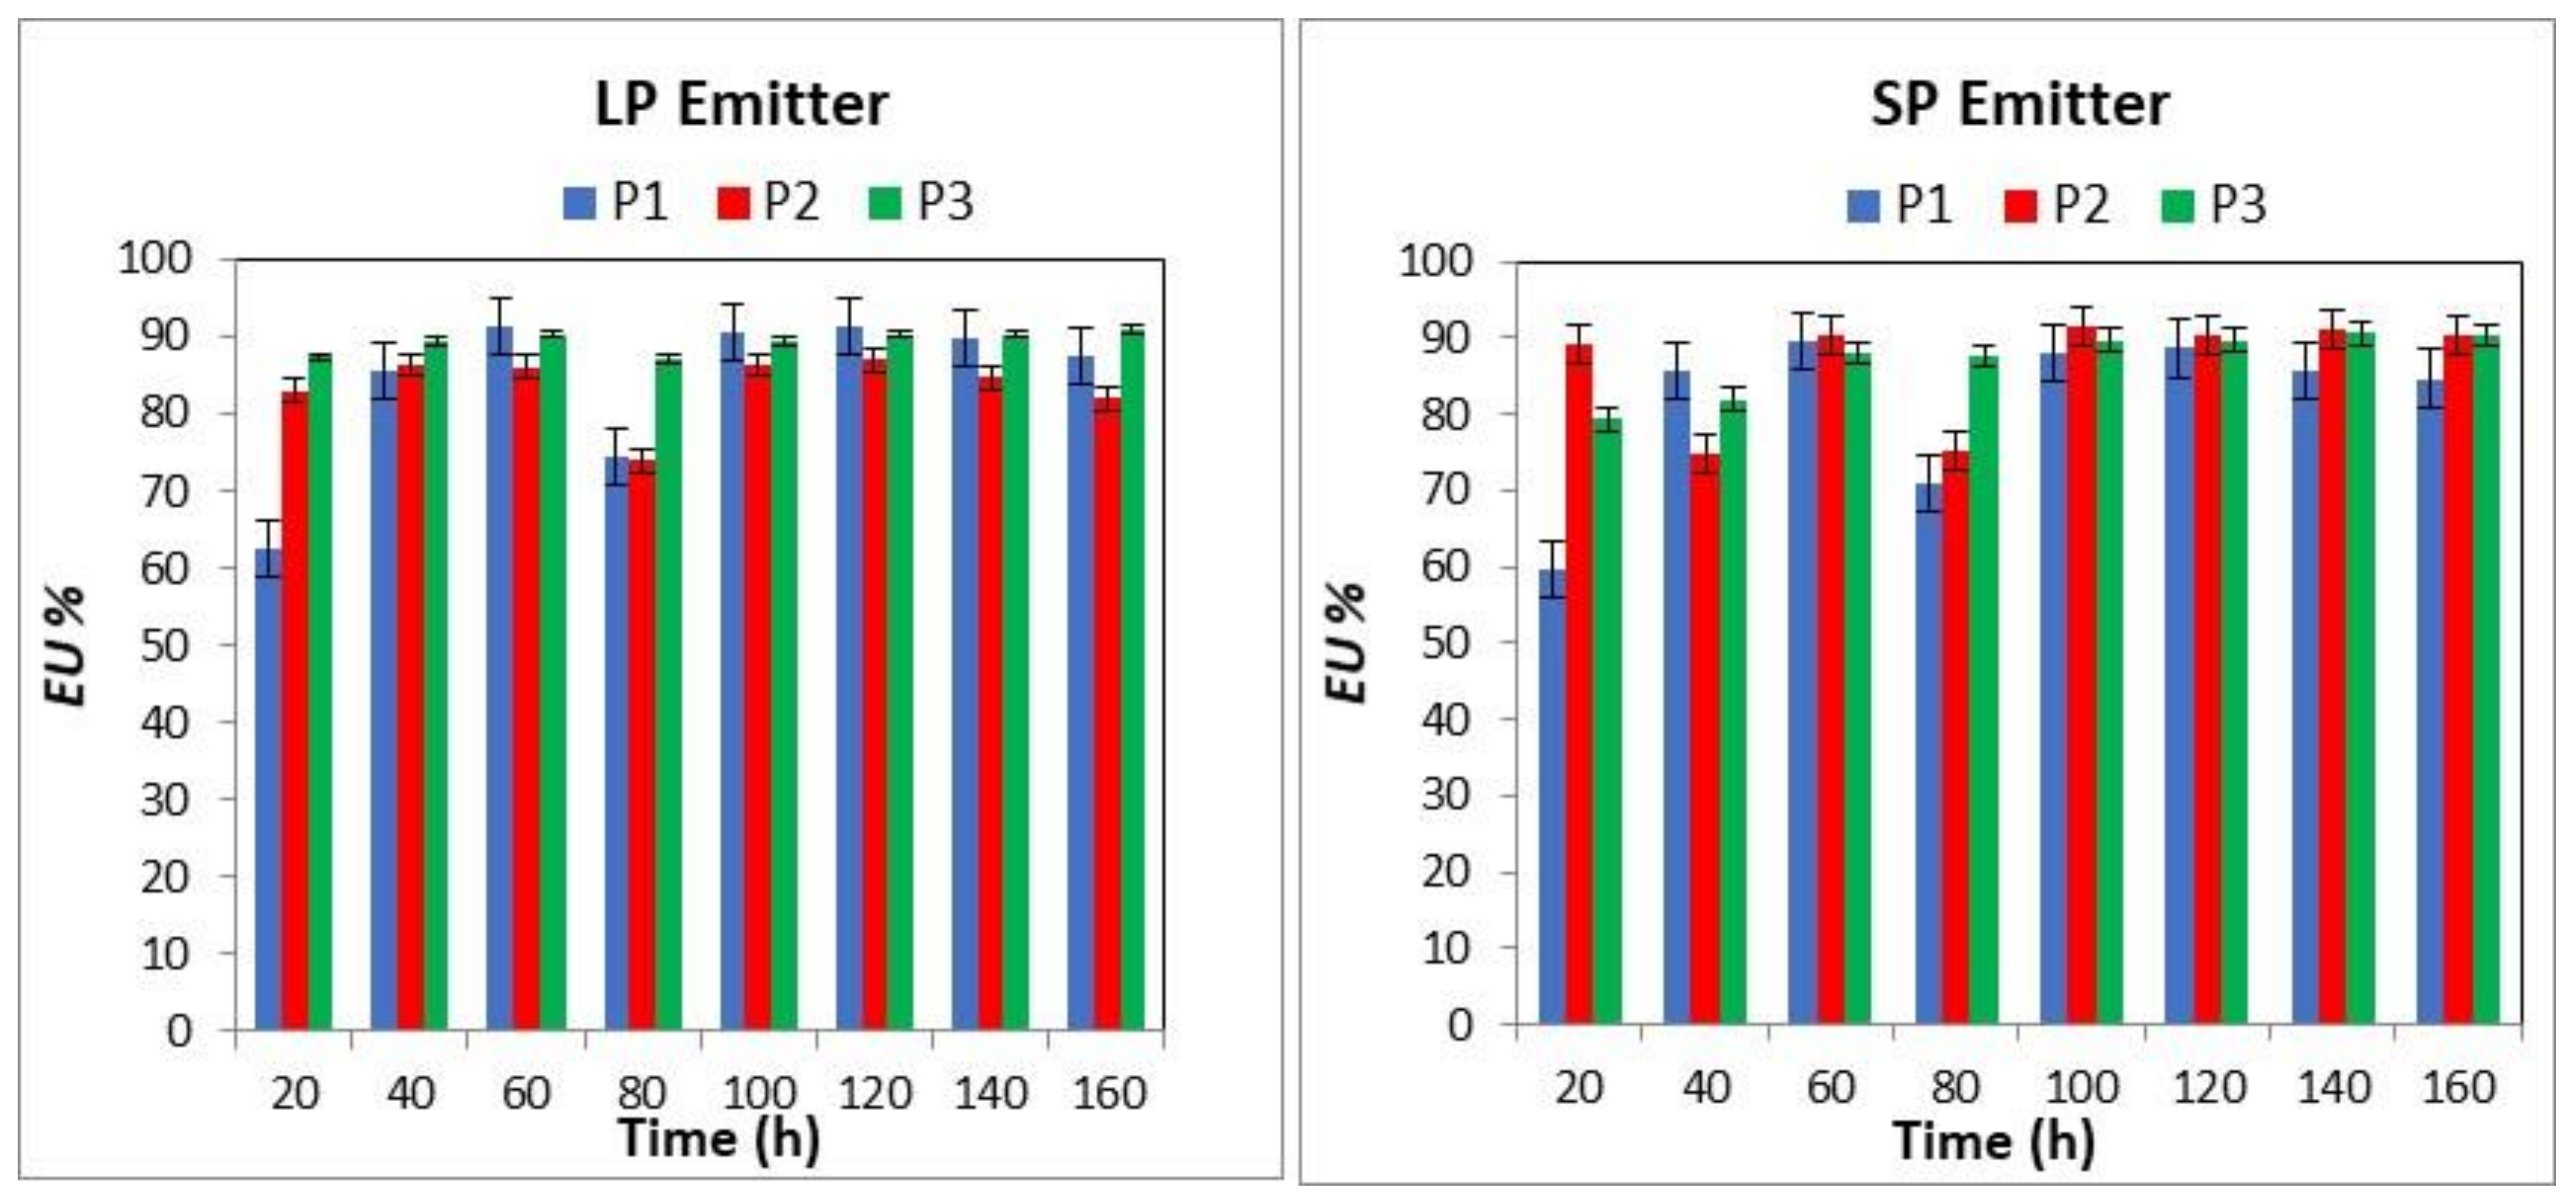
The
EU values of the LP and SP emitter types under three sets of operating pressures (0.25, 0.50, and 1.00 bar) and over varying operational times using TWW are presented in
Figure 4. The interaction for the emitter type, different operating pressures, and operating time on
EU was significant (
p > 0.05). However, the main effect of emitter type and the combination of emitter type with operational times were not significant. For the LP emitter at 0.50 and 1.00 bar over different operational times (from 20 to 160 h, with an interval time of 20 h), the mean values of
EU were not different from each other. Alternatively, for the LP emitter at 0.25 bar over the operational times, the mean values of
EU varied from each other. This indicates that the performance of the LP emitter is stable at pressures equal and higher to 0.50 bar. Irrigation systems operating at a pressure less than 0.50 bar might be at risk of lower hydraulic performance unless measures are taken to reduce pressure loss throughout the system, especially toward the end of irrigation drip lines.
The EU values over operational times of 20 and 80 h were different from each other, and both of them varied from other values at operational times of 40, 60, 100, 120, 140, and 160 h. For the LP emitter, the mean values of EU ranged from 63% to 91%, 74% to 87%, and 87% to 91% at 0.25, 0.50, and 1.00 bar, respectively. For the SP emitter at 0.25 bar, the EU values fell into two groups of operational times; the first group was 20 and 80 h, and the second group was 40, 60, 100, 120, 140, and 160 h. The mean values of EU were not different within the second group but were different in the first group. At a pressure of 0.50 bar, the EU value means fell into two groups of operational times; the first group was 40 and 80 h, and the second group was 20, 60, 100, 120, 140, and 160 h. The EU value means were not different within each group but varied between the groups. At 1.00 bar, the EU was not significantly different over the operational times. For the SP emitter, the values of EU varied from 60% to 90%, 75% to 92%, and 79% to 91% at 0.25, 0.50, and 1.00 bar, respectively. The average values of EU over eight tests for the LP emitter were 84%, 84%, and 89% at pressures of 0.25, 0.50, and 1.00 bar, respectively. The average values of EU for the SP emitter were 82%, 82%, and 87% at pressures of 0.25, 0.50, and 1.00 bar, respectively. These results show that the EU values for LP emitters are higher by 2% than those values of SP emitters at each operational pressure (0.25, 0.50, and 1.00 bar). This highlights the advantage of LP emitters over SP emitters. Low activation pressure requirement is more likely to result in a higher irrigation distribution uniformity. However, other factors such as clogging potential must be considered too.
According to the classification by Keller and Bliesner and ASAE EP405.1 (
Table 5), the majority of the operational time tests (eight tests) performed of the
EU results for LP and SP emitters under varying operational pressures fall into the category of high performance [
26,
31]. Referring to the classification by Keller and Bliesner, the results of this study indicate that the
EU values at 0.25 bar for the LP and SP emitters varied from low to moderate, while the
EU values at 0.50 and 1.00 bar were high [
31], which indicated that there is still a need to improve the design and operational characteristics of LP emitters. Based on the classification by ASAE EP405.1, the results of this study indicate that the
EU values for the LP and SP emitters at an operational pressure of 1.00 bar are more suitable for irrigation with TWW [
26]. There have been several studies [
21,
22,
27] that have dealt with the effect of TWW on emitter performance and found that increasing EU values leads to decreasing
CV values, which is consistent with our results.
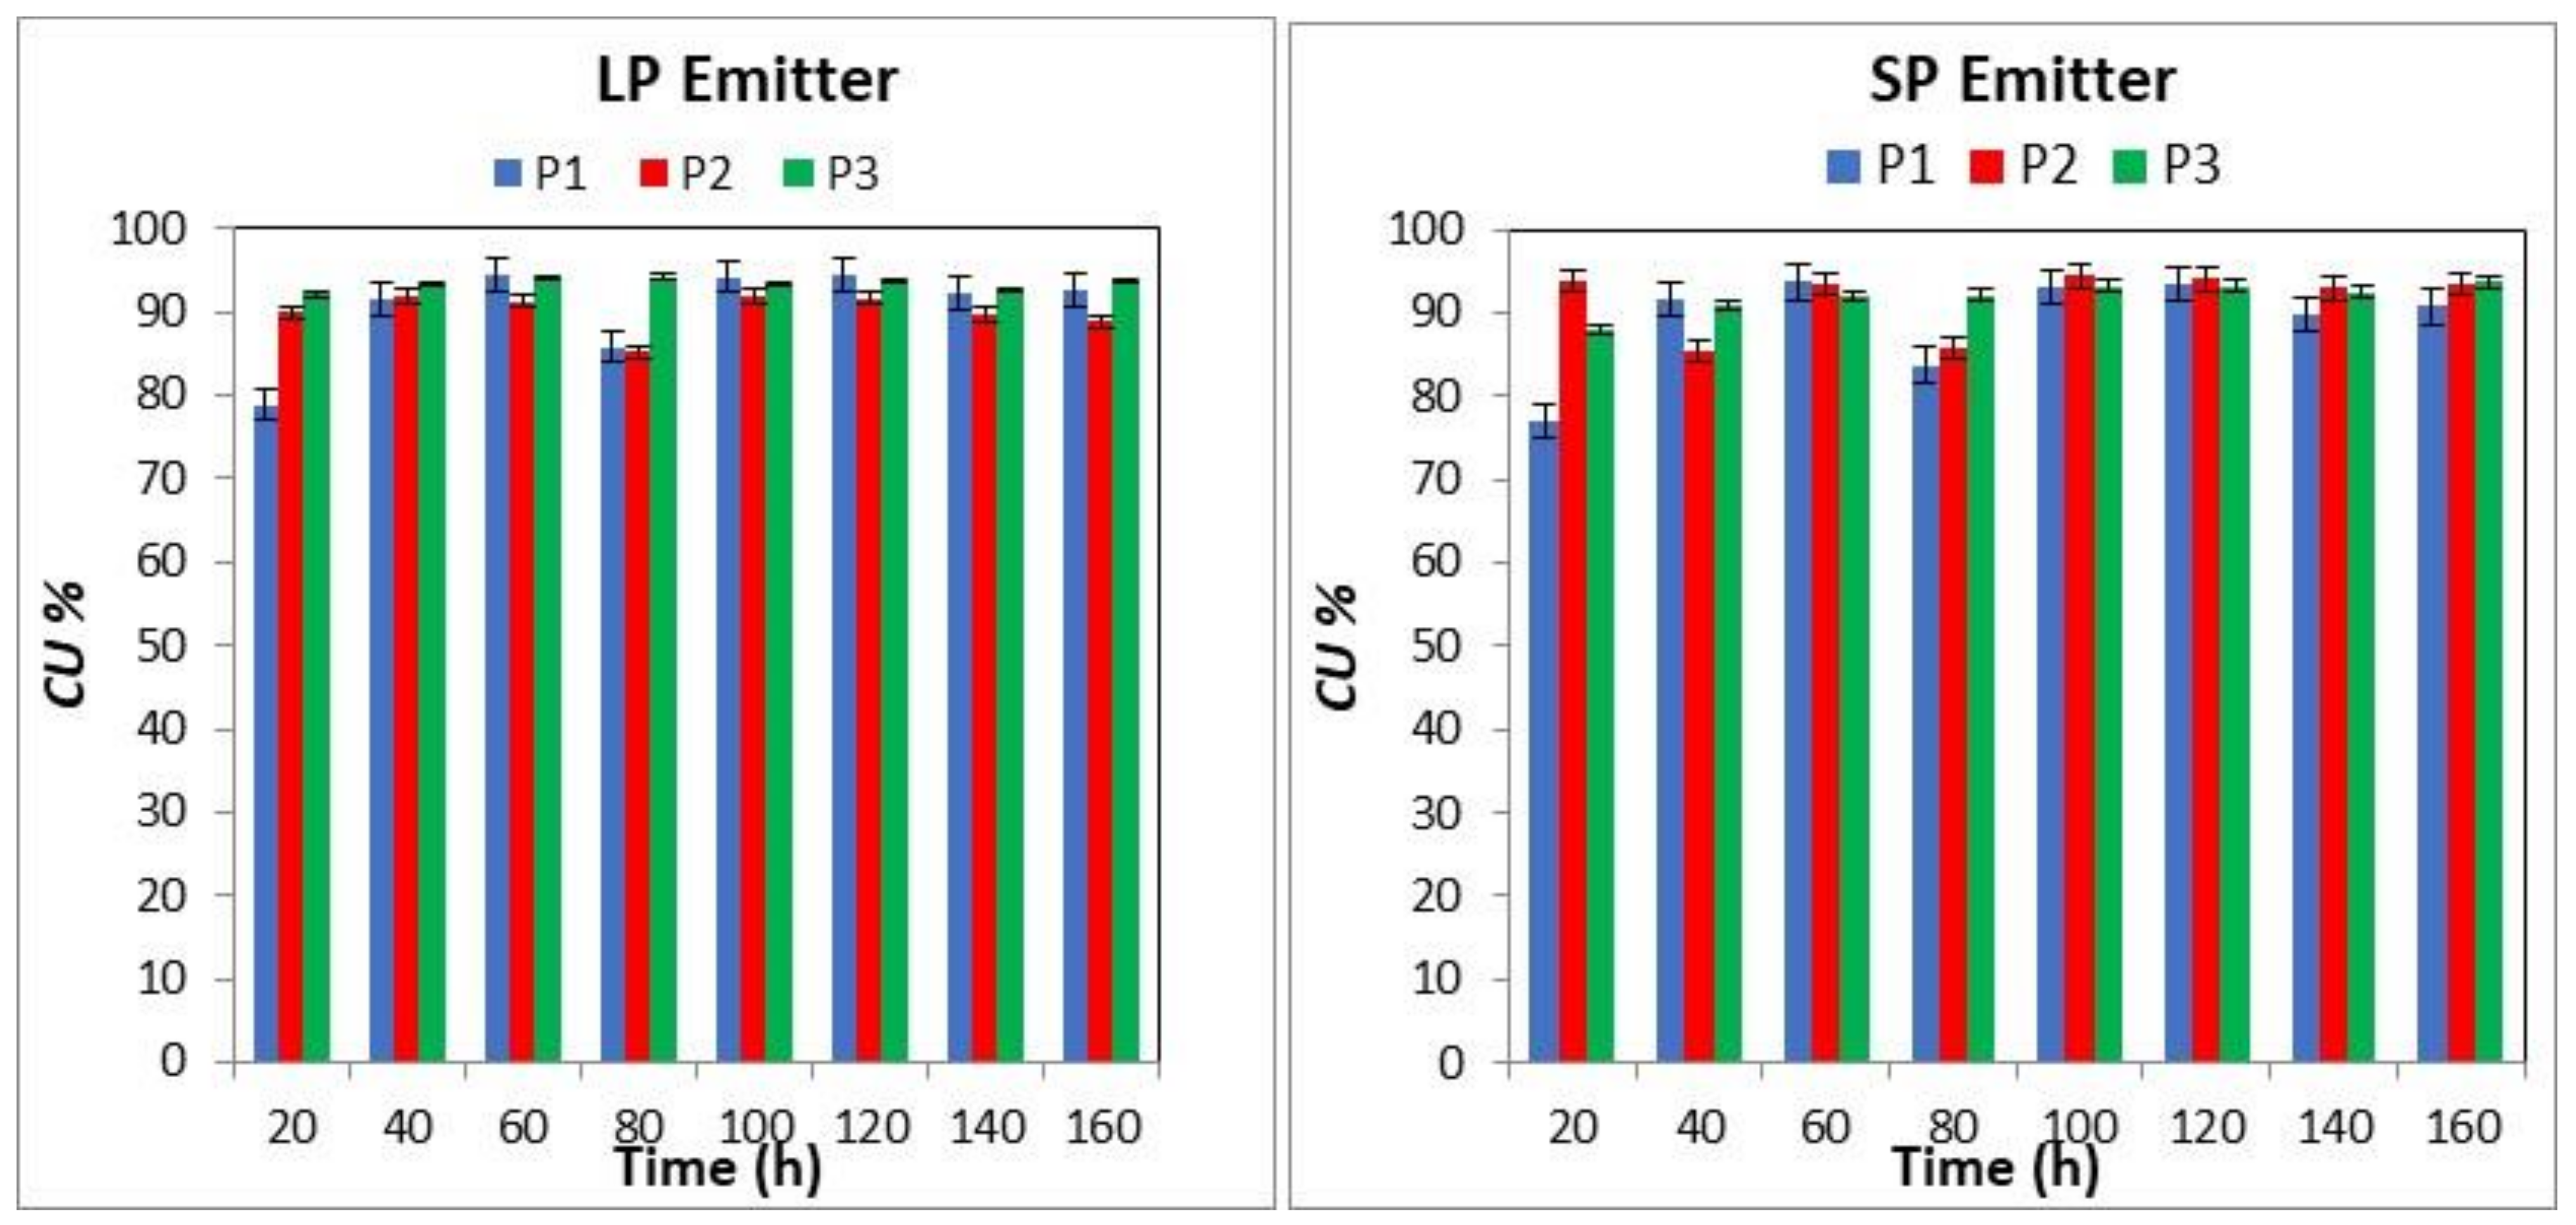
3.6. Christiansen Uniformity (CU)
The Christiansen uniformity (
CU) values for the LP and SP emitters under three sets of operating pressures (0.25, 0.50, and 1.00 bar) and over an operational time interval of 20 h using TWW are presented in
Figure 5. The main effect of the interaction of the emitter type, different operating pressures, and operational times on
CU was significant. The effect of the emitter type on
CU was not significant. The means of
CU values were significantly different under operating pressures and operational times. For the LP emitter at 0.25 bar at different operational times, the mean values of
CU were different from each other. However, the mean values of the LP emitter at 0.5 and 1.00 bar over varying operational times were not different from each other. For the LP emitter, the
CU values varied from 79 to 95%, 85 to 92%, and 92 to 94% at operating pressures of 0.25, 0.50, and 1.00 bar, respectively. At 0.25 bar, the
CU values fell into two groups of operational times; the first group was 20 and 80 h, and the second group was 40, 60, 100, 120, 140, and 160 h. The
CU values were not different in the second group but were different in the first group.
For the SP emitter, the mean values of
CU at operating pressures of 0.25 and 0.50 bar and an operational time of 20-h intervals were different from each other. However, the mean values of
CU at an operating pressure of 1.00 bar over varying operational times were not different from each other. At 0.25 bar, the
CU values demonstrated the same results as the LP emitter, as mentioned above. At a pressure of 0.50 bar, the
CU values fell into two groups of operational times; the first group was 40 and 80 h, and the second group was 20, 60, 100, 120, 140, and 160 h. The
CU values were not different in each group but were different between the groups. For the SP emitter,
CU values varied from 78 to 94%, 85 to 94%, and 88 to 93% at operating pressures of 0.25, 0.50, and 1.00 bar, respectively. According to the Keller and Bliesner classification, the results of this study indicate that the
CU under 0.25 bar for the LP and SP emitter types that fell in the first group of operational time (20 and 80 h intervals) varied from low to moderate, respectively, and the second group (40, 60, 100, 120, 140, and 160 h) was high [
31]. Overall, the results showed that with increased pressure,
CU values would increase over the operational time.
The average values of
CU over eight tests for the LP emitter were 91%, 90%, and 93% at pressures of 0.25, 0.50, and 1.00 bar, respectively. The average values of
CU for the SP emitter were 89%, 92%, and 92% at pressures of 0.25, 0.50, and 1.00 bar, respectively. It was found that the difference in the
CU values varied from 1 to 2% at each operational pressure for LP and SP emitters, respectively. According to the classification by Keller and Bliesner and ASAE EP405.1 (
Table 6), the majority of the time tests of
CU values for LP and SP emitters under different operational pressures were classified as high-performance emitters [
26,
31].
CU results, when compared with the
EU result, indicate that the
EU indicator is more suitable for evaluation and assessment of the performance of LP emitters than the
CU. Additionally, this derives from the core difference between the two approaches, i.e., the
EU approach focuses on the lower quarter of emitter discharges, while the
CU approach looks at the average discharge of all emitters. Therefore, we recommend practitioners concentrate on the use of
EU when assessing LP emitters.
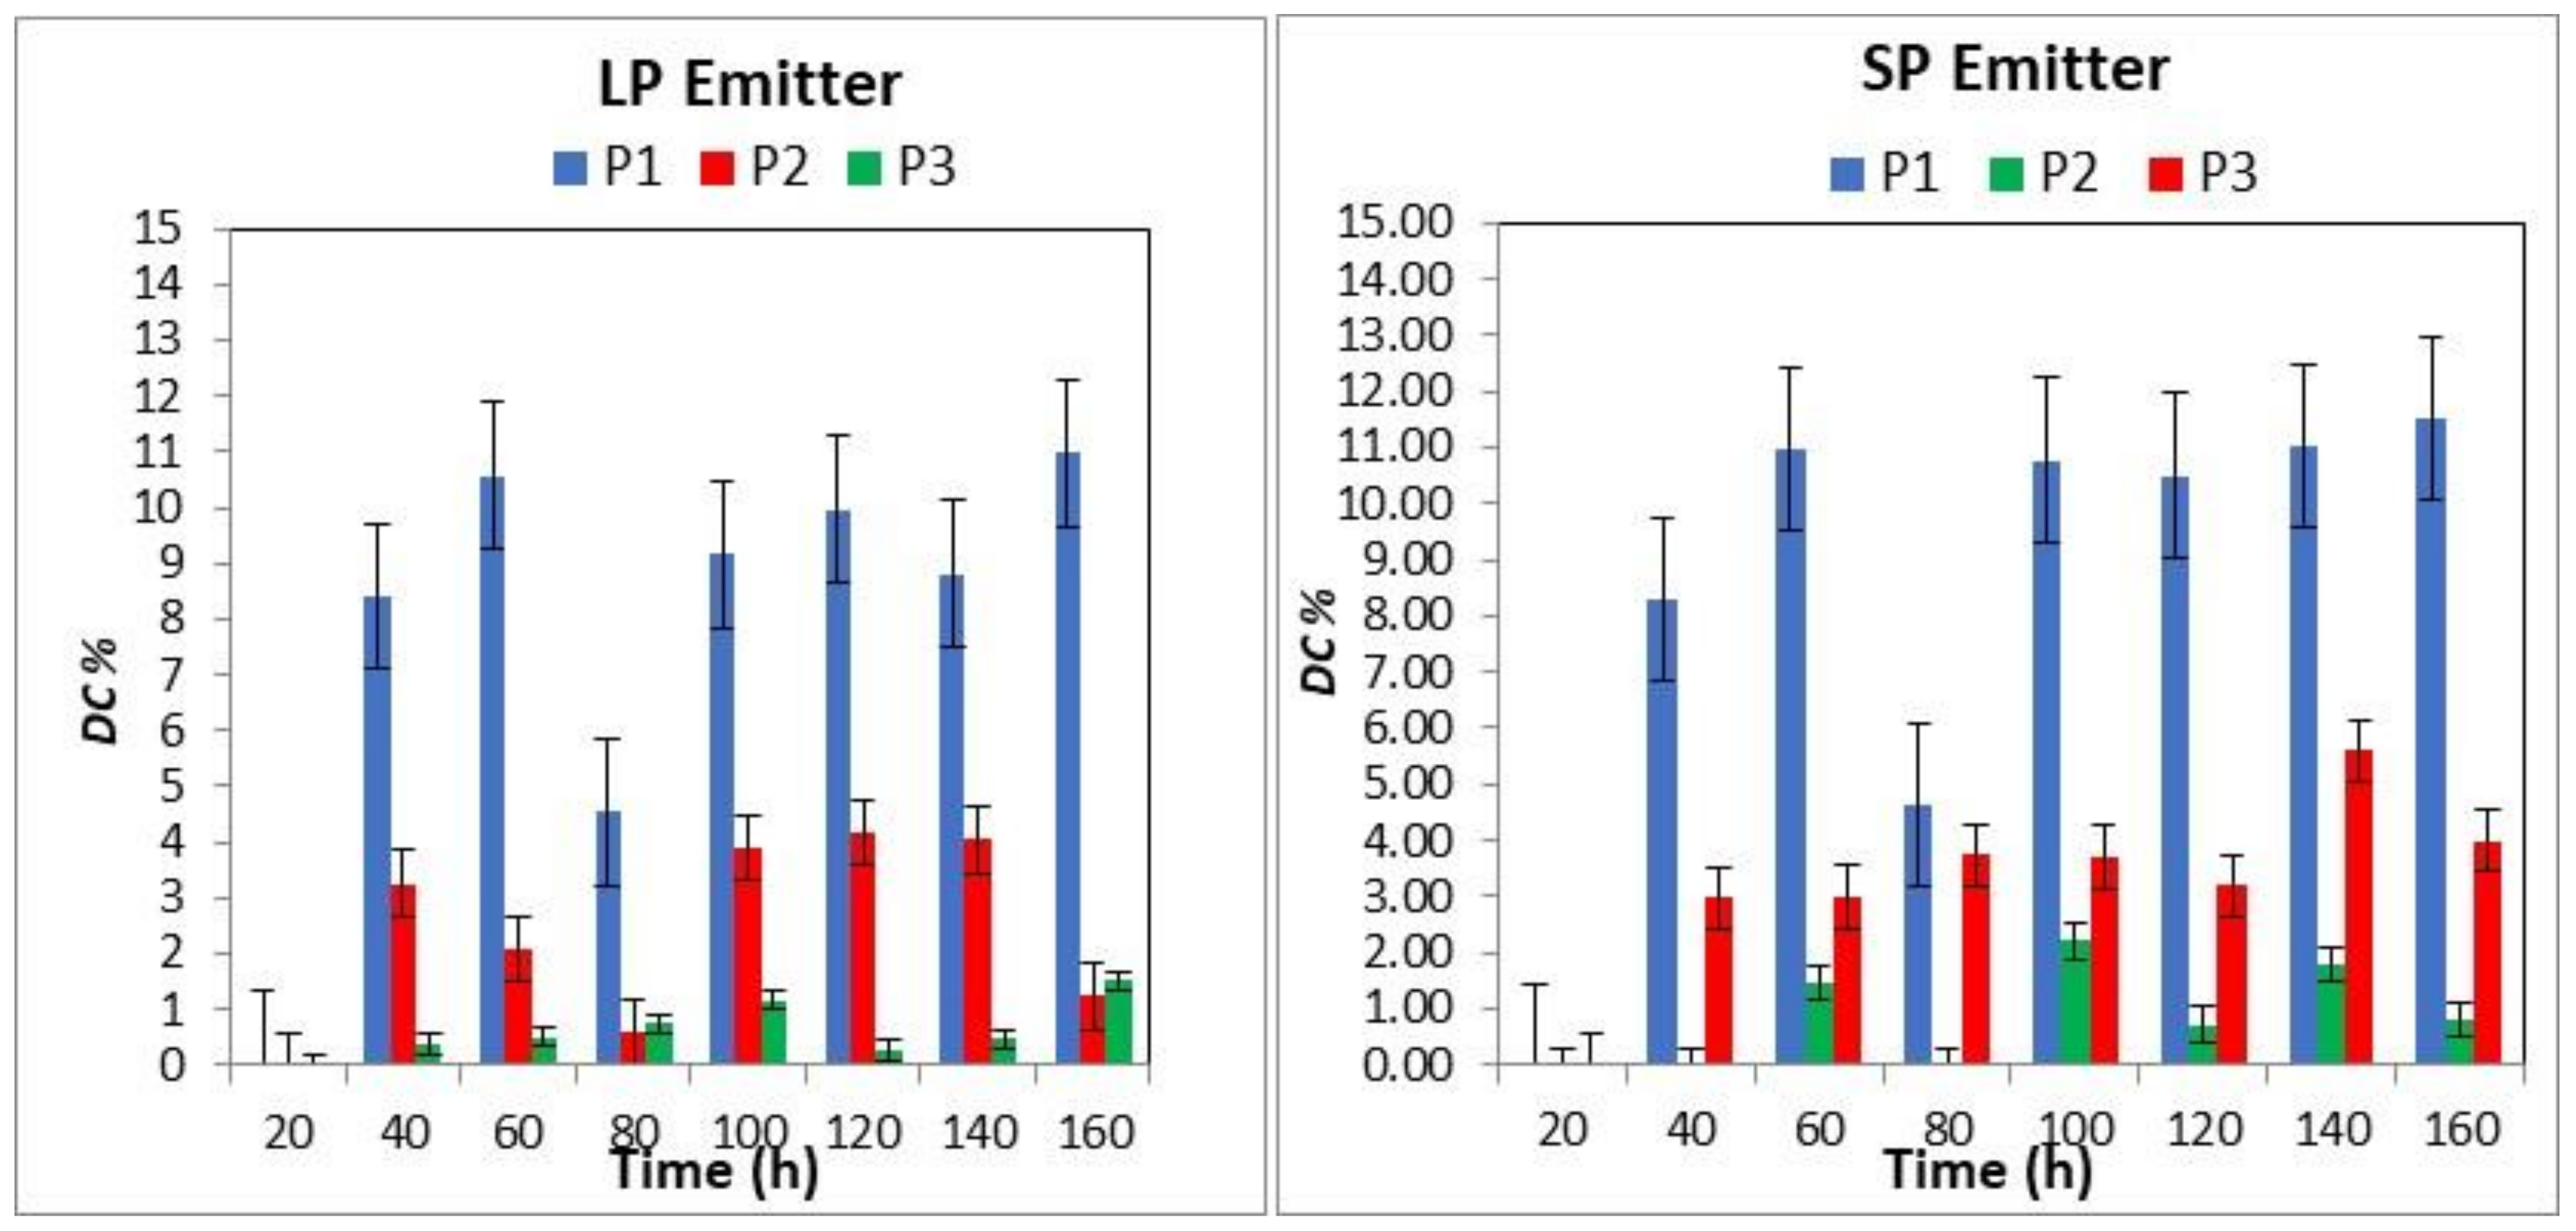
3.7. The Main Degree of Clogging (DC)
The main degree of clogging (
DC) values of the emitter types (LP and SP) under three sets of operating pressures (0.25, 0.50, and 1.00 bar) over an operational time interval of 20 h was estimated using TWW, which are presented in
Figure 6. The interaction of emitter types under different operating pressures (0.25, 0.50, and 1.00 bar) and operational times on
DC was not significant (
p < 0.05). For the LP emitter, the mean values of
DC at each operating pressure (0.25, 0.50, and 1.00 bar) and each operational time were not different from each other; the
DC values varied from 0.0 to 11%, 0.0 to 4%, and 0.0 to 1.5%, at operating pressures of 0.25, 0.50, and 1.00 bar, respectively. The average values of
DC over eight tests for the LP emitter were 8%, 2%, and 1% at pressures of 0.25, 0.50, and 1.00 bar, respectively.
For the SP emitter, the mean values of DC at each operating pressure (0.25 and 1.00 bar) and each operational time were different from each other, while they were not different at an operating pressure of 0.50 bar. At 0.25 bar, the DC values fell into two groups of operational times—the first group being 40 and 80 h and the second group being 60, 100, 120, 140, and 160 h. The mean values of DC were not different within each group but were different between the groups. The DC values varied from 0.0 to 12%, 0.0 to 2%, and 0.0 to 6% at operating pressures of 0.25, 0.50, and 1.00 bar, respectively. The average values of DC for the SP emitter over eight tests were 8.5%, 0.9%, and 3.1% at pressures of 0.25, 0.50, and 1.00 bar, respectively. The impact of pressure on the DC for both emitter types is similar, and this shows that as the operating pressure increases, the DC drops. The increasing pressure might be responsible for creating an environment in the emitter in which the deposition of sediment particles is less likely to occur. This hints at the importance of incorporating an adequate filtration system, particularly when operating at low pressures.


