Abstract
Most 2D (two-dimensional) models either take vertical velocity profiles as uniform, or consider secondary flow in momentum equations with presupposed velocity profiles, which weakly reflect the spatio-temporal characteristics of meander flow. To tackle meander flow in a more accurate 3D (three-dimensional) way while avoiding low computational efficiency, a new 3D model based on spectral methods is established and verified in this paper. In the present model, the vertical water flow field is expanded into polynomials. Governing equations are transformed by the Galerkin method and then advection terms are tackled with a semi-Lagrangian method. The simulated flow structures of an open channel bend are then compared with experimental results. Although a zero-equation turbulence model is used in this new 3D model, it shows reasonable flow structures, and calculation efficiency is comparable to a depth-averaged 2D model.
1. Introduction
A meandering channel pattern is the most common fluvial channel type, and numerical simulation concerning meander flow is an efficient technology to analyze hydrodynamic processes with sediment transport and morphological evolution. The secondary flow (Prandtl’s first kind of secondary flow, or helical secondary flow) at the bend cross section generates transversal momentum transport from inner bank to outer bank [1], as a result of the local imbalance of the centrifugal force induced by flow curvatures and the transversal pressure gradient. Accounting for the effects of secondary flow has been a subject of continuous research. For an idealized mild bend of uniform curvature, Rozovskii [2], Engelund [3], and Kikkawa et al. [4] have given analytical solutions to the secondary flow at the centerline. Spatial variation of the flow field governs sediment flux, and accordingly, bed deformations and flow separation [5]. In return, effects of topographical steering are also important for the flow structure, such as pool-riffle sequences [6] and bars on the inside of the bends [7]. Smith and McLean [8] have shown that both the advective acceleration associated with the curved flow path and bed topography play a decisive role. In many experimental channels, flow field cannot adapt instantaneously to changes in curvature, and secondary flow lags substantially [1,9]. Rozovskii [2], Odgaard [10], Ikeda and Nishimura [11], and Johannesson and Parker [1] established semi-heuristic relaxations for the phase lag between the vertical flow structure and curvature changes at the centerline of bends, which Ikeda et al. [12] later extended throughout the flow width.
On the other hand, secondary flow shows different characteristics according to channel curvatures. Many studies have focused on the secondary flow at mild and moderate bends where secondary flow monotonically increases with channel curvature [1,3,11,13]. However, these so-called linear models neglect the feedback of the secondary flow to the primary flow, which leads to an over-prediction of secondary flow for sharp bend cases. For laboratory experiments, Blanckaert [14] reported that there are capacity constraints for secondary flow development, and the saturation of secondary flow further contributes to energy loss and turbulence. There is a smaller counter-rotating circulation near the outer bank which arises from centrifugal force and anisotropic turbulence, according to Blanckaert and de Vriend [15], and this amplifies with increasing steepness and roughness of the outer bank, and with increasing curvature [16]. Sukhodolov [17] clarified up-scaling results from laboratory experiments to natural rivers through field studies assessing the turbulence for bends. An increasing number of river reaches have been narrowed, constrained, and deflected by man-made training works, such as the Lower Yellow River in China [18]. Bend sequences in this constrained meandering mostly consist of long straight transitions and short sharp bends, with the curvature radius rapidly changing. This kind of artificially stabilized meander has a non-negligible, longitudinal secondary flow development process. The relation between secondary flow and river stability is currently unclear. A simulation of the flow structure of non-equilibrium and nonlinear states would provide insight into the mechanisms of river stability.
Numerical modeling is very efficient for dealing with complicated flow problems. 3D computations for curved open-channel flows are more attractive without strong vertical profile assumptions. Many successful 3D numerical models have been proposed [19,20,21,22]. Although great progress has been made in computing power, computational efficiency still limits the application of 3D models for large-scale and long-term simulations. Depth-integrated models are still the most common tools for open channel flow and sediment transport investigation. The balance of the numerical efficiency and accuracy for hydrodynamic modeling drives the balanced treatment of different physical processes [23,24]. Recently, Navas-Montilla et al. [25] solved the shallow water equations with a high-order WENO-ADER scheme, which shows great potential for modeling meander flows with secondary currents with these novel methods.
The parameterization of the vertical flow structure as an additional dispersion term in momentum equations increases the success of depth-integrated models. As nonlinear modeling has obvious advantages over linear modeling, Blanckaert and de Vriend [9] parameterize nonlinear results, which makes the depth-integrated calcualtion of curved flow simpler. This parameterized nonlinear model is valid at the centerline of bends for 1D calculations. Later, Blanckaert and de Vriend [26] implemented this nonlinear model and revealed Cf−1h/R (Cf: river roughness, h: flow depth, R: curvature radius) and relative curvature R/B (B: width) as the two determining factors. As the transversal advection effect is not included in this nonlinear model, extension over the entire river width still needs empirical correction. Hosoda et al. [27] built a non-equilibrium model by deriving the transport equation for secondary flow strength Uh/R (U: depth averaged stream-wise velocity, h: depth, R: curvature radius) from horizontal momentum equations at equilibrium with a predefined primary velocity profile. Onda et al. [28] and Kimura et al. [29] numerically proved that this method has the ability to simulate the lag of secondary flow development behind the streamline curvature, as well as the deformation of stream-wise velocity profiles affected by secondary flow. Yang et al. [30] noticed that this mismatch leads to the generation of an unstable flow field at the bend outlet region. Bernard and Schneider [31] developed a secondary flow model by solving a stream-wise vorticity transport equation; only flow velocities on the water surface and bottom are selected for depth-averaged stream-wise vorticity. This means it simply presumes linear velocity profiles. To get more 3D information, Uchida and Fukuoka [32] assumed a cubic distribution for velocity profile and non-hydrodynamic pressure distribution, which is close to the actual situation.
All of these depth-integrated models presume water velocity profiles with different fixed forms, which greatly simplifies the calculation. However, it prevents the flow structure from being fully adjusted according to calculation conditions such as lateral wall boundary and advection by vertical velocity. The complex interaction between flow and bend boundary generally requires dynamic velocity profiles or more detailed 3D flow calculations. Meanwhile, it is necessary to simulate the vertical flow structure with high efficiency.
The present paper focuses on bend flow simulation in a simple 3D manner. To avoid vertical discretization and calculations in the vertical direction, this paper proposes a 3D model based on a horizontal 2D mesh combined with a vertical spectral method. The vertical spectral method expands velocity profiles into polynomials. The velocity profiles can be calculated dynamically in response to local boundary conditions, without numerical discretization. Although a zero-equation turbulence closure model is used in this new 3D model, it shows reliable flow structures compared with experimental data. Balanced on computational efficiency and precision, this 3D model is practically available.
2. Outline of the Proposed 3D Model
2.1. Governing Equations
A set of 3D shallow water equations based on curvilinear coordinates is used for the water velocity calculation. The curvilinear coordinates include two horizontal axes and one vertical axis, which make the structure of the equations simple and easy to calculate. For convenience, equations in Cartesian coordinates are illustrated in the model, as in Equations (1)–(4),
where t is time; H is water surface elevation; h is water depth; g is acceleration due to gravity; x, y, and z are horizontal and vertical Cartesian coordinates; u, v, and w are velocity components in the curvilinear coordinate system; ρ is fluid density; νt = αhu×ζ(1−ζ) is the eddy viscosity coefficient with constant α = 0.2; u* is shear velocity is depth-averaged eddy viscosity (αhu*); and ζ = (z−zb)/h is relative elevation from 0 to 1.
The assumption of a hydrostatic pressure distribution for meander flow simulation is reasonable here. The hydrostatic assumption has been employed by many researchers to produce acceptable results [12,19]. The vertical acceleration and vertical velocity are significant and cannot be ignored near the inner and outer banks [32]. However, the hydrostatic pressure assumption causes large errors near lateral walls for simulation, which requires further discussion.
2.2. Spectral Method
The spectral method can be viewed as a special case of the weighted residual methods or the Galerkin method, where the trial and basis functions are the same orthogonal polynomials. We assume that the vertical profiles of velocity components are well approximated by a finite sum of basis functions. The basis functions can be polynomial or trigonometric functions of relative elevation ζ. The Legendre polynomials of degree from zero to any positive integer N for horizontal velocity components, and of degree N + 2 for vertical velocity, are chosen as:
where ci, di, ei and these notations with prime are polynomial and Legendre polynomials coefficients of degree i, and pi is a Legendre polynomial of degree i. Here Legendre polynomials are defined in (0, 1) rather than the original (−1, 1).
To determine the coefficients, two horizontal momentum Equations (2) and (3) are multiplied by the ith Legendre polynomial and integrated with respect to ζ on the interval (0, 1) with weighting function equaling 1. Since the integral variable ζ is independent of x and y, the integral equations are performed as Equations (8) and (9).
Substituting the Equations (5)–(7) into integral Equations (8) and (9), all integral terms except the advection terms can be explicitly reduced in relation to polynomial coefficients. The final equation sets of coefficients to be solved are written as (10) and (11).
where BN+1, N+1 is the transform matrix (12) from general polynomials of degree N to Legendre polynomials of degree N.
For the u expression in Equation set (5), BN+1, N+1 meets the condition:
2.3. Boundary Conditions
The inner shear stress close to the bed is equal to the frictional stress. A finite number of polynomials cannot accurately represent the large velocity gradient in the near-bed region. The velocity gradients and shear stress calculated from the polynomial profile deviate greatly from reality. Hereafter, by the integration of vertical diffusion terms as in Equations (14) and (15), the momentum equations have surface and bottom conditions, which can be explicitly shown as expression (18)
where τbx and τby are contravariant components of bed shear stress are expressed using the velocity magnitude near bed ub.
where Cf = gn2h−1/3 is the coefficient of bed shear force, and n is a resistance coefficient to be calibrated. Note that the Manning resistance coefficient refers to the depth-averaged velocity.
The velocity components perpendicular to all fixed boundaries are set to zero. As the vertical velocity is obtained from the vertical integration of the continuity equation from the bottom, only the vertical velocity component at the bottom is needed, as:
The vertical velocity component at the water surface is numerically satisfied as
At the lateral boundaries, the slip boundary condition is assumed, and a quadratic bottom stress formulation can be applied. Here, the tangential shear stress at the lateral boundaries is neglected.
For the downstream boundary conditions, all velocity components are supposed to be uniform. Downstream water surface elevation is determined by the upstream discharge. To make the upstream velocity components adjustable with the discharge, local surface slopes, and bottom slopes, the velocity magnitude and shape per upstream boundary grid has to be adjusted to keep consistent with the adjacent grid downstream while maintaining the total discharge after every time step. Thus, the upstream velocity can be kept uniform after a few time steps, and therefore, the initial velocity profiles can be arbitrarily set under the prescribed discharge.
2.4. Advection Terms
Under the Gauss–Legendre quadrature rule, integrals of polynomial degree no larger than 2N + 1 can be equivalently substituted by a weighted sum of function values at the N + 1 roots of the Nth Legendre polynomial as shown in Equations (23) and (24),
where ζj is the jth root of the Nth Legendre polynomial. To solve advection terms of a hyperbolic nature, Eulerian–Lagrangian methods (ELMs) or the arbitrary Lagrangian–Eulerian method [33] have been extensively investigated [34,35,36]. ELMs are attractive because the advection term is equivalent to the temporal change of one particle moving along the characteristic line (backtracking) within one time step. However, a Courant number that does not exceed 1, as a constraint of Eulerian computational power for the appearance of advection expression, would only be taken as a reference for time step scale. Advections in Equations (23) and (24) at ζ = ζj are changed as in Equations (25) and (26).
where un+1 and vn+1 are velocity components solved from non-advection terms for the n+1th time step, and u* +1 and v*n + 1 are velocity components at the root of the characteristic line after backtracking in the velocity field of un + 1 and vn + 1. The backtracking process can be solved either by simple one-step tracking, such as the CIP scheme [35] for a small time step, or by multi-step tracking [37] for a large time step. In this paper, we set up an ELM scheme with multi-step tracking.
Divide time step Δt into m sub-steps. Suppose a particle located at point P*k at sub-step k, originally from a certain vertex (i, j), moves back to point P*k + 1 at sub-step k + 1. The displacement is equal to the velocity magnitude at P*k multiplied by sub-step Δt/m. This backtracking process stops at the location of P*m. Velocity components and other physical qualities at P*k are obtained by bilinear interpolation from grid vertexes. The velocity field at sub-step k + 1 is also a temporal linear interpolated value between n and n + 1.
2.5. Water Surface Elevation
The integration of mass conservation Equation (1) from the riverbed (z = zb) to the water’s surface (z = H) results in water depth Equation (27).
where u and v with bar are the depth-averaged u and v,
Once the horizontal velocity components are solved, water surface elevation is calculated by Equation (27) with (28) and (29).
2.6. Numerical Algorithm
Water surface elevation and polynomial coefficients for velocity components are variables to be solved. This numerical model is set on a horizontal staggered grid in a curvilinear coordinate system. The numerical algorithm has a flow diagram (Figure 1) and follows the sequence:
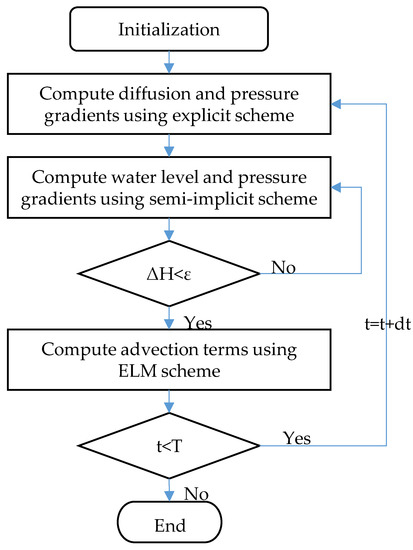
Figure 1.
Flow diagram of the numerical algorithm.
- In the beginning of every time step, calculate the first three terms on the r.h.s. for Equations (10) and (11) using an explicit scheme;
- The vertical diffusion terms (the 6th, 7th, and 8th terms on the r.h.s. of Equations (10) and (11)) is implicitly discretized and moved to the l.h.s. of the equations for the sake of stability. The water surface elevation in Equation (27) and other terms in Equations (10), (11), (23) and (24) are also calculated explicitly, but using the iteration method. The criterion for the end of iteration in each time step is that the total water surface elevation change is smaller than a given value;
- Solve the advection terms using the ELM scheme;
- Solve the vertical velocity component using Equation (1).
3. Laboratory Flume Experiment Verification
The sharp bend experiment by Blanckaert [13,38] was used for model evaluation in this paper. The flat bed flume consists of a straight inflow of 9 m, a 193° curved bend, and a straight outflow of 5 m, as shown in Figure 2a. The curvature radius of the bend centerline is R = 1.7 m. We selected a steady case water depth of 0.159 m and discharge of 0.089 m3/s. The width of the channel is B = 1.3 m and the lateral walls are vertical, made of Plexiglas, and considered hydraulically smooth. The horizontal bottom is hydraulically rough, with a Manning coefficient of 0.0179. Measurements were implemented at 12 cross sections: 2 cross sections at 2.5 m and 0.5 m upstream of the bend (noted as M25 and M05); 7 cross sections at 15°, 30°, 60°, 90°, 120°, 150°, and 180° in the bend (noted as S15, S30, S60, S90, S120, and S180); and 3 cross sections at 0.5 m, 1.5 m, and 2.5 m downstream of the bend (noted as P05, P15, and P25). More than 40 profiles were included, each cross section in and downstream of the bend, and refined close to the wall (about 30 profiles at M25 and M05). Each profile included about 50 measuring points evenly distributed in the vertical direction. For each point, velocity components were non-intrusively measured by an acoustic Doppler velocity profiler in stream-wise, vertical, and transverse directions.
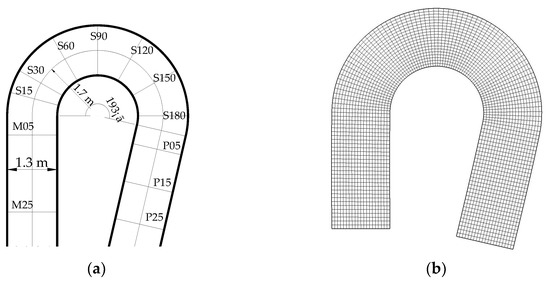
Figure 2.
(a) Blanckaert (2002) experimental setup; (b) horizontal discretization of the calculation domain.
The simulation was run on a staggered grid with 130 × 20 cells with inlet and outlet reaches both shortened to 2.6 m (Figure 2b). The calculation time step was 0.02 s. The water surface level was calculated at the outlet, using uniform flow conditions which employ the overall slope along the bend centerline. Fixed discharge (0.089 m3/s) was set at the upstream boundary. The resistance coefficient was set as 0.02 and no friction was considered in the simulation on the lateral walls for the sake of simplicity. The simulation was run on a computer with intel i7 3770 CPU and 4 GB RAM. Simulation for a duration of 400 s cost a CPU time of about 252 s, 1021 s, 2085 s, and 2877 s for N = 0, 2, 4, and 6 respectively. As N = 0 is the normal depth-averaged 2D model case, the model was efficient on the 2D model level. Here only the results of N = 2 are shown. Grid independency was tested on another grid with 130 × 40 cells. For the same experiment, van Balen et al. [39] previously ran the simulation using an LES-based approach on a grid with 1260 × 192 × 24 cells, and Zeng et al. [40] employed RANS with 127 × 101 × 35 cells. The computational efficiency of this model is obviously high, and is especially obvious considering the cell number.
We chose the S90 and S180 cross sections for the velocity profile comparison. Van Balen et al. [39] also included these two cross-section data sets for comparison with the LES simulation. As shown in Figure 3 and Figure 4, the model shows acceptable agreement for both stream-wise and transversal velocity profiles at the S90 and S180 cross sections. The averaged errors of stream-wise and transversal velocity were 0.053 m/s and 0.034 m/s for the S90 cross section, with a mean velocity of 0.419 m/s. The averaged errors of stream-wise and transversal velocity were 0.046 m/s and 0.039 m/s for the S180 cross-section. The dip phenomena observed in the measurement were successfully simulated. The transversal velocity, which is a good reference for secondary flow strength, again showed a good agreement both in magnitude and shape near the centerline.
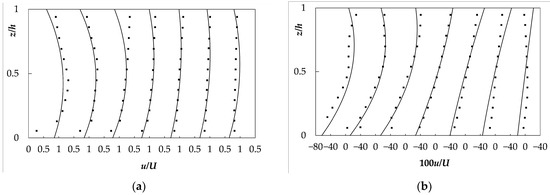
Figure 3.
S90 cross section stream-wise velocities (a) and transversal velocities (b). Solid square points represent the experimental results, and the solid lines represent the simulation. From left to right, the transversal locations are 0.10B, 0.17B, 0.27B, 0.46B, 0.65B, 0.79B, and 0.88B from the left bank.
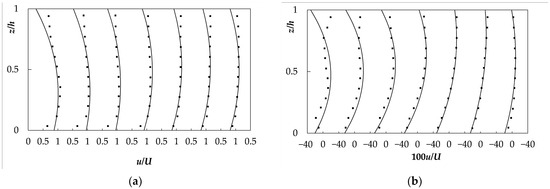
Figure 4.
S180 cross section stream-wise velocities (a) and transversal velocities (b). The legend and locations are the same as in Figure 2.
In the S90 cross section, there was an obvious difference at the region close to the surface of profile 0.27B from the inner (left) bank. In the S180 cross section, there was an obvious difference in the upper region of the profiles. The measured velocity always achieved a maximum near the water surface, while the simulated maximum velocity appeared at the middle for each profile. For the transversal velocity, a weaker agreement appeared only at two profiles close to the outer bank at the S90 cross section. At the S180 cross-section, only the upper region of the profiles close to the inner bank had an obvious difference. This model apparently overestimated the secondary flow strength at the outer bank of the S90 cross section.
Figure 5 gives a general comparison for the other cross sections. From cross sections S15 to P25, each cross section had an uneven distribution of velocity, and the higher-velocity core moved from the inner bank to the outer bank. The simulated distribution showed the same trend as the measured distribution. One obvious difference is that the measured higher-velocity core was located closer to the water surface.
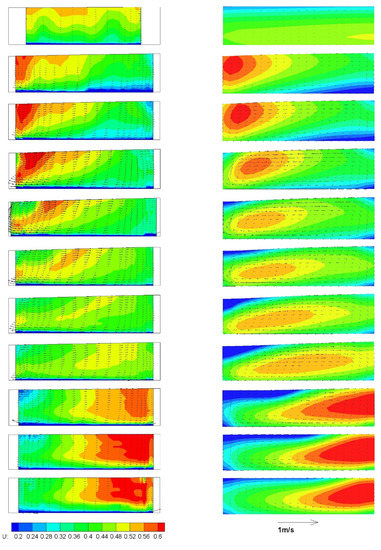
Figure 5.
Stream-wise velocities (contour) and transversal velocities (vector): measured (left) and predicted (right). From top to bottom, the cross sections are M05, S15, S30, S60, S90, S120, S150, S180, P05, P15, and P25, as shown in Figure 1a.
The measured and predicted horizontal distributions of depth-averaged velocity are illustrated in Figure 6. The simulated velocity distribution was in good agreement with the measured result. Just downstream of the bend inlet, the higher-velocity core appeared at the inner bank region, while the low-velocity region appeared closer to the outer bank. The higher-velocity core slowly moved to the outer bank downstream because of secondary flow in the transversal direction. At the bend outlet, the core was located close to the outer bank. There is only a marginal difference between Figure 6b,c, proving that the model had relatively strong grid independence. The core shifting process across the bend is illustrated in Figure 7. The transverse distance of the core from the inner bank at each cross section along the stream-wise direction is depicted. The measured core location gradually shifted from the inner band at the bend inlet to the outlet. The present simulation results show an acceptable agreement with the measured data, though the simulated shifting became slower at upstream regions of the outlet than in the measured data.
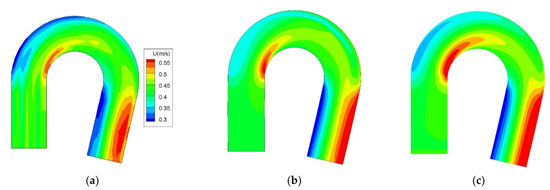
Figure 6.
Distribution of depth-averaged stream-wise velocity: measured (a), computed (b), and computed on the refined grid (c).
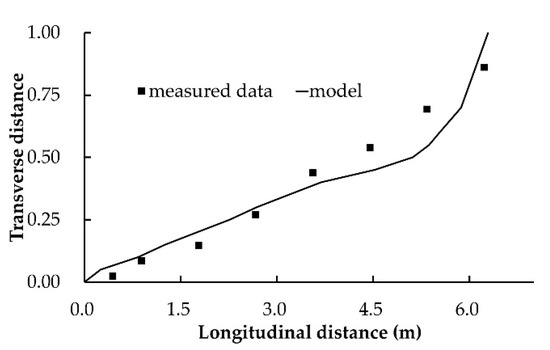
Figure 7.
Larger velocity core shifting process. The bend length along the flume centerline is about 5.73 m. The transverse distance is from the bend inner bank, normalized by width.
4. Discussion
As the vertical velocity is calculated from a continuity equation, no vertical velocity effect on horizontal equations is considered except vertical advection terms. This kind of hydrostatic assumption is not applicable to sharp bends, where the vertical velocity is not negligible. On the other hand, the polynomials’ degree is only two. When the profile is more complicated, low-degree polynomials are not enough, and the systematic error is very large. Turbulent viscosity is another mechanism for the velocity profile. As a larger velocity gradient brings higher viscosity, this would suppress the velocity gradient in return. Therefore, a parabolic distribution of eddy viscosity is not appropriate for bend open channel flow. All of these factors would introduce numerical errors to the simulation.
For a given discharge, water surface elevation depends on boundary resistance and water turbulence. As a zero-equation turbulence model is employed and turbulence decouples with flow structure in this model, adjustment of the bed resistance would not affect the flow strength effectively. Here we ignore the water surface elevation comparison.
For 3D shallow water equations, Legendre polynomials were selected with the domain of relative elevation variable from 0 to 1. The depth gradient was small enough in this test case, and relative elevation was almost uniform horizontally in the local region. Otherwise, it could cause an obvious system error. That is, inhomogeneous depth would bring in extra items for momentum equations under non-orthogonal vertical and horizontal coordinates.
By using the semi-Lagrangian method, advections of momentum were solved. There was no grid in the vertical direction, and so an upwind scheme was impossible for the velocity profile calculation. We transferred the profile calculation into a weighted sum of calculation at the roots of Legendre polynomials. This transformation was accurate for this model.
In the test case, no wall friction was considered for the simulation. This led to an overestimation of velocity close to the lateral wall. A rough zero-equation turbulence model was employed for flow structure. Vertical momentum was neglected. The Legendre polynomials’ degree was only 2. These simplifications led to a deviation of the simulation from the measurement data. In contrast to the measured data, there was no second circulation cell near the outer bank in the simulation. The zero-equation turbulence model is not strictly valid in the vicinity of the banks. Moreover, it will not reproduce the second circulation cell near the outer bank, as the cell is a result of the complex interaction between turbulence stresses and centrifugal effects [41]. To reproduce the second circulation cell, it is necessary to solve the vertical momentum equation without reliance on the assumption of hydrostatic pressure distribution and the use of an isotropic turbulence model.
There is no physical meaning for variable domains of ζ < 0 and ζ > 1. The momentum flux across the water surface and bed surface should be zero, which is not automatically satisfied in the spectral method. In this model, resistance from bed friction is expressed by setting non-zero flow velocity numerically on the bed boundary. The hydrostatic pressure assumption is applicable if the vertical velocity or its gradient is assumed to be small enough. However, for the flow at a sharp bend, a vertical velocity is very large and a non-hydrostatic pressure model is appropriate.
For a special case, N = 0. Equations (8) and (9) reduce to Equations (30) and (31). Together with Equation (27), these three equations compose the 2D depth-averaged model.
5. Conclusions
The authors propose a new 3D numerical model using a 2D plane model combined with a vertical spectral method. The present model was applied to simulate open channel flow around a sharp bend, and the simulated flow structures are compared with the experimental results, while a zero-equation turbulence model is employed. The obvious deviation of the simulated velocity from the measured velocity may have been caused by the presumed viscosity distribution. Another factor is that the Legendre polynomials employed were of degree from 0 to 2. Both the vertical profiles at the selected cross sections and the horizontal distribution of the depth-averaged velocity showed rather good agreement between the experimental and simulated data. We conclude that this 3D model has the ability to simulate the complicated flow structure of a sharp bend channel. The present computational results suggest that the proposed model is a powerful tool to predict and analyze open channel flows around sharp bends.
Author Contributions
Funding acquisition, writing—review, project administration, and supervision, Y.W. and E.J.; methodology, software, validation, and writing—original draft preparation, F.Y. All authors have read and agreed to the published version of the manuscript.
Funding
This research was funded by the National Key R&D Program of China (Grant No. 2018YFC0407402), the National Natural Science Foundation of China (NSFC, Grant No. 42041004), the Provincial Science Fund for Excellent Young Scholars of Henan (Grant No. 202300410540), and the Yellow River Institute of Hydraulic Research (Grant No. HKYSD202001).
Institutional Review Board Statement
Not applicable.
Informed Consent Statement
Not applicable.
Data Availability Statement
Data are available on request from the authors.
Conflicts of Interest
The authors declare no conflict of interest. The funders had no role in the design of the study; in the collection, analysis, or interpretation of the data; in the writing of the manuscript; or in the decision to publish the results.
References
- Johannesson, H.; Parker, G. Secondary flow in mildly sinuous channel. J. Hydraul. Eng. 1989, 115, 289–308. [Google Scholar] [CrossRef]
- Rozovskii, I.L. Flow of Water in Bends of Open Channels; Academy of the Sciences of the Ukrainian SSR Israel Program for Scientific Translations: Jerusalem, Israel, 1961. [Google Scholar]
- Engelund, F. Flow and bed topography in channel bends. J. Hydr. Div. ASCE 1974, 100, 1631–1648. [Google Scholar] [CrossRef]
- Kikkawa, H.; Ikeda, S.; Kitagawa, A. Flow and bed topography in curved open channels. J. Hydr. Div. ASCE 1976, 102, 1327–1342. [Google Scholar] [CrossRef]
- Blanckaert, K.; Kleinhans, M.G.; McLelland, S.J.; Uijttewaal, W.S.; Murphy, B.J.; Kruijs, A.; Parsons, D.R.; Chen, Q. Flow separation at the inner (convex) and outer (concave) banks of constant-width and widening open-channel bends. Earth Surf. Proc. Land. 2013, 38, 696–716. [Google Scholar] [CrossRef]
- Thompson, A. Secondary flows and the pool-riffle unit: A case study of the processes of meander development. Earth Surf. Proc. Land. 1986, 11, 631–641. [Google Scholar] [CrossRef]
- Dietrich, W.E.; Smith, J.D. Influence of the point-bar on flow through curved channels. Water Resour. Res. 1983, 19, 1173–1192. [Google Scholar] [CrossRef]
- Smith, J.D.; McLean, S.R. A model for flow in meandering streams. Water Resour. Res. 1984, 20, 1301–1315. [Google Scholar] [CrossRef]
- Blanckaert, K.; de Vriend, H.J. Nonlinear modeling of mean flow redistribution in curved open channels. Water Resour. Res. 2003, 39. [Google Scholar] [CrossRef]
- Odgaard, J.A. Meander flow model: I. Development. J. Hydraul. Eng. 1986, 112, 1117–1136. [Google Scholar] [CrossRef]
- Ikeda, S.; Nishimura, T. Flow and bed profile in meandering sand-silt rivers. J. Hydraul. Eng. 1986, 112, 562–579. [Google Scholar] [CrossRef]
- Ikeda, S.; Yamasaka, M.; Kennedy, J.F. Three-dimensional fully-developed shallow-water flow in mildly curved bends. Fluid Dyn. Res. 1990, 6, 155–173. [Google Scholar] [CrossRef]
- de Vriend, H.J. A mathematical model of steady flow in curved shallow channels. J. Hydraul. Res 1976, 15, 37–54. [Google Scholar] [CrossRef]
- Blanckaert, K. Saturation of curvature-induced secondary flow, energy losses, and turbulence in sharp open-channel bends: Laboratory experiments, analysis, and modeling. JGR Earth Surf. 2009, 114. [Google Scholar] [CrossRef]
- Blanckaert, K.; de Vriend, H.J. Secondary flow in sharp open-channel bends. J. Fluid Mech. 2004, 498, 353–380. [Google Scholar] [CrossRef]
- Blanckaert, K. Hydrodynamic processes in sharp mearder bends and their morphological implications. JGR Earth Surf. 2011, 116, F01003. [Google Scholar] [CrossRef]
- Sukhodolov, A.N. Structure of turbulent flow in a meander bend of a lowland river. Water Resour. Res. 2012, 48. [Google Scholar] [CrossRef]
- Wu, B.; Wang, G.; Ma, J.; Zhang, R. Case study River training and its effects on fluvial processes in the Lower Yellow River, China. J. Hydraul. Eng. 2005, 131, 85–96. [Google Scholar] [CrossRef]
- Shimizu, Y.; Yamaguchi, H.; Itakura, T. Three-dimensional computation of flow and bed deformation. J. Hydraul. Eng. 1990, 116, 1090–1108. [Google Scholar] [CrossRef]
- Wu, W.; Rodi, W.; Wenka, T. 3D numerical modeling of flow and sediment transport in open channels. J. Hydraul. Eng. 2000, 126, 4–15. [Google Scholar] [CrossRef]
- Kimura, I.; Hosoda, T. A non-linear k–ε model with realizability for prediction of flows around bluff bodies. Int. J. Numer. Meth. Eng. 2003, 42, 813–837. [Google Scholar] [CrossRef]
- Hanne, L.; Diane, P.; Alison, R. SELFE: A semi-implicit eulerian-lagrangian finite-element model for cross-scale ocean circulation. Ocean Model 2008, 21, 71–96. [Google Scholar] [CrossRef]
- Begnudelli, L.; Valiani, A.; Sanders, B.F. A balanced treatment of secondary currents, turbulence and dispersion in a depth-integrated hydrodynamic and bed deformation model for channel bends. Adv. Water Resour. 2010, 33, 17–33. [Google Scholar] [CrossRef]
- Juez, C.; Murillo, J.; García-Navarro, P. A 2D weakly-coupled and efficient numerical model for transient shallow flow and movable bed. Adv. Water Resour. 2014, 74, 93–109. [Google Scholar] [CrossRef]
- Navas-Montilla, A.; Juez, C.; Franca, M.J.; Murillo, J. Depth-averaged unsteady RANS simulation of resonant shallow flows in lateral cavities using augmented WENO-ADER schemes. J. Comput. Phys. 2020, 395, 511–536. [Google Scholar] [CrossRef]
- Blanckaert, K.; de Vriend, H.J. Meander dynamics: A nonlinear model without curvature restrictions for flow in open-channel bends. JGR Earth Surf. 2010, 115. [Google Scholar] [CrossRef]
- Hosoda, T.; Nagata, N.; Kimura, I.; Michibata, K.; Iwata, M. A depth averaged model of open channel flows with lag between main flows and secondary currents in a generalized curvilinear coordinate system. In Advances in Fluid Modeling & Turbulence Measurements; Ninokata, H., Wada, A., Tanaka, N., Eds.; World Scientific: Singapore, 2001; pp. 63–70. [Google Scholar] [CrossRef]
- Onda, S.; Hosoda, T.; Kimura, I. Depth averaged model considering transformation of downstream velocity in curved channel in generalized curvilinear coordinate system and its verification. Proc. Hydraul. Eng. JSCE 2006, 50, 769–774. [Google Scholar] [CrossRef][Green Version]
- Kimura, I.; Onda, S.; Hosoda, T.; Shimizu, Y. Computations of suspended sediment transport in a shallow side-cavity using depth-averaged 2D models with effects of secondary currents. J Hydro Environ. Res. 2010, 4, 153–161. [Google Scholar] [CrossRef]
- Yang, F.; Kimura, I.; Shimizu, Y.; Fu, X. Computations of open channel flows in a shallow sharp bend using depth-averaged 2D models with secondary flow effects. J. Jpn. Soc. Civ. Eng. Ser. A2 (Appl. Mech. (AM)) 2016, 72, I_505–I_513. [Google Scholar] [CrossRef]
- Bernard, R.S.; Schneider, M.L. Depth-Averaged Numerical Modeling for Curved Channels; Army Engineer Waterways Experiment Station Vicksburg Ms Hydraulics Lab: Vicksburg, MS, USA, 1992. [Google Scholar]
- Uchida, T.; Fukuoka, S. Numerical calculation for bed variation in compound-meandering channel using depth integrated model without assumption of shallow water flow. Adv. Water Resour. 2014, 72, 45–56. [Google Scholar] [CrossRef]
- Staniforth, A.; Côté, J. Semi-Lagrangian integration schemes for atmospheric models-a review. Mon. Weather Rev. 1991, 119, 2206–2223. [Google Scholar] [CrossRef]
- Ewing, R.E.; Wang, H. A summary of numerical methods for time-dependent advection-dominated partial differential equations. J. Comput. Appl. Math. 2001, 128, 423–445. [Google Scholar] [CrossRef]
- Jang, C.L.; Shimizu, Y. Numerical simulation of relatively wide, shallow channels with erodible banks. J. Hydraul. Eng. 2005, 131, 565–575. [Google Scholar] [CrossRef]
- Yang, F.; Fu, X. Eulerian-Lagrangian method based on streamline. In Proceedings of the 2013 IAHR World Congress, Chengdu, China, 8–13 September 2013. [Google Scholar]
- Zhang, Y.; Baptista, A.M.; Myers, E.P. A cross-scale model for 3D baroclinic circulation in estuary–plume–shelf systems I. Formulation and skill assessment. Cont. Shelf Res. 2004, 24, 2187–2214. [Google Scholar] [CrossRef]
- Blanckaert, K. Flow and Turbulence in Sharp Open-Channel Bends. Ph.D. Thesis, École Polytechnique Fédérale de Lausanne, Lausanne, Switzerland, 2002. [Google Scholar]
- van Balen, W.; Blanckaert, K.; Uijttewaal, W.S.J. Analysis of the role of turbulence in curved open-channel flow at different water depths by means of experiments, LES and RANS. J. Turbul. 2010, 11, N12. [Google Scholar] [CrossRef]
- Zeng, J.; Constantinescu, G.; Blanckaert, K.; Weber, L. Flow and bathymetry in sharp open-channel bends: Experiments and predictions. Water Resour. Res. 2008, 44, W09401. [Google Scholar] [CrossRef]
- Van Balen, W.; Uijttewaal, W.S.J.; Blanckaert, K. Large-eddy simulation of a mildly curved open-channel flow. J. Fluid Mech. 2009, 630, 413–442. [Google Scholar] [CrossRef]
Publisher’s Note: MDPI stays neutral with regard to jurisdictional claims in published maps and institutional affiliations. |
© 2021 by the authors. Licensee MDPI, Basel, Switzerland. This article is an open access article distributed under the terms and conditions of the Creative Commons Attribution (CC BY) license (https://creativecommons.org/licenses/by/4.0/).