Drought is a natural phenomenon which has a serious impact due to varying precipitation duration, intensity, and distribution [
1]. Drought is driven by rainfall deficit, which consists of the typical categories of meteorological drought, hydrological drought, socioeconomic drought, and agricultural drought [
2]. Drought characteristics comprise of frequency, duration, intensity, and severity. Drought duration is the time in which the value of drought index is less than the standard value, which has been selected by an analyst. While drought severity is the soil moisture deficiency of the drought below, the given threshold value of drought, and drought intensity is the fraction of drought severity to the drought duration [
3]. Moreover, annual average drought frequency can also be calculated by using the total number of drought events identified during drought period divided by the total duration of the drought period. Similarly, inter arrival or drought initiation time is an important characteristic that is defined as the period between initiation of one drought or starting month of precipitation and soil moisture deficit period [
4]. Drought characteristics have been studied comprehensively and the inter arrival period of the agricultural droughts is inspected by using the statistical modeling approaches of the monthly PDSI data [
5]. Similarly, Standardized Precipitation Index and Reconnaissance Drought Index were applied by using the monthly meteorological data for the assessment of drought intensity in Cyprus [
6] and a similar study was conducted in Malta [
7]. In the study by [
8], the authors examined the hydrological drought identification by using a truncation level to identify the dry and wet periods in the historical river flow data. Similarly, ref. [
9] examined the frequency and drought intensity of low flows. Stream Flow Drought Index and Standardized Runoff Index were used for the characterizing of hydrological drought. Stream Flow Drought Index is based on the cumulative volumes of stream flow, which was presented by [
10] and used in two river basins in Greece. Simulated runoff data from the Variable Infiltration Capacity hydrological model was used by [
11] to get the results of the Standardized Runoff Index instead of observed stream flow data. Moreover, new drought index which is called Regional Drought Area Index (RDSI) was developed for the better identification of severe drought events and weather types. Regional Drought Area Index (RDSI) is based on the daily stream flow and was proposed to characterize the drought affected area in northern-western Europe [
12,
13]. Considering the changes in precipitation and the increasing global temperature leads to climate change, variations may occur in the frequency of extreme events such as drought hazards [
14]. Moreover, dependency on only one climatic variable (e.g., precipitation or temperature), which does not give complete information on drought events and absence of evapotranspiration, reduces its effectiveness [
15]. Therefore, the drought index should be able to quantitatively characterize the severity of drought by assimilating the data of several factors, such as precipitation and evapotranspiration into a single numerical digit [
16]. Many studies have showed that a single drought index might not illustrate the true descriptions of drought anomalies and, therefore, a multi drought index approach should be used for the comprehensive assessment of drought events [
17]. Drought indices are the main methods for observing drought anomalies based on meteorological or hydrological variables. A large number of drought indices have been introduced for characterizing various aspects of drought anomalies across space and time, which include the Palmer Drought Severity Index and Standardized Precipitation Index. The Standardized Precipitation Index is used for detecting meteorological drought. The derivation of the Standardized Precipitation Index applies to a number of drought indices; for example, the Standardized Precipitation Evapotranspiration Index [
18]. Similarly, one more drought index called Reconnaissance Drought Index was introduced by [
19] and showed that the evaluation of drought events by using meteorological drought indices leads to accurate assessment if there is accurate balance between input and output and this cannot be attained by the drought indices like Standardized Precipitation Index without any output estimation. Additionally, the SPI does not demonstrate the true picture of atmospheric conditions, except precipitation. Furthermore, the Standardized Precipitation Index has many limitations, for example, lack of consideration of potential evapotranspiration (PET), runoff, and infiltration. Therefore, there is a crucial need of a drought index that also considers the other climatic variables such as temperature and evapotranspiration. Moreover, researchers recommended that for studying drought monitoring and food security, it is much better to use SPI with other drought indices. Multiple drought indices have been used in a compound framework by many researchers worldwide [
20].
Drought is the phenomenon, which is greatly occurring due to climate variations. Present and future information about variations in climate at the local, regional, and global scale is essential to develop national and international level mitigation approaches for natural disasters (e.g., drought) [
21,
22]. Due to the advancement in modeling and significance of the climate system, the general circulation models have become an important tool for the climate change processes [
23]. General circulation models (GCMs) can simulate the present climate change and project future climate changes under different scenarios driven by different radiative forces. The World Climate Research Program (WCRP) developed the Coupled Model Inter-Comparison Project, which provides the simulated data by using various climate models. The project significance is that, it can provide the opportunity for the comparison of multi model ensemble strategy development [
24]. Generally, the output of the multi model ensemble is found to be much better than the single model simulation. The possible explanation is that the multi model has distinctly different parameterizations as compared to the single model simulations [
25]. Therefore, the multi model ensemble can produce more reliable predicted data [
26]. Moreover, the fifth experiment (CMIP5) of the Coupled Model Inter-Comparison Project used for the IPPCC fifth assessment report is available. Extensive effort has been made in the development of CMIP5, including a large number of models running with fine resolution with representative concentration pathways of external forcing, more scenarios, and more saved diagnostics as compared to the previous CMIP experiment [
27].
The multi model ensemble is a very beneficial approach for the future climate change assessment of China. China is an agricultural country with a distinct climate, which varies over space and time due to the topographical gradient [
28]. China is also facing agriculture and water resources problem due to climate change of the 21st century [
29]. Agriculture plays a key role to fulfill the need of food of 1.3 billion people. The climate in China shows that distribution of water resources is uneven, rich in south while drier in the north of the country. Many regions situated in the transitional zones of the country have water resources that could be significantly affected due climatic variations. China is already facing some hazardous climate extreme events. For example, the 1998 floods drowned 21 × 10
6 ha of land and damaged 5 million homes in the Yangtze basin, which caused a total USD 20 billion economic loss [
30]. Heavy rainfall phenomena caused flood events and shows a spatial heterogeneity [
31]. These events (heavy rainfall) become more common in the northwestern part of China while less frequent in the northeast part of China. Drought is one of the extreme indicators of climate variability in China. Droughts are hazardous for agriculture and human life because most of the region already has a quite dry condition [
32]. The country already suffered severe droughts during the 1960s, 1970s, and 1990s due to the climate variability [
33]. Moreover, the northeast part of the country recently suffered a severe drought [
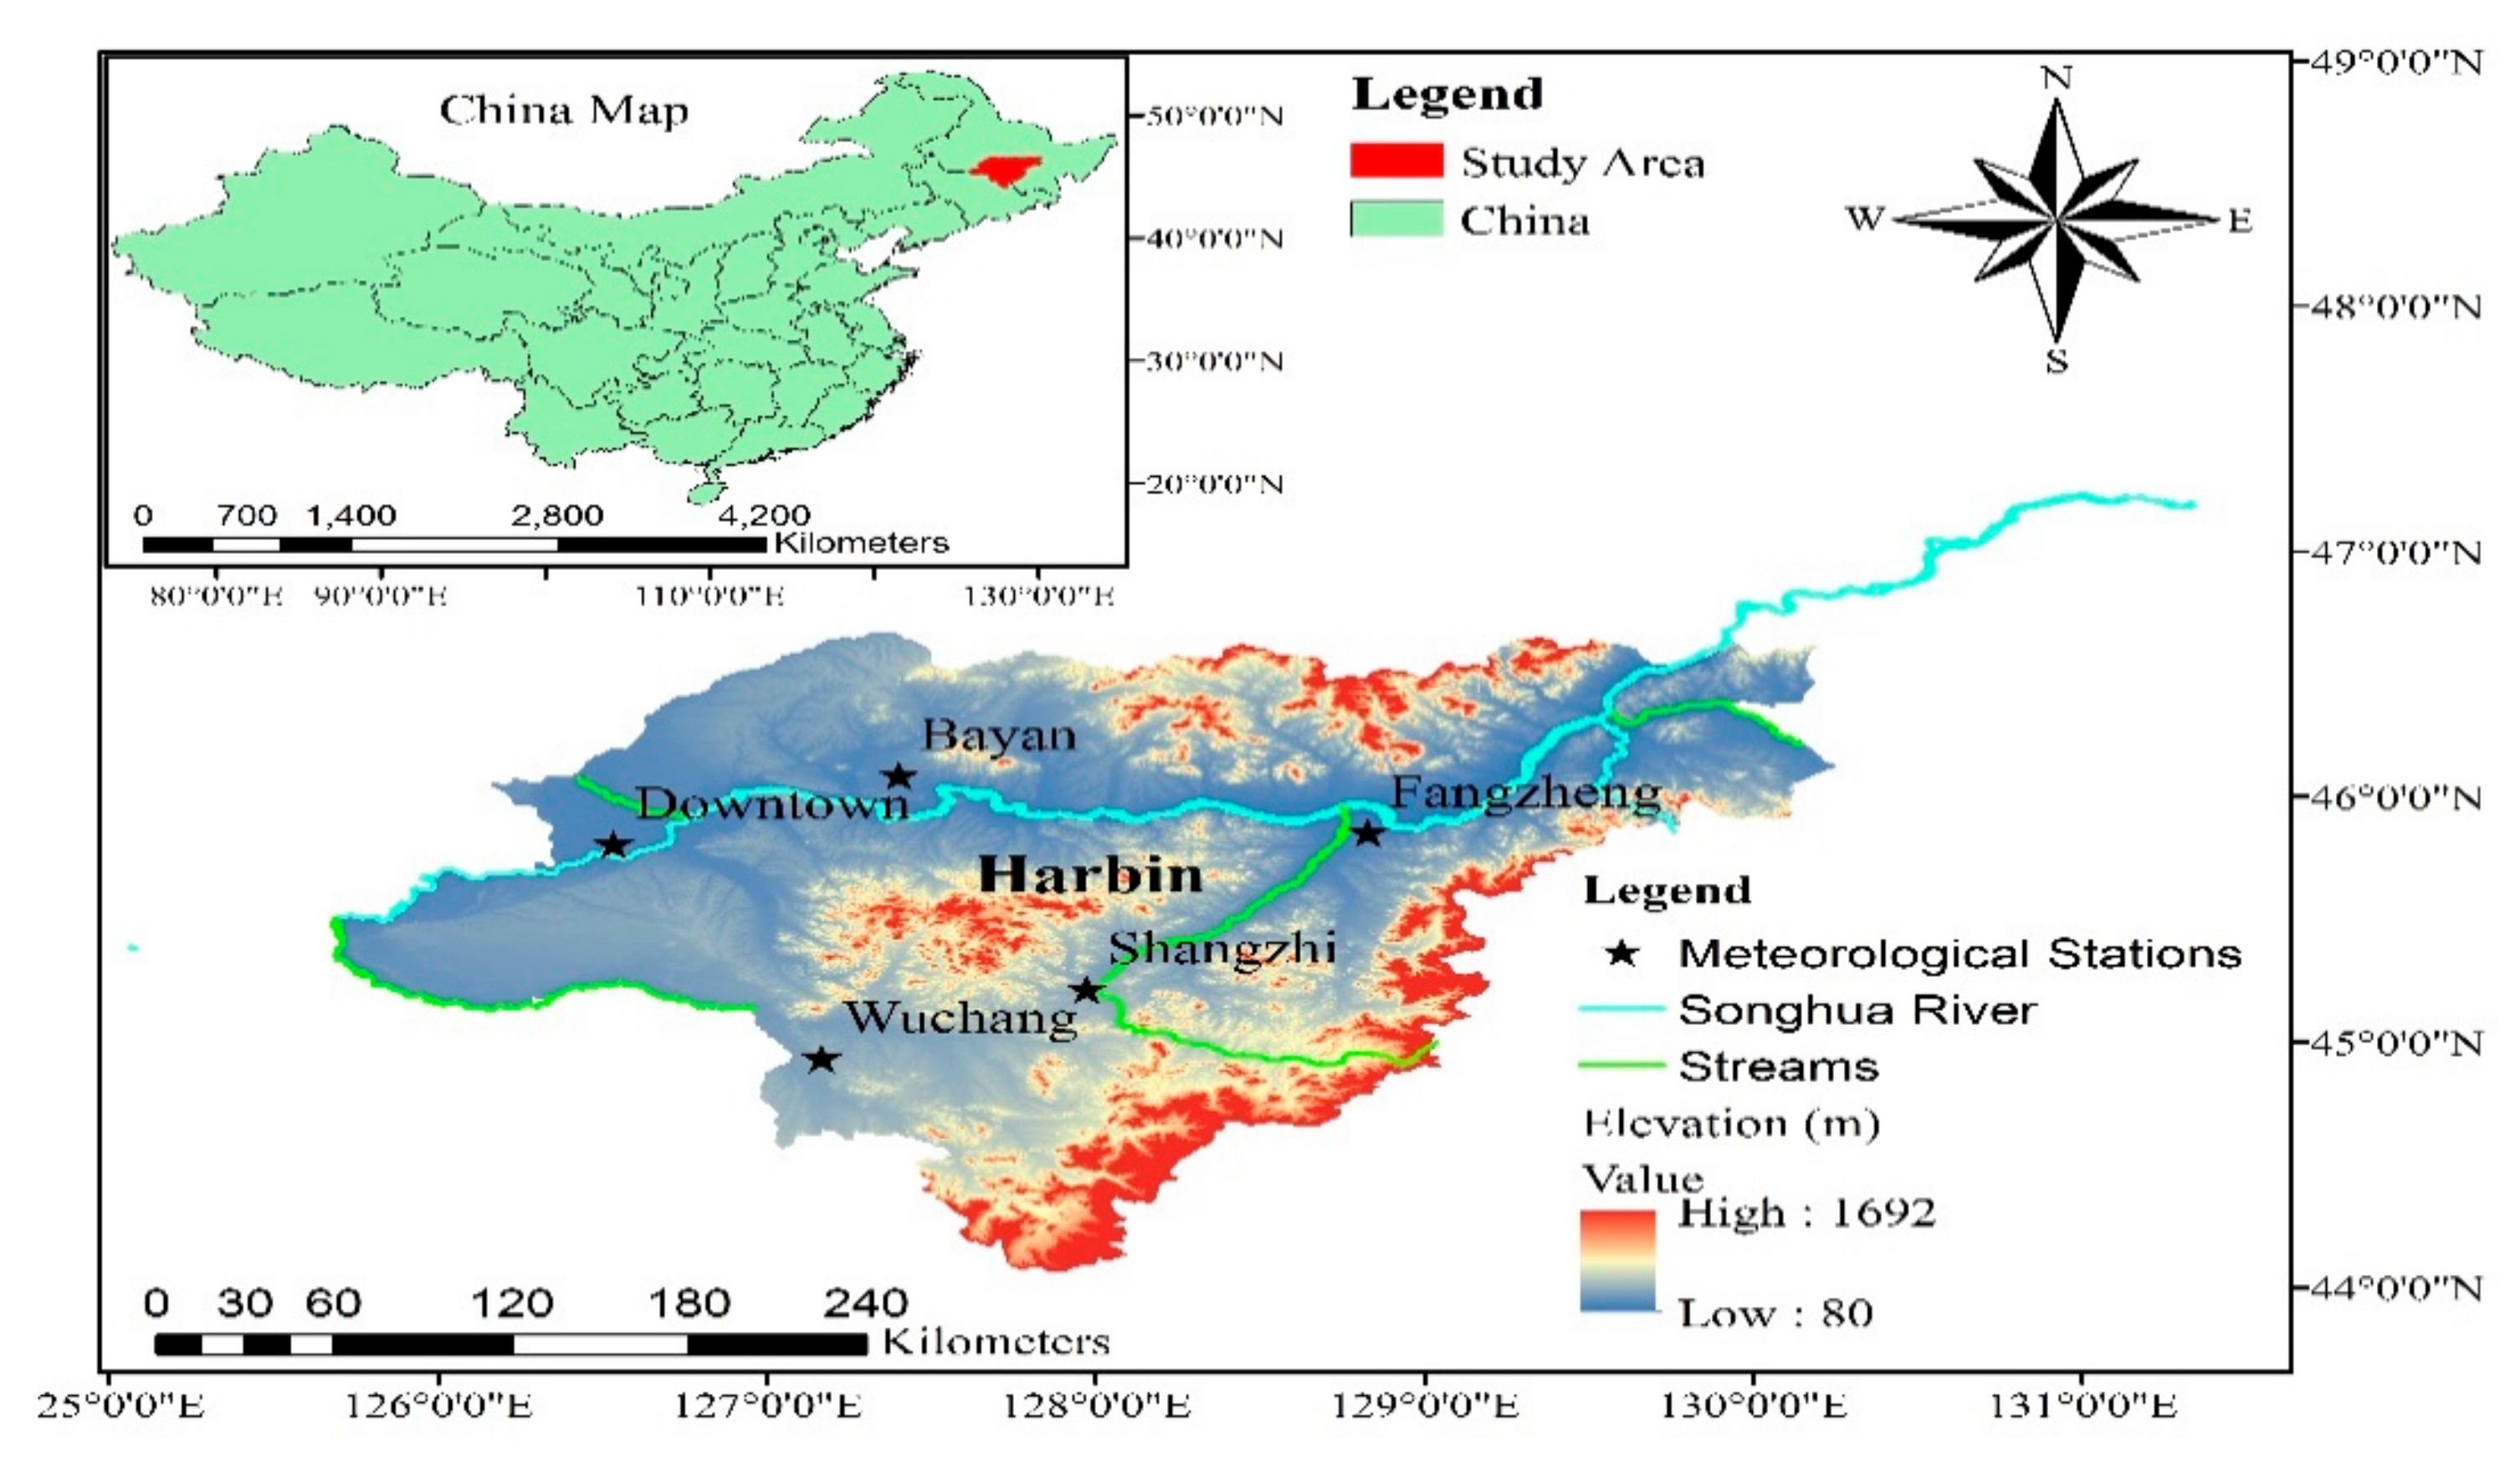
34]. Therefore, the objective of this research is to assess the projected drought events characteristics by using the statistical downscaled data of precipitation and temperature of CMIP5 GCMs under various representative concentration pathways. Moreover, future drought duration, severity, and intensity are identified for future water resources management of the region.


