Article

A Zero-Order Flood Damage Model for Regional-Scale Quick Assessments

1
Civil and Environmental Engineering Department, Politecnico di Milano, Piazza Leonardo da Vinci, 32, 20133 Milano, Italy
2
Fondazione Politecnico di Milano, Piazza Leonardo da Vinci, 32, 20133 Milano, Italy
*
Author to whom correspondence should be addressed.
Water 2021, 13(9), 1292; https://doi.org/10.3390/w13091292
Submission received: 22 March 2021 / Revised: 21 April 2021 / Accepted: 30 April 2021 / Published: 4 May 2021
(This article belongs to the Special Issue New Paradigms in Flood Hazard and Risk Management)

Abstract

:
Quantitative data on observed flood ground effects are precious information to assess current risk levels and to improve our capability to forecast future flood damage, with the final aim of defining effective prevention policies and checking their success. This paper presents the first collection and analysis of flood damage claims produced in Italy in the past 7 years since a homogeneous national procedure for damage recognition became available. The database currently contains more than 70,000 claims referring to significant events and shows good homogeneity on the intensity of the related phenomena. We then propose an empirical model, based on observed data, to allow for a quick estimation of direct damage to private assets (i.e., residential buildings), based only on the knowledge of the perimeter of the flooded area. Single model calibration was performed at the multi-regional scale, focused on southern Italy. Model validation shows encouraging performances, considering the considerable natural uncertainty that characterizes this type of estimate. The procedure is of great interest when there is a need to evaluate, however roughly, flood damage in the immediacy of the event to assess the extent of the flood effects and to plan support actions for the affected communities.

1. Introduction

Lack of high-quality and reliable flood damage data is recognized as a critical issue in the scientific community [1,2], limiting our capability of understanding damage mechanisms and forecasting expected damage in case of flood [3]. The problem is further exacerbated by the lack of information on damage explicatory variables, both hazard and vulnerability related [4]. The level of aggregation of available damage data is another critical issue, limiting their full exploitation for modeling needs [5].
In recent decades, however, many European countries started to face the problem of damage data collection and storage, partly because of the need to respond to European and international risk reduction programs (e.g., Floods Directive, European Solidarity Fund, Hyogo Framework for action), and partly to establish a more sound knowledge base for damage compensation, which is especially critical in a time of economic crisis, both at the public and private level [4]. However, we are far from reaching the desired levels of completeness, granularity, and reliability identified by the European Commission to guarantee the multi-usability of collected data [6,7,8]. Examples of damage data collection can be found from the insurance market, such as in France or the Netherlands [9,10], from voluntary surveys, such as in Germany [11], or the collection of volunteered geographic information [12].
In Italy, the situation is particularly critical [13,14]. The disaster insurance market is still not relevant, especially concerning damage to real estate, and this does not drive private owners to make a report of damages [15].
Indeed, up to recent years, damage data have been collected just by local authorities in the aftermath of disastrous events to ask for national compensation, but without any standardized and univocal procedures [16]. This resulted in a considerable amount of useless damage data, incomparable between different events, and aggregated at various levels, corresponding once to the municipal and once to the provincial level [6]. The analysis of observed damage data is further complicated by the lack of any national repository and by the difficulty in accessing data, since they are maintained by municipalities or, in some cases, by regions, which usually do not share them and often present file data in paper forms.
In 2013, a standardization of the procedure to collect damage data was introduced at the national level by the Italian Parliament. This procedure overcame the above-cited limitations, at least regarding the consistency of data, their availability, and some explicative variables; since, after every event, data are now collected through standard forms to be filled with specific information on damage indicators. This paper shows the potentiality of data collected after 2013 by analyzing a representative subset of about 70,000 punctual data gathered during this research. In particular, we show two applications:
  • The definition of the national picture of flood damage in the past decade with a spatial resolution at the municipality level;
  • The derivation of an empirical damage model for a quick preliminary estimation of the expected damage in case of flood, grounded on the simple knowledge of the affected area.
The latter was possible by complementing damage information with exposure data available for the whole national territory. We then supply a critical discussion of obtained results.

2. Materials and Methods

This work aims to create a complete collection of damage data observed over all the Italian territory due to extreme floods since a new law established a national procedure for flood damage assessment. This section shows the procedure of damage recognition that is carried out immediately after the floods and the set of available data for our research. We then propose a national map of flood damage to give an overview of past flood impacts.
At the end of this section, we show a novel empirical model to allow for a quick estimation of direct damage to residential buildings. The model is presented as a synergic alternative to already validated models because it estimates damages by knowing the perimeter of the flooded area, while existing models usually require more detailed information about the events and the affected surfaces.
Figure 1 describes the flowchart of the research work presented in this paper. At first, damage data have been collected and stored in a dedicated database. A map of flood damage at the national level has been then produced after homogenizing data provided in different forms and aggregating them on the municipal level. The following step was the choice of a complete subset of data to derive the empirical model. The subset was chosen to represent the whole damage in a specific area to avoid estimation biases due to missing data.
The following sections describe the different steps of the research in detail after a critical introduction on the background of data collection in the Italian context.

2.1. Background

Up to 2013, in Italy (as in many countries around the world), there was no national standard procedure for flood damage recognition: damage data were collected just by local authorities in the aftermath of events to ask for national compensation but without specific methodology or deep analyses.
According to Italian law, the Government is not explicitly required to compensate for the damage suffered by citizens in case of natural disasters such as landslides, earthquakes, or floods. However, the Constitution says that “The Republic recognizes and guarantees the inviolable rights of man […] and requires the fulfillment of the mandatory duties of political, economic, and social solidarity”. There is, therefore, a general and fundamental principle of solidarity. The national community is called upon to support fellow citizens affected by natural disasters, and this is what happened in the past, although without a standardized procedure. According to the Italian Constitution, it is the Parliament that is called to address the task of supporting affected communities after major disasters, with the enactment of a specific law in the State budget. For this reason, Law Decree 93 issued on 14 August 2013 regulates post-emergency management by defining specific tasks and steps to be performed after significant events: in particular, this law deals with natural disasters which, due to their intensity and extent, must be immediately faced with extraordinary resources during a specific period [17]. Governors of the involved regions ask the national Government for the declaration of a state of emergency, which is then approved by the Italian Council of Ministers.
According to Law Decree 93, the post-emergency is managed by a government Deputy Commissioner, with special funds and using specific measures, which depend on the affected area and the impacts generated by the event. After safety conditions in the impacted area are resumed by recovering essential services, the Commissioner estimates damages that occurred to public services (including infrastructures), private properties, and industrial and commercial activities. Since we are dealing with the enactment of a law that requires a change to the whole State current budget, it is essential that the estimated amount is as close as possible to the suffered damage and that this estimate is made as soon as possible in the very first days of the emergency. The activity of damage recognition includes the collection of damage suffered by firms and citizens basing on the invoices presented for the costs actually paid to recover damage; damage to infrastructures and public services follows another path of restoration instead. The resulting damage picture is necessarily subjective. However, the collection of the refund claims gives a powerful overall indicator of the ground effects of the event.
After the damage recognition has been completed, all recordings are collected by regional authorities that communicate to the Government to estimate the total amount necessary for damage restoration. Once the compensation is carried out, modules are filed in regional archives: there does not exist a common national database to collect such data, neither it is always easy to access them for research purposes.

2.2. Data Collection and Availability

A list of extreme hydro-meteorological events that occurred all over the Italian territory is reported on the website of the National Civil Protection authority with primary information about their intensity and effects [17]. Moreover, an institutional site of the Government is available, reporting a specific summary of damages along with the current flood hazard at the national scale [18]. According to these sources, from May 2013, up to November 2020, 103 states of emergency have been issued, requiring the intervention of a Deputy Commissioner. Almost all of them refer to hydro-meteorological events over a single region (the average area of an Italian region is around 15,000 km2). At the same time, two of those emergencies affected more than one region, according to the major expansion and effects of the meteorological event. As a general overview, 1.5 billion euros have been invested by the Government in the past 7 years to recover secure conditions after the occurrence of an event, and more than 8.8 billion euros have been budgeted to restore damage.
The Emilia–Romagna region (central-northern Italy), is the worst affected one; it has been involved 14 times in extreme events like floods and hydrogeological instability, while Sicilia and Toscana (southern and central Italy respectively), tied second in the ranking, have been hit nine times each. In the same latest 7 years, more than 160 million euros have been spent for immediate rescue and recovery during the most acute phase of emergency in Emilia–Romagna, and 1 billion to cover damages in the region. In Campania (southern Italy), more than 1.001 billion euros have been invested in recovering from damage generated by the extreme flood that occurred in 2015. In the northeast part of Italy, Trentino Alto Adige is the only region where no emergency has been declared.
Of these 103 states of emergency, unfortunately, only a subset presents damage recognition, and the total economic loss recorded after each event is available on the Civil Protection website: among them, 65 states of emergency report the recognition of public goods, 68 of private goods, and 67 of productive activities. To date, our research group has been allowed to access and use only a part of these data (Figure 2), which has been collected during this work in terms of single damage claims: these are data relating to 31 states of emergency for public goods (47.0%), 46 for private goods (67.6%), and 44 as regards productive activities (65.6%). The available dataset is quite significant and allowed us to realize some elaborations. We did not consider Valle d’Aosta and Friuli Venezia Giulia (in the north) and Molise (in the south) during this work, as far as goods recognition is not available on the Civil Protection website.
In Table 1 the amounts of damage due to floods and reported by Deputy Commissioners are described for the period from September 2013 to December 2020. Data are subdivided into damage to public assets, private assets, and productive activities. We can see that the total amount is close to 9 billion euros, which means 1221.1 billion per year.
It is worth observing that around 75% of that amount concerns damage to public goods such as infrastructures, public buildings, services, etc. The remainder is more or less equally divided between private goods and productive activities with just over one billion euros. It must be emphasized that these estimates are based on a single procedure valid for the entire country, relating to events that required the activation of the national state of emergency. Therefore, it is a substantially homogeneous dataset, both in the method of data collection and in the degree of intensity of the observed phenomena.

2.3. Data Elaboration: Objectives and Models

The first aim of this work was to create a complete collection of damage data due to extreme hydro-meteorological events in Italy through the collection of every available single damage refund claim stored in regional archives. According to it, we propose a national map of flood damage, normalized to the area of the municipality (municipalities number about 8000 in Italy, with an average surface of 37.5 km2) and to the period considered in this paper (around 7 years), to give an overview of past flood impacts, as a support to future decisions on risk mitigation strategies.
An empirical model is then proposed to allow for a quick estimation of direct damage to private assets (i.e., residential buildings). The idea is to calibrate a model which does not require much information to calculate a first, “at a glance” economic estimation of direct damage to residential buildings; it can be applied by competent authorities in the immediate post-event, with minimum information content to be found even in difficult emergency conditions. Indeed, most of the available damage models require the knowledge of hazard (i.e., the water depth at the minimum but also, e.g., water velocity, flood duration) and exposure/vulnerability parameters (such as the size of assets, the building typology, materials, etc.). These data are not easily or quickly quantified after an event, especially at the scale at which models work, i.e., the individual building level or some spatial aggregation of them. This allows for their application only when the recognition is over, and all risk data have been collected (which may require months). The proposed model, instead, offers a complementary, “integral” or “macro-scale” approach aiming at estimating the expected damage in the whole flooded area, by knowing only its perimeter. It is worth noting that, although in the paper we propose a model specifically referring to residential buildings, the same approach can be extended to the estimation of damage to economic activities, and this will be the subject of future research work.
Damage to residential buildings can be expressed as a function of hazard, exposure, and vulnerability parameters according to the following function:
D = E d H i , V j
where D is the total economic damage [€] to the exposed item (be it an individual building or a certain aggregation of buildings, according to the scale of the implementation of the model), E is a measure of the exposed value, i.e., the surface of flooded building(s) [m2], and d is the unitary damage (i.e., the damage per exposure unit in € m−2) which may depend on i hazard (H) and j vulnerability (V) parameters, according to the complexity of the model. For example, the simplest models consider water depth as the only explanatory damage variable [19,20,21]. Multi-variable models, in contrast, consider other factors as significant in damage estimation. Regarding the hazard, more common implemented parameters are flow velocity, duration, contamination, or some indicators of flood intensity such as the energy head [16]. Concerning vulnerability, implemented parameters are varied and strongly related to the context in which the model has been derived: they may be related to the building typology, the building materials, its level of maintenance, the implementation of precautionary measures, and so on [3,22,23].
Unitary damage functions can be empirically [24,25] or synthetically evaluated [3,23], and in their simplest form, they often appear as:
d = d h = k h a
where h is the water depth [m], k is a constant, and a is a dimensionless real exponent.
The method proposed in this paper is based upon the following assumptions. It applies at the whole event spatial scale, which, in the morphological environment of Italian floodplains, ranges between a few thousand square meters, up to around 30 km2 for high-intensity events (like the catastrophic flood that occurred in Lentini, Sicilia, on 4 November 2018 with 12 fatalities). Then, the approach considers an equation similar to that of Equation (1), where damage is proportional to a characteristic surface of flooded buildings Fa but, in our case, is independent of the floodwater level and any other local parameters. This means setting to zero the exponent a in the power law of Equation (2). For this reason, the method can be considered as “zero-order”. In particular, the damage is evaluated in this form:
D = s F a m
where s denotes the damage (€) corresponding to a characteristic unitary surface, and m is the exponent of the power-law (-).
In the model, the characteristic flooded surface Fa is estimated starting from the overall perimeter of the area affected by the flood, S0. This is done using census data about residential buildings from the national statistical geodatabase, which are available for the whole territory [26]. S0 can be calculated instead by satellite images [27,28] and/or aerial surveys by manned or unmanned platforms [29], which are relatively easy to obtain immediately post-event.
This research has been carried out within a European project on geohydrological risks in southern Italy [30]. This area has been deeply analyzed, making us reasonably confident that data and information provided by the local governments are complete and supply a reliable image of events that have occurred in the area as well as related impacts. For this reason, to avoid bias in damage estimation due to missing data, the model has been developed by considering emergency states that occurred in five southern regions (Campania, Basilicata, Puglia, Calabria, and Sicily) in the period mentioned above from 2013 to 2020. They consist of 13 emergencies that hit 207 municipalities with a total of 4104 claims to residential buildings, corresponding to an amount of 129 million euros. The territory involved in the analysis has an area of 83,735 km2 (28% of the whole country) with a population of 17,300,863 inhabitants (30% of the Italian total). As reported in Figure 3, flooded areas have been mapped all over this territory as the mashup of information coming from different sources (Fondazione Politecnico di Milano, Basin Authorities, Copernicus Emergency management service [28]), and they cover around 1230 km2 (5.6% of the total plain surface of southern Italy).
The dataset has been cleaned of those data that appeared not statistically significant, such as those from municipalities with just one or two claims and obvious typos and transcription errors: we are speaking of data in paper forms, consisting of many dozen fields and complicated to fill in without the assistance of a professional. Most of the forms were filled in directly by hand by citizens and then summarized and forwarded by the offices. Moreover, part of the complete dataset was composed of claims linked to damage due to different events, such as intense snowing or debris flow: just the states of emergency due to flood are included in the final dataset. After such cleaning, as shown in Table 2, 149 municipalities involved in 8 emergencies have been considered to set up the model: the new dataset is composed of 3729 individual claims collected after the events among citizens of the involved municipalities. They have been divided through a pseudo-random selection to generate two well-distinguished databases, trying not to split claims of each municipality between the two datasets. Calibration has been performed on the 60% of the 149 municipalities involved (88 municipalities), and then validation has been applied on the lasting 40% dataset (61 municipalities).
The first step of calibration consisted of aggregating damage data at the municipal level. Then, the characteristic flooded area Fa, related to each aggregated total of damage, was evaluated as the estimated footprint of flooded residential buildings in the municipality: we considered the fact that usually, one floor gets flooded. The average footprint surface in each municipality has been calculated, obtained from the national statistical database [26], and it is given by the product of the number of claims and the average surface of residential buildings:
F a = N d M f s
where Nd (-) is the number of damage claims, and Mfs is the average floor surface of residential buildings (m2). Mfs is evaluated in the following form:
M f s = S r N f
as the ratio between the total walkable area of residential buildings Sr (m2) and the total number of floors Nf (-) in the municipality, supplied by the national statistical geodatabase. In detail, Nf has been calculated by the weighted sum of the number of buildings with one or more floors Ri (-), in the municipality, with i indicating the number of floors:
N f = i = 1 N i R i
According to these equations, it has been assumed that each claim is related to just one single flooded floor. This type of approximation of the flooded surface has been done by considering the distribution of different building typologies in each municipality to estimate the average footprint.

3. Results

3.1. Map of Observed Damage

As we previously said, not all national damage data have been made available for this research, as some are still being validated or have not yet been communicated in detail by the Deputy Commissioners. However, almost 80% of the data is available at the highest detail level, relating to 46 different states of emergency spread over the entire national territory; the complete dataset used for this analysis is shown in Table 3.
Based on these data, we generated an unedited map of observed damage (Figure 4). Damage figures reported in the latest 7 years have been summed up in each municipality and normalized to the total surface of the municipality: the result has been divided by the time-series length in years (i.e., 7 years) to get the average damage per year per square kilometer. The evaluation has been done for public and private properties (i.e., residential buildings) and productive activities, while finally, damages have been added to get the total damage per year per square kilometer. Despite data limitations, the map gives an interesting picture of the distribution of observed damage at the national scale.

3.2. Zero-Order Flood Damage Model

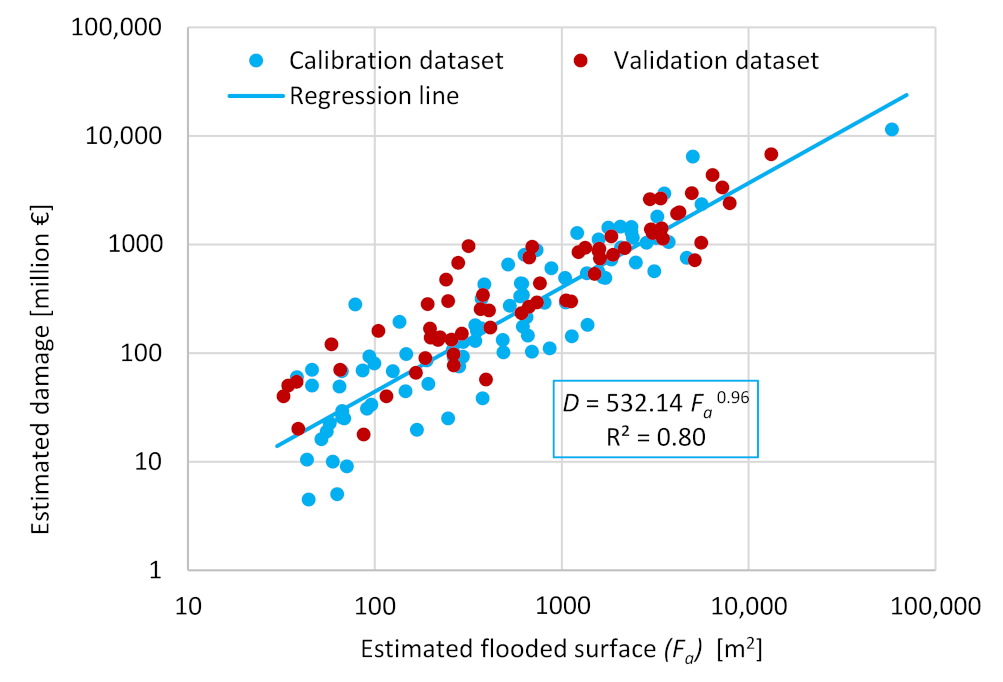
Figure 5 depicts the flood damage model empirically derived by the available dataset. The model holds in the form:
D = s F a m
where parameters obtained through the calibration are:
s = 532.14
which denotes the damage (€) corresponding to a characteristic unitary surface, and
m = 0.96 .  
that is the exponent of the power-law (-), quite close to 1.
The damage model derived and shown in Figure 5, beyond the strict regression, brings specific information about the event and the assets damaged by floods affecting a specific area. On the one side, the flooded area on the x-axis is a proxy of the intensity of the events (i.e., the hazard) considered in the calibration phase, while on the other side, the economic damage reported on the y-axis is an indication of the vulnerability of the flooded municipalities. The correlation appears relatively strong (correlation coefficient R 2 = 0.80 ), considering how subjective the non-professional damage estimation could be and that we are mashing up data coming from contexts very different in terms of morphology, hydrology, vulnerability, and exposition. It is also worth noting the “quasi-linear” character of the relationship between damage and flooded surface, being the exponent of the interpolating power law quite close to 1 m = 0.96 .
The availability in the data of the actually damaged surfaces, reported by citizens in the claim forms, allowed an interesting comparison between the characteristic surfaces Fa (automatically evaluated by data supplied by the national statistical geodatabase) and those declared in the claims. Figure 6 reports the comparison where data are aggregated by the municipality (whose average size is 60 km2). We observe again a relatively good agreement (correlation coefficient R 2 = 0.84 ) but a general underestimation inherent in the model. This fact is physiological in the method, and it is because most citizens indicated only the actual flooded surface and not the real building footprint: in some claims, they reported a surface that also included private courtyards, pertinence, or more than one floor, without this being indicated on forms. Of course, this does not affect the method’s accuracy but gives us further information about the statistical distribution of average residential surface involved in floods in different municipalities.
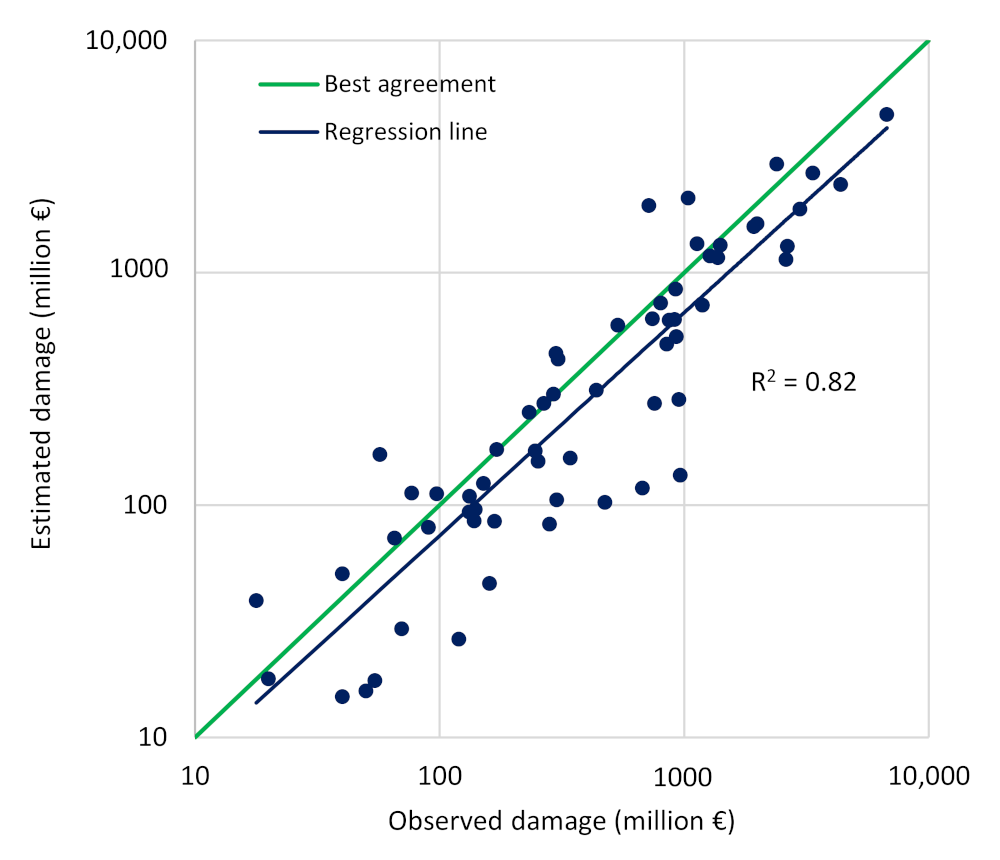
Figure 7 shows the results of the validation process. Estimated vs. observed values are shown in the graph together with the perfect fit line. The correlation coefficient is R 2 = 0.82 in agreement with the value achieved in the calibration set.
An error distribution analysis has also been performed on the validation dataset (Figure 8). More than 65% of the dataset stands in the range between ±50% relative error, and more than 90% of data stands between ±100%. It is worth underlining that we are speaking about immediate after-event damage estimation where the only assessment of the order of magnitude can be considered a good result in itself. Model performances, from this point of view, can be considered quite encouraging.

4. Discussion

By reading data in Table 3 and Figure 4, one can obtain a general overview of a European industrial country, Italy, concerning the damage that occurred due to flood disasters in recent years. However, it is helpful to remember that:
  • Damage figures and models do not consider damage due to high-frequency events i.e., floods from smaller streams, due to sewerage system crisis and, more generally, all minor events which do not require the intervention of a Deputy Commissioner but do have, however, a strong influence on damage generation; the model is indeed focused on floods, while as far as hydrogeological instability is concerned, other types of hypotheses and models should be further provided;
  • The dataset covers nearly 80% of the overall claims;
  • Compensation requests for public assets are often taken as an opportunity to carry out works that are often postponed by public bodies for lack of funding, such as the seismic adaptation of structures, energy optimization, improvement of electrical and plumbing systems, and so on. This may lead to an overestimation of damage to public items.
Figure 4 in particular, shows that the whole nation has been involved in extreme hydrogeologic events which generated significant damages in the past 7 years. Floods have strongly damaged the northern and central part of Italy, and a lot of municipalities recorded 10,000 € per year per square kilometer of total damages. Municipalities where the highest economic loss has been recorded are the Liguria and Sardinia regions. In Liguria (northwest) eight extraordinary events have been recorded in the latest 7 years, but our dataset, and maps in Figure 4, consider only the damages caused by four of them. The territory of this region is very deeply at risk according to the morphology of the area and the intensive urbanization on the hillside, leading to frequent hydrogeological instability. The involved population has requested more than 1 billion euros for damage restoration just between 2014 and 2016. Sardinia, in contrast, is an island very exposed to hydrogeological risk due to frequent adverse meteorological conditions: the most vulnerable areas are on the coasts, on the rivers flowing between urban areas, and on the slopes, where there is a very high probability of landslides occurring. This analysis has considered only the reported damage about the extreme meteorological event that hit the whole region in November 2013, which generated damage of a total amount of around 550 million euros, which seems to have produced more damage at once than all the other cases represented in the maps.
As already said, the model proposed in this paper shows a brand new approach to damage estimation in Italy. Available methods often consider damage as the result of a synthetic analysis, estimated through the combination of different risk components [3,31]. Moreover, they are usually site-specific, calibrated on local data, and according to peculiarities in terms of vulnerability and exposure, so with a low possibility to be transferred to different regions [32]. Additionally, models calibrated over single Italian regions are impossible to apply to other areas and contexts that can differ from the calibration area in terms of morphology and urban pattern, two of the main factors that can influence damage formation and spatial distribution [19,20]. This work aims to overcome those limits and to propose a different, but synergic, methodology to be applied without those limitations by considering the flooded perimeter as the unique indicator of the intensity of the events. Moreover, this model is derived empirically from the available dataset but can be further improved by considering a larger area and more data. It is worth underlining that the model is focused on the area where data and information are complete and unbiased, so it is not influenced by the lack of data observed in other regions.
As far as this dataset is not complete and homogeneous over the whole national territory, our study represents a first attempt to develop a damage map and a model based on data connected to the amount of money necessary to recover from the events. As explained so far, this kind of data has been collected independently from the research purposes but has shown excellent potential for further analyses and developments. The approach in data collecting was similar to other research which has been carried out in the world using, for example, the data from insurance [9,33].

5. Further Developments

The damage data collection proposed in this paper is very significant as far as it represents the first attempt to give an overview of the damage that occurred all over the Italian territory in the past 7 years: it can be updated every time a new event occurs or if older claims are made available for research, in order to give an ever more complete view for the years to come. This work could be deepened by georeferencing damage claims, to give a more precise indication of event extension and to allow further evaluations in terms of risk management. This application would be possible when people fill in the modules with high precision by indicating the complete address of their damaged buildings. The model has been calibrated on data collected in southern Italy, where other important projects in terms of risk management have been carried out [30] and have been considered while writing this paper: our more ambitious aim is to extend this type of application to a larger scale, to offer a more general instrument to be used in the aftermath of an emergency all over the national territory.
Since good results have been obtained after validation, the damage estimation methodology could also be successfully applied to different sectors, such as productive activities; at the same time though, damage to public services and infrastructure would require a specific study, according to the differences in data acquisition and to the higher spatial distribution of damage (i.e., not more punctual damages as for a single damaged building, but distributed ones, as for linear infrastructures).
The model is quite different from models already cited and available for damage assessment in Italy. In this case, we propose a model to be applied in the immediate post-event to give a rapid damage estimation considering just one parameter (flooded area) while existing models require many more parameters to be evaluated and considered (in particular, the water depth), which are not usually available in the aftermath of flood events. It would be interesting to create a synergy between the types of model, by comparing results obtained with the two different approaches. This would require, at least, knowledge about the spatial distribution of water depths for each event considered in this study, which is not available at present. It would be challenging also to calibrate some site-specific models, which can better fit the characteristics of the flooded area. On the one side, a geomorphological analysis can be done to define the peculiarities of the involved area clearly and to distinguish damage according to the events, as far as emergency states usually include vast areas and different types of phenomena, like floods, solid transport, instabilities, winds; at the same time, it could be improved to describe different contexts, i.e., floodplains of northern Italy, Apennine hills, alpine valleys. On the other side, the model could be refined by considering other indicators useful to describe the urban pattern and its response to extraordinary events: it is interesting to analyze an area’s vulnerability and how different building typologies or land uses do influence damage mechanisms and recovery actions.

6. Conclusions

This paper presents first an in-depth collection and organization of the whole available set of claims on flood damage produced in Italy by public bodies, private citizens, and productive activities over the past 7 years. Indeed, it is only since 2013 that a state law required a mandatory homogeneous procedure at the national level to collect these data, allowing for their comparison.
The database currently contains more than 70,000 claims and draws a rather good (and certainly original) image of the “geography of damage” at the national level. Moreover, it provides general information of great practical use such as the annual volume of requests, their territorial distribution, statistics of values, and so on. All the data refer to major events for which a state of national emergency has been declared, and therefore show good homogeneity also as regards the intensity of the connected phenomena. The data can be reasonably used for comparison to other industrial countries subject to the typical Mediterranean climate.
We propose a national map of past flood damage, normalized to the area of the municipality (there are around 8000 in Italy with an average area of 37.5 km2) and to the period considered in this paper (2013–2020), to give an overview as a support to future decisions and risk mitigation strategies.
We then propose an empirical model to allow for a quick damage estimation of direct damage to private assets (i.e., residential buildings) in the aftermath of flood events. The model has been derived from five regions of southern Italy, chosen as a case study to test the more general methodology described in the paper, and corresponding to nearly 30% of the total Italian territory. The model aims at offering an estimate of the economic loss to private properties, which is based on the only knowledge of the perimeter of the flooded area, following a typical “integral” approach to the problem. This piece of information can be gathered, by satellite image and/or aerial surveys by manned or unmanned platforms, relatively easily immediately post-event.
By a simple procedure, the flooded perimeter is processed together with Italian national statistical data to extract a key parameter called “characteristic flooded surface” at the municipality scale. This can be seen as the sum of the footprints of residential buildings in the flooded area. The analysis of the data contained in the claims database shows how these “characteristic surface” data are strongly correlated with the areas provided in the aftermath of the events by the flooded citizens in the damage request forms, thus providing a good physical basis for the proposed parameter.
A power-law equation is then proposed by the regression analysis comparison between observed damage data and the characteristic surfaces, coming from a “calibration subset”.
Validation of the model has been performed on an independent data subset, made by using the remaining damage data among all the available ones. Results show how 36% of the estimations stand within the 25% error band, 66% within the 50% band, and 93% within the 100% band. It should be noted that we are treating immediate after-event damage estimation where the only assessment, on a macro-regional or multi-regional scale, of the order of magnitude, can be considered a good result in itself. Model performances, from this point of view, can be considered quite encouraging.

Author Contributions

Conceptualization G.M., A.P., D.M., and D.F.B.; formal analysis G.M., M.B., I.B., and F.Z.; funding acquisition G.M. and D.F.B.; investigation, A.P., M.D.V., M.B., I.B., and F.Z.; methodology G.M., D.M., and A.P.; project administration, G.M. and D.F.B.; resources D.F.B. and G.M.; software G.M., M.D.V., and A.P.; supervision G.M., D.M., and D.F.B.; validation A.P., M.D.V.; visualization A.P., M.B., I.B., and F.Z.; writing—original draft preparation, G.M., A.P., and D.M.; writing—review and editing, G.M., D.M., D.F.B., M.B., I.B., and F.Z. All authors have read and agreed to the published version of the manuscript.

Funding

This research received no external funding.

Institutional Review Board Statement

Not applicable.

Informed Consent Statement

Not applicable.

Data Availability Statement

Data was obtained from National Civil Protection Department and are available with its the permission.

Acknowledgments

Research activities were performed in the framework of the PON, the National Operational Programme on Governance and Institutional Capacity 2013–2020, with the project “Rischio idrogeologico” and Interreg IT-CH Project GESTI.S.CO. Authors would like to thank the National Civil Protection Department for helping in the acquisition of data, Office III – Technical-scientific activities for the forecast and prevention of risks, Director Fausto Guzzetti and Office V – Emergency overcoming activities, Director Natale Mazzei. They also thank the National Fire Corps for precious information.

Conflicts of Interest

The authors declare no conflict of interest.

References

  1. Meyer, V.; Becker, N.; Markantonis, V.; Schwarze, R.; Van Den Bergh, J.; Bouwer, L.; Bubeck, P.; Ciavola, P.; Genovese, E.; Green, C.H. Assessing the costs of natural hazards-state of the art and knowledge gaps. Nat. Hazards Earth Syst. Sci. 2013, 13, 1351–1373. [Google Scholar] [CrossRef]
  2. Merz, B.; Kreibich, H.; Schwarze, R.; Thieken, A. Assessment of economic flood damage. Nat. Hazards Earth Syst. Sci. 2010, 10, 1697–1724. [Google Scholar] [CrossRef]
  3. Dottori, F.; Figueiredo, R.; Martina, M.L.; Molinari, D.; Scorzini, A.R. INSYDE: A synthetic, probabilistic flood damage model based on explicit cost analysis. Nat. Hazards Earth Syst. Sci. 2016, 16, 2577–2591. [Google Scholar] [CrossRef] [Green Version]
  4. Menoni, S.; Molinari, D.; Ballio, F.; Minucci, G.; Mejri, O.; Atun, F.; Berni, N.; Pandolfo, C. Flood damage: A model for consistent, complete and multipurpose scenarios. Nat. Hazards Earth Syst. Sci. 2016, 16, 2783–2797. [Google Scholar] [CrossRef] [Green Version]
  5. Schröter, K.; Kreibich, H.; Vogel, K.; Riggelsen, C.; Scherbaum, F.; Merz, B. How useful are complex flood damage models? Water Resour. Res. 2014, 50, 3378–3395. [Google Scholar] [CrossRef] [Green Version]
  6. De Grove, T.; Poljansek, K.; Ehrlich, D. Recording Disaster Losses. In Recommendations for a European Research; JRC Scientific and Policy Reports; Joint Research Centre, European Commission: Luxembourg, 2013. [Google Scholar]
  7. De Grove, T.; Poljansek, K.; Ehrlich, D.; Corbane, C. Current Status and Best Practices for Disaster Loss Data Recording in EU Member States: A Comprehensive Overview of Current Practice in the EU Member States; JRC Scientific and Policy Reports; JRC92290; Publications Office of the European Union: Luxembourg, 2014. [Google Scholar] [CrossRef]
  8. EU Commission—EU Expert Working Group on Disaster Damage and Loss Data. Guidance for Recording and Sharing Disaster Damage and Loss Data: Towards the Development of Operational Indicators to Translate the Sendai Framework into Action; JRC Scientific and Policy Reports, JRC95505; Publications Office of the European Union: Luxembourg, 2015. [Google Scholar] [CrossRef]
  9. Spekkers, M.H.; Ten Veldhuis, J.A.E.; Kok, M.; Clemens, F.H.L.R. Analysis of pluvial flood damage based on data from insurance companies in the Netherlands. In Proceedings of the International Symposium Urban Flood Risk Management, UFRIM, Graz, Austria, 21–23 September 2011. [Google Scholar]
  10. André, C.; Monfort, D.; Bouzit, M.; Vinchon, C. Contribution of insurance data to cost assessment of coastal flood damage to residential buildings: Insights gained from Johanna (2008) and Xynthia (2010) storm events. Nat. Hazards Earth Syst. Sci. 2013, 13, 2003–2012. [Google Scholar] [CrossRef] [Green Version]
  11. Kellermann, P.; Schröter, K.; Thieken, A.H.; Haubrock, S.-N.; Kreibich, H. The object-specific flood damage database HOWAS 21. Nat. Hazards Earth Syst. Sci. 2020, 20, 2503–2519. [Google Scholar] [CrossRef]
  12. Mobley, W.; Sebastian, A.; Highfield, W.; Brody, S.D. Estimating flood extent during Hurricane Harvey using maximum entropy to build a hazard distribution model. J. Flood Risk Manag. 2019, 12, 12549. [Google Scholar] [CrossRef] [Green Version]
  13. Guzzetti, F.; Tonelli, G. Information system on hydrological and geomorphological catastrophes in Italy (SICI): A tool for managing landslide and flood hazards. Nat. Hazards Earth Syst. Sci. 2004, 4, 213–232. [Google Scholar] [CrossRef]
  14. Handmer, J. The chimera of precision: Inherent uncertainties in disaster loss assessment. Aust. J. Emerg. Manag. 2003, 18, 88–97. [Google Scholar]
  15. Gizzi, F.T.; Potenza, M.R.; Zotta, C. The insurance market of natural hazards for residential properties in Italy. Open J. Earthq. Res. 2016, 5, 35. [Google Scholar] [CrossRef] [Green Version]
  16. Bignami, D.F.; Rulli, M.C.; Rosso, R. Testing the use of reimbursement data to obtain damage curves in urbanised areas: The case of the Piedmont flood on October 2000. J. Flood Risk Manag. 2018, 11, S575–S593. [Google Scholar] [CrossRef] [Green Version]
  17. Dipartimento della Protezione Civile. Emergenze per il Rischio Meteo-Idro. Available online: http://www.protezionecivile.gov.it/amministrazione-trasparente/interventi-straordinari-emergenza/emergenze-rischio-meteo-idro (accessed on 17 March 2021).
  18. Bignami, D.F.; Dragoni, A.; Menduni, G. Assessing and improving flood and landslide community social awareness and engagement via a web platform: The case of Italy. Int. J. Disaster Risk Sci. 2018, 9, 530–540. [Google Scholar] [CrossRef] [Green Version]
  19. Luino, F.; Chiarle, M.; Nigrelli, G.; Agangi, A.; Biddoccu, M.; Cirio, C.G.; Giulietto, W. A model for estimating flood damage in Italy: Preliminary results. Wit Trans. Ecol. Environ. 2006, 98. [Google Scholar] [CrossRef] [Green Version]
  20. Carisi, F.; Schröter, K.; Domeneghetti, A.; Kreibich, A.; Castellarin, A. Development and assessment of uni-and multivariable flood loss models for Emilia-Romagna (Italy). Nat. Hazards Earth Syst. Sci. 2018, 18, 2057–2079. [Google Scholar] [CrossRef] [Green Version]
  21. Huizinga, J.; De Moel, H.; Szewczyk, W. Global Flood Depth-Damage Functions: Methodology and the Database with Guidelines; JRC Working Paper; JRC105688; Joint Research Centre: Seville, Spain, 2017. [Google Scholar]
  22. Thieken, A.H.; Olschewski, A.; Kreibich, H.; Kobsch, S.; Merz, B. Development and evaluation of FLEMOps—A new Flood Loss Estimation MOdel for the private sector. Wit Trans. Ecol. Environ. 2008, 118, 315–324. [Google Scholar]
  23. Penning-Rowsell, E.; Priest, S.; Parker, D.; Morris, J.; Tunstall, S.; Viavattene, C.; Chatterton, J.; Owen, D. Flood and Coastal Erosion Risk Management: A Manual for Economic Appraisal; Routledge: London, UK, 2014. [Google Scholar]
  24. Büchele, B.; Kreibich, H.; Kron, A.; Thieken, A.; Ihringer, J.; Oberle, P.; Merz, B.; Nestmann, F. Flood-risk mapping: Contributions towards an enhanced assessment of extreme events and associated risks. Nat. Hazards Earth Syst. Sci. 2006, 6, 485–503. [Google Scholar] [CrossRef]
  25. Smith, D.I. Flood damage estimation-A review of urban stage-damage curves and loss functions. Water Sa 1994, 20, 231–238. [Google Scholar]
  26. ISTAT, Istituto Nazionale di Statistica. Available online: https://www.istat.it/it/archivio/6789 (accessed on 17 March 2021).
  27. Voigt, S.; Giulio-Tonolo, F.; Lyons, J.; Kučera, J.; Jones, B.; Schneiderhan, T.; Platzeck, G.; Kaku, K.; Hazarika, M.K.; Czaran, L. Global trends in satellite-based emergency mapping. Science 2016, 353, 247–252. [Google Scholar] [CrossRef]
  28. Ajmar, A.; Boccardo, P.; Broglia, M.; Kucera, J.; Giulio-Tonolo, F.; Wania, A. Response to flood events: The role of satellite-based emergency mapping and the experience of the Copernicus emergency management service. Flood Damage Surv. Assess. New Insights Res. Pract. 2017, 228, 213–228. [Google Scholar]
  29. Duo, E.; Trembanis, A.C.; Dohner, S.; Grottoli, E.; Ciavola, P. Local-scale post-event assessments with GPS and UAV-based quick-response surveys: A pilot case from the Emilia–Romagna (Italy) coast. Nat. Hazards Earth Syst. Sci. 2018, 18, 2969–2989. [Google Scholar] [CrossRef] [Green Version]
  30. PON Governance e Capacità Istituzionale. Available online: http://www.pongovernance1420.gov.it/it/ (accessed on 17 March 2021).
  31. Molinari, D.; Scorzini, A.R.; Arrighi, C.; Carisi, F.; Castelli, F.; Domeneghetti, A.; Gallazzi, A.; Galliani, M.; Grelot, F.; Kellermann, P. Are flood damage models converging to “reality”? Lessons learnt from a blind test. Nat. Hazards Earth Syst. Sci. 2020, 20, 2997–3017. [Google Scholar] [CrossRef]
  32. Cammerer, H.; Thieken, A.H.; Lammel, J. Adaptability and transferability of flood loss functions in residential areas. Nat. Hazards Earth Syst. Sci. 2013, 13, 3063–3081. [Google Scholar] [CrossRef] [Green Version]
  33. Association of State Floodplain Managers. Flood Mapping for the Nation: A Cost Analysis for Completing and Maintaining the Nation’s NFIP Flood Map Inventory; Association of State Floodplain Managers: Madison, WI, USA, 2020. [Google Scholar]
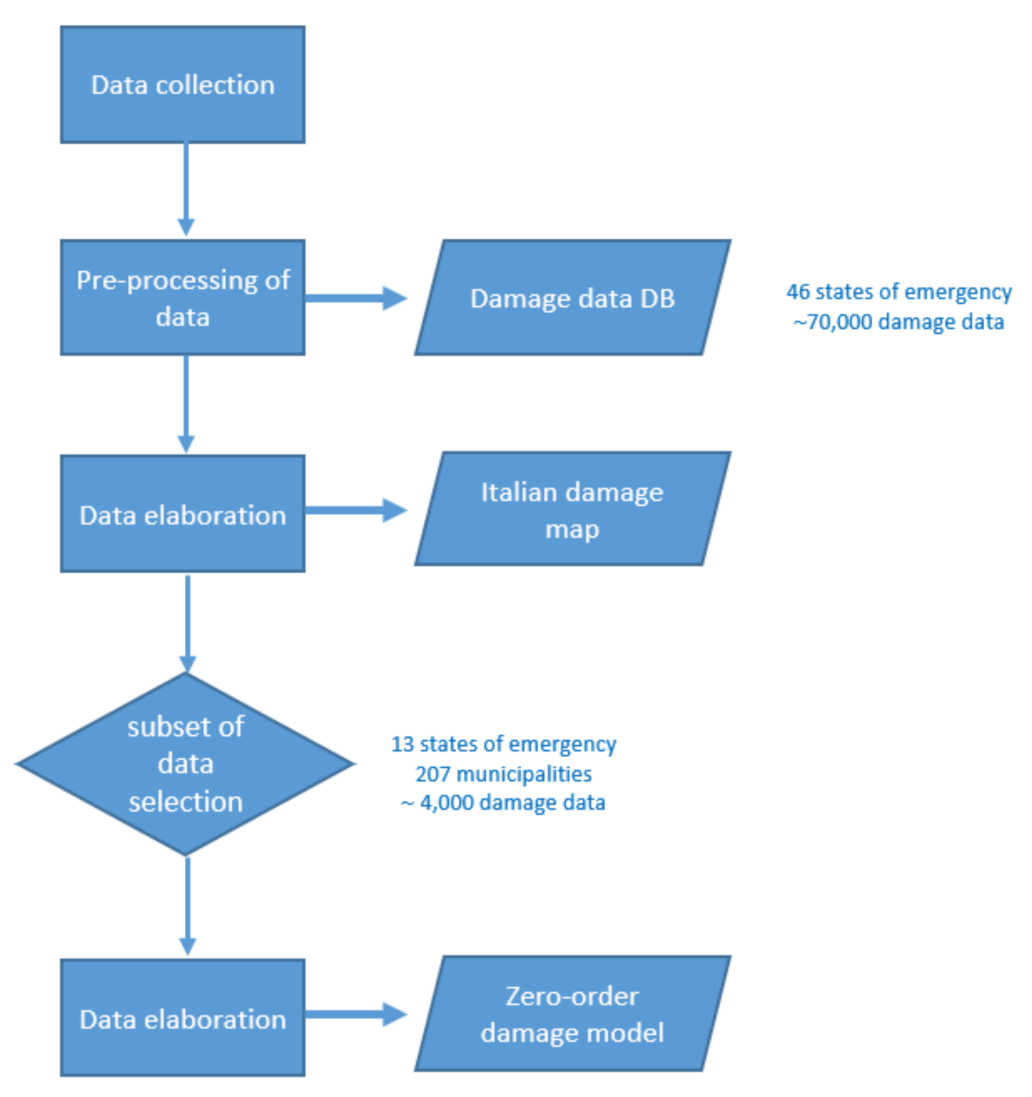
Figure 1. The workflow diagram identifies the main elaboration steps (rectangles), implemented data, and outputs of the research (parallelograms).
Water 13 01292 g001
Figure 2. The maps represent the total availability of damage information referred to public services, private properties, and commercial activities altogether. Map (a) represents the number of emergencies available for our work (blue columns), with respect to the total number of states of emergency declared in each region (green columns). Map (b) represents the proportion of the number of states of emergency of which we collected every single claim (yellow slice) and the number of states of emergency that present damage recognition on the Civil Protection website.
Water 13 01292 g002
Figure 3. Representation of all Italian regions and focus on those involved in the European project [30], with the historically flooded areas.
Water 13 01292 g003
Figure 4. Overview of flood damage occurring between 2013 and 2020, normalized to the municipal surface and to the period of 7 years: (a) map of damages to private properties; (b) map of total damage, as the sum of damages to public services, private properties, and commercial activities.
Water 13 01292 g004
Figure 5. Regression model and equation obtained on damage data for the five regions of southern Italy: each point represents a single municipality. The model (blue line) has been derived from the calibration dataset (blue dots); red dots represent validation data that fit quite well to the model.
Water 13 01292 g005
Figure 6. Estimated flooded surface vs. total declared surfaces derived from claims per municipality. The green line represents the best fit. The orange line represents the data regression line, and its R2 indicates good data alignment.
Water 13 01292 g006
Figure 7. Estimated vs. observed values for the validation dataset. The green line represents the best fit. The blue line represents the data regression line, and its R2 indicates good data alignment.
Water 13 01292 g007
Figure 8. Frequency distribution of the absolute value of the percentage error in the validation dataset. Columns represent the percentage of municipalities considered in the validation phase according to error classes (x-axis). The orange line represents the cumulative error and shows the good performance of the model.
Water 13 01292 g008
Table 1. Flood damage reported in Italy from September 2013 to November 2020, according to the National Civil Protection website, and available for the present research.
Public AssetsPrivate AssetsProductive ActivitiesTotal
Total reported damages [M€]6643.82 M€1047.27 M€1158.16 M€8849.24 M€
Available for research [M€]4936.72 M€825.93 M€1090.97 M€6853.63 M€
Available for research [%]74.3%78.8%94.1%77.4%
Table 2. Description of the available dataset for southern Italy: the total dataset has been cleaned of outliers and then claims aggregated into municipalities have been split between calibration and validation datasets.
Total Available DatasetRefined Dataset
Number of emergency states138
Number of hit municipalities207149
Number of claims41043729
Total observed damage [€]129 million 108 million
Table 3. Summary of claims in the available dataset.
Claim for Damage TypeNumber of ClaimsAverage Amount Per Claim [€]
Public assets22,411220,281 €
Private assets38,12921,662 €
Productive activities12,46387,537 €
Total73,00393,881 €
Publisher’s Note: MDPI stays neutral with regard to jurisdictional claims in published maps and institutional affiliations.