Article

Water Turbidity Retrieval Based on UAV Hyperspectral Remote Sensing

1
State Key Laboratory of Urban Environmental Processes and Digital Simulation, Capital Normal University, Beijing 100048, China
2
College of Resources Environment and Tourism, Capital Normal University, Beijing 100048, China
3
Beijing Laboratory of Water Resources Security, Beijing 100048, China
4
Key Laboratory of 3D Information Acquisition and Application, Ministry of Education, Beijing 100048, China
*
Author to whom correspondence should be addressed.
Water 2022, 14(1), 128; https://doi.org/10.3390/w14010128
Submission received: 9 December 2021 / Revised: 28 December 2021 / Accepted: 3 January 2022 / Published: 5 January 2022

Abstract

:
The water components affecting turbidity are complex and changeable, and the spectral response mechanism of each water quality parameter is different. Therefore, this study mainly aimed at the turbidity monitoring by unmanned aerial vehicle (UAV) hyperspectral technology, and establishes a set of turbidity retrieval models through the artificial control experiment, and verifies the model’s accuracy through UAV flight and water sample data in the same period. The results of this experiment can also be extended to different inland waters for turbidity retrieval. Retrieval of turbidity values of small inland water bodies can provide support for the study of the degree of water pollution. We collected the images and data of aquaculture ponds and irrigation ditches in Dawa District, Panjin City, Liaoning Province. Twenty-nine standard turbidity solutions with different concentration gradients (concentration from 0 to 360 NTU—the abbreviation of Nephelometric Turbidity Unit, which stands for scattered turbidity.) were established through manual control and we simultaneously collected hyperspectral data from the spectral values of standard solutions. The sensitive band to turbidity was obtained after analyzing the spectral information. We established four kinds of retrieval, including the single band, band ratio, normalized ratio, and the partial least squares (PLS) models. We selected the two models with the highest R2 for accuracy verification. The band ratio model and PLS model had the highest accuracy, and R2 was, respectively, 0.65 and 0.72. The hyperspectral image data obtained by UAV were combined with the PLS model, which had the highest R2 to estimate the spatial distribution of water turbidity. The turbidity of the water areas in the study area was 5–300 NTU, and most of which are 5–80 NTU. It shows that the PLS models can retrieve the turbidity with high accuracy of aquaculture ponds, irrigation canals, and reservoirs in Dawa District of Panjin City, Liaoning Province. The experimental results are consistent with the conclusions of the field investigation.

1. Introduction

Turbidity is an important parameter to characterize water quality, especially the transparency of the water area [1]. At the same time, there is a close relationship between turbidity and other water quality parameters. The analysis of its change is helpful to understand the distribution of sediment or total suspended solids in the water environment and provides practical information for the study of pollutant deposition, decomposition, and diffusion in the water [2]. Therefore, monitoring of spatial turbidity distribution is significant for the water ecological environment and human production and living. The intensity of incident light will be weakened after the absorption and scattering of light by particles in water, because turbidity is a water quality parameter with optical activity. Furthermore, the amount of attenuation and the effect of water on incident light can be well reflected in remote sensing images. Therefore, remote sensing can indirectly obtain the spatial distribution of turbidity, which is expressed according to the amount of attenuation.
Remote sensing has the advantages of a wide range and fast speed, effectively supplementing conventional water environment monitoring methods [3,4]. With the rapid development of remote sensing and the in-depth study on the spectral characteristics and algorithms of water quality parameters, the quantitative degree of water quality retrieval by remote sensing methods has been continuously improved [5]. An inversion algorithm is established by studying the relationship between water reflectance spectral characteristics and water quality parameter concentration [6,7]. Due to the strong spatial-temporal variation of turbidity and apparent seasonal variation, remote sensing is also needed for long-term dynamic water turbidity monitoring. The use of UAV technology can be more flexible monitoring of small inland water [8]. Establishing a turbidity retrieval model based on remote sensing data, monitoring the change of water turbidity, and studying the change characteristics of water turbidity provides new prospects for applying remote sensing technology and supplies a new way to study water quality and water color.
In previous studies, researchers concluded that the reflectance of the red band is closely related to turbidity, which is the key band for turbidity retrieval. Most models are built around the red band in the single band model, such as the turbidity model constructed by Xu [9], Douglas [10], etc. In addition, in the study of turbidity retrieval using UAV hyperspectral images, the near-infrared (NIR) band is often used for model building and has a high band sensitivity, as Kornelia [11], concluded that red light band was used to identify low-medium turbidity waters, and the NIR band was used to identify high-turbidity waters when studying sediment-rich glacial meltwater plumes. Jiang [12] used the data of headwall hyperspectral imager to build a variety of multiple linear regression models and PLS models for comparison. Eventually, the accuracy of the PLS model was significantly better than the other models. Many researchers have established the ratio model between the NIR band or the red band and the green band, which can obtain higher retrieval accuracy. Xiao [2] used three kinds of domestic satellite—HJ-1A/1B CCD, GF-1 WFV, and ZY-3 MUX—data for water turbidity retrieval and constructed the ratio model of red and green bands as the turbidity retrieval model. In addition, Song [13] and Feng [14] used blue, green, red, and NIR bands to highlight the spectral characteristics of turbidity. However, it is challenging to combine the bands, due to the large number of bands and a large amount of data. So, the combination method is often used in the research of turbidity retrieval with multispectral data.
The UAV remote sensing system has flexibility, rapid response, simple structure, and good real-time performance. The remote sensing image data, with high spatial resolution, high temporal resolution, and high spectral resolution, can be acquired at low altitude, which effectively makes up for the deficiency of traditional satellite remote sensing technology [15]. When the weather conditions permit, using UAVs anytime and anywhere can provide a valuable monitoring scheme for water quality monitoring and water pollution prediction. This can be used to timely discover the pollution situation of small and micro water areas, which is difficult to be considered by traditional water quality monitoring methods. Nowadays, as a new and brand-new remote sensing platform, UAV has been widely used and gradually shows its importance [16,17]. The emergence and development of UAV hyperspectral technology provide a new technical means for large-scale water quality monitoring and research. It makes up for any defects of satellite remote sensing water quality monitoring [18]. It has excellent guiding significance for water environment monitoring of small and micro water areas such as rivers.
In this study, we collected the reflectance data of the hyperspectral imager based on the standard turbidity solutions of twenty-nine concentrations. The retrieval model of turbidity standard solution was constructed after reflectance processing. Instead of the traditional method of constructing turbidity retrieval model by collecting data in the field, a set of retrieval models from low to high turbidity water areas was established, and the accuracy of retrieval was verified by UAV data. It measured data in the same period, and the best retrieval model suitable for aquaculture ponds, irrigation canals, and reservoirs in Dawa District of Panjin City, Liaoning Province was obtained.

2. Data Acquisition

2.1. Manual Control Experiment

2.1.1. Solution Concentration Configuration

In this manual control experiment, we used the turbidity solution with a concentration of 4000 NTU for different concentration configurations. We set a total of twenty-nine gradients of turbidity solution with different interval gradients from 0 to 360 NTU. Moreover, a black box with a volume of 13 L was prepared as a container (38.5 cm × 29.5 cm × 20.5 cm). To reduce the influence of the reflection of the box bottom and the box wall on the water spectral measurement, the black light-absorbing paper, and the light-absorbing adhesive tape were pasted on the bottom and wall before the experiment. However, the effect on water reflectance still cannot be ignored, especially when the concentration of turbidity standard solution is low. Owing to the limited amount of simulated water volume, inhomogeneity of turbidity distribution via volume, and because the water in ponds, irrigation canals, and reservoirs is not perfectly smooth, waves are present. These reasons will limit the ability to use the regression equation obtained in this experiment in natural waters to a certain extent. Therefore, this experiment cannot completely simulate the actual river environment and accuracy estimates are required. To ensure the accuracy of the experiment, we calculated the milliliter required for each adjustment of solution concentration in advance. For the convenience of calculation, we used 12 L distilled water as the initial water sample for the experiment (the turbidity was 0 NTU). We added the corresponding milliliter in turn to adjust the concentration gradient and measured the readings of the configured solution with HACH 2100 q turbidimeter from HACH Company in America to ensure that the error between the concentration of the prepared turbidimetric solution and the set gradient was within 5 NTU. During the experiment, assuming that the background spectrum remains unchanged, the change of water reflection spectrum is caused by the change of turbidity concentration.

2.1.2. Water Reflection Spectrum Acquisition

The hyperspectral imager used was the Gaiasky-mini2-VN from Sichuan Dualix Spectral Imaging Technology Company, with a spectral range of 400–1000 nm and 176 spectral channels. The imager is often carried on rotor UAVs for image acquisition. The collected data are used in the corresponding research of small-scale features [19]. In this experiment, we selected the data acquisition time of the hyperspectral imager to be 10 a.m. with sufficient light. The acquisition time of each gradient was strictly controlled so that the total acquisition time did not exceed two hours. We ensured sufficient illumination intensity and synchronization of data acquisition, and settled on a better foundation for subsequent data processing. The hyperspectral imager was fixed on a tripod about 2 m high. A black box containing solution and a standard gray board with the same height were placed on the box. We used the hyperspectral imager to synchronously collect the water and gray board spectra after adjusting the concentration of the solution. To ensure the accuracy of data collection, we kept the lens height unchanged during the experiment.
The obtained hyperspectral raw data were processed as reflectance data. The low-pass filtering could smooth and denoise the image effectively. After that, the spectral information collected by the hyperspectral imager was processed with reflectance. The average value of the same region of 5 × 5 pixels range was selected in the frame of the hyperspectral images with different turbidity. The relationship between the digital value (DN) and reflectivity is as follows:
Ref Hyp = DN water DN greyboard × Ref greyboard
where, Ref Hyp is the reflectance value of the image after reflectance correction, DN water is the DN value of the original image, DN greyboard is the original DN value of the gray board, and Ref greyboard is the standard reflectance of the gray board.
Based on the spectral data of the gray board collected in the same period of the experiment, the DN value was transformed into the absolute reflectance data to obtain the hyperspectral reflectance data of different concentrations.

2.2. UAV Field Data Acquisition

2.2.1. Image Acquisition and Sampling

Figure 1 shows the study areas of field data acquisition in this experiment. The field flight tests were conducted in September 2019 and October 2020, respectively, and the images were collected using the Gaiasky-mini2-VN hyperspectral imager, carried by the DJI M600 pro UAV. We obtained three hyperspectral data sets of UAVs. The flight area is located in Dawa District, Panjin City, Liaoning Province. The assignment included a flying area of 0.25 km2 for the Rongxing reservoir and two flying areas of 0.95 km2 for breeding ponds and irrigation canals. Before the UAV took off, a standard gray cloth with reflectivity of 20% and an area of 2 × 2 m had been placed in the aerial photography area. In-flight, the altitude was set at 200 m, the course overlap was set at 55%, the side overlap was set at 40%, and the flight speed was 12.8 m/s.
During the flight, synchronous sampling was carried out to record the longitude and latitude of the sampling point, the water quality of the river, and to take photos. A total of 18 water samples were collected, and the location information of the sampling point was recorded. After the water sample was collected, it was brought back to the laboratory in time. The turbidity value was read by the HACH 2100 q portable turbidimeter. The turbidity range was 3.2–56.37 NTU, and the average value was 22.34 NTU. The statistical data are shown in Table 1.

2.2.2. Image Preprocessing and Water Extraction

a. Reflectivity calibration and radiometric correction
Firstly, the original image aberration and distortion were corrected through SpecView software to complete the lens correction of the UAV image, eliminate the color difference, and correct the aperture. Secondly, in the flight process of UAVs, due to different light and weather conditions, the acquired image will be distorted in the spectral dimension, and the data need to be radiometric corrected [20]. In this study, the radiometric correction was also operated by SpecView software. To eliminate the errors caused by the performance of the UAV sensor, we obtained the reflectivity value of the image, and eliminated the influence of the atmosphere, water vapor, and other factors when the UAV flies to a certain altitude, we adopted black-and-white correction and atmospheric correction. The atmospheric correction formula is as follows:
Ref fixed = DN Hyp × Ref standard DN gray
where Ref fixed is the spectral reflectance of the image after eliminating water vapor and atmosphere. Ref Hyp is the reflectance of the image after reflectance correction. Ref standard is the spectral reflectance of the gray cloth calibrated by the National Institute of Metrology. Ref gray is the reflectance of the gray cloth in the image after reflectance correction.
b. Geometric correction
Due to the influence of external factors such as airflow, wind direction, and wind speed in the flight process of UAVs, there is an inevitable error between the image geographic coordinates and the actual coordinates [21]. At the same time, to eliminate the system error caused by UAV sensors, it is necessary to carry out a geometric correction for UAV images. The geometric distortion of the UAV image was simulated with the data of control points selected on the ground in the field flight test. The flight data of the UAV after image preprocessing is shown in Figure 2.
c. Water mask extraction
The method of extracting water from remote sensing images is a hot research topic at present, which has been widely developed in the aspects of water body index and classification. The normalized difference water index (NDWI) method [22] extracts the water body from the three UAV flight data obtained after preprocessing, so that the land, vegetation, and other surface features outside the water area which have interference are removed from the image and do not participate in the quantitative retrieval. The calculation formula is as follows:
N D W I = Ref 547 nm Ref 863 nm Ref 547 nm + Ref 863 nm
After the calculation, the region of interest was extracted to collect the water samples. After the NDWI value was calculated, it was found that when the threshold value was 0.06, the water could be separated from other land types. Because the study area was located in the plain area, there was no influence of mountain shadow, so the threshold method is feasible. The segmentation threshold is set to 0.06 to realize the automatic extraction of water.
d. Spectral smoothing
In order to solve the influence of the external environment in the process of collecting ultraviolet spectrum and NIR spectrum data, that is, to eliminate the characteristic spectral noise outside the band with a high standard deviation of the noise, especially the serious spectral overlap in the NIR spectrum [23], and reduce the impact of error, low-pass filtering is used for data smoothing, we used the low-pass filter for image smoothing. The window width of 5 * 5 pixels centered on the water sampling point was selected to weaken the positioning error. It can eliminate noise interference and avoid the loss of image local information due to excessive smoothing. The processed spectrum can better retain the peak–valley characteristics [24].

3. Methods

3.1. Experimental Process

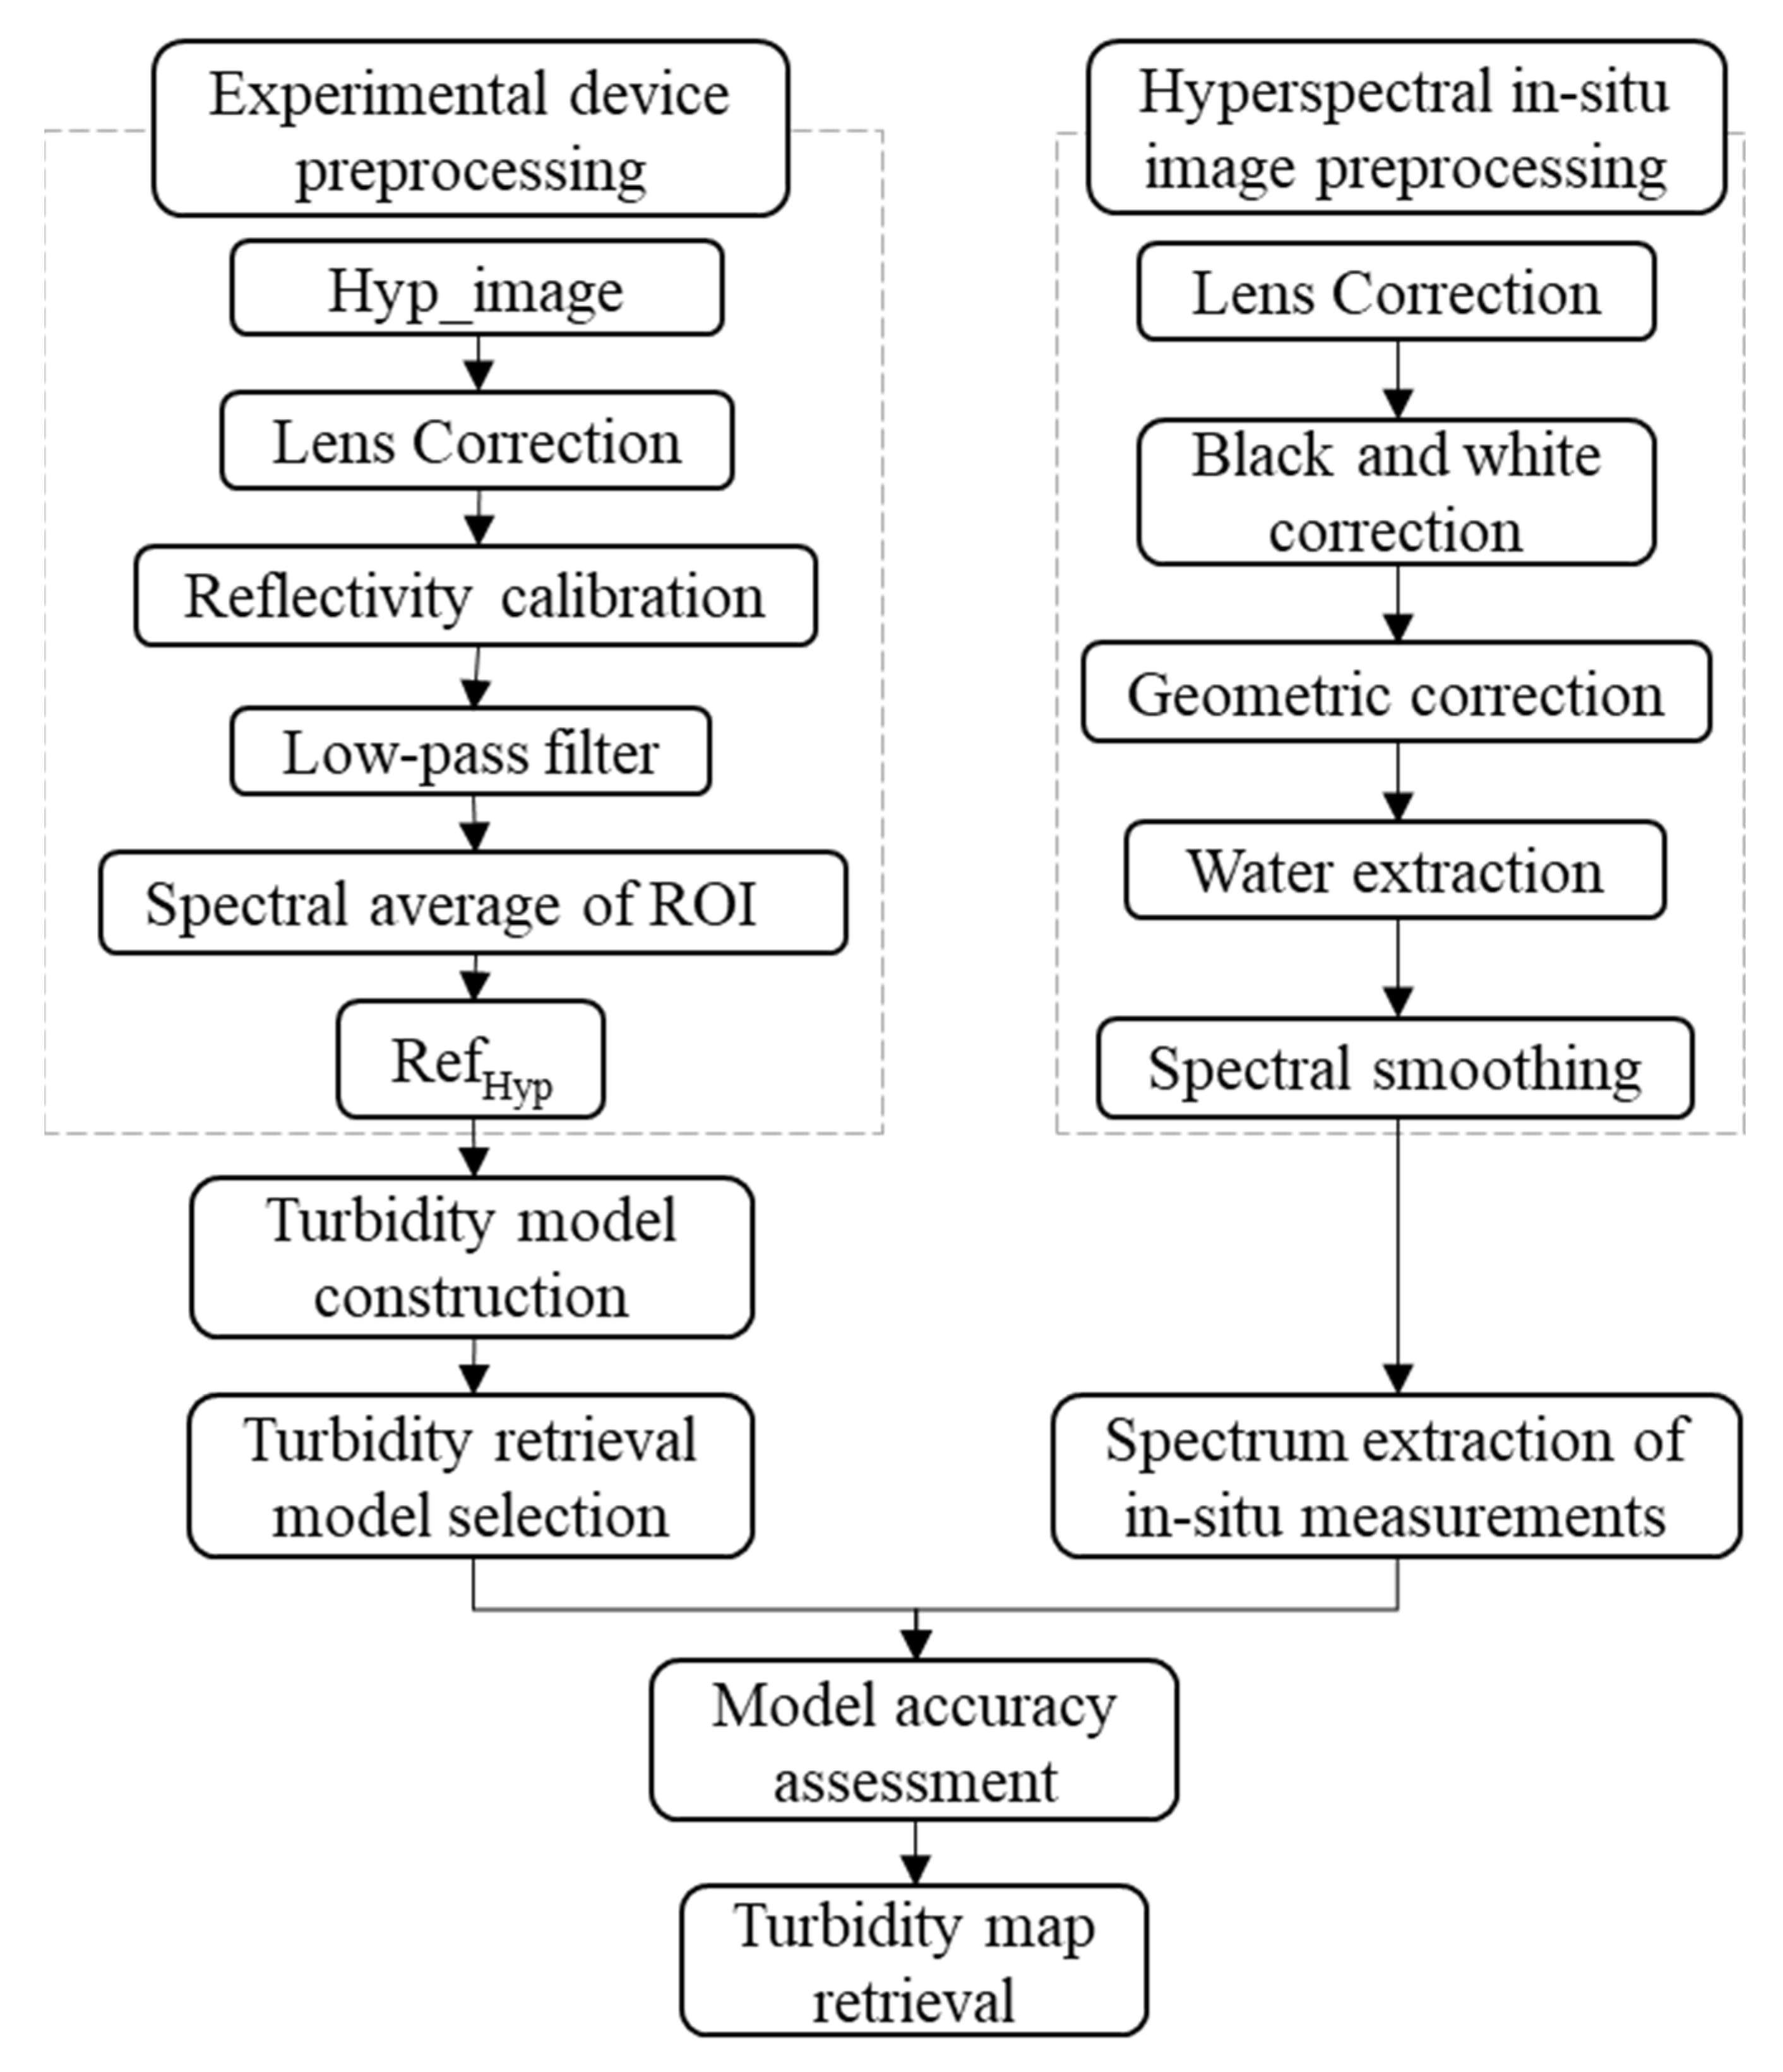
The research process is shown in Figure 3. Given the artificial control experiment on the ground, the turbidity retrieval model of the hyperspectral imager was established. The reflectance data was obtained by preprocessing hyperspectral imager data. The correlation analysis method selects the best retrieval band according to the relationship between ground experiment spectral data and turbidity. The R2 and root mean square error (RMSE) models were used to evaluate. After various forms of model construction and screening, the model with a higher determination coefficient was selected as the preliminary model for turbidity retrieval. Then, the spectral information of the field sampling points was extracted according to the field flight hyperspectral image data, and the synchronous sampling data verified the model accuracy. Finally, the model with the highest retrieval accuracy was obtained, and the model was applied to draw the turbidity retrieval map of the flight image in the study area.

3.2. Model Construction

3.2.1. Model Selection

a. Single-band model
Similar to other water quality parameter retrieval, the single-band model is often used in turbidity retrieval. The single-band model is a remote sensing retrieval method based on statistical analysis. The basic principle is to find the band with the highest correlation with turbidity and establish the retrieval model. Due to the strong optical response of turbidity index, high reflectivity can fully obtain the information in the water [25,26], so the single band quantitative model of turbidity can be established. For example, Joshi used the optimized and atmospheric corrected b3 band (the red band) of Landsat 5 TM to build the turbidity retrieval model and proposed a seasonal threshold for different seasonal applications [27].
b. Band ratio model
The band ratio model is used to select the most remarkable combination with the measured turbidity from all possible band models and calculate the ratio to build the retrieval model [28]. When compared with the single-band model, the band ratio model can eliminate the interference of background noise, such as water surface smoothness and surrounding environment, and reduce the influence of other pollutants to a certain extent, to improve the retrieval accuracy [29,30,31,32,33,34]. The band selection range of the ratio model is narrow, and the optimal band combination can be found through band iteration after analyzing the optical characteristics [35]. Fu [36] found that logarithm conversion of spectral reflectance ratio is helpful for quantitative remote sensing retrieval of turbidity content.
c. Normalized ratio model
Normalization of the spectrum can improve the correlation between turbidity and remote sensing reflectance. The original spectral reflectance of the hyperspectral imager is normalized, and the correlation between the normalized spectral reflectance and the measured turbidity is analyzed. The normalized reflectance model is established by using the band reflectance and turbidity with the largest correlation coefficient. Cao used the surface spectrometer data to complete the quantitative hyperspectral retrieval of Nansi Lake water and finally established the NIR and green band’s normalized ratio model [37].
d. Partial least squares regression model
Partial least squares regression (PLS) is a multiple linear regression modeling method. In modeling, it integrates three analysis methods: principal component analysis, linear regression analysis, and canonical correlation analysis, suitable for data processing and modeling with complex variables and high correlation. He Yong used NIR sensors to obtain spectral information of samples and used the PLS method to establish a prediction model of soil nitrogen content. The prediction effect of the PLS model was outstanding and stable [38]. Wang used the PLS model based on four machine learning methods to test the relationship between the total nitrogen concentration extracted from the hyperspectral images from UAVs during plant growth and the measured total nitrogen concentration [39].
The PLS modeling principle is: Suppose P independent variables {x1, …, xp} and the dependent variables {y1, …, yq}, data table X = {x1, …, xp} and Y = {y1, …, yq}. t1 and u1 are extracted, the regression of X to t1 and Y to u1 is carried out, respectively. If the regression equation has reached satisfactory accuracy, then the components are determined. Otherwise, the residual information after X is interpreted by t1 and Y by u1 will be used for the second round of extraction components t2 and u2. The regression of X and Y to t2 and u2 will be continued. The above process will be iterated until the accuracy meets the requirements. In that case, they can be converted into Y’s regression on the original variable x1, …, xp regression equation completed the partial least squares regression modeling.

3.2.2. Modeling through Artificial Control Experiment

We selected the above four models to model the turbidity standard solution data collected by the hyperspectral imager. Among them, the PLS regression model of hyperspectral imager selected the first 161 bands in the range of 400–1000 nm as the research data. After the standard solution was measured by a hyperspectral imager, the spectral data were processed; the last 15 bands after 940 nm had a 0 value. The independent variable matrix X dimension was 29 × 161, where 29 represents turbidity concentrations and 161 represents the number of bands. The dependent variable was the turbidity value for each gradient. X and Y were standardized, respectively, and a partial least squares regression was performed.

3.3. Accuracy Assessment

We used four indicators to evaluate the modeling effect, including the coefficient of determination R2, mean bias error (MBE), root mean square error (RMSE), and mean absolute percentage error (MAPE). The basic statistical indicators formula is shown in Table 2.

4. Results and Discussion

4.1. Spectral Characteristic Analysis

Hyperspectral images have a large amount of data. The signal should be retained in the band selection process, and the noise should be compressed as much as possible [40]. According to the average spectral image, identify and mark the noise bands in the hyperspectral image. Furthermore, apply the PIE software (Pixel Information Expert) to evaluate the noise of the water area extracted from the image to find out the noise bands without changing the coherent bands of the hyperspectral image [41].
Figure 4 shows the estimated noise standard deviation of the hyperspectral reflectance image. According to the noise shown, the noise corresponds to the blue band near 436 nm and the NIR band after 863 nm. Consider the following modeling process to avoid using the bands in the above range for model building.
According to the reflectance curve in Figure 5, there is a strong reflection peak in the range of 391–460 nm in the blue band and 770–830 nm in the NIR band. The reflection value decreases in the range of 720–770 nm due to the strong absorption, and the absorption peak appears. Due to the fact that the water set in the ground control experiment is single water with different turbidity concentrations and no other water quality parameters, the change of water spectral reflectance is relatively consistent. Combined with the results of noise estimation, it is considered that the blue band of hyperspectral imager should be avoided in the modeling process. Therefore, it can be confirmed that the regression equation with a good correlation coefficient can be established in the NIR band.

4.2. Model Retrieval of Turbidity Standard Solution

4.2.1. Manual Control Experimental Models for Hyperspectral Image

According to the correlation between the band of the hyperspectral imager and turbidity standard solution, the high correlation range of the band reflectance is between 800 nm and 900 nm. Moreover, the single band model with the highest accuracy, 809 nm, as the independent variable is established.
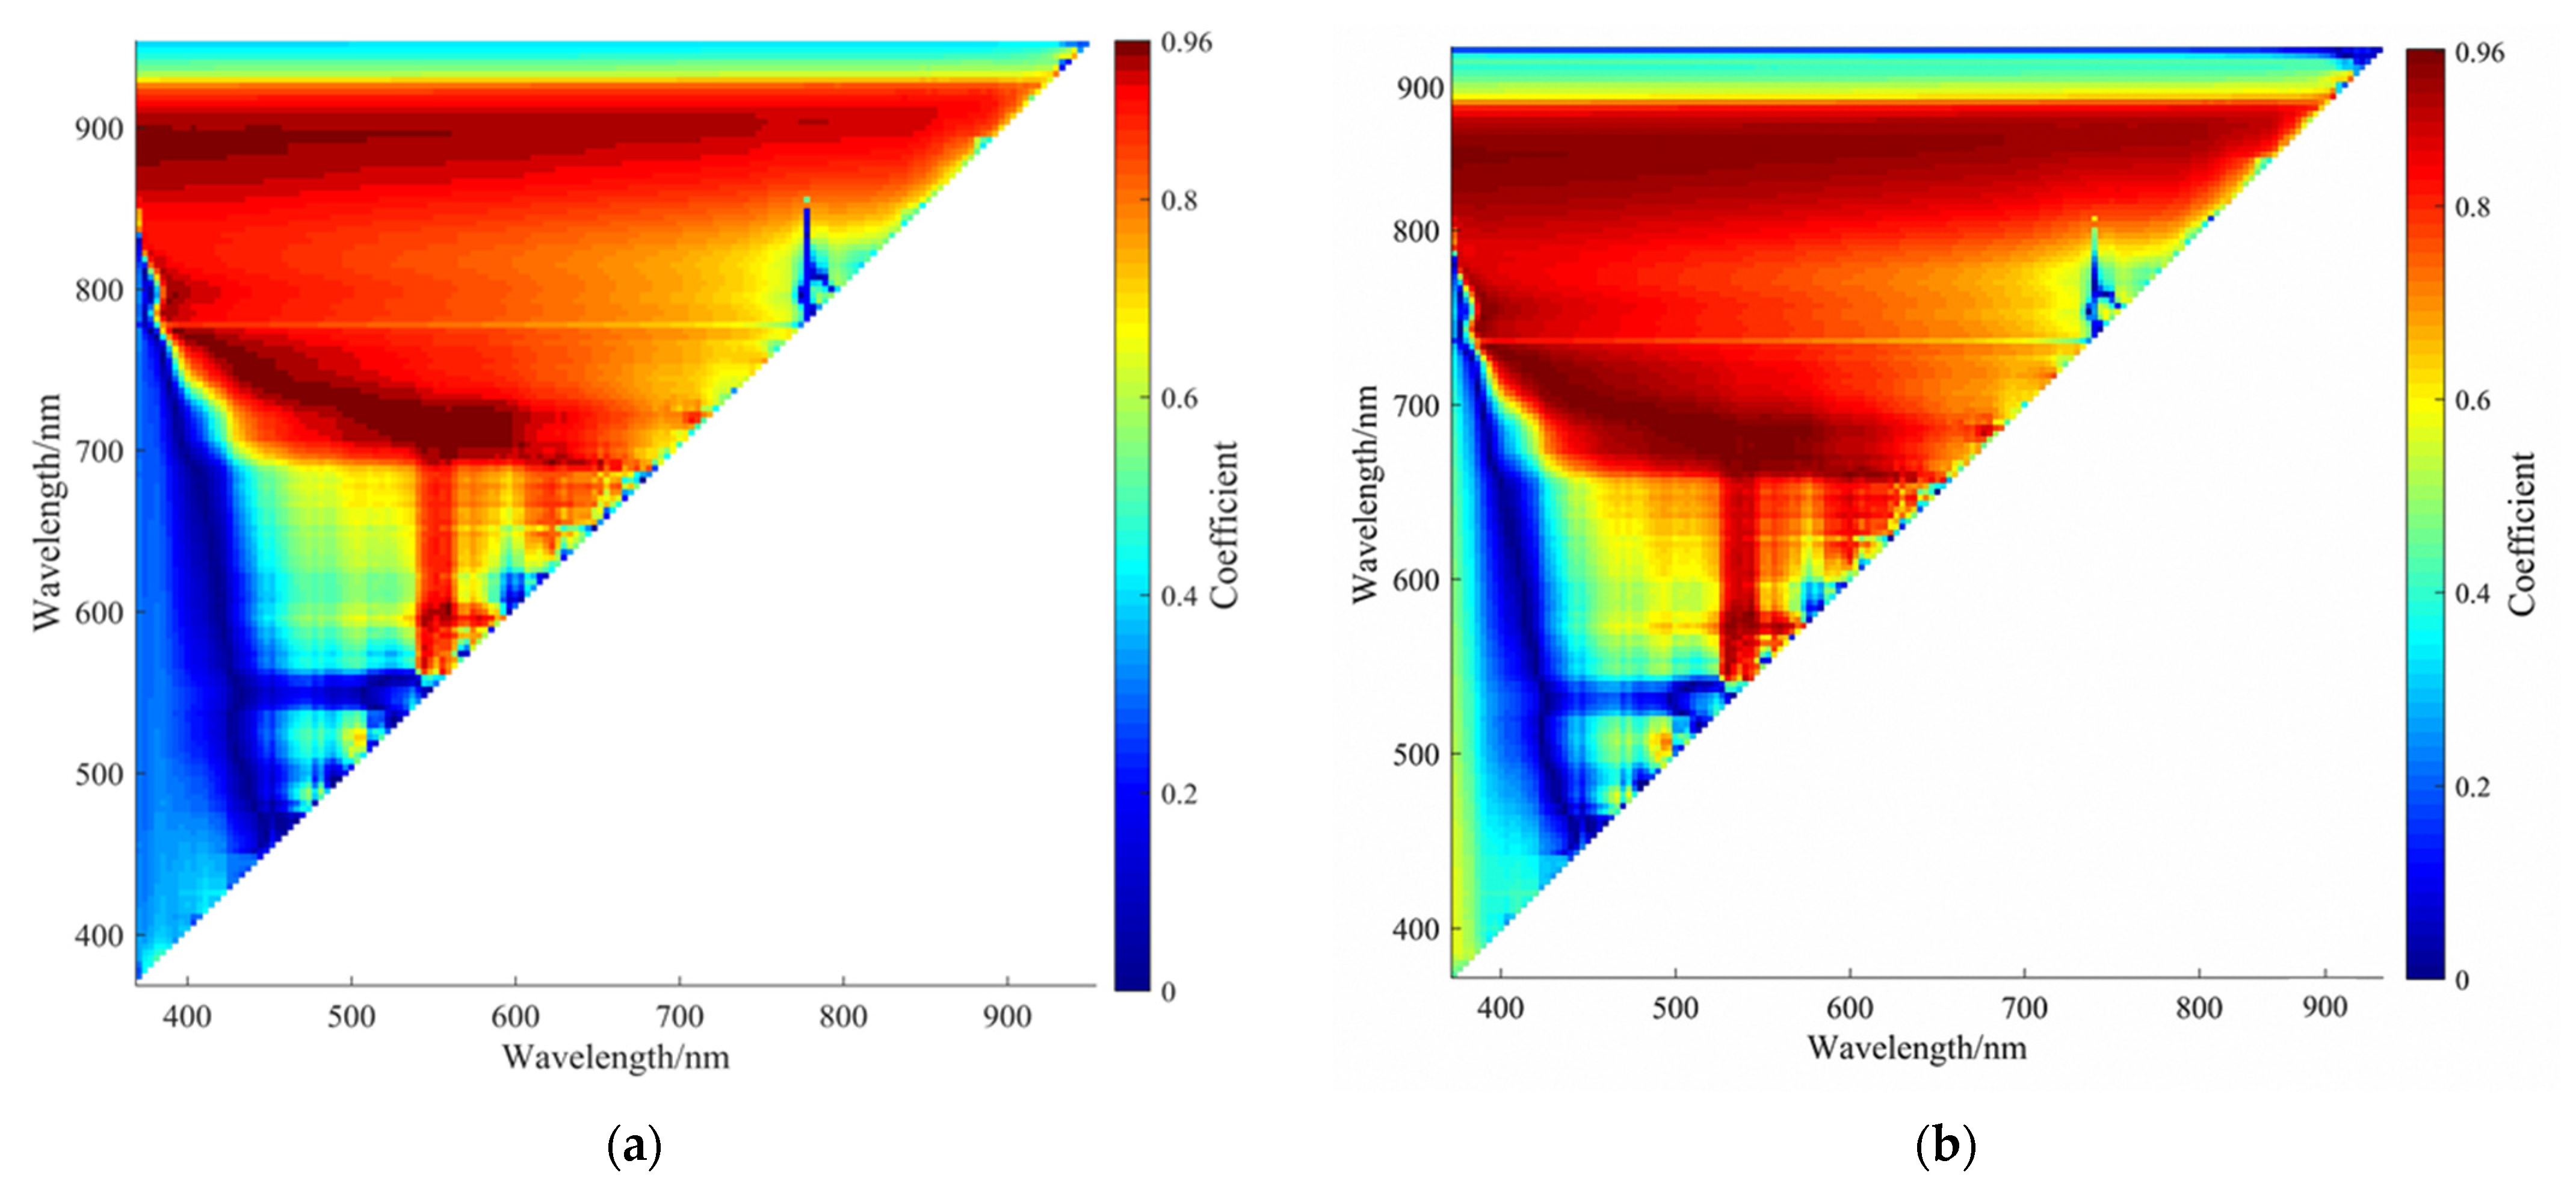
Figure 6a shows a high correlation between the hyperspectral 700 nm and 500 nm bands. After calculation, the ratio model of hyperspectral bands with 707 nm and 541 nm as independent variables was obtained, that is, the ratio model of red and green bands. This result is also consistent with Xiao’s research results [2]. Figure 6b shows the result of the normalized ratio correlation. The normalized ratio calculation in the red and NIR band ranges has a higher correlation with the concentration. Finally, the normalized ratio model consisting of 669 nm and 551 nm bands was obtained.
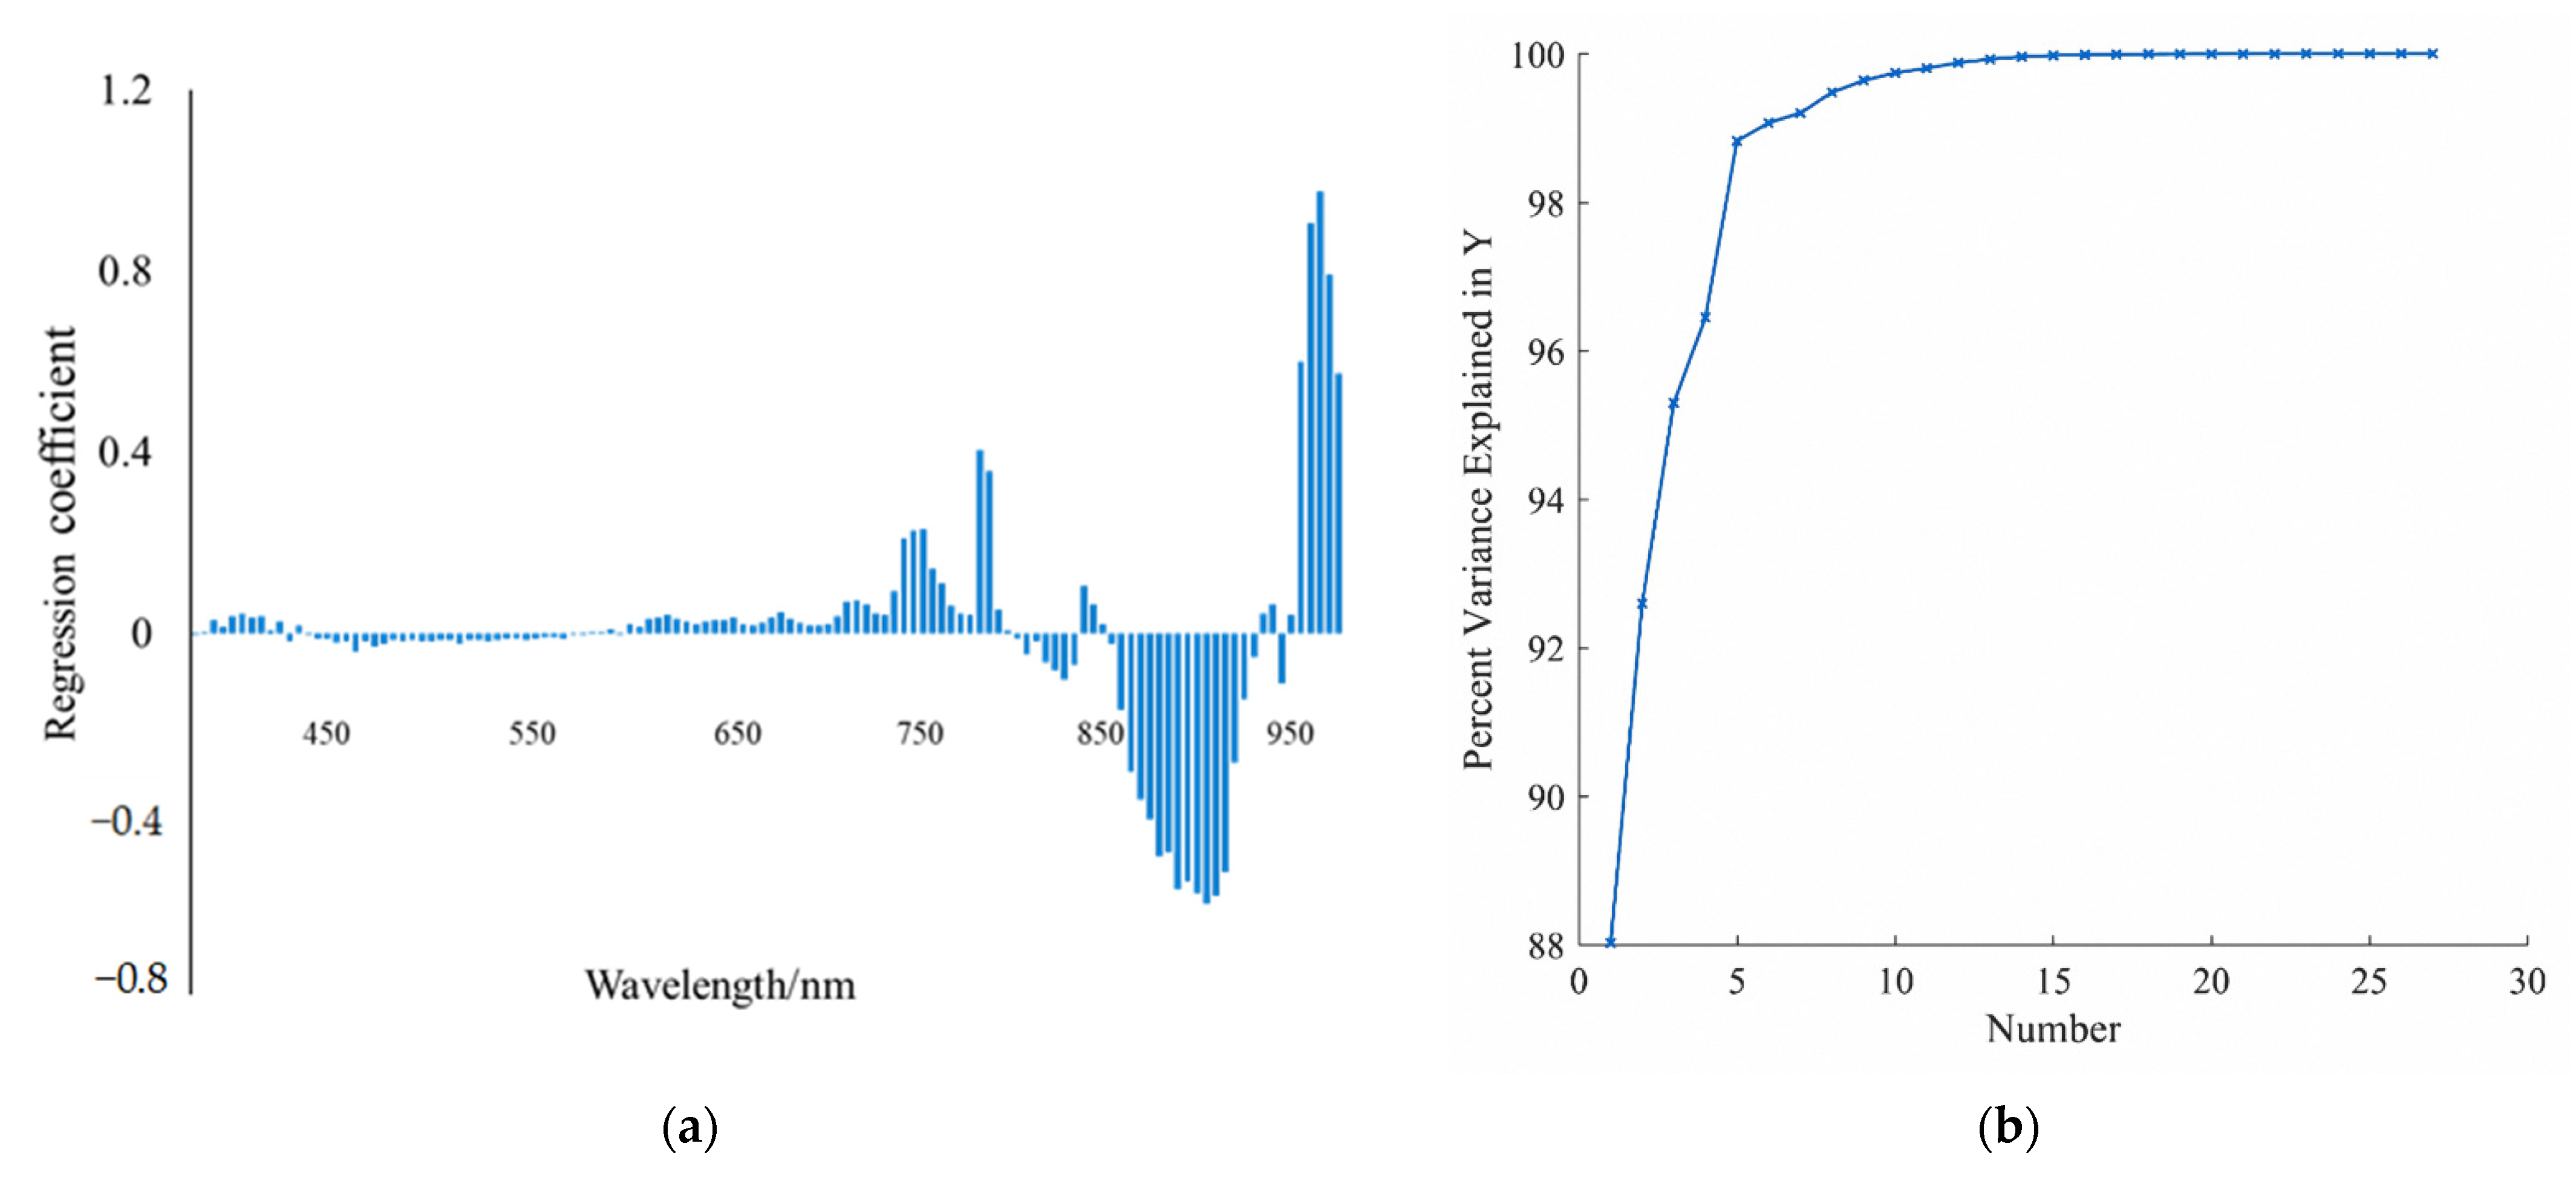
Figure 7a shows that the regression coefficients of each band in the PLS model can reflect the importance of each variable to the model. Different bands have different effects on the model [42]. The regression coefficient of each band in the hyperspectral band 450–550 nm is negative, those of 550 nm–800 nm are positive, and those of 850 nm–1000 nm are negative and then positive. The regression coefficients of all bands in the hyperspectral band are the same, and before 750 nm band, the regression coefficients fluctuate slightly around zero plus or minus. It shows that the contribution of each band of hyperspectral to the final model is relatively balanced.
According to the analysis, there are 27 principal components, and the contribution rate of principal component five reached 98%. The contribution rate from principal components 6 to 27 is less than 10%. Moreover, the slope of contribution rate from principal component five tended to be gentle, as shown in Figure 7b. This result demonstrates that when the principal component is five, it contains the most original data information. Therefore, select comps = 5 to build the model. The final model can be expressed as y= 4.8856 x1 + 1.2681x2 + 0.6599x3 + 0.7141x4 + 0.4754x5. Finally, the single-band, band ratio, normalized ratio, and PLS models of the hyperspectral imager are shown in Table 3.

4.2.2. Verification of Model Accuracy

According to the establishment of the above model, we compared the multiple linear regression models. According to the principle of maximum R2 and minimum RMSE [43], the band ratio model and the PLS hyperspectral model were selected to verify the accuracy of the measured and predicted values. We extracted the reflectance of the hyperspectral image of 18 sampling points and substituted the required band into two models to obtain the turbidity retrieval value. When compared with the measured turbidity, we obtained the correlation analysis scatter diagram of the measured and predicted turbidity value, as shown in Figure 8.
Comparing the predicted values with the measured values of the retrieval model shows that the predicted values were higher than the actual turbidity values. The MAPE was 22.46 and 19.35%, respectively, but the relative trend is consistent with the y = x standard line, R2 is 0.65 and 0.72, respectively. It shows that the two models can retrieve the turbidity of ponds, irrigation canals, and reservoirs in Dawa District of Panjin City, Liaoning Province, and the accuracy is good.

4.3. UAV Image Turbidity Retrieval Using the Optimal Model

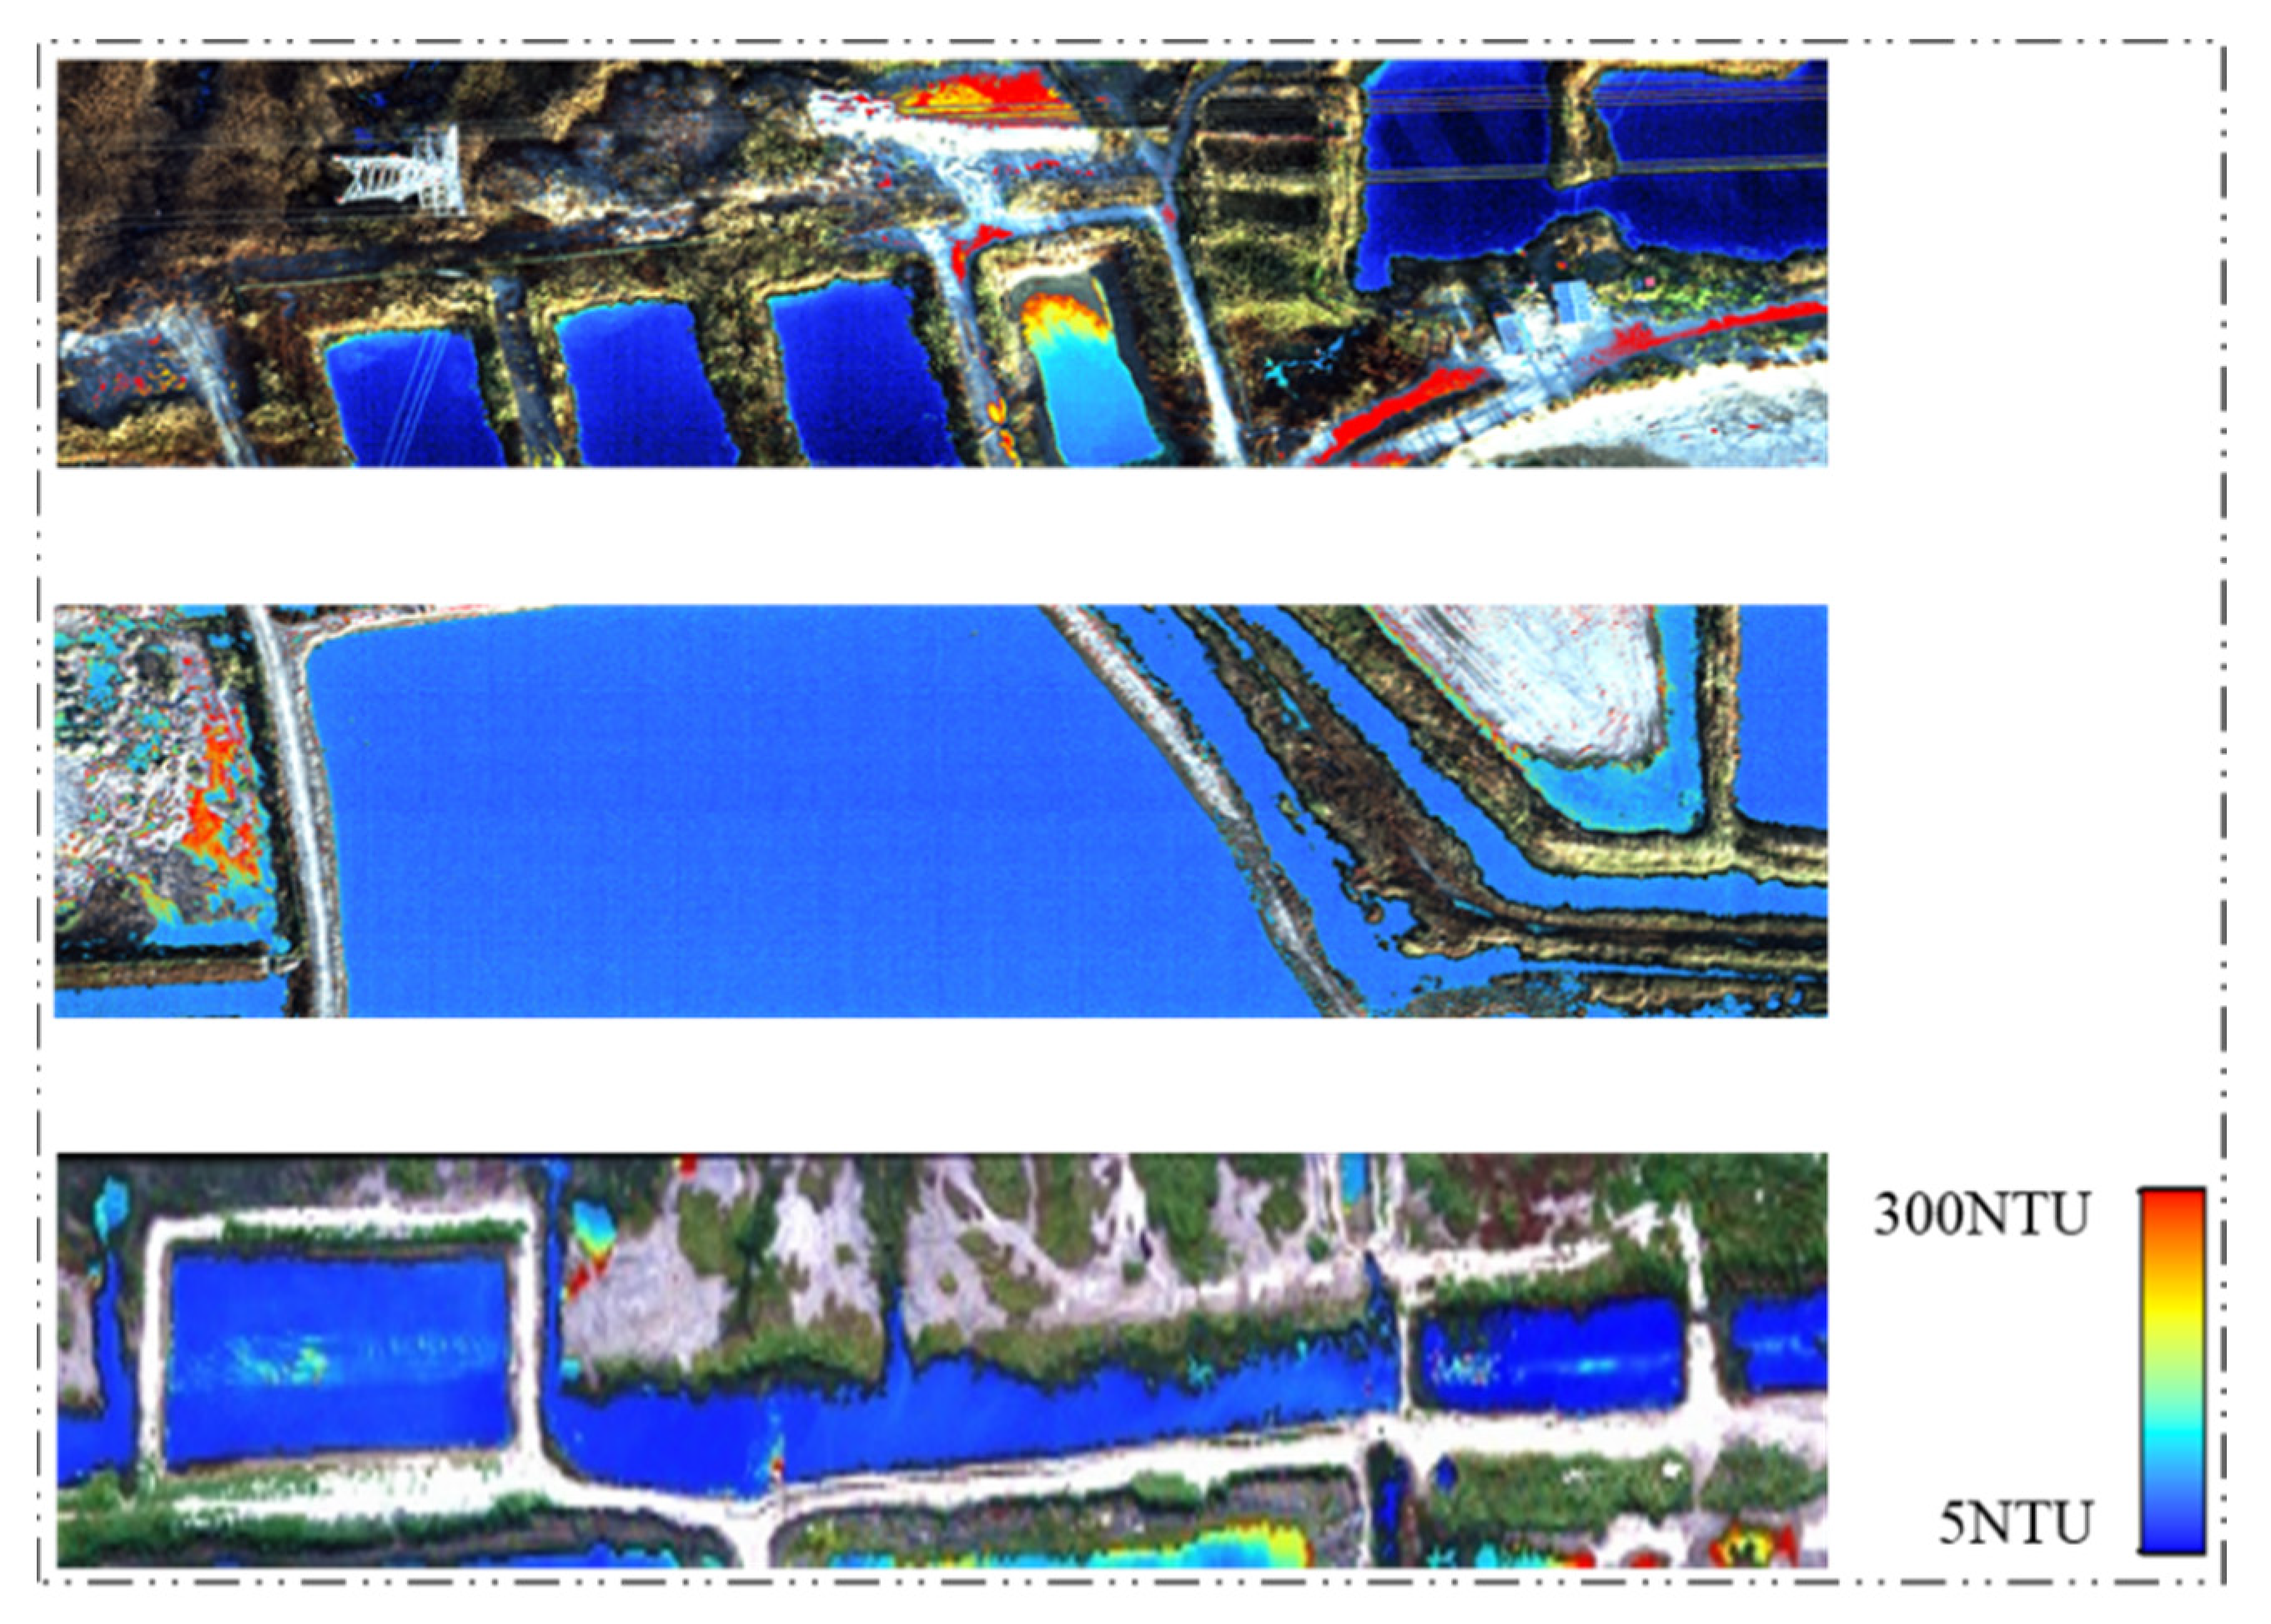
The determination coefficient R2 and the RMSE index of the standard solution turbidity PLS model constructed by the experiment are excellent. Therefore, the hyperspectral image data obtained by UAVs in the study area were combined with the model for retrieval, and the water turbidity distribution map was drawn. As shown in Figure 9, the retrieval results show that the turbidity of the water area in the study area was 5–300 NTU, and most of them were 5–80 NTU. The overall water area was relatively straightforward, and there was no apparent pollution phenomenon in the pond and ditch water area. The turbidity at the boundary of the aquaculture pond was relatively high. The high value in some areas may be due to the muddy water caused by road water and sediment. The retrieval results agree with the field water conditions, which are in line with the field investigation results.

5. Conclusions

In this study, the manual control experiment prepared twenty-nine gradients of turbidity solutions with different concentrations from 0 to 360 NTU. The hyperspectral imager collected the turbidity solution of each concentration. After that, the field UAV flight data and simultaneous sampling were carried out to obtain the field turbidity value as the verification data of this study. After analyzing the spectral characteristics and selecting the optimal band to establish the model, the single band, band ratio, normalized ratio, and PLS models were obtained, and R2 were 0.86, 0.92, 0.87, and 0.98, respectively. After comparison, the band ratio and PLS model were selected to verify the accuracy.
According to the spectral analysis of turbidity solutions with different concentrations, it can be concluded that the NIR band belongs to the sensitive band of water turbidity, which is also consistent with the previous research conclusions. In addition, the logarithmic form of the band ratio model and the PLS model R2 was higher, and the modeling accuracy was 0.92 and 0.98, respectively, which can be used in the future for further verification of sampling point accuracy. When combined with the field flight data and synchronous sampling data, the model obtained by the PLS method had a higher accuracy after being verified by sampling points, R2 is 0.72, and the band ratio model established by the red band (707 nm) and green band (541 nm) is 0.65. It can be seen that the PLS method is more accurate than the traditional modeling method. The modeling results of the artificial control experiment of the hyperspectral imager can also be used to retrieve turbidity data collected by the same instrument with high retrieval accuracy.
From the turbidity retrieval model established in this paper, the water quality parameters of small and medium-sized waters can be quickly monitored through UAV hyperspectral technology, and the retrieval results are in line with the actual situation. At the same time, the results of this study can also be used as the basis for the follow-up water quality research of similar water bodies in the Liaohe estuary. In the future, the actual water environment can be simulated by manual control experiments, such as adding a variety of water quality parameters, configuring different solution standard solutions by adjusting the concentration of various water quality parameters, collecting the corresponding hyperspectral information, and establishing the water quality retrieval model of a mixed water environment. The model established by manual control makes the experiment closer to the actual situation of a field water body. UAVs can obtain real-time image data with a high spatial and temporal resolution, which can be used for the monitoring and early warning of aquaculture and irrigation water pollution and has essential reference significance for wetland environmental protection.

Author Contributions

This work presented here was carried out by collaborations among all authors. Y.S. and M.C. conceived the idea. M.C., Y.S., C.H. and M.L. worked together on associated data and carried out the experimental work. M.C. drafted the manuscript. C.H. and M.L. provided their experience and co-wrote the paper with M.C. All authors have read and agreed to the published version of the manuscript.

Funding

This research received no external funding.

Acknowledgments

This work is supported in part by the National Key Research and Development Project of the 13th Five-Year Plan—Songliao River Lake Reservoir Water Resources Joint Regulation Platform and Demonstration (2017YFC0406006), The 13th Five-Year National Key Research and Development Program Project—River and Estuary Pollution Tracing and Control Planning (2017YFC0406004), Beijing Outstanding Young Scientists Program (BJJWZYJH01201910028032) and Remote Sensing Interpretation of Nanchang City in 2019.

Conflicts of Interest

The authors declare that they have no known competing financial interest or personal relationships that could have appeared to influence the work reported in this paper.

References

  1. Allam, M.; Khan, M.Y.A.; Meng, Q. Retrieval of Turbidity on a Spatio-Temporal Scale Using Landsat 8 SR: A Case Study of the Ramganga River in the Ganges Basin, India. Appl. Sci. 2020, 10, 3702. [Google Scholar] [CrossRef]
  2. Xiao, X.; Xu, J.; Zhao, D.Z.; Zhao, B.C.; Xu, J.; Cheng, X.J.; Li, G.Z. Research on Combined Remote Sensing Retrieval of Turbidity for River Based on Domestic Satellite data. J. Yangtze River Sci. Res. Inst. 2021, 38, 128. [Google Scholar]
  3. Yin, Q.; Gong, C.L.; Kuang, D.B.; Zhou, N.; Hu, Y.; Zhang, F.L.; Xu, W.D.; Ma, Y.Q. Method of Satellite Remote Sensing of Lake Water Quality and Its Applications. J. Infrared Millim. Waves 2005, 24, 198–202. [Google Scholar]
  4. Güttler, F.N.; Niculescu, S.; Gohin, F. Turbidity Retrieval and Monitoring of Danube Delta Waters Using Multi-Sensor Optical Remote Sensing Data: An Integrated View from the Delta Plain Lakes to the Western-Northwestern Black Sea Coastal Zone. Remote Sens. Environ. 2013, 132, 86–101. [Google Scholar] [CrossRef] [Green Version]
  5. Li, S.J.; Wang, X.J. The Spectral Features Analysis and Quantitative Remote Sensing Advances of Inland Water Quality Parameters. Geogr. Territ. Res. 2002, 18, 26. [Google Scholar]
  6. Ai, Y.S.; Shen, Y.L. Measurement Uncertainty-Aware Quantitative Remote Sensing Inversion to Retrieve Suspended Matter Concentration in Inland Water. Acta Opt. Sin. 2016, 36, 18–28. [Google Scholar]
  7. Wang, X.P.; Zhang, F.; Abduwasit, G.Y.; Yu, H.; Ren, Y.; Wang, J.; Zhang, Y. The Relationship Between the Surface Water Quality Indices and Hydrology of Ebinur Lake Watershed. Acta Sci. Circumstantiae 2017, 37, 900–909. [Google Scholar]
  8. Sibanda, M.; Mutanga, O.; Chimonyo, V.G.P.; Clulow, A.D.; Shoko, C.; Mazvimavi, D.; Dube, T.; Mabhaudhi, T. Application of Drone Technologies in Surface Water Resources Monitoring and Assessment: A Systematic Review of Progress, Challenges, and Opportunities in the Global South. Drones 2021, 5, 84. [Google Scholar] [CrossRef]
  9. Xu, P.; Du, P.; Shen, Q.; Xu, Z.B. Research on Remote Sensing Inversion Mode of Suspended Matter Density and Turbidity based on GF-1 WFV Image Data in Hunhe River. J. Shenyang Norm. Univ. (Nat. Sci. Ed.) 2017, 35, 180–184. [Google Scholar]
  10. Goodin, D.G.; Harrington, J.A.; Nellis, M.D.; Rundquist, D. Mapping Reservoir Turbidity Patterns Using SPOT-HRV Data. Geocarto Int. 1996, 11, 71–78. [Google Scholar] [CrossRef]
  11. Kornelia, A.W.; Robert, J.B.; Maria, O.; Marek, F. Investigation of Sediment-Rich Glacial Meltwater Plumes Using a High-Resolution Multispectral Sensor Mounted on an Unmanned Aerial Vehicle. Water 2019, 11, 2405. [Google Scholar]
  12. Jiang, Q.; Cao, Y.; Zhao, H.L.; Jiang, Y.Z.; Mao, W.S.; Zhu, Y.R. Modeling of Turbidity Retrieval of Hulunnaoer Lake Based on Airborne Hyperspectral Imagery. South-North Water Transf. Water Sci. Technol. 2020, 111, 105–113. [Google Scholar]
  13. Song, T.; Shi, J.Z.; Liu, Z.J.; Xu, W.Y.; Yan, F.; Xu, C.; Zhu, B.C. Research on Remote Sensing Quantitative Inversion Models of Blue-Green Algae Density and Turbidity Based on Landsat-8 OLI Image Data in Lake Taihu. Saf. Environ. Eng. 2015, 22, 67–71. [Google Scholar]
  14. Feng, Q.; Cheng, X.J.; Shen, X.; Xiao, X.; Wang, L.H.; Zhang, W. Inland Riverine Turbidity Estimation for Hanjiang River with Landsat 8 OLI Image. Geomat. Inf. Sci. Wuhan Univ. 2017, 42, 643–647. [Google Scholar]
  15. Wang, P.; Luo, X.W.; Zhou, Z.Y.; Zang, Y.; Hu, L. Key Technology for Remote Sensing Information Acquisition based on Micro UAV. Trans. Chin. Soc. Agric. Eng. 2014, 30, 1–12. [Google Scholar]
  16. Wang, F.; Wu, Y.D. Research and Application of UAS Borne Remote Sensing. Remote Sens. Inf. 2010, 2, 114–118. [Google Scholar]
  17. Li, X.M.; Zhang, J.; Ma, Y.; Ren, G.B. Study on Monitoring Alien Invasive Species Spartina Alterniflora using Unmanned Aerial Vehicle Hyperspectral Remote Sensing-a Case Study of the Yellow River Delta. Mar. Sci. 2017, 41, 98–107. [Google Scholar]
  18. Shi, H.; Li, X.W.; Niu, Z.C.; Li, W.Z.; Wang, T.T.; Zhang, Y. Preliminary Study on Remote Sensing Information Extraction of Urban Water Environment based on Micro UAV Images. Environ. Monit. China 2018, 34, 141–147. [Google Scholar]
  19. Yang, Z.; Lu, X.P.; Wu, Y.B.; Miao, P.J.; Zhou, J.L. Retrieval and Model Construction of Water Quality Parameters for UAV Hyperspectral Remote Sensing. Sci. Surv. Mapp. 2020, 267, 64–68, 99. [Google Scholar]
  20. Chen, W.; Yan, L.; Gou, Z.Y.; Zhao, H.Y.; Liu, D.P.; Duan, Y.N. In-Flight Absolute Radiometric Calibration of UAV Multispectral Sensor. Spectrosc. Spectr. Anal. 2012, 32, 3169–3174. [Google Scholar]
  21. Mark, P.; Dmitry, B.; Kevin, G.; Felipe, G. UAVs, Hyperspectral Remote Sensing, and Machine Learning Revolutionizing Reef Monitoring. Sensors 2018, 18, 2026. [Google Scholar]
  22. McFeeters, S.K. The Use of the Normalized Difference Water Index (NDWI) in the Delineation of Open Water Features. Int. J. Remote Sens. 1996, 17, 1425–1432. [Google Scholar] [CrossRef]
  23. Heiden, U.; Segl, K.; Roessner, S.; Kaufmann, H. Determination of Robust Spectral Features for Identification of Urban Surface Materials in Hyperspectral Remote Sensing Data. Remote Sens. Environ. 2007, 111, 537–552. [Google Scholar] [CrossRef] [Green Version]
  24. Cheng, Y.M.; Wei, Y.C.; Zhang, J.; Sun, X.P.; Zhou, Y. A First Derivative Estimation Model of Chlorophyll-a Concentration in Turbidity Water Based on Spectral Smoothing. Geogr. Geo-Inf. Sci. 2013, 29, 30–34. [Google Scholar]
  25. Bhargava, D.S.; Mariam, D.W. Light Penetration Depth, Turbidity and Reflectance Related Relationship and Models. ISPRS J. Photogramm. Remote Sens. 1991, 46, 217–230. [Google Scholar] [CrossRef]
  26. Duan, H.T.; Wen, Y.; Zhang, B.; Song, K.S.; Wang, Z.M. Application Hyperspectral Data in Remote Sensing Inverse of Water Quality Variables in Lake Chagan. J. Arid Land Resour. Environ. 2006, 20, 104–108. [Google Scholar]
  27. Joshi, I.D.; D’Sa, E.J.; Osburn, C.L.; Bianchi, T.S. Turbidity in Apalachicola Bay, Florida from Landsat 5 TM and Field Data: Seasonal Patterns and Response to Extreme Events. Remote Sens. 2017, 9, 367. [Google Scholar] [CrossRef] [Green Version]
  28. Rodrigues, G.; Potes, M.; Costa, M.J.; Novais, M.H.; Morais, M.M. Temporal and Spatial Variations of Secchi Depth and Diffuse Attenuation Coefficient from Sentinel-2 MSI over a Large Reservoir. Remote Sens. 2020, 12, 768. [Google Scholar] [CrossRef] [Green Version]
  29. Li, S.J.; Wu, Q.; Wang, X.J.; Piao, X.Y.; Dai, Y.N. Correlations Between Reflectance Spectra and Contents of Chlorophyll-a in Chaohu Lake. J. Lake Sci. 2002, 14, 228–234. [Google Scholar]
  30. Shu, X.Z.; Yin, Q.; Kuang, D.B. Relationship between Algal Chlorophyll Concentration and Spectral Reflectance of Inland Water. J. Remote Sens. 2000, 4, 41–45. [Google Scholar]
  31. Liu, Y.; Wang, K.; Zhou, B.; Xu, H.W.; Shen, Z.Q. Preliminary Study on Hyperspectral Remote Sensing of Qiandao Lake Chlorophyll-a Concentration. J. Zhejiang Univ. (Agric. Life Sci.) 2003, 29, 621–626. [Google Scholar]
  32. Pulliainen, J.; Kallio, K.; Eloheimo, K.; Koponen, S.; Hallikainen, M. A Semi-Operative Approach to Lake Water Quality Retrieval from Remote Sensing Data. Sci. Total Environ. 2001, 268, 79–93. [Google Scholar] [CrossRef]
  33. Koponen, S.; Pulliainen, J.; Kallio, K.; Hallikainen, M. Lake Water Quality Classification with Airborne Hyperspectral Spectrometer and Simulated MERIS Data. Remote Sens. Environ. 2002, 79, 51–59. [Google Scholar] [CrossRef]
  34. Cao, Y.; Ye, Y.T.; Zhao, H.L.; Shi, Y.B.; Jiang, Y.Z. Remote-Sensing Retrieval Method of Suspended Solid Concentration and Turbidity in Lakes and Reservoirs based on Discrete Particle Swarm and Partial Least Squares. J. Hydroelectr. Eng. 2015, 34, 77–87. [Google Scholar]
  35. Bi, S.; Li, Y.M.; Lv, H.; Zhu, L.; Mu, M.; Lei, S.H.; Xu, J.; Wen, S.; Ding, X.L. Estimation of Chlorophyll-a Concentration in Lake Erhai based on OLCI Data. J. Lake Sci. 2018, 30, 123–134. [Google Scholar]
  36. Fu, H.J. Comparison of Lake Turbidity Inversion Based on GF-1 and Landsat-8 Satellite Images. Geomat. Spat. Inf. Technol. 2017, 40, 109–112. [Google Scholar]
  37. Yin, C.; Tao, Y.Y.; Juan, X.Z.; Bo, Y.S.; Zhong, Y.J.; Li, H.Z. Quantitative Inversion Model of Hyperspectral for Turbidity in the Nansi Lake. South-North Water Transf. Water Sci. Technol. 2015, 13, 883–887. [Google Scholar]
  38. Yong, H.; Xiao, S.; Nie, P.; Tao, D.; Qu, F.; Lei, L. Research on the Optimum Water Content of Detecting Soil Nitrogen using Near Infrared Sensor. Sensors 2017, 17, 2045. [Google Scholar]
  39. Wang, J.Z.; Shi, T.Z.; Yu, D.L.; Teng, D.X.; Ge, X.Y.; Zhang, Z.P.; Yang, X.D.; Wang, H.X.; Wu, G.F. Ensemble Machine-Learning-Based Framework for Estimating Total Nitrogen Concentration in Water Using Drone-Borne Hyperspectral Imagery of Emergent Plants: A Case Study in an Arid Oasis, NW China. Environ. Pollut. 2020, 266, 115412. [Google Scholar] [CrossRef] [PubMed]
  40. Liu, X.; Zhang, B.; Gao, L.R.; Chen, D.M. An Improved Noise Evaluation Algorithm of Hyperspectral Image Based on MNF. Sci. China Press 2009, 39, 1305–1313. [Google Scholar]
  41. Pal, M.K.; Porwal, A.; Rasmussen, T.M. Noise Reduction and Destriping Using Local Spatial Statistics and Quadratic Regression from Hyperion Images. J. Appl. Remote Sens. 2020, 14, 1. [Google Scholar] [CrossRef] [Green Version]
  42. Liu, Z.H.; Li, Y.M.; Lv, H.; Xu, Y.F.; Xu, X.; Huang, J.Z.; Tan, J.; Guo, Y.L. Inversion of Suspended Matter Concentration in Lake Chaohu based on Partial Least-Squares Regression. J. Lake Sci. 2011, 23, 357–365. [Google Scholar]
  43. Wang, H.W.; Wang, B.; Ji, T.; Xu, J.; Ju, F.; Wang, C.L. Simulation Estimation of BOD Content in Water Based on Hyperspectra. Spectrosc. Spectr. Anal. 2021, 41, 978–983. [Google Scholar]
Figure 1. The location of the study area.
Water 14 00128 g001
Figure 2. UAV flight data in the study area, according to the R, G, B band, the corresponding bands are the 77th, 50th, and 26th bands, and the wavelengths are 642, 551, and 472 nm, respectively.
Water 14 00128 g002
Figure 3. Flow chart of turbidity model construction and validation.
Water 14 00128 g003
Figure 4. The estimated noise standard deviation of hyperspectral reflectance image.
Water 14 00128 g004
Figure 5. Reflectance curve of hyperspectral imager turbidity standard solution.
Water 14 00128 g005
Figure 6. The correlation coefficient distribution, (a) is the distribution of the ratio correlation coefficient in the hyperspectral band; (b) is the distribution of the normalized ratio correlation coefficient in the hyperspectral band.
Water 14 00128 g006
Figure 7. The regression coefficient of PLS model, (a) is each band’s regression coefficient; (b) is the variance explained rate of each principal component.
Water 14 00128 g007
Figure 8. Analysis of the predicted value of turbidity retrieval, (a) is the result of hyperspectral band ratio model; (b) is the result of PLS Hyperspectral retrieval model.
Water 14 00128 g008
Figure 9. Local turbidity retrieval map of UAV images in PLS model.
Water 14 00128 g009
Table 1. Turbidity statistics of sampling points.
Sampling TimeLocationNumbersMax/NTUMin/NTUAverage/NTU
2019.09121°59′44″–121°59′51″ E, 40°48′38″–40°48′51″ N1040.473.2618.32
2020.10121°57′8″–121°57′15″ E, 40°47′14″–40°47′20″ N856.373.225.42
Table 2. Basic Statistical Indicators.
NameFormula
Determination coefficient (R2) R 2 = i = 1 n ( y i y i ¯ ) 2 i = 1 n ( y i y i ¯ ) 2
Root mean square error (RMSE) R M S E = 1 n i = 1 n ( y i y i ) 2
Mean bias error (MBE) M B E = 1 n [ i = 1 n ( y i y i ¯ ) 2 n ]
Mean absolute percent error (MAPE) M A P E = 1 n i = 1 n | y i y i y i | × 100 %
where i represents the serial number of validation sample points, and n represents the number of validation samples, y i is the predicted turbidity value,   y i is the observed turbidity value,   y i ¯ is the mean of the observed turbidity value.
Table 3. Hyperspectral imager model and modeling accuracy.
Model TypeEquation FormR2RMSE/NTUMBEMAPE/%
Single bandT = 17.9 × e19.5 × Rrs (809)0.8645.6628.54
Band ratio T = 1305.1 ×   I n   R r s   ( 707 ) R r s   ( 541 ) )+876.20.923.675.2312.93
Normalized ratio T = 4633.6 ×   R r s   ( 669 ) R r s   ( 551 ) R r s   ( 669 ) + R r s   ( 551 ) +936.70.878.823.6120.26
PLS 0.986.093.8115.4
where T is the abbreviation of turbidity.
Publisher’s Note: MDPI stays neutral with regard to jurisdictional claims in published maps and institutional affiliations.