Article

Identifying Spatial Patterns of Hydrologic Drought over the Southeast US Using Retrospective National Water Model Simulations

1
Department of Geosciences, Mississippi State University, Mississippi State, MS 39762, USA
2
Northern Gulf Institute, Mississippi State University, Starkville, MS 39759, USA
*
Author to whom correspondence should be addressed.
Water 2022, 14(10), 1525; https://doi.org/10.3390/w14101525
Submission received: 8 April 2022 / Revised: 28 April 2022 / Accepted: 5 May 2022 / Published: 10 May 2022

Abstract

:
Given the sensitivity of natural environments to freshwater availability in the Southeast US, as well as the reliance of many municipal and commercial water consumers on surface water supplies, specific issues related to low river streamflow are apparent. As a result, the need for quantifying the spatial distribution, frequency, and intensity of low flow events (a.k.a., hydrologic drought) is critical to define areas most susceptible to water shortages and subsequent environmental and societal risk. To that end, daily mean discharge values from the National Water Model (NWM) retrospective data (v. 2.0) are used to assess low flow frequency, intensity, and spatial distribution within the Southeast US. Low flow events are defined using the US EPA 7Q10 approach, based on the flow duration curve (FDC) developed using a 1993–2018 period of record. Results reflect the general climatological patterns of the region, with a higher probability of low flow events occurring during the warm season (June–August) while low flow events in the cool season (January–March) are generally less common and have a higher average discharge. Spatial analysis shows substantial regional variability, with an area from southeastern Mississippi through central South Carolina showing higher low flow event frequency during the cool season. This same area is also highlighted in the warm season, albeit along a more expansive area from central Alabama into the piedmont region of North Carolina. Results indicate that the NWM retrospective data are able to show general patterns of hydrologic drought across the Southeast US, although local-scale assessment is limited due to potential issues associated with infiltration and runoff during periods of warm-season convective rainfall.

1. Introduction

The Southeast United States (US) is a heterogeneous landscape that incorporates expansive urban areas, large swaths of both deciduous and evergreen forests, as well as highly productive agricultural regions. Despite the humid sub-tropical climate, characterized by high mean annual precipitation, industrial, commercial, and ecological sustainability is highly sensitive to water resources due to the inherent need for water to meet energy, consumer, and environmental demands [1]. This issue continues to evolve as climate variability impacts hydrologic processes and patterns over the region [2,3]. While extreme events such as river or flash floods do present an ever-present danger to some communities, especially those adjacent to surface water features or low-lying areas, the impact of drought and subsequent limited water availability has drastic impacts to both societal and natural systems globally [4,5,6,7,8,9].
While drought can take many forms, depending on the specific anomaly where the lack of water is manifest (i.e., low precipitation—meteorological drought; low streamflow—hydrological drought; low soil moisture—agricultural drought), hydrological drought is often considered a primary descriptor for water stress due to its relatively straight-forward quantification and direct societal impacts [10]. Unfortunately, however, the drivers associated with the onset and maintenance of hydrological drought are often complex, as they include factors associated with precipitation patterns, surface and subsurface runoff characteristics, evapotranspiration (which is further associated with vegetation), and soil type [11]. Given the complex nature of defining the probability of hydrologic drought, especially for future climate scenarios where water demands will undoubtedly increase due to growing populations and increased water consumption [12,13], it is necessary to define the established long-term patterns of low streamflow conditions for both baseline analysis and recognition of trends.
While surface-based observations of streamflow exist over a relatively dense network over the Southeast US, mainly from the US Geological Survey (USGS), gauges are generally located over larger river systems or concentrated within urban areas due to the expense of installing and maintaining such equipment. As a result, investigations of regional and local-scale hydrologic systems generally requires investment in additional gauges and/or modeling studies [14,15]. While the former approach is usually limited by cost—associated with purchasing, installing, and maintaining a gauge network—the latter approach is often limited by expertise in designing the modeling framework and verifying model output, as well as the limitations of the model itself. Although many hydrologic modeling systems are available for use in research applications, they often have substantial parameterization and data requirements; therefore, they are generally only practical for local-scale studies as the model is calibrated for watershed characteristics representative of a limited geographical area. Alternatively, the Weather Research and Forecasting (WRF) hydrologic modeling system (WRF-Hydro) provides a hydrological simulation framework that can be applied to a larger area due to its lower data requirements and more generalized parameterization schemes. This is one of the reasons why WRF-Hydro is used as the framework for the National Water Model (NWM) [16].
The NWM produces operational products at various length and spatial scales across the US and associated territories, and is a groundbreaking undertaking given its ability to provide hourly predictions of streamflow at over 2.7 million stream segments along with predictions of associated surface variables such as soil moisture and runoff. While the system is continuously evolving and updating through improved WRF-Hydro model code and initial meteorological and surface condition datasets, retrospective data based on past versions of the NWM model code are publicly available for research applications [17]. While the use of retrospective, or reanalysis, datasets for scientific investigations is a well-established approach in the atmospheric sciences (i.e., [18,19]), such an approach for hydrologic applications is relatively new. Past studies using the NWM retrospective data have focused on evaluating the accuracy of the data relative to observations [20,21,22], while others have been limited to high-streamflow [23] or low-streamflow events [24]. While the latter studies are useful for defining the performance of the NWM in extreme hydrologic cases, the limited spatial extent means the results may not be applicable to other regions. Despite this, the NWM retrospective data show tremendous promise as a research data source for hydrologic studies, and fill important gaps in available observed and simulated data sources.
The primary objectives of this project are to utilize the NWM retrospective data (v.2.0) to investigate the variability of defined low streamflow events (a.k.a., hydrologic drought) over the Southeast US and to quantify the patterns and potential causes of such variability over a humid, subtropical region. Additionally, to verify the representativeness of the retrospective data over the Southeast US in terms of low streamflow prediction, low-flow metrics calculated using the retrospective data will be compared with associated metrics calculated using observed USGS data. A similar approach was taken by [24] over the Colorado River Basin (CRB), so this research will provide an additional assessment of the NWM retrospective data in terms of hydrologic drought, albeit over a different climatological region. The results of the study will provide valuable information regarding areas within the Southeast US where hydrologic drought is more frequent and/or intense, which can be used to define locations with existing or potential future water resource issues.

2. Materials and Methods

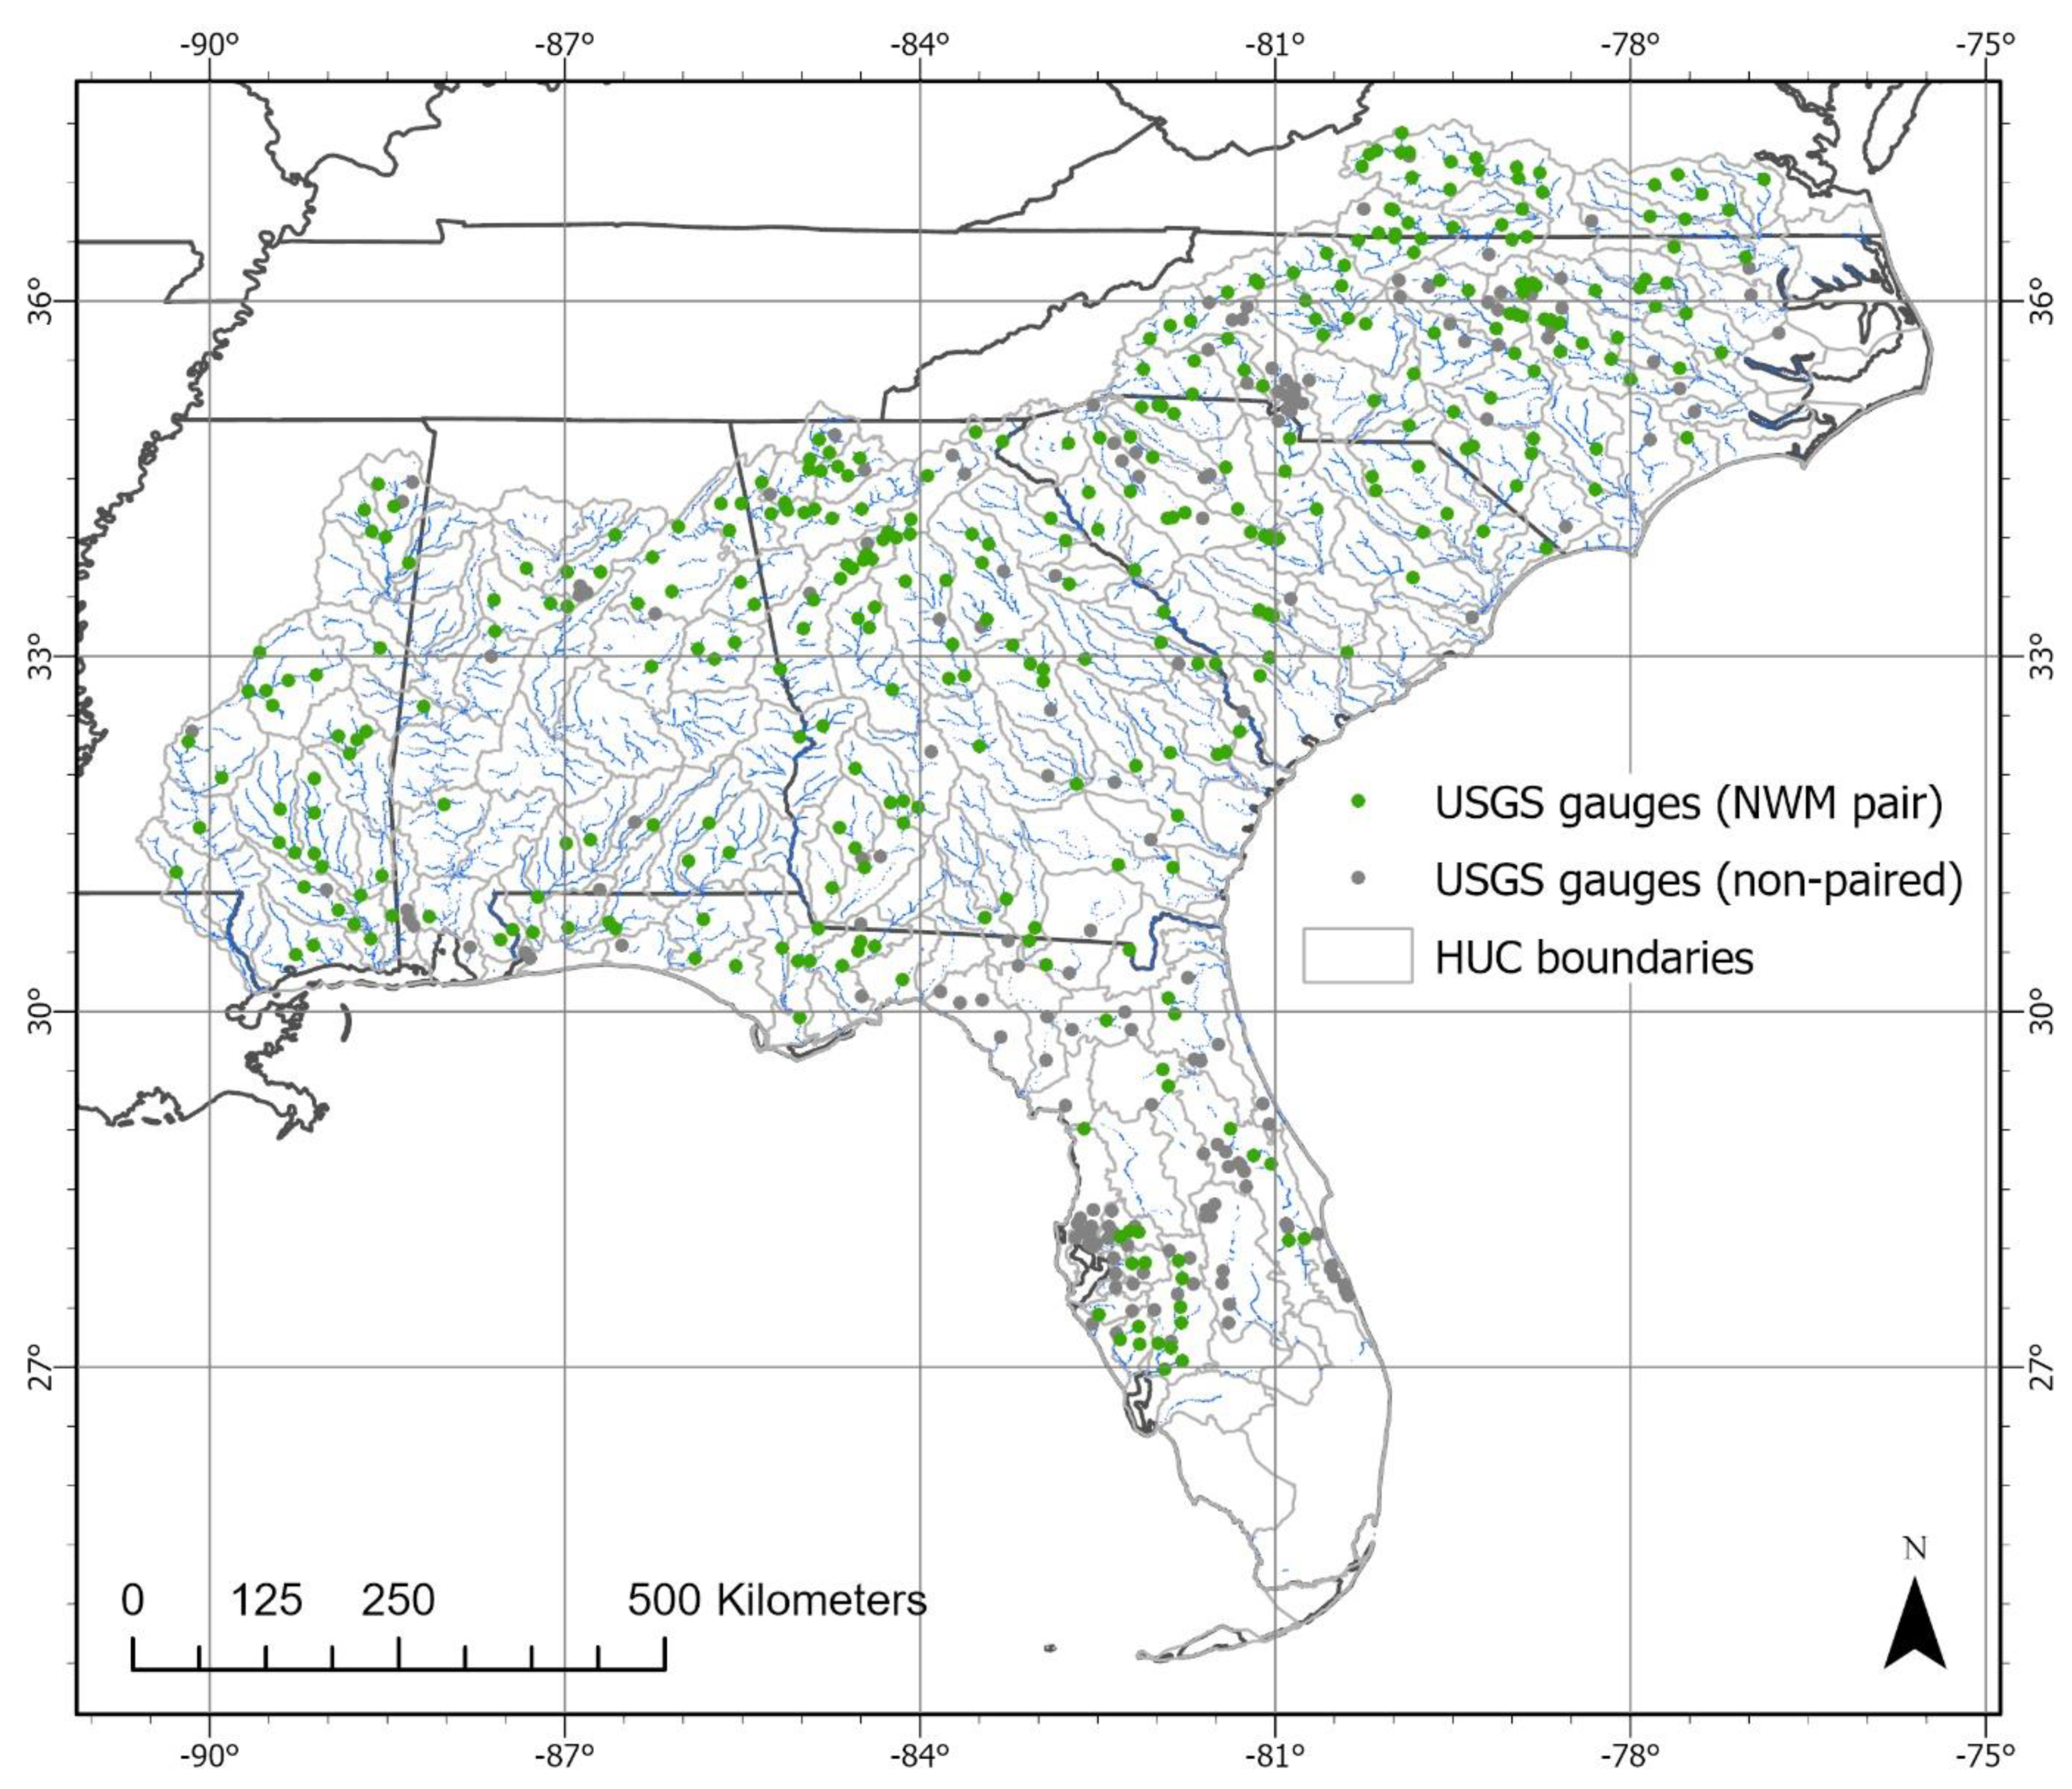
2.1. Hydrologic Data

At the time of the initial development of this project, the two available versions of the NWM retrospective data included v1.2 (January 1993–December 2017 period of record) and v2.0 (January 1993–December 2018), both of which use the North American Land Data Assimilation (NLDAS) dataset for meteorological forcing [25]. To incorporate as long a period of record as possible while utilizing updated model parameterizations, v2.0 of the NWM retrospective v2.0 dataset were used [17]. It should be noted that at the time of writing, the NWM retrospective v2.1 data became available (February 1979–December 2020 period of record), which uses the Analysis of Record for Calibration (AORC) dataset from the office of Water Prediction (OWP) for meteorological forcing [26]. Despite this release, the use of v2.0 was maintained with the expectation that v2.1 will be used for future research.
The simulations for the NWM v.2.0 retrospective data are initialized using the NLDAS dataset [25], similar to the operational version of the NWM [16]; however, unlike the operational simulations, no data assimilation is performed. This version of the retrospective data is based on WRF-Hydro v.5.1, which uses the Noah-Multi Process (Noah-MP) land surface model [27] to simulate characteristics such as soil moisture and temperature, canopy water content, surface energy and moisture fluxes, and runoff at a spatial resolution of 1-km. Hydrologic routing algorithms then simulate surface and saturated subsurface flow at the same spatial resolution, while a channel routing module and a simplified weir-based lake/reservoir scheme [28] provide channel-based river discharge and water velocity at 250-m stream segments based on the National Hydrography Dataset (NHD)-Plus geospatial stream network [29]. All simulated variables are provided at an hourly temporal resolution; however, the data are transformed into daily average values by calculating the mean from the associated 24 hourly values corresponding to 00z–23z for each day.
While the NWM retrospective data cover all watersheds that drain into the continental US, providing a total of approximately 2.73 million stream segments, the study region for this project is limited to the Southeast US. To maintain hydrologic continuity, the study region is specifically limited to USGS Region 3 (South Atlantic–Gulf Region) based on the USGS hydrologic unit maps (Hydrologic Unit Code (HUC)-2 definitions) [30]. This region is defined as the area where water ultimately drains into the Atlantic Ocean within and between Virginia and Florida or the Gulf of Mexico within and between Florida and Louisiana, comprising a total area of approximately 722,000 km2 (Figure 1). This region contains 338,037 NWM stream segments, most of which are along small headwater or ephemeral streams; therefore, to limit the study to river reaches likely to have a viable low-flow pattern, only those stream segments with a Strahler stream order ≥4 are retained for analysis. This results in a total of 33,579 total stream segments, with the distribution based on stream order shown in Table 1.
Historical observed discharge data were obtained from USGS gauges recording daily average streamflow over the study area with a period of record matching the NWM retrospective 1993–2018 period of record. To maximize the number of available gauges, however, the period of record was adjusted to 1994–2018, which resulted in a larger number of viable gauges, especially over Alabama. Of the 520 available USGS gauges, only those with <5% missing data and a representative NWM retrospective stream segment were retained for analysis, leaving a total of 342 NWM/USGS comparison points (Figure 1). It is important to note that although many larger rivers have control structures within the study area (i.e., dams and locks), no restrictions to the number of gauges were made based on the proximity and/or potential influence of these structures on the data as the patterns of streamflow at these locations was still considered useful for the overall analysis.

2.2. Quantifying Low Flow Events

Defining a low streamflow event using a numerically objective yet representative measure can be quite difficult, not only due to the various methods available but also due to the specific outcome that each method is focused on (i.e., environmental stress, water quality/quantity, recurrence interval, etc.). A common metric used in environmental and regulatory applications (namely for water quality) is the 7Q10 metric [31,32], which defines a low flow event as a period where average daily streamflow is at or below the 10-year recurrence interval over a minimum of seven consecutive days. The fact that the 7Q10 incorporates thresholds for both intensity (10-year recurrence interval, or 10th percentile) as well as duration (seven consecutive days) makes it a viable approach for this study, as the results can be used to define both the number of events over the period of record as well as the relative magnitude (based on the value of the 10th percentile) within a given time series. Additionally, given the wide-spread use of the 7Q10 metric for water resource and water quality applications, using the method will illustrate the validity of applying it to the NWM retrospective data for future investigations.
Based on the daily average streamflow from both the NWM retrospective and USGS observed data sources, the 10th percentile for each month and for each data source was calculated. This resulted in 12 unique monthly threshold values for each NWM stream segment and USGS gauge, which allows for analysis of the monthly 7Q10 metric independently for each simulation or observed time series. As the Southeast US exhibits distinct seasonality in terms of precipitation and associated runoff due to its humid subtropical climate, using independent monthly values will help highlight specific spatial low flow patterns without masking the patterns in the overall seasonal variability. The NWM and USGS gauges were assessed using independent 7Q10 metrics to avoid numerical errors associated with systematic biases between the data sources, such that over/underestimation of one data source could influence the number of calculated events if only that source was used to calculate the 10th percentile for that particular model-gauge pair. For seven-day periods crossing months, the 10th percentile for the day at the beginning of the seven-day period was used as the selection criteria for the event.

2.3. Model Accuracy Metrics

Quantification of the accuracy of the NWM retrospective v.2.0 data with respect to USGS observations was performed using three metrics, with each applied to both the number of defined 7Q10 low flow events as well as the associated 10th percentile. To minimize the influence of ephemeral stream segments with inherently low baseflow at or near 0 m3/s, all data pairs where either the NWM retrospective or the associated USGS time series had >5% of values less than 0.01 m3/s were removed. The resulting monthly time series were then used to calculate the associated metrics.
First was the Spearman rank correlation, which quantifies the linear association between two variables using the ranked series instead of the raw values. This measure was used to minimize bias associated with outliers and the inherent non-normal distribution of the underlying probability density functions (PDF) associated with the low flow time series. The statistical significance of the correlation was assessed as well, with correlations considered significant at p < 0.05. In addition to correlation, the mean bias error (MBE) and root mean square error (RMSE) were calculated for both the number of defined low flow events and the 10th percentile for each model-gauge pair. Together, these metrics quantify the bias and error, respectively, of the modeled estimates relative to the observations, providing information on over and under-estimation as well as the magnitude of the residuals between the data sources.

3. Results

3.1. Verification of NWM Retrospective Simulations

The Spearman rank correlation of the 10th percentile of streamflow, calculated individually for the 342 USGS gauges and the associated NWM retrospective simulation points over the 1994–2018 study period, shows the strongest relationship between the data during the cool season with a peak in March (r = 0.24; Table 2). The correlation values drop relatively consistently before and after this point to a minimum in August (r = 0.07), with November through June showing a significant correlation (p < 0.05). The climate patterns over the majority of the Southeast US are associated with a rainy winter and dry summer, generally resulting from precipitation generation from frontal processes and surface-based convective air-mass thunderstorms, respectively; therefore, it is expected that in the cool season the rivers should have higher and more consistent discharge due to the regional-scale character of the precipitation. This would allow the NWM to provide more representative estimates of streamflow, although for low flow scenarios, a greater influence of surface characteristics on the runoff leads to a heightened sensitivity of model simulations to available precipitation. As a result, even though the correlations are at a maximum in March, the overall values show a relatively weak correlation. For low flow scenarios in the warm season, both precipitation variability and the difficulty in simulating local-scale surface runoff patterns make the correlations approach zero.
The MBE metric indicates that the NWM retrospective data consistently overestimates the 10th percentile of streamflow for all months, with the greatest overestimation in the cool season when average precipitation is the generally the highest (maximum of 6.6 m3/s in February; Table 2). Likewise, the RMSE shows the highest model error in the cool season, with a peak of 60.7 m3/s in March. Values of both MBE and RMSE decrease during the warmer months, although interestingly the lowest values of MBE and RMSE occur in December (0.3 m3/s) and November (24.9 m3/s), respectively (Table 2). This pattern shows that although the 10th percentile values of simulated and observed streamflow maintain a weak correlation into the late fall across the Southeast US, when average precipitation generally shows a climatological increase, the NWM retrospective data are better able to represent low streamflow conditions. It is important to note, though, that the lower MBE and RMSE values in the summer and early fall are likely a result of lower overall rainfall and subsequent river response, especially along smaller tributaries and river segments, meaning the level of error in the NWM with respect to the lower tail of the associated streamflow PDF is highly sensitive to the average streamflow. In the late fall and early winter when low flow events are usually associated with a higher 10th percentile threshold due to the onset of more regional-scale precipitation patterns, the model’s predictive capability at the lower tail of the data distribution increases.
Analysis of the Spearman correlation of the number of low flow days defined by the 7Q10 approach shows a much different pattern than with the 10th percentile threshold, indicating that only February has a significant (p < 0.05), albeit weak (r = 0.11), correlation (Table 3). In fact, both the strength and direction of the monthly correlations show no real pattern, although the correlations do tend to vary around a value of zero. The bias and error metrics show more consistency, though, with lower values in the cool season and higher values in the warm season (Table 3). These results indicate that although the NWM retrospective data are not able to represent the pattern of low flow frequency at any given point, the overall accuracy of the model is higher in the cool season with respect to identifying the occurrence of low flow events. As with the 10th percentile threshold, however, the retrospective simulations show a consistent overestimation, indicating that the model tends to produce a higher likelihood of low flow conditions across the Southeast US.
Based on the monthly verification statistics shown in Table 3, which are representative of all locations where the NWM stream segment has a Strahler stream order ≥4, it is difficult to define whether the resulting correlation and bias patterns are more a result of physical or numerical issues. Although both likely play a role, outliers in the data do have a substantial effect on the resulting metrics. This is especially true for low flow conditions when the lower tail of the streamflow PDF approaches zero, which often occurs along smaller river channels. To test the influence of potential outliers along these smaller stream segments, the correlation and bias metrics for the number of low flow days were recalculated for only those points where the Strahler stream order was ≥ 6. As indicated in Table 1, this substantially reduces the number of available model-gauge pairs; however, as the higher stream order can generally be associated with larger river segments and higher streamflow, the metrics may be less variable. The results show an increase in the number and strength of significant correlations (Table 4), although the change in direction of the relationship between months is still substantial. The MBE and RMSE metrics show a slight increase overall, although the values remain relatively consistent as those incorporating segments with a stream order ≥4. These results show that streamflow patterns along smaller river reaches play an important role in quantifying the relationship between modeled and observed low flow frequency, while the larger river segments heavily influence the bias and error metrics. This is not surprising given that streamflow variability is generally higher along rivers with lower average discharge since local-scale precipitation patterns lead to a larger overall response.
A detailed analysis of the lower tail of the statistical distribution of streamflow at the NWM retrospective stream segments highlighted a critical issue that potentially explains the relatively poor verification of the simulated data. Since discharge during low flow events is inherently low and temporally consistent, the 10th percentile value is often quite close to the minimum value. This leads to numerical sensitivity of the 7Q10 threshold to the numerical resolution of the streamflow record, such that highly consistent low discharge values mean the 10th percentile value could represent the minimum value itself. In such cases, the magnitude of the low flow event could be biased towards being too low while the number of low flow days would be biased towards being too high. To compound this issue, from a physical perspective any changes in streamflow during hydrologic drought will be sensitive to interaction of the river channel with groundwater; therefore, proper representation of surface and groundwater feedback is critical. As WRF-Hydro incorporates a relatively simple groundwater model, the resulting simulations of low flow conditions may be biased. To further investigate this issue, the upper and lower tails (90th and 10th percentiles, respectively) of the probability density functions at all NWM stream segments included in the study (n = 37,649) were evaluated and compared (Table 5). Of note is the much lower average percent of unique values within the lower tails of the distributions (55.41%) compared to the upper tail (98.31%), along with an average near zero for the lower tail. These results illustrate that the issue described above is likely influencing the 7Q10 low flow threshold when applied to the retrospective data, especially along smaller river segments.
While the agreement between the NWM retrospective simulated data and the associated USGS observations are generally weak, at least in terms of low flow characteristics, it is important to consider the retrospective data as an augment to observations and not a replacement. As the primary shortcoming of hydrologic observations is the relatively low station density and the often inhomogeneous distribution of gauges, the spatially coherent nature of the retrospective data allow for hydrologic assessment to be conducted at ungauged locations. As such, utilizing a combination of simulated and observed data sources for regional-scale assessment of low flow patterns is a viable approach, while local-scale assessment can be conducted using the retrospective data while taking into consideration the above-mentioned caveats and limitations.

3.2. Spatial Patterns of Low Flow

The patterns of 10th percentile streamflow (Figure 2a) and low flow frequency (Figure 2b) across the Southeast US study area show substantial spatial variability, indicative of an environment with varying climatological and surface characteristics. In terms of low flow magnitude, the 10th percentile values are generally highest along mainstem rivers with values increasing towards the coast. This is an expected result, which helps to verify the ability of the NWM retrospective data to capture regional-scale low flow patterns. For low flow frequency, however, the local-scale variability is much higher, implying that area-specific environmental features play an important role in defining the generation and maintenance of low flow events. This is especially noticeable through Alabama and Georgia, where the frequency of the annual average number of low flow events has a high spatial variability.
Based on the seasonal low flow patterns indicated by the statistical analysis (Table 2 and Table 3), there is a clear seasonal difference in low flow frequency and magnitude across the Southeast US. As a result, further analysis into the spatial patterns of low flow will focus on the warm (July–September) and cool (January–March) seasons to better define when and where low flow conditions are most likely to occur based on the retrospective data.
The threshold 10th percentile calculated at each NWM river segment in the cool season (Figure 3) shows largely similar values from January through to March. The lowest values tend to occur at lower stream order segments through central and Georgia, with higher values along the Gulf Coast and South Carolina. As expected, the higher stream order segments tend to have higher 10th percentiles, with the largest values occurring along major rivers before reaching a maximum along the coast. While these results are not especially important by themselves, they do indicate that the retrospective data are able to largely represent local-scale streamflow magnitude with respect to low flow conditions.
While the 10th percentile values showed consistent spatial patterns during the cool season, the number of low flow events defined by the 7Q10 approach show substantial spatial differences as well as differences between months (Figure 4). In January, the highest number of low flow events occurs from central Alabama through central North Carolina, with a maximum (>60 events) along the central reach of the Savannah River. High values also tend to occur along the headwater areas of northern Georgia and South Carolina. These patterns are not reflected in February and March, where the number of low flow events is much lower across much of the study area relative to January. The lower values along the Savannah River are still somewhat apparent, however, although the highest frequency of low flow events tends to occur in Florida and along the Mountain-Piedmont transition between South Carolina and Virginia. In March, there is also a regional increase in low flow event frequency through southern Mississippi.
During the warm season the magnitude of the 10th percentile streamflow values are generally lower across the study area (Figure 5) relative to the cool season, with the highest values again occurring along larger main-stem rivers and reaching a maximum along the coast. Furthermore, rivers in Florida tend to have values greater than 5 m3/s, while most other regions are below this threshold. These patterns are expected given the regional climatological precipitation patterns (see next section for further discussion), but again provides some indication of the ability of the NWM retrospective data to capture regional-scale low flow conditions.
With respect to the number of low flow events during the warm season months, the spatial patterns change considerably between July and September (Figure 6). During July the greatest number of events occur through east central Alabama and western South Carolina, along with a local maximum in southern Mississippi. August shows an increase in both frequency and spatial extent of low flow events, especially through Alabama and into the Carolinas. In September the area with >60 low flow events over the period of record decreases substantially, especially through the Piedmont and Coastal regions of the Southeast US, with the primary areas experiencing low flow along the headwater regions of the southern Appalachians and again through central Alabama.

3.3. Association between Low Flow Patterns and Environmental Characteristics

The Southeast US is primarily a humid subtropic climate with relatively wet winters and dry summers, along with high warm-season temperatures and mild winters. Precipitation patterns in the cool season are generally driven by synoptic-scale processes associated with cold-frontal passages, often leading to cyclic multi-day precipitation events dominated by stratiform precipitation with lines of strong convective precipitation ahead of the frontal passages. These patterns result in a relatively smooth gradient of precipitation across the region with higher amounts in the west that decrease towards the east (Figure 7a). In the warm season the precipitation is primarily convective in nature, generated by surface-based air-mass thunderstorms with highly variable spatial distribution. Mesoscale thermodynamic boundaries often lead to local-scale precipitation maxima, especially along coastal areas, while topographic influences can also lead to local-scale maxima within the lower extent of the southern Appalachians in Georgia and North Carolina (Figure 7b). Southern Florida, characterized by a maritime tropical climate, is the exception to this pattern as it exhibits a relatively dry cool season and a wet warm season, the latter primarily due to enhanced convective development and associated precipitation.
As the 7Q10 metric requires a low flow event to be continuous over at least a seven-day period, the corresponding climatic patterns (mainly precipitation amount) associated with the event must allow for water levels to decrease to and remain below the 10th percentile flow threshold. For areas where climatic conditions provide consistently high precipitation amounts, such as the cool season over the western half of the study region, the frequency of low flow events is generally lower than over North and South Carolina and especially southern Florida (Figure 4). In the warm season, however, when precipitation is more variable and with local maxima limited to the coastal regions, the variability in streamflow increases with a corresponding increase in the number of low flow events (Figure 6). This pattern is most recognizable through central Alabama and the piedmont region of North and South Carolina, where precipitation during the warm season is relatively low.
Although an extended time period of decreased precipitation generally is required to produce hydrologic drought conditions, it is important to also consider landscape and watershed factors related to sub-surface water storage and runoff speed. While the NWM does consider groundwater processes, albeit on a simplified basis, watershed slope and distance to the river channel are arguably the primary factors associated with runoff timing and speed. As a result, more mountainous areas are likely more susceptible to the rapid onset of hydrologic drought due to shorter storage time of shallow subsurface water. Areas with higher topographic slopes are found through north Georgia, northwestern South Carolina and western North Carolina (Figure 8a), which also correlate with an area of higher relative warm-season precipitation (Figure 7b). Interestingly, these areas show a higher frequency of low flow conditions than adjacent areas (Figure 6) despite the higher precipitation, which justifies this conclusion.
An area of increased frequency of low flow events in the warm season is also apparent through central North Carolina and South Carolina, which reflects a soil transition from a silty loam to a sand/sandy loam texture (Figure 8b). The change in soil porosity leads to differences in infiltration rate and water storage capacity, which combined with the climatological rainfall gradient through the central part of these states (Figure 7b), are primary drivers in local-scale increase in low flow event frequency. The same issue is likely true within central Alabama, although the combination of soils, precipitation, and deeper groundwater interactions must be investigated in more detail to define the specific causes for the local-scale low flow processes.

4. Conclusions

At the larger scale, the spatial patterns of low flow frequency across the Southeast US tend to follow the general distribution of seasonal precipitation, which is most clearly indicated by the increase in low flow frequency during the warm season across the study region where climatological precipitation amounts are lowest. Additionally, regional-scale differences in precipitation characteristics, such as over Florida (e.g., tropical vs. sub-tropical seasonal precipitation patterns) also show an influence on low flow frequency and magnitude, indicating the importance of longer-term rainfall patterns in defining the potential for low flow conditions. This reflects results from [11] that the primary driver of hydrologic drought variability is climatic drought. While these results are not surprising, they do show that the NWM retrospective data are reflective of the general hydrologic patterns related to longer-term seasonal and intra-annual hydrologic drought patterns across the Southeast US. As such, the retrospective data provide a useful tool for investigating the patterns of low flow conditions across the region, especially at locations without an observation gauge, leading to a better understanding of the underlying processes and the potential development of a spatially continuous water resources risk assessment.
At the local scale, watershed characteristics show an influence on low flow patterns as they directly relate to the runoff speed and amount, and ultimately water storage. This is most closely noted along the headwater basins within western North Carolina and north Georgia during the warm season, where despite high rainfall amounts the frequency of low flow events is relatively high. The high slope in these areas generally leads to fast river response times and lower subsequent watershed storage, thereby leading to lower baseflow. In other areas where low flow frequency is high, such as along the mountain-piedmont transition in North Carolina and South Carolina, soil characteristics play a dominant role in low flow patterns due to the change in soil water storage capacity from silty to sandy-type soils.
Based on these results, along with the statistical analysis of the NWM retrospective v2.0 data with respect to USGS gauge observations, it can be concluded that although regional-scale verification of simulated low flow event frequency and threshold from the NWM may not represent observed local-scale patterns, the NWM retrospective data are able to provide viable spatial information on low flow frequency and magnitude (given by the 10th percentile threshold), especially along larger waterways. However, future research using updated retrospective data (such as v2.1) should include a local-scale evaluation at a suitable watershed scale to provide verification metrics at a spatial and temporal resolution representative of landscape variations. As hydrologic processes in the Southeast US have been shown to be sensitive to changes in landscape properties such as land use/cover [34], it is important to define a framework that can incorporate existing and potential future surface characteristics to provide representative assessments of water resources. This is especially true in regions with noted changes in land use/cover such as agricultural and urban transition areas, where changes in arable land and impermeable soils may impact infiltration rate and surface water storage.
Work in other locations using the NWM retrospective data showed better statistical agreement with observations [24]; therefore, the relatively poor performance of the retrospective data over the Southeast US is likely a combination of model limitations, regional hydrologic complexity, and issues associated with the characterization of extreme low flow. As such, given the numerical limitations of the retrospective data along the lower tail of the statistical distribution of streamflow, especially along smaller waterways, future analysis should involve a low flow definition that does not rely on specific percentile criteria. It would be useful to compare various low flow metrics on the retrospective data to define which approach produces the most representative and statistically relevant results, the results of which could be used to apply the retrospective data in a more representative manner across a range of landscapes and climatological conditions. Future work incorporating the updated v2.1 retrospective data, which has a longer period of record (1979–2020), will benefit from the ability to calculate low flow events using a variety of metrics. This will allow for a more in-depth assessment of the applicability of various approaches to defining low flow frequency and magnitude across different geographic regions, and will also highlight the utility of the NWM retrospective dataset in research related to quantifying the long-term patterns of hydrologic drought along with the surface and atmospheric drivers associated with such conditions. As surface characteristics, such as land use and cover, change due to processes such as urbanization and the spread of agricultural areas, the impact on local-scale hydrologic patterns must be recognized and assessed to avoid environmental degradation. Additionally, at the larger climatological scale, it is critical to define potential changes in the distribution and intensity of extreme precipitation deficits and subsequent hydrologic drought to better plan for and adapt to water resource stress and limitations. Such information is crucial to defining locations where water resources are currently at risk, as well as identifying the physical factors, either environmental or anthropogenic, that may be causing or augmenting those risks.

Author Contributions

Conceptualization, J.D.; methodology, J.D., A.M. and K.R.; software, J.D. and K.R.; formal analysis, J.D., A.M. and K.R.; investigation, J.D. and K.R.; resources, J.D.; data curation, J.D. and K.R.; validation, J.D. and K.R.; writing—original draft preparation, J.D.; writing—review and editing, J.D., A.M. and K.R.; visualization, J.D.; supervision, J.D.; project administration, J.D.; funding acquisition, J.D. and A.M. All authors have read and agreed to the published version of the manuscript.

Funding

This research was funded by the National Oceanic and Atmospheric Administration (NOAA), grant number NA19OAR4590411.

Conflicts of Interest

The authors declare no conflict of interest. The funders had no role in the design of the study; in the collection, analyses, or interpretation of data; in the writing of the manuscript, or in the decision to publish the results.

References

  1. Sun, G.; McNulty, S.G.; Moore Myers, J.A.; Cohen, E.C. Impacts of Multiple Stresses on Water Demand and Supply Across the Southeastern United States. JAWRA J. Am. Water Resour. Assoc. 2008, 44, 1441–1457. [Google Scholar] [CrossRef]
  2. LaFontaine, J.H.; Hay, L.E.; Viger, R.J.; Regan, R.S.; Markstrom, S.L. Effects of Climate and Land Cover on Hydrology in the Southeastern, U.S.: Potential Impacts on Watershed Planning. JAWRA J. Am. Water Resour. Assoc. 2015, 51, 1235–1261. [Google Scholar] [CrossRef]
  3. Sun, G. Impacts of Climate Change and Variability on Water Resources in the Southeast USA. In Climate of the Southeast United States. NCA Regional Input Reports; Ingram, K.T., Dow, K., Carter, L., Anderson, J., Eds.; Island Press: Washington, DC, USA, 2013. [Google Scholar] [CrossRef]
  4. Blauhut, V.; Stahl, K.; Stagge, J.H.; Tallaksen, L.M.; De Stefano, L.; Vogt, J. Estimating drought risk across Europe from reported drought impacts, drought indices, and vulnerability factors. Hydrol. Earth Syst. Sci. 2016, 20, 2779–2800. [Google Scholar] [CrossRef] [Green Version]
  5. Kiem, A.S.; Johnson, F.; Westra, S.; van Dijk, A.; Evans, J.P.; O’Donnell, A.; Mehrotra, R. Natural hazards in Australia: Droughts. Clim. Chang. 2016, 139, 37–54. [Google Scholar] [CrossRef]
  6. Marengo, J.A.; Espinoza, J.C. Extreme seasonal droughts and floods in Amazonia: Causes, trends and impacts. Int. J. Climatol. 2016, 36, 1033–1050. [Google Scholar] [CrossRef]
  7. Zhang, Q.; Gu, X.; Singh, V.P.; Kong, D.; Chen, X. Spatiotemporal behavior of floods and droughts and their impacts on agriculture in China. Glob. Planet. Change 2015, 131, 63–72. [Google Scholar] [CrossRef]
  8. Ding, Y.; Hayes, M.J.; Widhalm, M. Measuring economic impacts of drought: A review and discussion. Disaster Prev. Manag. 2011, 20, 434–446. [Google Scholar] [CrossRef] [Green Version]
  9. Wilhite, D.A.; Svoboda, M.D.; Hayes, M.J. Understanding the complex impacts of drought: A key to enhancing drought mitigation and preparedness. Water Resour. Manag. 2007, 21, 763–774. [Google Scholar] [CrossRef] [Green Version]
  10. Van Loon, A.F. Hydrological drought explained. Wiley Interdiscip. Rev. Water 2015, 2, 359–392. [Google Scholar] [CrossRef]
  11. Peña-Gallardo, M.; Vicente-Serrano, S.M.; Hannaford, J.; Lorenzo-Lacruz, J.; Svoboda, M.; Domínguez-Castro, F.; Maneta, M.; Tomas-Burguera, M.; El Kenawy, A. Complex influences of meteorological drought time-scales on hydrological droughts in natural basins of the contiguous Unites States. J. Hydrol. 2019, 568, 611–625. [Google Scholar] [CrossRef] [Green Version]
  12. Mukherjee, S.; Mishra, A.; Trenberth, K.E. Climate Change and Drought: A Perspective on Drought Indices. Curr. Clim. Change 2018, 4, 145–163. [Google Scholar] [CrossRef]
  13. Strzepek, K.; Yohe, G.; Neumann, J.; Boehlert, B. Characterizing changes in drought risk for the United States from climate change. Environ. Res. Lett. 2010, 5, 044012. [Google Scholar] [CrossRef]
  14. Pechlivanidis, I.G.; Jackson, B.M.; Mcintyre, N.R.; Wheater, H.S. Catchment scale hydrological modelling: A review of model types, calibration approaches and uncertainty analysis methods in the context of recent developments in technology and applications. Glob. NEST Int. J. 2011, 13, 193–214. [Google Scholar]
  15. Troch, P.A.; Carrillo, G.A.; Heidbüchel, I.; Rajagopal, S.; Switanek, M.; Volkmann, T.H.M.; Yaeger, M. Dealing with Landscape Heterogeneity in Watershed Hydrology: A Review of Recent Progress toward New Hydrological Theory. Geogr. Compass 2009, 3, 375–392. [Google Scholar] [CrossRef]
  16. NOAA. Office of Water Prediction (OWP), The National Water Model. Available online: https://water.noaa.gov/about/nwm (accessed on 27 January 2022).
  17. NOAA. National Water Model CONUS Retrospective Dataset v2.0. Available online: https://registry.opendata.aws/nwm-archive (accessed on 10 December 2020).
  18. Mesinger, F.; DiMego, G.; Kalnay, E.; Mitchell, K.; Shafran, P.C.; Ebisuzaki, W.; Jović, D.; Woollen, J.; Rogers, E.; Berbery, E.H.; et al. North American Regional Reanalysis. Bull. Am. Meteorol. Soc. 2006, 87, 343–360. [Google Scholar] [CrossRef] [Green Version]
  19. Hersbach, H.; Bell, B.; Berrisford, P.; Hirahara, S.; Horányi, A.; Muñoz-Sabater, J.; Thépaut, J.N. The ERA5 global reanalysis. Q. J. R. Meteorol. Soc. 2020, 146, 1999–2049. [Google Scholar] [CrossRef]
  20. Salas, F.R.; Somos-Valenzuela, M.A.; Dugger, A.; Maidment, D.R.; Gochis, D.J.; David, C.H.; Yu, W.; Ding, D.; Clark, E.P.; Noman, N. Towards Real-Time Continental Scale Streamflow Simulation in Continuous and Discrete Space. JAWRA J. Am. Water Resour. Assoc. 2018, 54, 7–27. [Google Scholar] [CrossRef]
  21. Blodgett, D. National Water Model V1.2 Retrospective and Operational Model Run Archive for Selected NWIS Gage Locations; U.S. Geological Survey Data Release; U.S. Geological Survey: Reston, VA, USA, 2019. [CrossRef]
  22. Blodgett, D.L. National Water Model V2.0 Retrospective for Selected NWIS Gage Locations (1993–2018); U.S. Geological Survey Data Release; U.S. Geological Survey: Reston, VA, USA, 2020. [CrossRef]
  23. Maidment, D.R. Conceptual Framework for the National Flood Interoperability Experiment. JAWRA J. Am. Water Resour. Assoc. 2017, 53, 245–257. [Google Scholar] [CrossRef]
  24. Hansen, C.; Shafiei Shiva, J.; McDonald, S.; Nabors, A. Assessing Retrospective National Water Model Streamflow with Respect to Droughts and Low Flows in the Colorado River Basin. JAWRA J. Am. Water Resour. Assoc. 2019, 55, 964–975. [Google Scholar] [CrossRef]
  25. NOAA. National Weather Service (NWS), Office of Water Prediction (OWP), Analysis of Record for Calibration: Version 1.1 Sources, Methods, and Verification. Available online: https://hydrology.nws.noaa.gov/aorc-historic/Documents/AORC-Version1.1-SourcesMethodsandVerifications.pdf (accessed on 27 January 2022).
  26. Xia, Y.; Mitchell, K.; Ek, M.; Sheffield, J.; Cosgrove, B.; Wood, E.; Luo, L.; Alonge, C.; Wei, H.; Meng, J.; et al. Continental-scale water and energy flux analysis and validation for the North American Land Data Assimilation System project phase 2 (NLDAS-2): 1. Intercomparison and application of model products. J. Geophys. Res. 2012, 117, D03109. [Google Scholar] [CrossRef]
  27. Niu, G.Y.; Yang, Z.L.; Mitchell, K.E.; Chen, F.; Ek, M.B.; Barlage, M.; Kumar, A.; Manning, K.; Niyogi, D.; Rosero, E.; et al. The Community Noah Land Surface Model with Multiparameterization Options (Noah-MP): 1. Model Description and Evaluation with Local-Scale Measurements. J. Geophys Res. 2011, 116, D12. [Google Scholar] [CrossRef] [Green Version]
  28. Yucel, I.; Onen, A.; Yilmaz, K.K.; Gochis, D.J. Calibration and Evaluation of a Flood Forecasting System: Utility of Numerical Weather Prediction Model, Data Assimilation and Satellite-Based Rainfall. J. Hydrol. 2015, 523, 49–66. [Google Scholar] [CrossRef] [Green Version]
  29. McKay, L.; Bondelid, T.; Dewald, T.; Johnston, J.; Moore, R.; Rea, A. NHDPlus Version 2: User Guide. 2012. Available online: Ftp://ftp.horizonsystems.com/NHDplus/NHDPlusV21/Documentation/NHDPlusV2_User_Guide.pdf (accessed on 22 April 2021).
  30. Seaber, P.R.; Kapinos, F.P.; Knapp, G.L. Hydrologic Unit Maps. United States Geological Survey Water-Supply Paper 2294. 1987. Available online: https://pubs.usgs.gov/wsp/wsp2294/pdf/wsp_2294.pdf (accessed on 22 April 2021).
  31. United States Environmental Protection Agency. Communications & Public Affairs. Terms of Environment: Glossary, Abbreviations, and Acronyms; Diane Publishing Company: Collindgdale, PA, USA, 1997.
  32. Ames, D.P. Estimating 7Q10 Confidence Limits from Data: A Bootstrap Approach. J. Water Resour. Plan. Manag. 2006, 132, 204–208. [Google Scholar] [CrossRef]
  33. NOAA. NWS Advanced Hydrologic Prediction Service, Precipitation Analysis Website. Available online: https://water.weather.gov/precip/index.php (accessed on 27 January 2022).
  34. Cruise, J.F.; Laymon, C.A.; Al-Hamdan, O.Z. Impact of 20 Years of Land-Cover Change on the Hydrology of Streams in the Southeastern United States. JAWRA J. Am. Water Resour. Assoc. 2010, 46, 1159–1170. [Google Scholar] [CrossRef]
Figure 1. Study region, defined by USGS Region-3 boundary (grey outlines delineate individual watersheds). Blue lines denote NWM stream segments with Strahler stream order ≥ 4 (n = 33,759), while grey and green dots denote USGS daily streamflow observation gauges with a period of record of 1994–2018 (n = 520). Green dots specifically denote USGS gauges with <5% missing data and a corresponding NWM stream segment (n = 342).
Water 14 01525 g001
Figure 2. Annual average patterns of: (a) 10th percentile threshold (m3/s) and; (b) low flow frequency (total number of 7Q10 days) over the study region based on NWM retrospective simulations.
Water 14 01525 g002
Figure 3. Cool season (January–March) patterns of 10th percentile threshold (m3/s) over the study region based on NWM retrospective simulations.
Water 14 01525 g003
Figure 4. Cool season (January–March) patterns of low flow frequency (total number of 7Q10 days) over the study region based on NWM retrospective simulations.
Water 14 01525 g004
Figure 5. Warm season (July–September) patterns of 10th percentile threshold (m3/s) over the study region based on NWM retrospective simulations.
Water 14 01525 g005
Figure 6. Warm season (July–September) patterns of low flow frequency (total number of 7Q10 days) over the study region based on NWM retrospective simulations.
Water 14 01525 g006
Figure 7. Monthly average precipitation (mm) for (a) February and (b) August based on the 30-year (1981–2010) Parameter-elevation Regressions on Independent Slopes Model (PRISM) dataset. Images obtained from [33].
Water 14 01525 g007
Figure 8. (a) Slope and (b) soil texture information for the Southeast US, derived from the NLDAS dataset that is used as input into the NWM retrospective v.2.0 data. Grey polygons delineate watersheds within the USGS Region 3 study area.
Water 14 01525 g008
Table 1. Distribution of NWM stream segments over the study region by Strahler stream order. Only segments with order ≥4 are considered in the percent calculation.
OrderNumberPercent
81230.4
723417.0
6429712.8
5883426.3
417,98453.6
Table 2. Verification statistics for monthly 10th percentile values of NWM retrospective simulated streamflow relative to associated USGS observations. Months where the Spearman correlation coefficient is significant at p < 0.05 are in bold. Units of MBE and RMSE are m3/s.
MonthrpMBERMSE
October0.070.142.025.1
November0.100.031.024.9
December0.130.000.325.9
January0.180.003.035.8
February0.210.006.650.7
March0.240.006.260.7
April0.210.005.550.7
May0.190.004.937.3
June0.160.002.731.3
July0.080.092.028.0
August0.070.152.626.9
Sepember0.070.112.225.8
Table 3. Verification statistics for the average number of low flow events calculated from the NWM retrospective simulations relative to associated USGS observations at river segments with a Strahler stream order ≥4. Months where the Spearman correlation coefficient is significant at p < 0.05 are in bold.
MonthrpMBERMSE
October0.020.6917.131.5
November−0.040.4116.833.1
December−0.040.3417.331.0
January0.030.5621.533.4
February0.110.0112.425.4
March0.040.3516.427.6
April−0.030.4514.325.1
May0.090.0510.225.0
June−0.010.8711.224.5
July0.050.3218.029.5
August0.000.9916.631.6
Sepember−0.040.3818.032.2
Table 4. Verification statistics for average number of low flow events calculated from the NWM retrospective simulations relative to associated USGS observations at river segments with a Strahler stream order ≥6. Months where the Spearman correlation coefficient is significant at p < 0.05 are in bold.
MonthrpMBERMSE
October0.070.1420.132.6
November0.060.1721.133.7
December0.010.8520.532.3
January0.130.0028.836.4
February0.110.0113.726.2
March−0.010.7816.827.6
April−0.110.0214.825.1
May0.240.0011.823.5
June0.050.3015.724.9
July0.100.0322.530.2
August0.000.9220.532.4
September−0.050.3120.135.0
Table 5. Comparison of the upper (90th percentile) and lower (10th percentile) tails of the average probability density functions for the NWM retrospective stream segments used in the study. Numbers in parenthesis represent standard deviation of the respective values, while all other values represent the average across all segments. Note that the different value of n for the upper and lower 10% is a result of filtering values of 0 m3/s from the analyzed time series.
nUnique Vals (%)Mean (m3/s)St Dev (m3/s)
Upper 10%934 (27)98.31 (2.88)1.410.70
Lower 10%528 (334)55.41 (35.30)0.080.01
Publisher’s Note: MDPI stays neutral with regard to jurisdictional claims in published maps and institutional affiliations.

