Article

Influence of Urbanization on Patterns of Variability of Mytilus galloprovincialis Populations

1
Laboratory of Coastal Biodiversity, Interdisciplinary Centre of Marine and Environmental Research (CIIMAR) of the University of Porto, 4450-208 Matosinhos, Portugal
2
Departamento de Biología (Unidad de Zoología) & Centro de Investigación en Biodiversidad y Cambio Global (CIBC-UAM), Universidad Autónoma de Madrid, 28049 Madrid, Spain
*
Author to whom correspondence should be addressed.
Water 2022, 14(10), 1570; https://doi.org/10.3390/w14101570
Submission received: 21 April 2022 / Revised: 9 May 2022 / Accepted: 11 May 2022 / Published: 13 May 2022

Abstract

:
Urbanization is currently one of the most widespread disturbances urgently requiring empirical data regarding its effects on coastal ecosystems. The aim of this study was to compare patterns of variability in populations of the Mediterranean mussel, Mytilus galloprovincialis, between urban and non-urban intertidal rocky shores, over a temporal scale of 12 months and multiple spatial scales (from cm to 10 s of km). For this, variance components associated with percentage cover, spat and total density, condition index, shell length and clump thickness of mussels were compared. Different patterns emerged depending on the response variable and the spatial and temporal scale. There was in general, a higher variability in urban than in non-urban shores, particularly for shell length, spat and total density that can be interpretated as a first stage of degradation, before noticing changes in mean values of these variables. Moreover, the most relevant scales of variability of total and spat density changed with urbanization (10 s of km in urban; 10 s of cm/m in non-urban). Results highlight the need for adopting proper management plans that should include the relevant spatial and temporal scales of variability; otherwise, they will fail in ameliorating urbanization effects on intertidal ecosystems.

1. Introduction

The Mediterranean mussel Mytilus galloprovincialis Lamarck, 1819 is one of the most abundant invertebrate species on exposed or moderately exposed coasts in the south of the European Atlantic and Mediterranean [1,2]. They attach to hard substrates through their byssal threads and establish dense clumps or beds that can be mono- or multi-layered [3,4]. This species bears great ecological importance in coastal ecosystems, being considered an ecosystem-engineer [5,6]. On one hand, being an active filter-feeder organism, they play a relevant role as linkage in trophic chains between benthic organisms and phytoplankton [3,7] and improve water quality by removing pollutants, particles, excess nitrogen and other hazardous substances from the aquatic environment [3,4]. On the other hand, mussel beds enhance habitat complexity and therefore biodiversity, by providing useful habitat and protection to many organisms and nurseries to juveniles [6,8]. Mytilus galloprovincialis is also an economically relevant marine resource, severely exploited in many European countries such as Italy, Spain and Portugal for human consumption [9]. In some regions, such as in the northwest of the Iberian Peninsula, they are extensively cultured but their farming depends largely on wild stocks since juveniles are mainly captured in natural populations and then set up at culturing sites to continue their growth [10].
Mussels, as members of intertidal ecosystems, are exposed to harsh tidal, diurnal and seasonal changes through several environmental factors. In this way, they are under the effect of both physical (e.g., desiccation, thermal stress or wave action) and biological (e.g., competition and predation) natural drivers that result in varying distributional patterns depending on local environmental conditions [2,11]. Nevertheless, due to the location of rocky shores at the land–sea interface, they are also extremely exposed to anthropogenic disturbances [12,13] acting on a range of spatial and temporal scales [14]. These anthropogenic pressures overlay with those produced by natural drivers, making it difficult to separate the effects of both types of disturbances [12]. In this way, studies focused on detecting the effects of anthropogenic disturbances should encompass repeated sampling and comparison with multiple control or reference sites, allowing natural spatial and temporal variation to be quantitatively separated from the supposed impacts [15,16]. As hierarchical sampling designs are able to capture variability over a broad range of scales, they have been proposed as useful tools to unambiguously identify the extent of an anthropogenic impact, e.g., [17,18,19] over the scale at which it actually occurs [15,20]. Moreover, the application of nested hierarchical designs that consider variance components allows researchers to quantify the magnitude of variation for an individual scale, regardless of other scales [21] and detection of the effects of disturbances even before noticing changes in mean values of the considered descriptors [22].
Among anthropogenic disturbances, coastal urbanization is one of the most prevalent and rising threats as consequence of the higher population density near the coast (three times greater than the global average) [23,24]. Coastal urbanization is linked to a greater exploitation of living and non-living resources, pollution sources (industrial and domestic) and spread of artificial structures (i.e., coastal armoring) that translate in the synergistic effects of multiple stressors [24]. The most common impacts of urbanization are habitat loss, spread of invasive species, loss of foundation species, shifts in biodiversity, productivity and community composition, establishment of opportunistic species and proliferation of jellyfish and toxic algae [24,25]. These impacts have been intensively assessed on terrestrial and freshwater ecosystems, where large alterations on their structure and function were detected [24,26]. However, in the marine realm, most studies assessing the impact of urbanization have been focused on the effects of coastal armoring, e.g., [25,27]. Therefore, the effects of urbanization on the structure and functioning of marine ecosystems have still been underestimated in the background of conservation and management topics [28]. As predictions indicate that global population will increase in coastal zones, and it is expected that by 2025 nearly 75% of inhabitants will reside in coastal areas [24,29], the impacts of urbanization in marine ecosystems are matters of increasing interest [25,26].
Previous studies found that mussel beds are susceptible to harvesting, invasive species, trampling and pollution [3,9,14,30,31]. However, these disturbances, on urban shores, work synchronously and their effects cannot be deduced from studies that deem individually these stressors [32]. In this study, variability patterns in percentage cover, total density, spat density, condition index, clump thickness and shell length of M. galloprovincialis were compared between urban (i.e., close to large coastal cities on the NW Portuguese coast) and non-urban (i.e., far from large coastal cities) shores over a temporal scale of 12 months and multiple spatial scales, ranging from 10 s of cm to 10 s of km. The working hypothesis was that temporal and spatial variability of M. galloprovincialis populations were significantly affected by urbanization.

2. Materials and Methods

2.1. Study Area

The study was conducted between January 2019 and December 2019 at six rocky shores spread along 90 km of the NW Portuguese coast. Three of the studied shores (Cabo do Mundo, Valadares and Aguda; Figure 1) are included in the metropolitan area of Porto with 1,737,395 inhabitants and a population density of 2800 residents/km². Moreover, this area hosts large commercial and industrial plants. The other studied shores (Moledo, Forte do Cão and Carreço; Figure 1) are located in areas with small resident populations (<100,000 total inhabitants) without great commercial and industrial plants. As a larger number of inhabitants is related to greater stress sources impacting marine systems [24,29], the three shores in the Porto area were considered as urban whereas the remaining three were considered as non-urban. Moreover, previous studies have shown strong differences in pollution profiles between the shores assigned to each condition in this study [33,34].
Rocky shores in the study area present granitic substratum, moderate sloping and similar exposure to predominant waves and winds. The tidal regime is semi-diurnal, with the largest spring tides between 3.5 and 4 m. In the north of Portugal, the spring–summer and the autumn–winter seasons are characterized by strong differences in mean monthly precipitation, air and water temperature, hydrodynamic conditions, wave height and storm frequency [33,35,36]. Moreover, in spring and summer, the study area is subjected to seasonal upwelling that provides nutrients and increases the primary production in the water column [37]. Environmental factors such as water temperature, salinity or climatic conditions are similar between the studied urban and non-urban shores [2].
At each rocky shore, sampling was performed at the mid intertidal level (between 1.5 m and 2 m above Chart Datum), where Mytilus galloprovincialis is dominant [2,38].

2.2. Sample Collection and Processing

At each of the three urban and non-urban rocky shores, two sites (about 10 m apart) were randomly selected. At each site, the percentage cover of M. galloprovincialis was estimated in four quadrats (50 × 50 cm). Cover was obtained by dividing each quadrat into 25 sub-quadrats of 10 × 10 cm, attributing a scale from 0 (absence of mussels), to 4 (all sub-quadrat covered by mussels), and adding up the 25 estimates [39]. Additionally, four random measurements of mussel clump thickness were performed within each 50 × 50 cm quadrat sampled by using a ruler pushed to the bottom of the clump. Moreover, four quadrats (10 × 10 cm) were sampled by scraping off all mussels within, and samples were stored in labelled plastic bags and frozen until further processing. In the laboratory, samples (10 × 10 cm) were washed through a tower of sieves with 1000 µm and 500 µm mesh sizes. Mussels retained in each sieve were sorted and counted to obtain the total mussel density. Furthermore, the number of mussels retained in the 500 µm mesh size was used to evaluate mussel density in the spat stage (i.e., mussels with size between 500 and 1000 µm) that can be considered as a proxy of recruitment.
For each 10 × 10 cm quadrat, twenty random mussels, obtained from the 1000 µm mesh size, were separated to measure their shell length (±0.1 mm), and ten mussels per 10 × 10 cm quadrat were used to determine the condition index, defined as the ratio between soft tissue dry weight and shell dry weight.
The same sampling was repeated at each of the six dates, established randomly over a scale of 12 months: January 2019, April 2019, June 2019, September 2019, October 2019 and December 2019.

2.3. Data Analyses

In order to quantify and compare between urban and non-urban conditions, patterns of variability in mussel populations were determined at multiple spatial scales: replicate (10 s of cm), site (10 s of m) and shore (10 s of km). Independent estimates of variance components were calculated for the percentage cover, total density, spat density, clump thickness, condition index and shell length of M. galloprovincialis at each surveyed spatial and temporal scale. First, data were split into two halves, each including n = 2 replicates with the full experimental design. Then, each data set was analyzed separately using analysis of variance (ANOVA). Total number of replicates for each response variable according to date, site and shore were randomly assigned to each of the two established data sets that were analyzed separately. For each condition (urban vs. non-urban), sampling date and data set, this produced a 2-way model that included the factors Shore (3 levels, random) and Site (2 levels, random, nested within Shore) with two replicates for percentage cover, total density and spat density. For thickness, condition index and shell length, analyses were based on a 3-way model, including the same factors described above for density and percentage cover plus Plot as an additional random factor nested in Shore and Site, with four levels, since as described above, for these response variables different measurements were performed at the quadrat scale; namely two, five and ten replicates for thickness, condition index and shell length, respectively.
Univariate variance components were estimated from ANOVA by equating observed and expected mean squares [40]. This was achieved by dividing the difference between the mean square of the term of interest and the mean square of the term hierarchically below by the product of the levels of all terms below that of interest [36]. Thus, two independent replicates of variance components at each spatial scale [i.e., between quadrats, plots (when applicable), sites and shores] for each condition and sampling date were produced. In a few cases, negative estimates of variance were obtained but they were removed from the analysis, and all other values were recalculated following the procedure described by Fletcher and Underwood [41]. Variance components were analyzed with a 3-way ANOVA, including the crossed factors Condition (2 levels, fixed), Scale (4 or 5 levels according to the response variable as describe above, fixed) and Date (6 levels, random). Before each ANOVA, Cochran’s C-test was used to test for homogeneity of variances, and data were transformed (i.e., square root or X × 10,000) when necessary. When this was not possible, untransformed data were analyzed and results were considered robust if significant at p < 0.01, to compensate for increased probability of type I error [40]. Whenever ANOVA showed significant differences (p < 0.05), Student–Newman–Keuls (SNK) tests were used for a posteriori multiple comparisons.

3. Results

Temporal and spatial variability of percentage cover showed no significant differences in any of the tested factors (Table 1).
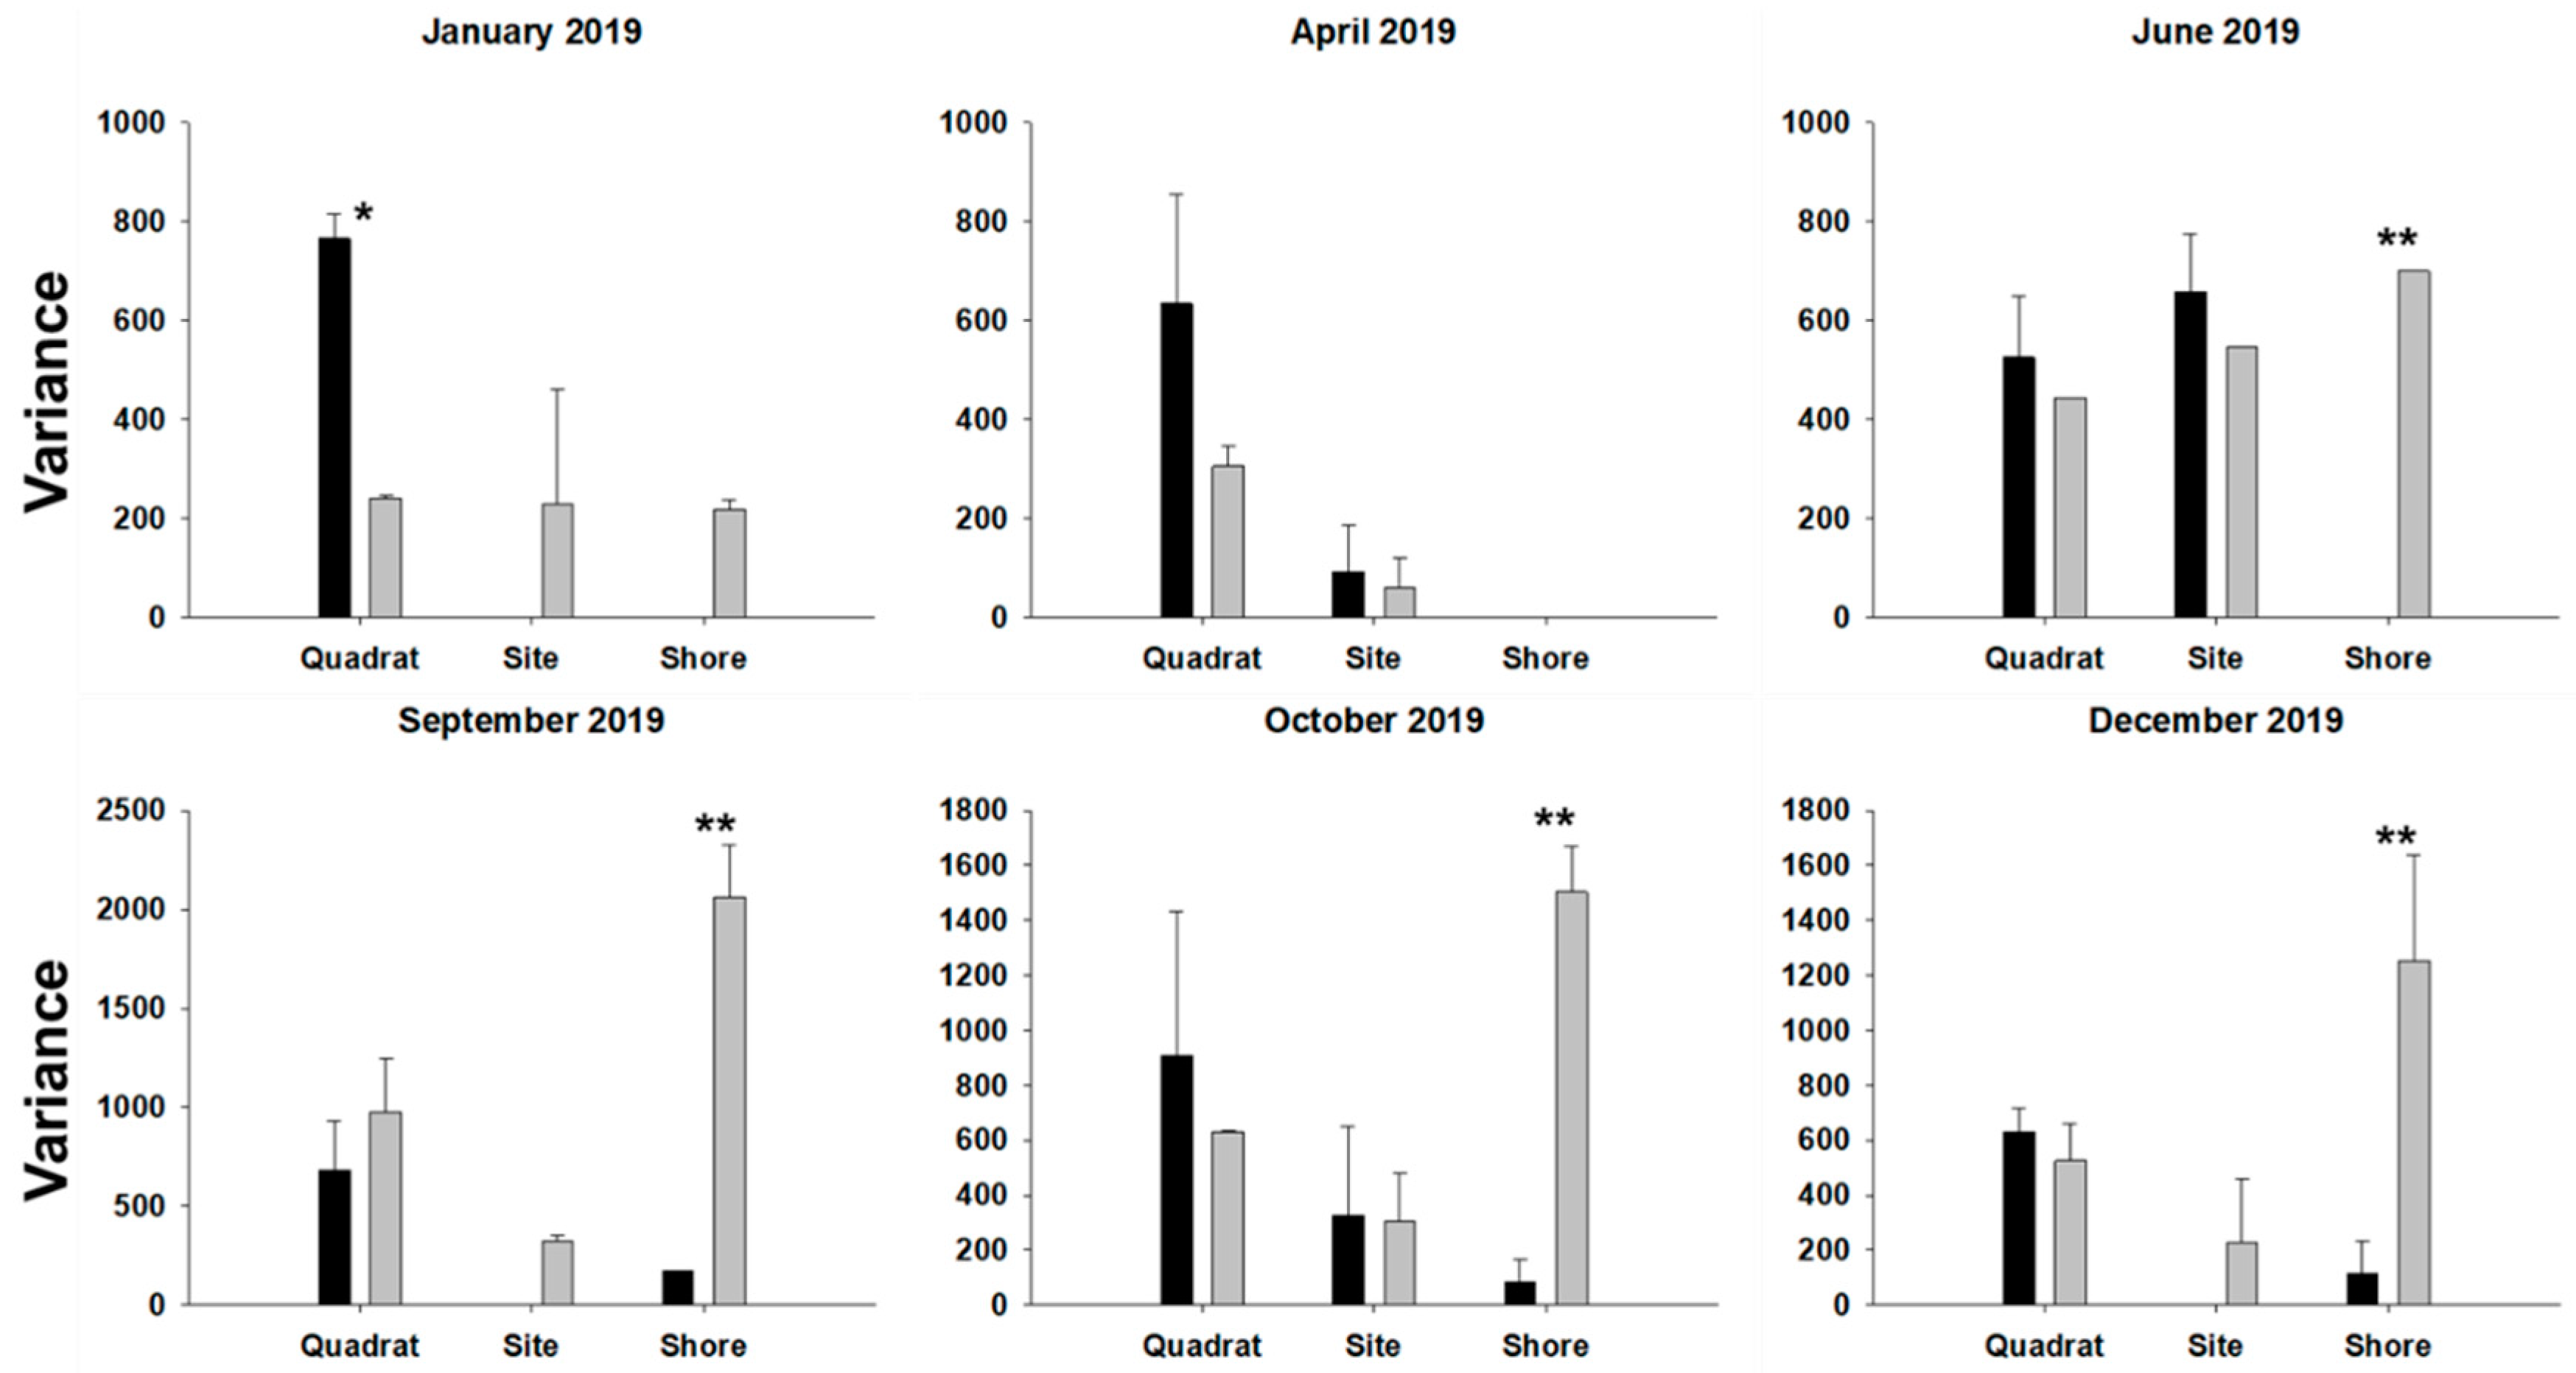
However, the significant interaction Co × Sc × Da indicated different patterns of temporal and spatial variability in the total density between the urban and non-urban conditions (Table 1). Precisely, total density on urban condition was more heterogeneous (i.e., higher variability) than in the non-urban condition at the shore scale for all studied dates except January and April 2019 (Figure 2). Moreover, in January 2019, variability of this response variable between quadrats was larger at non-urban than urban conditions while non-significant differences were observed at all other combinations of scales and dates for this descriptor (Figure 2).
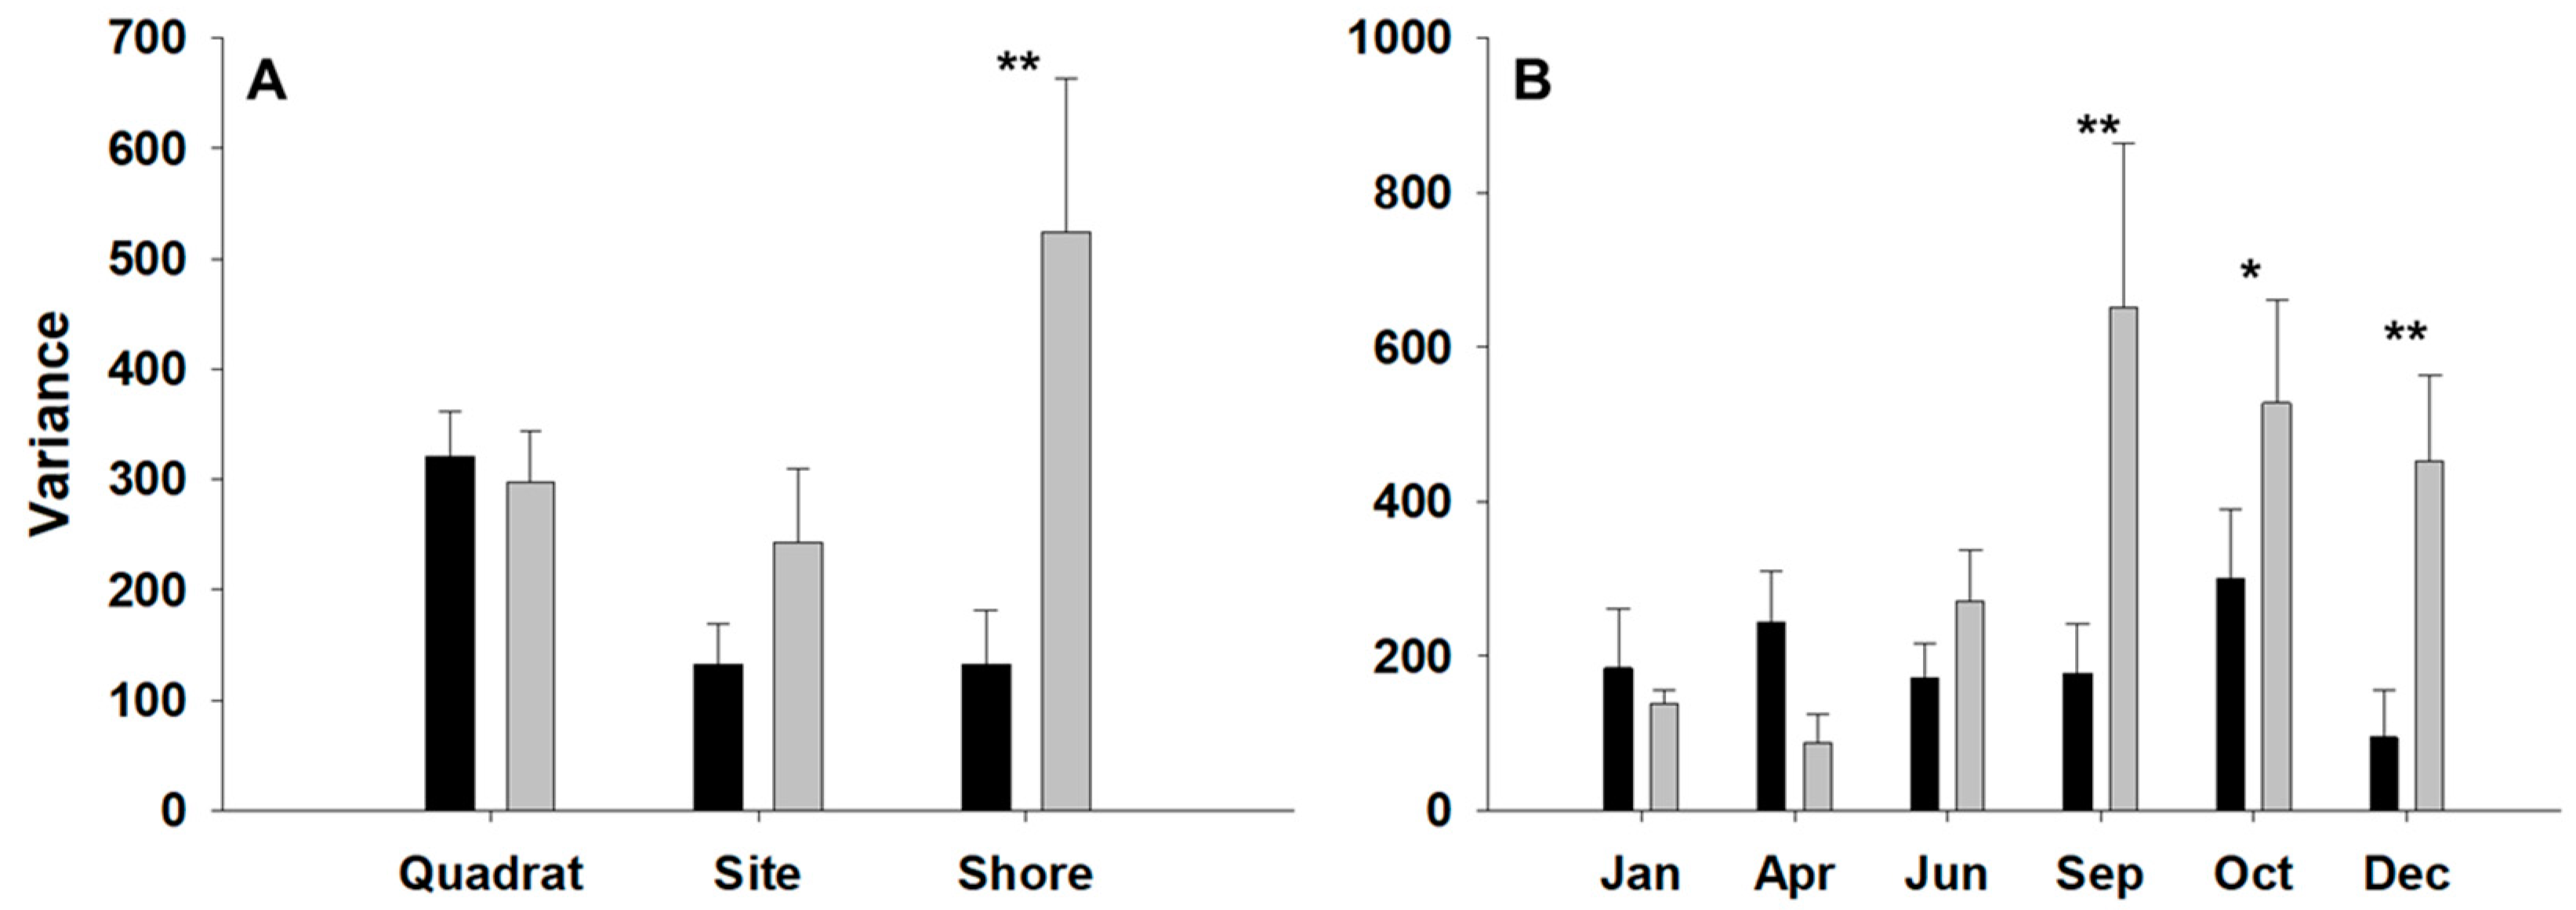
For spat density, the interactions Co × Sc and Co × Da were significant (Table 1). According to the SNK tests, variability of spat density at the shore scale was larger under urban compared to non-urban conditions regardless of the date (Figure 3A). Moreover, irrespective of scale, variability of spat density was larger under urban regarding non-urban conditions in September, October and December 2019 (Figure 3B).
For spat density, the interaction Sc × Da was also significant, indicating different temporal and spatial variability patterns, independently of the condition (Table 1). Specifically, variance at the shore scale was larger compared to the other spatial scales in September and October 2019 (Figure S1).
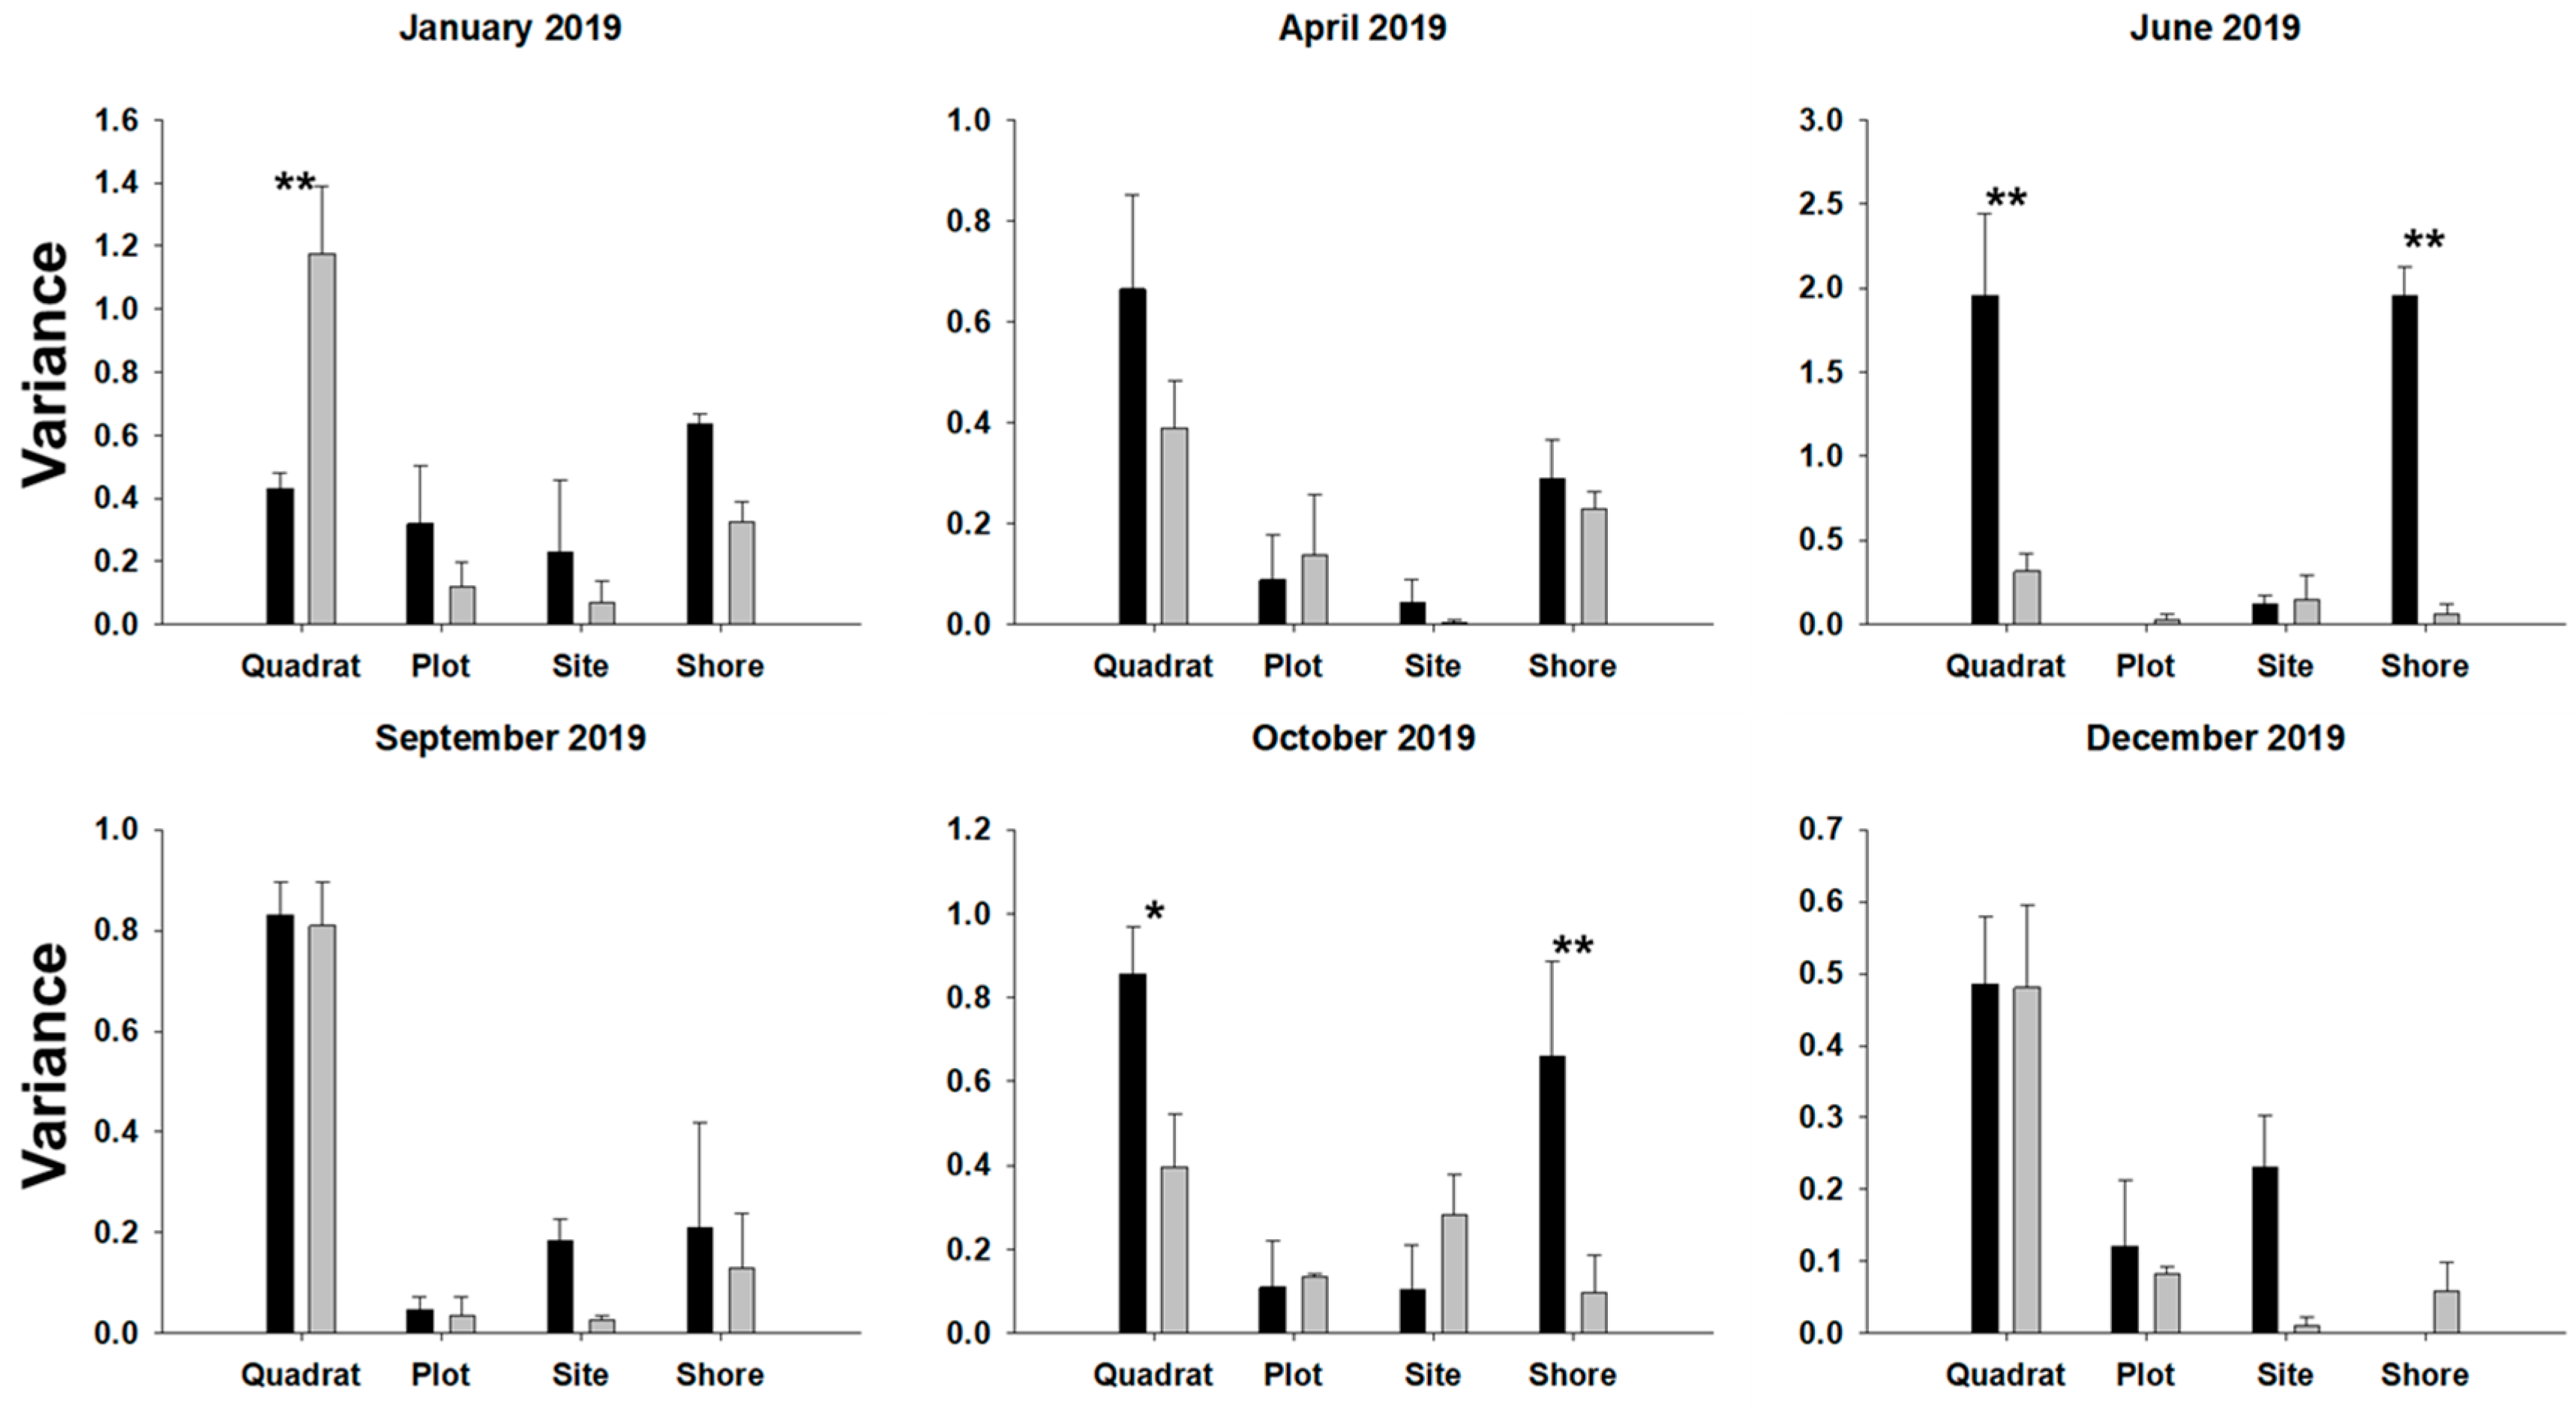
The significant interaction Co × Sc × Da indicated different temporal and spatial variability patterns in the clump thickness between urban and non-urban conditions (Table 2).
Variability of this descriptor between quadrats and shores was larger under non-urban compared to urban conditions in June and October 2019, whereas in January 2019, variability between quadrats was larger under urban compared to non-urban conditions (Figure 4).
The significant interaction Co × Da indicated different variability patterns in the condition index and shell length of M. galloprovincialis between urban and non-urban conditions regardless of the spatial scale (Table 2). Specifically, variability of condition index was larger under non-urban compared to urban conditions in January, June and October 2019 (Figure 5A) and variability of shell length was larger under urban compared to non-urban conditions in January 2019 (Figure 5B).
Moreover, for these two response variables (i.e., condition index and shell length) the interaction Sc × Da was significant, which means that spatial patterns of variability changed with date but independently of the condition (Table 2). Variability of condition index (Figure S2) and shell length (Figure S3) was larger at the quadrat scale on all the studied dates. Moreover, for the condition index, the plot scale showed significantly larger variability compared to site and shore in October 2019; and for shell length, variability at the plot scale was larger at the shore in January 2019 (Figures S2 and S3).

4. Discussion

The relationship between disturbance and population variability is crucial for forecasting whether communities will display stability and resilience when handling stress [22]. As increasing urbanization is one of the most pervasive threats to coastal ecosystems [23,24,25], the present study provided data about variability patterns of M. galloprovincialis populations within a range of scales between urban and non-urban conditions, testing if urbanization influenced these patterns. Obtained results supported this hypothesis because all the studied variables, except percentage cover, showed different patterns between urban and non-urban conditions pointing out that urbanization is able to modify distribution patterns of mussel populations. In general, mussel populations exhibited a higher variability at urban shores. This agrees with previous studies in which disturbances also raise biological variability [18,22,42]. An increasing variability is commonly associated with disturbances of low or moderate intensity [43] and can be interpreted as a first stage of degradation [18]. Mussel populations are vulnerable to different disturbances such as biological invasions, harvesting, trampling or pollution, and these usually reduce the abundance and size of mussels [9,14,30]. Moreover, mussel-density decay has also been reported at urban localities [31,38]. However, Ramos-Oliveira et al. [2] did not find significant differences in mussel populations between the same shores whether they were urban or non-urban. Therefore, the different patterns of variability detected in the present study between urban and non-urban conditions point to the beginning of some degradation, before noticeable changes in mean values of the studied response variables are spotted [22]. Previous works have highlighted that the studied shores considered as urban, show higher concentrations of heavy metals and nutrients than those considered as non-urban [33,34]. Furthermore, a higher population density is commonly associated with a greater trampling and harvesting intensity and a higher input of domestic and industrial sewage [23,24,30]. In this way, considering the highest population density in urban shores, it is also expected that a higher variety and intensity of stressors will act upon them, whose interplay seem to have increased variability of mussel populations, more clearly in terms of total and spat density and shell length. However, different patterns have emerged depending on the considered response variables and the spatial and temporal scale. This makes it difficult to draw general conclusions about variability of mussel populations to distinguish between urban and non-urban conditions. Similarly, Bishop et al. [20] showed the dependency on spatial scale when the effects of the disturbances were assessed, highlighting the need to sample on multiple spatial scales using nested sampling designs for the presumed impacts to be ascertained.
Results of the present study also showed that total density, only at the quadrat scale in January, thickness at the quadrat and shore scales in June and October and condition index in January and June displayed greater variability at non-urban than urban shores. Similarly, other studies have also found that disturbances decreased variability [44,45,46]; this commonly happens at broad scales and under intense impacts capable of removing or altering habitats [43]. Previous studies conducted on the Portuguese coast pointed out that larger variability in most organisms was found where they were more abundant [18,19]. This pattern is the result of a positive relationship between mean and variance, since a minor mean value can block a great variability [47]. This can explain the greater variability of total density at non-urban shores in January because mussel density on that date was also higher in non-urban than urban shores [38]. However, this explanation is inadequate for thickness and condition index data, because Ramos-Oliveira et al. [2] did not detect significant differences on the mean values of these variables between the same shores considered in the present study as urban and non-urban. Hewitt et al. [43] confirmed that the relationship between mean and variance is not necessarily linear, in concordance with results found for condition index and thickness. Regarding the condition index, it is influenced by many factors such as availability of food, temperature, salinity and even the gametogenic cycle. The condition index reaches maximum values during gonadal development and decreases with the start of the spawning [48,49]. Results of this study also showed temporal differences among condition indexes between urban and non-urban shores with low or high variability at urban or non-urban shores depending on the date. Puccinelli et al. [50] showed that urban areas displayed an increase in the proportion of polyunsaturated fatty acids that are considered indicators of exposure to high food availability for benthic filter-feeders such as mussels. In this way, mussels could be better fed on urban shores and this could influence variability of condition index. Since temperature and salinity are similar between urban and non-urban shores, variability of condition index probably could be shaped by food availability and gametogenic cycle, which in turn change between dates.
Mussel clump thickness in intertidal areas is greatly determined by wave action [51]. In this way, differences in hydrodynamic intensity could also change variability of clump thickness because mussels are frequently displaced during storms [52]. Thus, the observed patterns could be the result of differences among the studied shores that determine the effect of wave action, such as the morphology of coastline or the orientation to waves however, the studied shores are similarly exposed to the wave action. Oliveira et al. [53] found that the effect of storms can change between urban and non-urban shores, in this way urbanization could shape the effect of storms on variability of clump thickness.
Results for percentage cover pointed out that M. galloprovincialis occupied similar rocky shores areas regardless of urbanization condition or spatial and temporal scales. Likewise, Chapman et al. [54] did not find differences on variability between control and impact conditions. However, Smith et al. [30] found that mussel percentage cover was affected by human presence and Airoldi and Bulleri [27] pointed out that intense disturbances reduced M. galloprovincialis cover. Other works also found some differences in the variability of mussel cover between urban and extra-urban localities but these were influenced by cover mean values, i.e., since mussels were more abundant on urban shores, they also showed more variability in these areas [18,19]. Nevertheless, this is not applicable to results of this study because previous works did not find significant differences on mussel cover between the same shores considered as urban and non-urban in this study [2,38]. Boaventura et al. [1] showed that M. galloprovincialis cover along the Portuguese coast reached the highest values in the study area (north of Portugal) and declined to the south and Gomes et al. [55] related mussel cover with exposure to wave action. Results of the present study showed that density is an excellent descriptor to assess the effects of anthropogenic disturbances, and this should be considered when planning future studies since most of the works performed at rocky shores use percentage cover.
Another important result is that the most relevant spatial scale of variability changed among the different response variables. For thickness, condition index and shell length most of the variability occurred at the smallest spatial scale (i.e., quadrat). This is considered a universal characteristic of coastal benthic communities [56] being the result of biological interactions and small-scale physical processes that are responsible for this patchy distribution [57,58,59]. However, total and spat density of M. galloprovincialis showed a different pattern; shore was always the most important scale of variability both for spat and total density at urban shores, whereas quadrat/site was the most relevant scale of variability for density at non-urban shores. Therefore, these response variables are mainly shaped by drivers acting at the shore scale. At this scale, different studies have pointed to wave exposition as one of the main drivers shaping the structure of intertidal assemblages [36,60]. Particularly, abundance of M. galloprovincialis is related with exposure to wave action [1,55], but the urbanization condition could also play a relevant role at the shore scale because changes upon different stressors associated with urbanization that influence mussel population (e.g., pollution, trampling, harvesting) mainly act at this scale, as previous studies have pointed out for intertidal shores [36,61].
Therefore, in agreement with previous studies, generalizations linked to spatial variability of populations under disturbance have not yet emerged. Bertoccci et al. [19] has pointed out that the large context dependency of finding a higher or lower variability in natural populations could be itself a common characteristic of urban systems. Considering that urbanization merges very diverse stressors acting at different intensities [23,24,25,26] it could be more difficult to obtain a clear pattern of higher or lower variability than if each stressor was separately weighed. However, ecosystems are indeed submitted to the synergistic effects of different stressors acting at the same time in combination with fluctuations of environmental factors [13,14,32]. In this way, studies assessing the variability of populations can be useful to detect disturbance impacts since changes in patterns of variability can be detected even before responses in mean values were detected [43], as results of the present study showed. Moreover, previous studies conducted in the same area have also indicated a decreasing of mussel density, an increasing of shell length beside changes in abundance of native macroalga canopy and in macrofaunal assemblages associated with M. galloprovincialis beds in intertidal urban shores, in comparison to non-urban ones [6,38,62]. A recent study indicates that Mytilus populations are declining in North Atlantic waters by their extreme exploitation, linked to direct and indirect effects of climate change [63]. Results, therefore, indicated different patterns of variability in mussel populations between urban and non-urban shores. As different stressors associated with urbanization that can influence mussel populations (e.g., pollution, trampling, harvesting) act at the shore scale and most of the differences were found at this scale, it can be speculated that urbanization condition is primarily responsible for observed pattens in mussel populations. However, these patterns cannot be unambiguously attributed to urbanization without testing specific hypotheses by manipulative studies. Nevertheless, the present study provides a good base of empirical knowledge to establish these experiments and for adopting proper management measures.

5. Conclusions

Different patterns of mussel populations reported in this study at urban and non-urban shores should be understood as being at the start of habitat worsening. Considering the economic and ecological importance of M. galloprovincialis, its deterioration could cause unpredictable effects to the whole ecosystem and for human wellbeing making urgent the adoption of proper management plans that minimize the effects of urbanization. The results also pointed out the dependency of urbanization effects on spatial and temporal scales. Thus, to be effective in the adoption of management and mitigation measures, these should consider the relevant scales of variability both in space and time, pointed out by this study; otherwise, they will fail in ameliorating urbanization effects on intertidal ecosystems.

Supplementary Materials

The following supporting information can be downloaded at: https://www.mdpi.com/article/10.3390/w14101570/s1, Figure S1: Variance of the spat density of M. galloprovincialis at different spatial scales and dates; Figure S2: Variance of the condition index of M. galloprovincialis at different spatial scales and dates; Figure S3: Variance of the shell length of M. galloprovincialis at different spatial scales and dates.

Author Contributions

Conceptualization, P.V. and M.R.; methodology, J.M., L.S., M.R. and P.V.; formal analysis, P.V. and M.R.; investigation, J.M., L.S., M.R. and P.V.; resources, M.R. and P.V.; writing—original draft preparation, P.V.; writing—review and editing, J.M., L.S., M.R. and P.V.; supervision, M.R. and P.V.; project administration, P.V.; funding acquisition, P.V. All authors have read and agreed to the published version of the manuscript.

Funding

This research was developed under the Project No. 30181 (PTDC/CTA-AMB/30181/2017), co-financed by COMPETE 2020, Portugal 2020 and the European Union through the ERDF, and by FCT-Foundation for Science and Technology through national funds within the scope of UIDB/04423/2020 and UIDP/04423/2020.

Institutional Review Board Statement

Not applicable.

Informed Consent Statement

Not applicable.

Data Availability Statement

The data presented in this study are available on request from the corresponding author. The data are not publicly available because this data set will be included as part of other ongoing studies.

Acknowledgments

P Veiga was hired through the Regulamento do Emprego Científico e Tecnológico—RJEC from the Portuguese Foundation for Science and Technology (FCT) program (CEECIND/03893/2018). We are grateful to three anonymous referees for all the helpful comments and suggestions, which greatly improved this paper.

Conflicts of Interest

The authors declare no conflict of interest. The funders had no role in the design of the study; in the collection, analyses, or interpretation of data; in the writing of the manuscript, or in the decision to publish the results.

References

  1. Boaventura, D.; Ré, P.; Fonseca, L.C.; Hawkins, S.J. Intertidal rocky shore communities of the continental Portuguese coast: Analyses of distribution patterns. Mar. Ecol. 2002, 23, 69–90. [Google Scholar] [CrossRef]
  2. Ramos-Oliveira, C.; Sampaio, L.; Rubal, M.; Veiga, P. Spatial-temporal variability of Mytilus galloprovincialis Lamarck 1819 populations and their accumulated sediment in northern Portugal. PeerJ 2021, 9, e11499. [Google Scholar] [CrossRef]
  3. Coelho, S.D.; Vieira, H.C.; Oliveira, J.M.M.; Pires, S.F.S.; Rocha, R.J.M.; Rodrigues, A.C.M.; Soares, A.M.V.M.; Bordalo, M.D. How does Mytilus galloprovincialis respond when exposed to the gametophyte phase of the invasive red macroalga Asparagopsis armata exudate? Water 2021, 13, 460. [Google Scholar] [CrossRef]
  4. Musella, M.; Wathsala, R.; Tavella, T.; Rampelli, S.; Barone, M.; Palladino, G.; Biagi, E.; Brigidi, P.; Turroni, S.; Franzellitti, S.; et al. Tissue-scale microbiota of the Mediterranean mussel (Mytilus galloprovincialis) and its relationship with the environment. Sci. Total Environ. 2020, 717, 137209. [Google Scholar] [CrossRef]
  5. Arribas, L.P.; Donnarumma, L.; Palomo, M.G.; Scrosati, A. Intertidal mussels as ecosystem engineers: Their associated invertebrate biodiversity under contrasting wave exposures. Mar. Biodivers. 2014, 44, 203–211. [Google Scholar] [CrossRef]
  6. Torres, A.C.; Rubal, M.; Costa-Garcia, R.; Sousa-Pinto, I.; Veiga, P. Differences in the structure and diversity of invertebrate assemblages harbored by an intertidal ecosystem engineer between urban and non-urban shores. J. Mar. Sci. Eng. 2022, 10, 242. [Google Scholar] [CrossRef]
  7. Kautsky, N.; Evans, S. Role of biodeposition by Mytilus edulis in the circulation of matter and nutrients in a Baltic coastal ecosystem. Mar. Ecol. Prog. Ser. 1987, 38, 201–212. [Google Scholar] [CrossRef]
  8. Gestoso, I.; Arenas, F.; Rubal, M.; Veiga, P.; Peña, M.; Olabarria, C. Shifts from native to non-indigenous mussels: Enhanced habitat complexity and its effects on faunal assemblages. Mar. Environ. Res. 2013, 90, 85–95. [Google Scholar] [CrossRef]
  9. Rius, M.; Cabral, H.N. Human harvesting of Mytilus galloprovincialis Lamarck, 1819, on the central coast of Portugal. Sci. Mar. 2004, 68, 545–551. [Google Scholar] [CrossRef] [Green Version]
  10. Avdelas, L.; Avdic-Mravlje, E.; Borges Marques, A.C.; Cano, S.; Capelle, J.J.; Carvalho, N.; Cozzolino, M.; Dennis, J.; Ellis, T.; Fernández Polanco, J.M.; et al. The decline of mussel aquaculture in the European Union: Causes, economic impacts and opportunities. Rev. Aquac. 2021, 13, 91–118. [Google Scholar] [CrossRef]
  11. Hawkins, S.J.; Pack, K.E.; Hyder, K.; Benedetti-Cecchi, L.; Jenkins, S.R. Rocky shores as tractable test systems for experimental ecology. J. Mar. Biol. Assoc. UK 2020, 100, 1017–1041. [Google Scholar] [CrossRef]
  12. Thompson, R.C.; Crowe, T.P.; Hawkins, S.J. Rocky intertidal communities: Past environmental changes, present status and predictions for the next 25 years. Environ. Conserv. 2002, 29, 168–191. [Google Scholar] [CrossRef]
  13. Kunze, C.; Wölfelschneider, M.; Rölfer, L. Multiple driver impacts on rocky intertidal systems: The need for an integrated approach. Front. Mar. Sci. 2021, 8, 667168. [Google Scholar] [CrossRef]
  14. Crowe, T.P.; Thompson, R.C.; Bray, S.; Hawkins, S.J. Impacts of anthropogenic stress on rocky intertidal communities. J. Aquat. Ecosyst. Stress Recovery 2000, 7, 273–297. [Google Scholar] [CrossRef]
  15. Underwood, A.J. The mechanisms of spatially replicated sampling programmes to detect environmental impact in a variable world. Aust. J. Ecol. 1993, 18, 99–116. [Google Scholar] [CrossRef]
  16. Tsikopoulou, I.; Dimitriou, P.D.; Karakassis, I.; Lampadariou, N.; Papadopoulou, N.; Smith, C.J. Temporal variation in the ecological functioning of benthic communities after 20 years in the Eastern Mediterranean. Front. Mar. Sci. 2021, 8, 768051. [Google Scholar] [CrossRef]
  17. Balata, D.; Bertocci, I.; Piazzi, L.; Nesti, U. Comparison between epiphyte assemblages of leaves and rhizomes of the seagrass Posidonia oceanica subjected to different levels of anthropogenic eutrophication. Estuar. Coast. Shelf Sci. 2008, 79, 533–540. [Google Scholar] [CrossRef]
  18. Oliveira, J.P.; Sousa-Pinto, I.; Weber, G.M.; Bertocci, I. Urban vs. extra-urban environments: Scales of variation of intertidal benthic assemblages in north Portugal. Mar. Environ. Res. 2014, 97, 48–57. [Google Scholar] [CrossRef]
  19. Bertocci, I.; Arenas, F.; Cacabelos, E.; Martins, G.M.; Seabra, M.I.; Álvaro, N.V.; Fernandes, J.N.; Gaião, R.; Mamede, N.; Mulas, M.; et al. Nowhere safe? Exploring the influence of urbanization across mainland and insular seashores in continental Portugal and the Azorean Archipelago. Mar. Pollut. Bull. 2017, 114, 644–655. [Google Scholar] [CrossRef]
  20. Bishop, M.J.; Underwood, A.J.; Archambault, P. Sewage and environmental impact on rocky shores: Necessity of identifying relevant spatial scales. Mar. Ecol. Prog. Ser. 2002, 236, 121–128. [Google Scholar] [CrossRef] [Green Version]
  21. Morrisey, D.J.; Howitt, L.; Underwood, A.J.; Stark, J.S. Spatial variation in soft sediment benthos. Mar. Ecol. Prog. Ser. 1992, 81, 197–204. [Google Scholar] [CrossRef]
  22. Hewitt, J.E.; Thrush, S.F. Do species’ abundance become more spatially variable with stress? Open J. Ecol. 2009, 2, 37–46. [Google Scholar] [CrossRef] [Green Version]
  23. Barragan, J.M.; de Andrés, M. Analysis and trends of the world’s coastal cities and agglomerations. Ocean Coast. Manag. 2015, 114, 11–20. [Google Scholar] [CrossRef]
  24. Todd, P.A.; Heery, E.C.; Loke, L.H.L.; Thurstan, R.H.; Kotze, D.J.; Swan, C. Towards an urban marine ecology: Characterizing the drivers, patterns and processes of marine ecosystems in coastal cities. Oikos 2019, 128, 1215–1242. [Google Scholar] [CrossRef] [Green Version]
  25. Momota, K.; Hosokawa, S. Potential impacts of marine urbanization on benthic macrofaunal diversity. Sci. Rep. 2021, 11, 4028. [Google Scholar] [CrossRef]
  26. Mayer-Pinto, M.; Cole, V.J.; Johnston, E.L.; Bugnot, A.; Hurst, H.; Airoldi, L.; Glasby, T.M.; Dafforn, K.A. Functional and structural responses to marine urbanisation. Environ. Res. Lett. 2018, 13, 014009. [Google Scholar] [CrossRef]
  27. Airoldi, L.; Bulleri, F. Anthropogenic disturbance can determine the magnitude of opportunistic species responses on marine urban infrastructures. PLoS ONE 2010, 6, e22985. [Google Scholar] [CrossRef] [Green Version]
  28. Bulleri, F. Is it time for urban ecology to include the marine realm? Trends Ecol. Evol. 2006, 21, 658–659. [Google Scholar] [CrossRef]
  29. Airoldi, L.; Beck, M.W. Loss, status and trends for coastal marine habitats of Europe. Oceanogr. Mar. Biol. Annu. Rev. 2007, 45, 345–405. [Google Scholar]
  30. Smith, J.R.; Murray, S.N. The effects of experimental bait collection and trampling on a Mytilus californianus mussel bed in southern California. Mar. Biol. 2005, 147, 699–706. [Google Scholar] [CrossRef]
  31. Carranza, A.; Defeo, O.; Beck, M.; Castilla, J.C. Linking fisheries management and conservation in bioengineering species: The case of South American mussels (Mytilidae). Rev. Fish Biol. Fish. 2009, 19, 349–366. [Google Scholar] [CrossRef] [Green Version]
  32. Crain, C.M.; Kroeker, K.; Halpern, B.S. Interactive and cumulative effects of multiple human stressors in marine systems. Ecol. Lett. 2008, 11, 1304–1315. [Google Scholar] [CrossRef] [PubMed]
  33. Rubal, M.; Veiga, P.; Reis, P.A.; Bertocci, I.; Sousa-Pinto, I. Effects of subtle pollution at different levels of biological organisation on species-rich assemblages. Environ. Pollut. 2014, 191, 101–110. [Google Scholar] [CrossRef] [PubMed]
  34. Reis, P.A.; Cassiano, J.; Veiga, P.; Rubal, M.; Sousa-Pinto, I. Fucus spiralis as monitoring tool of metal contamination in the northwest coast of Portugal under the European Water Framework Directives. Environ. Monit. Assess. 2014, 186, 5447–5460. [Google Scholar] [CrossRef]
  35. Dias, J.M.A.; Gonzalez, R.; Garcia, C.; Diaz-del Rio, V. Sediment distribution patterns on the Galicia-Minho continental shelf. Prog. Oceanogr. 2002, 52, 215–231. [Google Scholar] [CrossRef]
  36. Veiga, P.; Rubal, M.; Vieira, R.; Arenas, F.; Sousa-Pinto, I. Spatial variability in intertidal macroalgal assemblages on the North Portuguese coast. Consistence between species and functional groups approaches. Helgol. Mar. Res. 2013, 67, 191–201. [Google Scholar] [CrossRef] [Green Version]
  37. Lemos, R.T.; Pires, H.O. The upwelling regime off the west Portuguese coast, 1941–2000. Int. J. Climatol. 2004, 24, 511–515. [Google Scholar] [CrossRef]
  38. Veiga, P.; Ramos-Oliveira, C.; Sampaio, L.; Rubal, M. The role of urbanisation in affecting Mytilus galloprovincialis. PLoS ONE 2020, 15, e0232797. [Google Scholar] [CrossRef]
  39. Dethier, M.N.; Graham, E.S.; Cohen, S.; Tear, L.M. Visual versus random-point percent cover estimations: “Objective” is not always better. Mar. Ecol. Prog. Ser. 1993, 96, 93–100. [Google Scholar] [CrossRef]
  40. Underwood, A.J. Experiments in Ecology: Their Logical Design and Interpretation Using Analysis of Variances, 2nd ed.; Cambridge University Press: Cambridge, UK, 1997. [Google Scholar]
  41. Fletcher, D.J.; Underwood, A.J. How to cope with negative estimates of components of variance in ecological field studies. J. Exp. Mar. Biol. Ecol. 2002, 273, 89–95. [Google Scholar] [CrossRef]
  42. Warwick, R.M.; Clarke, K.R. Increased variability as a symptom of stress in marine communities. J. Exp. Mar. Biol. Ecol. 1993, 172, 215–226. [Google Scholar] [CrossRef]
  43. Hewitt, J.; Thrush, S.; Lohrer, A.; Townsend, M. A latent threat to biodiversity: Consequences of small-scale heterogeneity loss. Biodivers. Conserv. 2010, 19, 1315–1323. [Google Scholar] [CrossRef]
  44. Olden, J.D.; Rooney, T.P. On defining and quantifying biotic homogenization. Glob. Ecol. Biogeogr. 2006, 15, 113–120. [Google Scholar] [CrossRef]
  45. Martins, C.D.L.; Arantes, N.; Faveri, C.; Batista, M.B.; Oliveira, E.C.; Pagliosa, P.R.; Fonseca, A.L.; Nunes, J.M.C.; Chow, F.; Pereira, S.B.; et al. The impact of coastal urbanization on the structure of phytobenthic communities in southern Brazil. Mar. Pollut. Bull. 2012, 64, 772–778. [Google Scholar] [CrossRef] [PubMed]
  46. Bahartan, K.; Zibdah, M.; Ahmed, Y.; Israel, A.; Brickner, I.; Abelson, A. Macroalgae in the coral reefs of Eilat (Gulf of Aqaba, Red Sea) as a possible indicator of reef degradation. Mar. Pollut. Bull. 2010, 60, 759–764. [Google Scholar] [CrossRef] [PubMed]
  47. Taylor, L.R. Aggregation, variance and the mean. Nature 1961, 189, 732–735. [Google Scholar] [CrossRef]
  48. Okumus, I.; Stirling, H.P. Seasonal variations in the meat weight, condition index and biochemical composition of mussels (Mytilus edulis L.) in suspended culture in two Scottish sea lochs. Aquaculture 1998, 159, 249–261. [Google Scholar] [CrossRef]
  49. Çelik, M.Y.; Karayücel, S.; Karayücel, I.; Öztürk, R.; Eyüboglu, B. Meat yield, condition index and biochemical composition of mussels (Mytilus galloprovincialis Lamarck, 1819) in Sinop, South of the Black Sea. J. Aquat. Food Prod. Technol. 2012, 21, 198–205. [Google Scholar] [CrossRef]
  50. Puccinelli, E.; Noyon, M.; McQuaid, C.D. Does proximity to urban centres affect the dietary regime of marine benthic filter feeders? Estuar. Coast. Shelf Sci. 2016, 169, 147–157. [Google Scholar] [CrossRef]
  51. Zardi, G.I.; McQuaid, C.D.; Nicastro, K.R. Balancing survival and reproduction: Seasonality of wave action, attachment strength and reproductive output in indigenous Perna perna and invasive Mytilus galloprovincialis mussels. Mar. Ecol. Prog. Ser. 2007, 334, 155–163. [Google Scholar] [CrossRef]
  52. Zardi, G.I.; Nicastro, K.R.; McQuaid, C.D.; Rius, M.; Porri, F. Hydrodynamic stress and habitat partitioning between indigenous (Perna perna) and invasive (Mytilus galloprovincialis) mussels: Constraints of an evolutionary strategy. Mar. Biol. 2006, 150, 79–88. [Google Scholar] [CrossRef]
  53. Oliveira, J.P.; Sousa-Pinto, I.; Weber, G.M.; Bertocci, I. Interplay of experimental harvesting and climate-related disturbance on benthic assemblages of rocky sea shores. Mar. Ecol. Prog. Ser. 2014, 495, 131–142. [Google Scholar] [CrossRef] [Green Version]
  54. Chapman, M.G.; Underwood, A.J.; Skilleter, G.A. Variability at different spatial scales between a subtidal assemblage exposed to the discharge of sewage and two control assemblages. J. Exp. Mar. Biol. Ecol. 1995, 189, 103–122. [Google Scholar] [CrossRef]
  55. Gomes, I.; Peteiro, L.; Bueno-Pardo, J.; Albuquerque, R.; Pérez-Jorge, S.; Oliveira, E.R.; Alves, F.L.; Queiroga, H. What’s a picture really worth? On the use of drone aerial imagery to estimate intertidal rocky shore mussel demographic parameters. Estuar. Coast. Shelf Sci. 2018, 213, 185–198. [Google Scholar] [CrossRef]
  56. Fraschetti, S.; Terlizzi, A.; Benedetti-Cecchi, L. Patterns of distribution of marine assemblages from rocky shores: Evidence of relevant scales of variation. Mar. Ecol. Prog. Ser. 2005, 296, 13–29. [Google Scholar] [CrossRef] [Green Version]
  57. Legendre, P.; Thrush, S.F.; Cummings, V.J.; Dayton, P.K.; Grant, J.; Hewitt, J.E.; Hines, A.H.; McArdle, B.H.; Pridmore, R.D.; Schneider, D.C.; et al. Spatial structure of bivalves in a sandflat: Scale and generating processes. J. Exp. Mar. Biol. Ecol. 1997, 216, 99–128. [Google Scholar] [CrossRef]
  58. Benedetti-Cecchi, L.; Bulleri, F.; Acunto, S.; Cinelli, F. Scales of variation in the effects of limpets on rocky shores in the northwest Mediterranean. Mar. Ecol. Prog. Ser. 2001, 209, 131–141. [Google Scholar] [CrossRef] [Green Version]
  59. Coleman, M.A. Small-scale spatial variability in intertidal and subtidal turfing algal assemblages and the temporal generality of these patterns. J. Exp. Mar. Biol. Ecol. 2002, 267, 53–74. [Google Scholar] [CrossRef]
  60. Tuya, F.; Haroun, R.J. Spatial patterns and response to wave exposure of shallow water algal assemblages across the Canarian archipelago: A multi-scaled approach. Mar. Ecol. Prog. Ser. 2006, 311, 15–28. [Google Scholar] [CrossRef]
  61. Araújo, R.; Vaselli, S.; Almeida, M.; Serrão, E.; Sousa-Pinto, I. Effects of disturbance on marginal populations: Human trampling on Ascophyllum nodosum assemblages at its southern distribution limit. Mar. Ecol. Prog. Ser. 2009, 378, 81–92. [Google Scholar] [CrossRef] [Green Version]
  62. Rubal, M.; Torres, A.C.; Veiga, P. Low diversity of intertidal canopy-forming macroalgae at urbanized areas along the North Portuguese coast. Diversity 2020, 12, 211. [Google Scholar] [CrossRef]
  63. Baden, S.; Hernroth, B.; Lindahl, O. Declining popularions of Mytilus spp. In north Atlantic coastal waters-A Swedish perspective. J. Shellfish Res. 2021, 40, 269–296. [Google Scholar] [CrossRef]
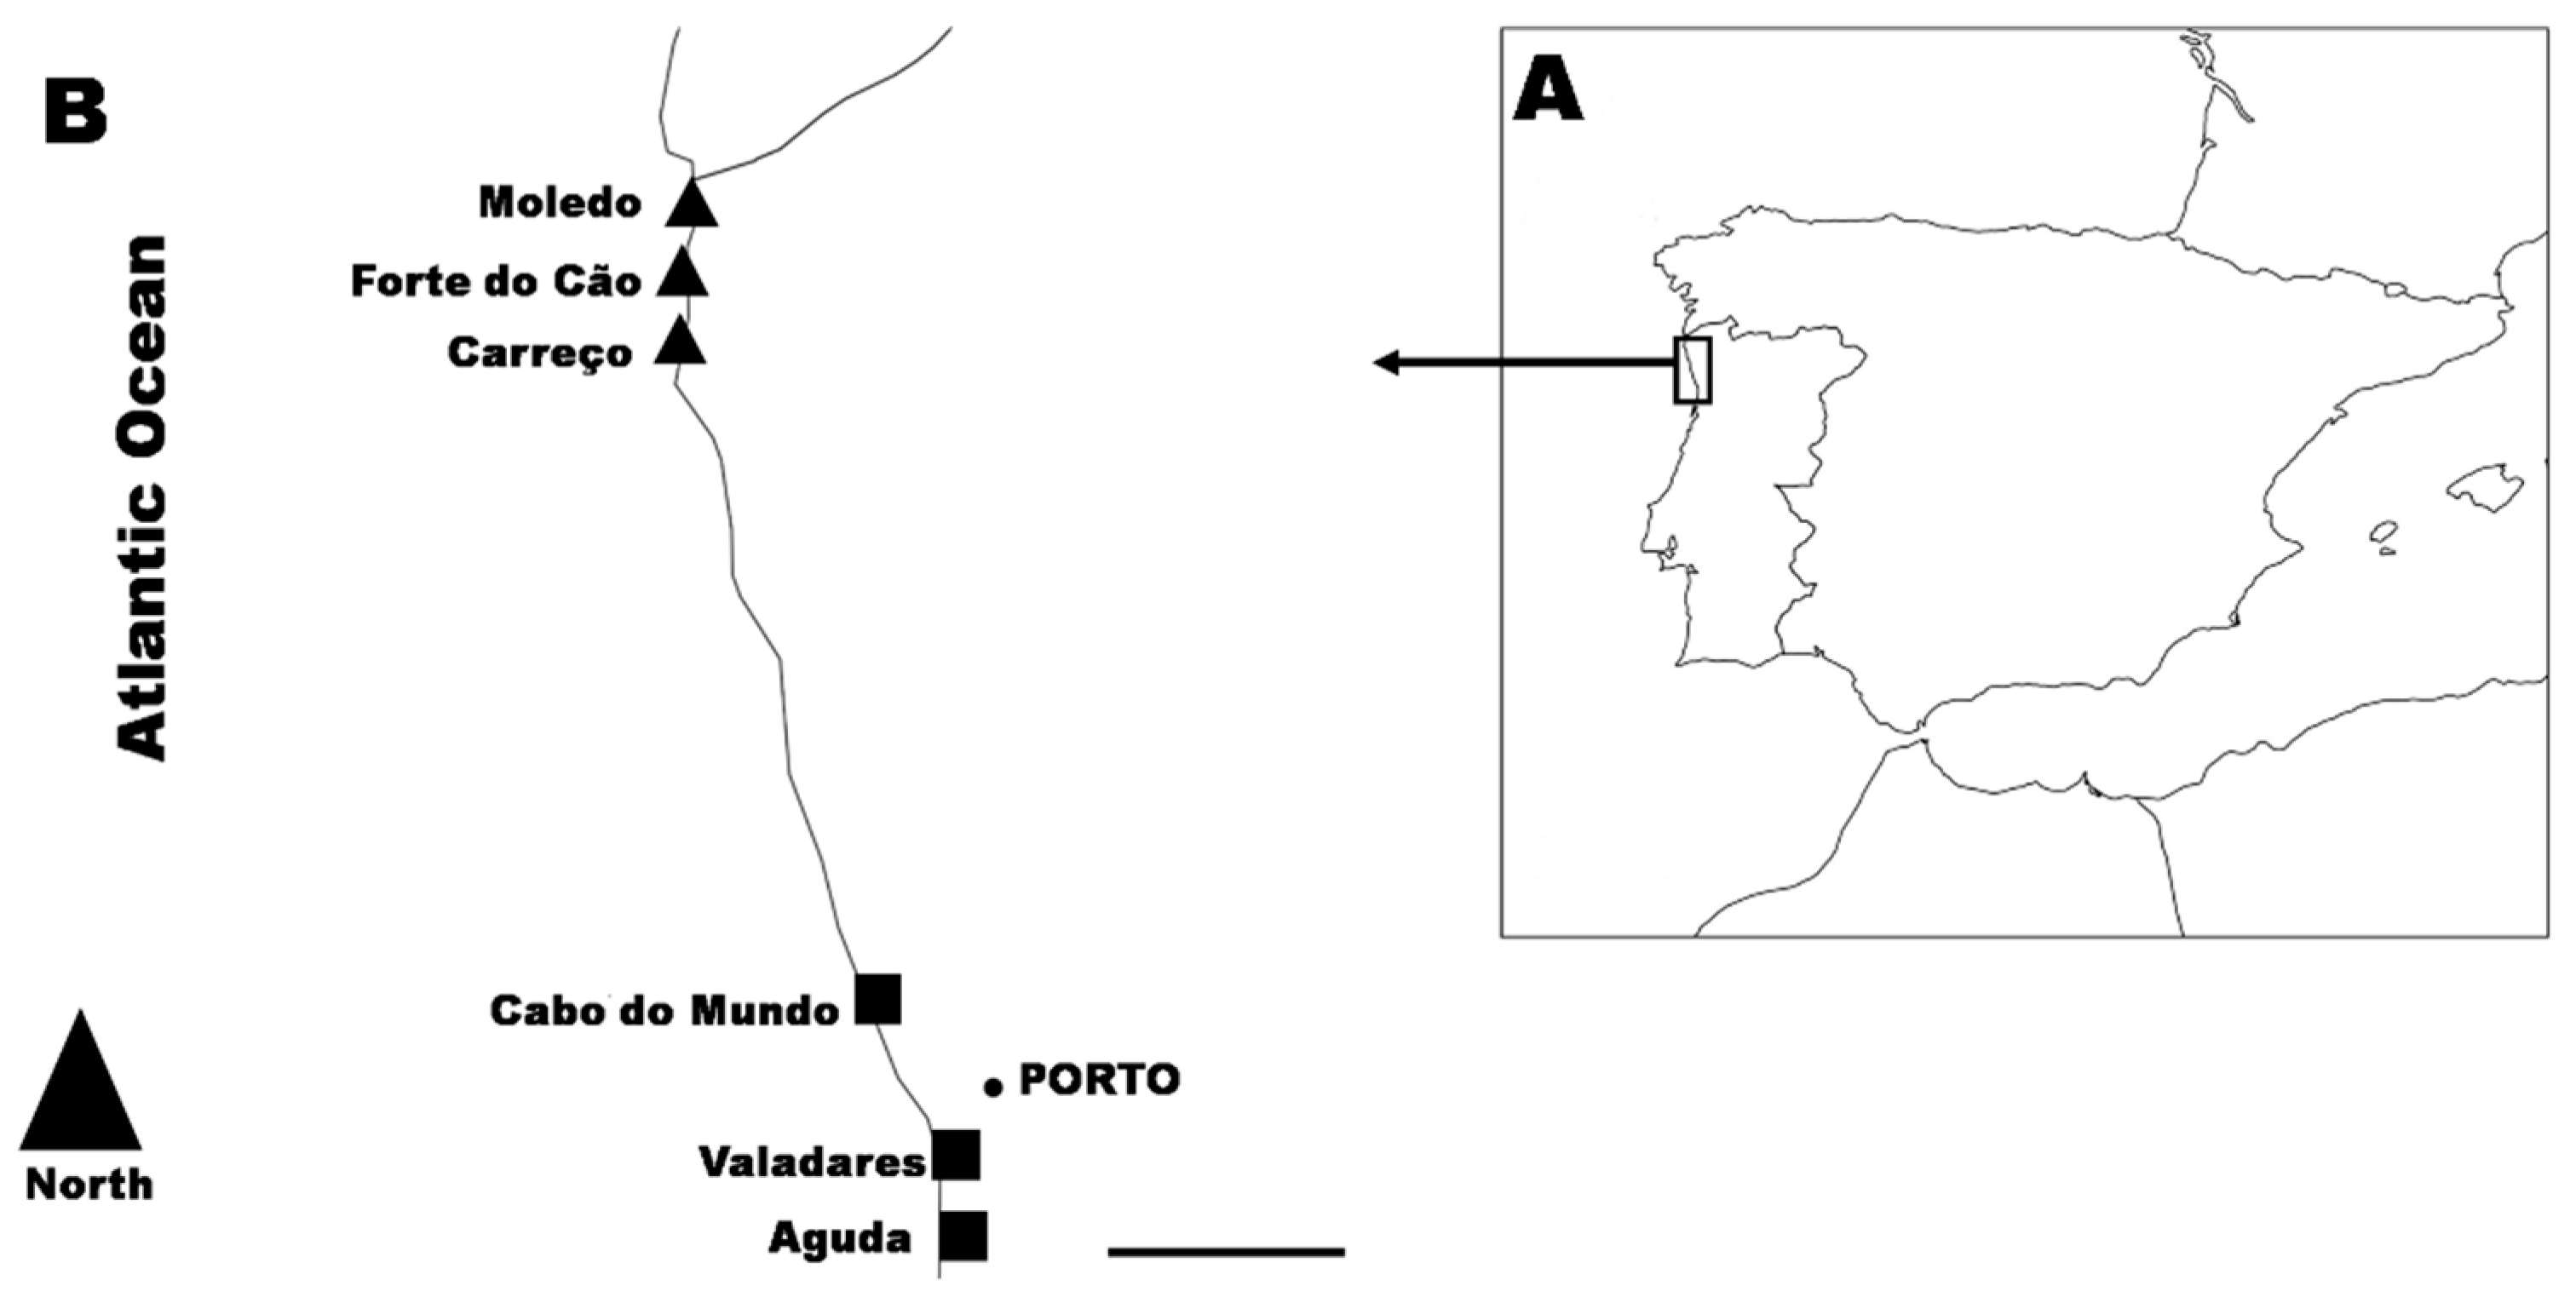
Figure 1. Map showing location of the study area (A) and the six studied shores (B). Triangles: non-urban shores; squares: urban shores. Scale bar: 15 km.
Water 14 01570 g001
Figure 2. Univariate measures (mean ± SE, n = 2) of variance of the total density (square root transformed) of M. galloprovincialis from non-urban (black) and urban (grey) conditions at three spatial scales and six sampling dates. Stars above bars show significant differences indicated by SNK tests performed for the interaction Co × Sc × Da; note: only comparisons within each spatial scale are proper; * = p < 0.05, ** = p < 0.01.
Water 14 01570 g002
Figure 3. Univariate measures (mean ± SE, n = 12) of variance of the spat density (square root transformed) of M. galloprovincialis from non-urban (black) and urban (grey) conditions at three spatial scales (A) and at six sampling dates (mean ± SE, n = 6) (B). Stars above bars show significant differences indicated by SNK tests performed for the interaction Co × Sc (A) and Co × Da (B); note: only comparisons between conditions within each spatial scale (A) and date (B) are proper; * = p < 0.05, ** = p < 0.01).
Water 14 01570 g003
Figure 4. Univariate measures (mean ± SE, n = 2) of variance of the clump thickness (square root transformed) of M. galloprovincialis from non-urban (black) and urban (grey) conditions at three spatial scales and six sampling dates. Stars above bars show significant differences indicated by SNK tests performed for the interaction Co × Sc × Da; note: only comparisons within each spatial scale are proper; * = p < 0.05, ** = p < 0.01.
Water 14 01570 g004
Figure 5. Univariate measures (mean ± SE, n = 6) of variance of the condition index (X × 10,000 transformed) (A) and shell length (B) of M. galloprovincialis from non-urban (black) and urban (grey) conditions at six sampling dates. Stars above bars show significant differences indicated by SNK tests performed for the interaction Co × Da; note: only comparisons between conditions within each date are proper; * = p < 0.05, ** = p < 0.01).
Water 14 01570 g005
Table 1. ANOVA examining temporal and spatial differences in the variance of the percentage cover, total density and spat density of M. galloprovincialis under urban and non-urban conditions.
Source of VariationdfCoverTotal DensitySpat Density
MSFMSFMSF
Condition (Co)13456.371.661,387,337.643.91458,779.652.67
Scale (Sc)218,846.573.00883,172.353.57138,364.761.56
Date (Da)55607.861.45497,718.779.09 ***159,094.974.96 **
Co × Sc24863.730.651,822,685.0012.99 ***269,158.695.82 *
Co × Da52077.760.54354,896.746.48 ***171,718.285.36 ***
Sc × Da106274.561.62247,048.184.51 ***88,666.112.77 *
Co × Sc × Da107443.191.92140,352.822.56 *46,268.341.44
Residual363875.38 54,741.74 32,050.96
Total71
Transformation noneSquare rootSquare root
Cochran’s test C = 0.22nsC = 0.28nsC = 0.19ns
df: degrees of freedom; MS: mean squares; F: F-ratio; ns: not significant; * = p < 0.05; ** = p < 0.01; *** = p < 0.001. Relevant significant differences (i.e., including fixed factors) are indicated in bold.
Table 2. ANOVA examining temporal and spatial differences in the variance of the clump thickness, condition index and shell length of M. galloprovincialis under urban and non-urban conditions.
Source of VariationdfThicknessCondition IndexShell Length
MSFMSFMSF
Condition (Co)11.052.382.200.830.011.41
Scale (Sc)32.0814.99 ***82.4827.66 ***0.7745.84 ***
Date (Da)50.3210.02 ***5.848.70 ***0.0211.18 ***
Co × Sc30.261.061.963.160.0031.33
Co × Da50.4413.87 ***2.643.93 **0.014.54 **
Sc × Da150.144.38 ***2.984.44 ***0.0212.30 ***
Co × Sc × Da150.257.75***0.620.920.0021.72
Residual480.03 0.67 0.001
Total95
Transformation noneX × 10,000none
Cochran’s test C = 0.31sC = 0.25sC = 0.65s
df: degrees of freedom; MS: mean squares; F: F-ratio; s: significant; ** = p < 0.01; *** = p < 0.001. Relevant significant differences (i.e., including fixed factors) are indicated in bold.
Publisher’s Note: MDPI stays neutral with regard to jurisdictional claims in published maps and institutional affiliations.