
Comparison of Effluent Suspended Solid Concentrations from Two Types of Rectangular Secondary Clarifiers


Abstract
:1. Introduction
2. Materials and Methods
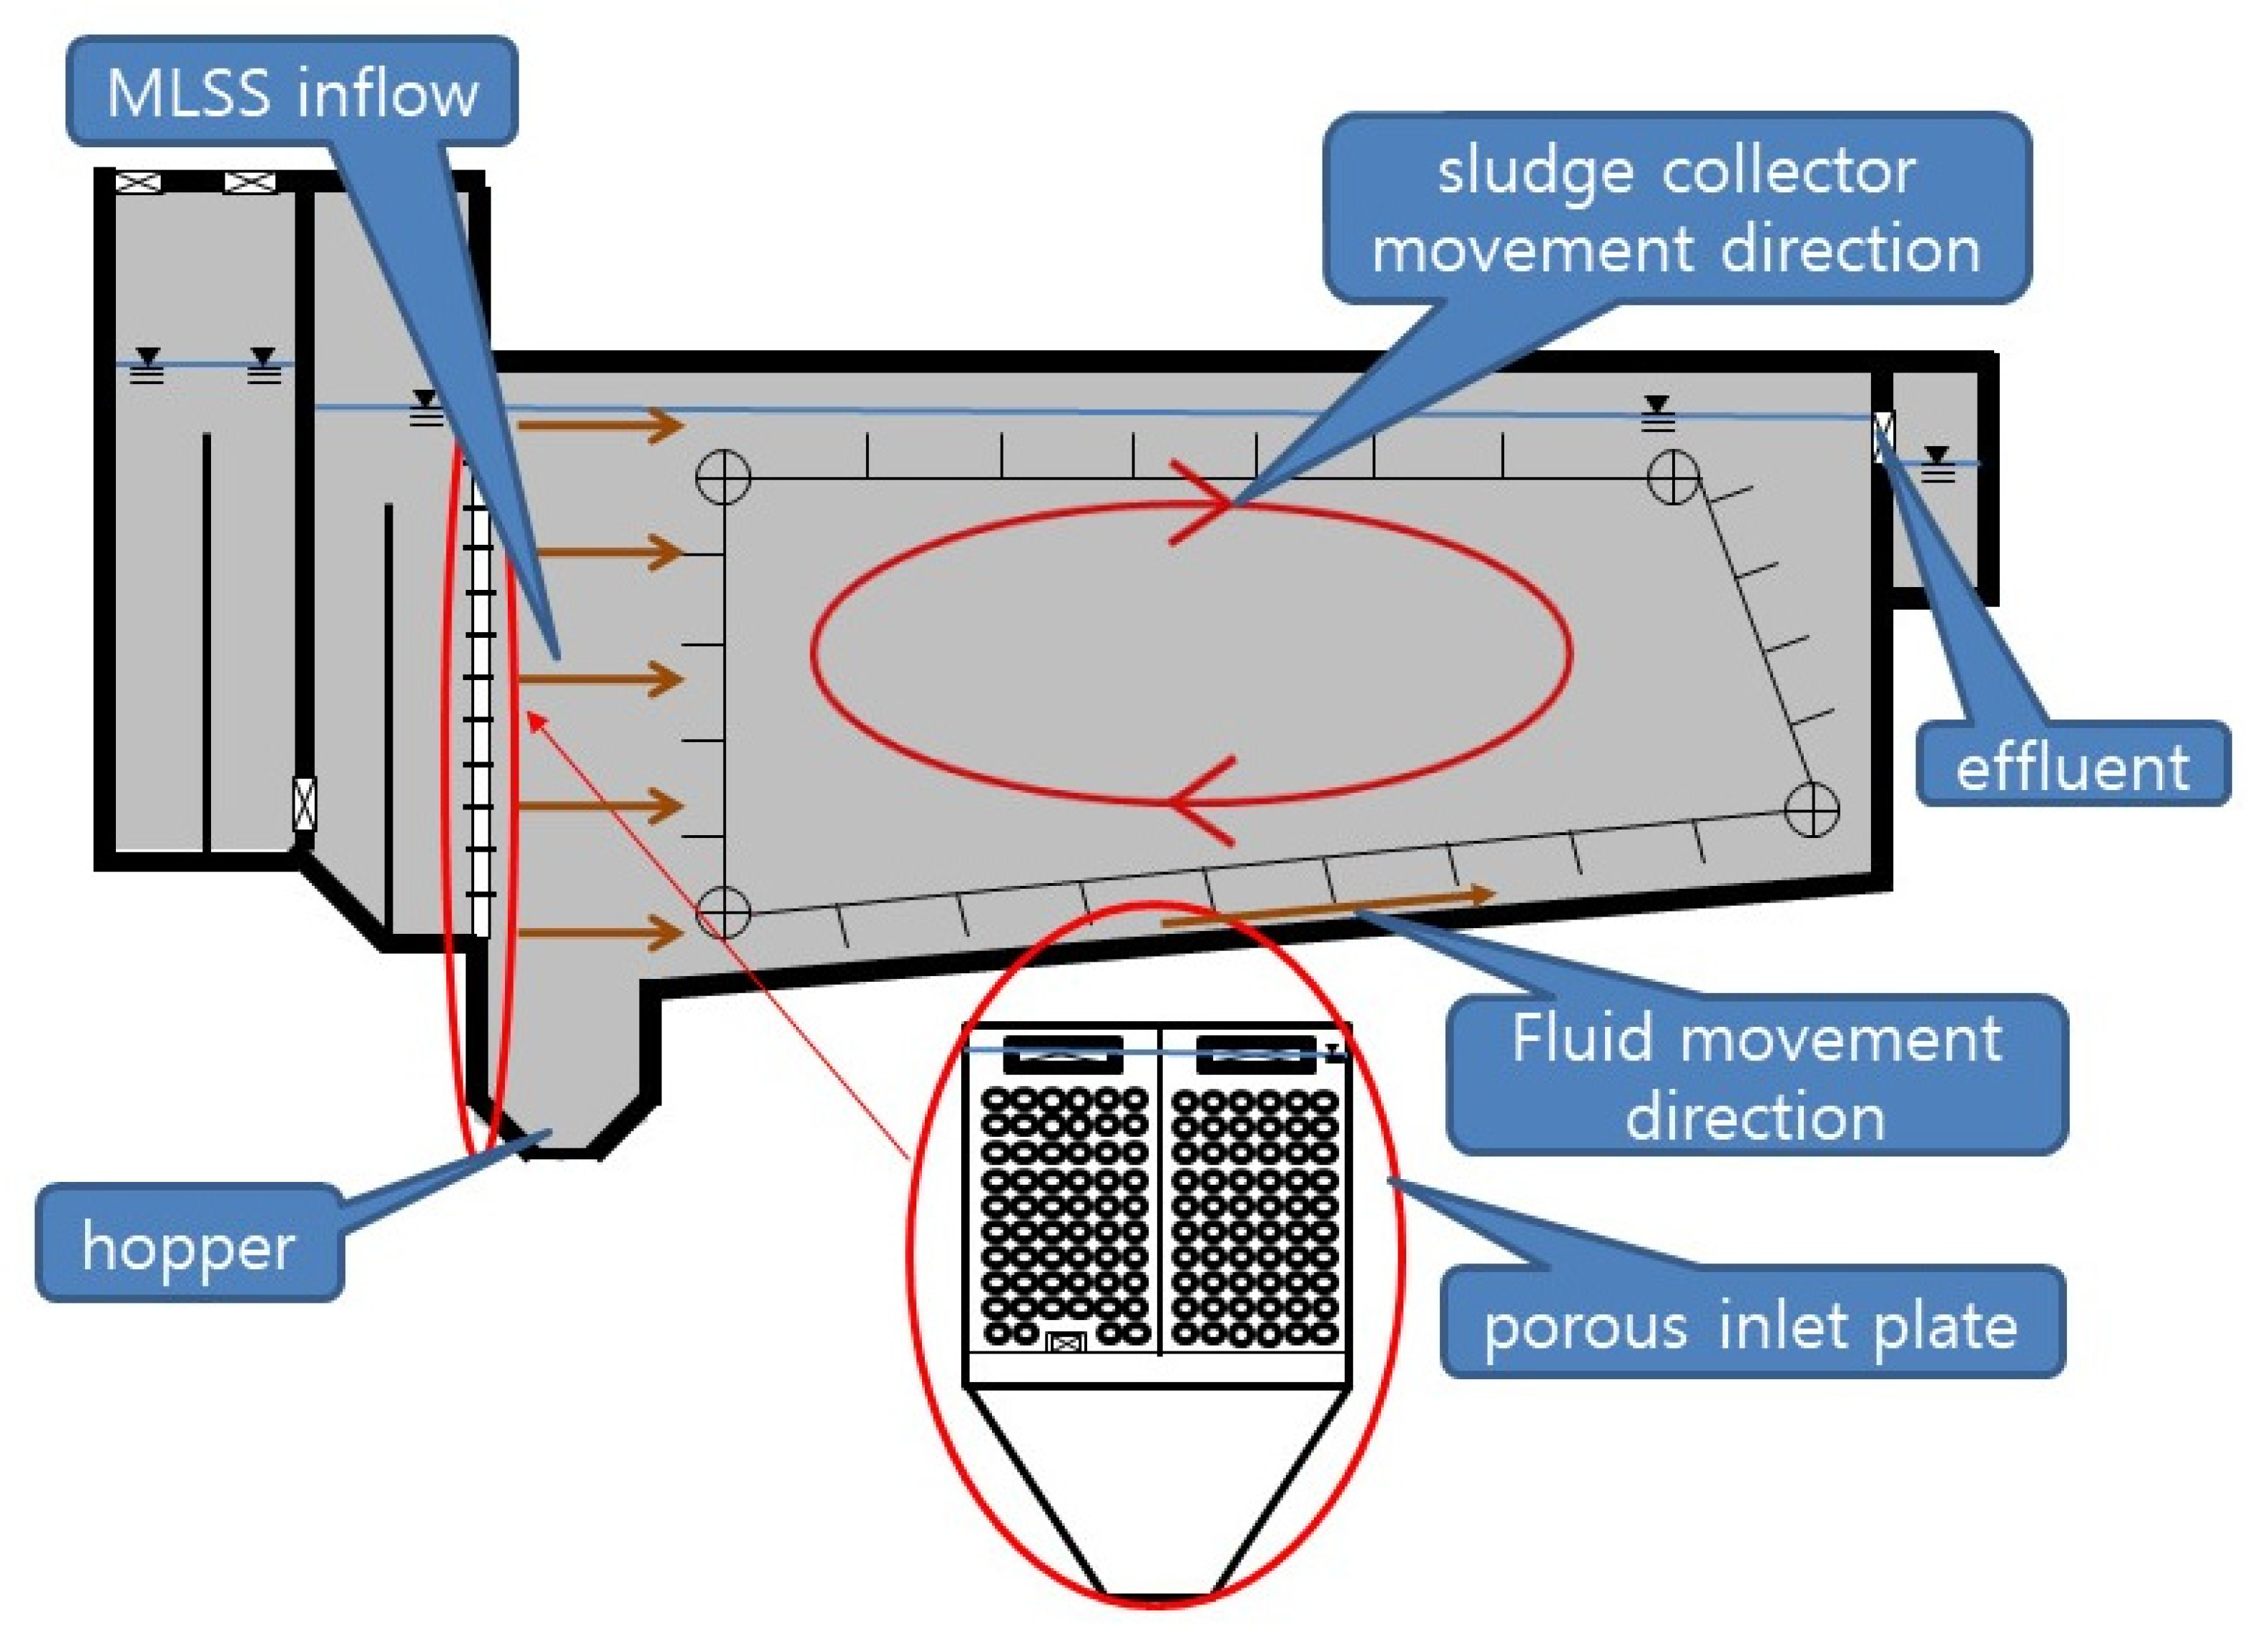
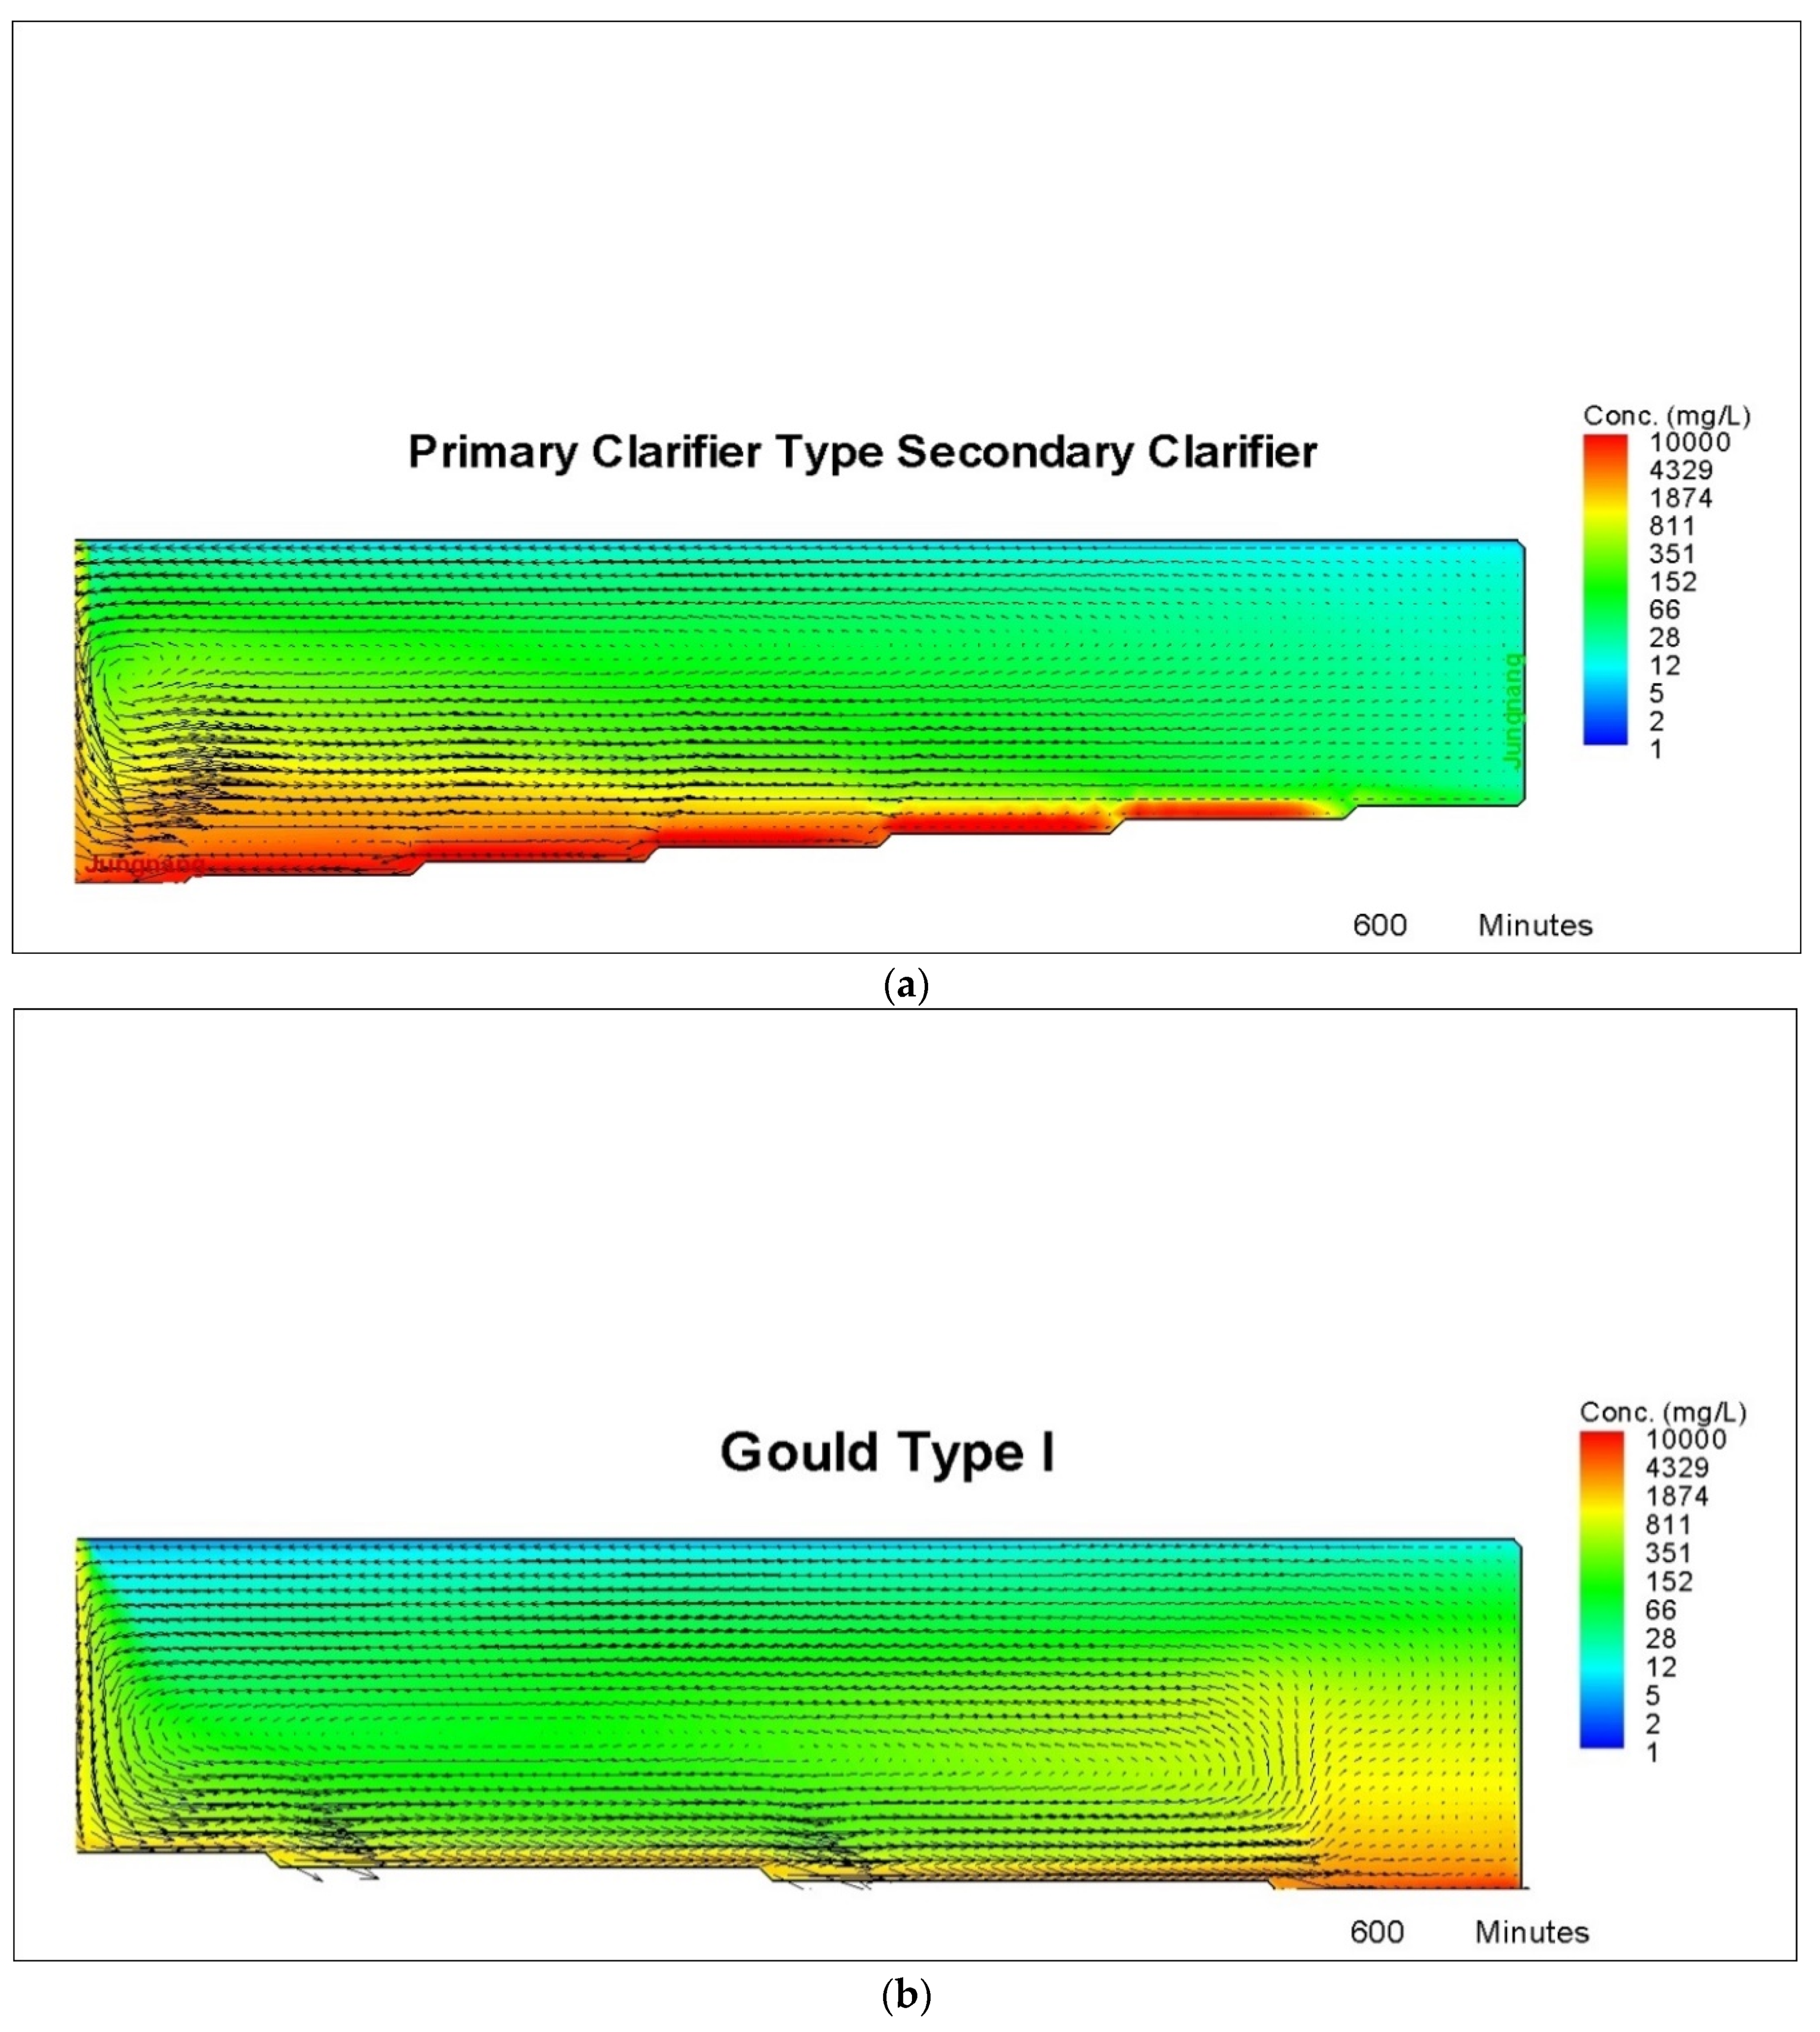
2.1. Plant A—With Primary Rectangular Clarifier-Type Secondary Clarifier
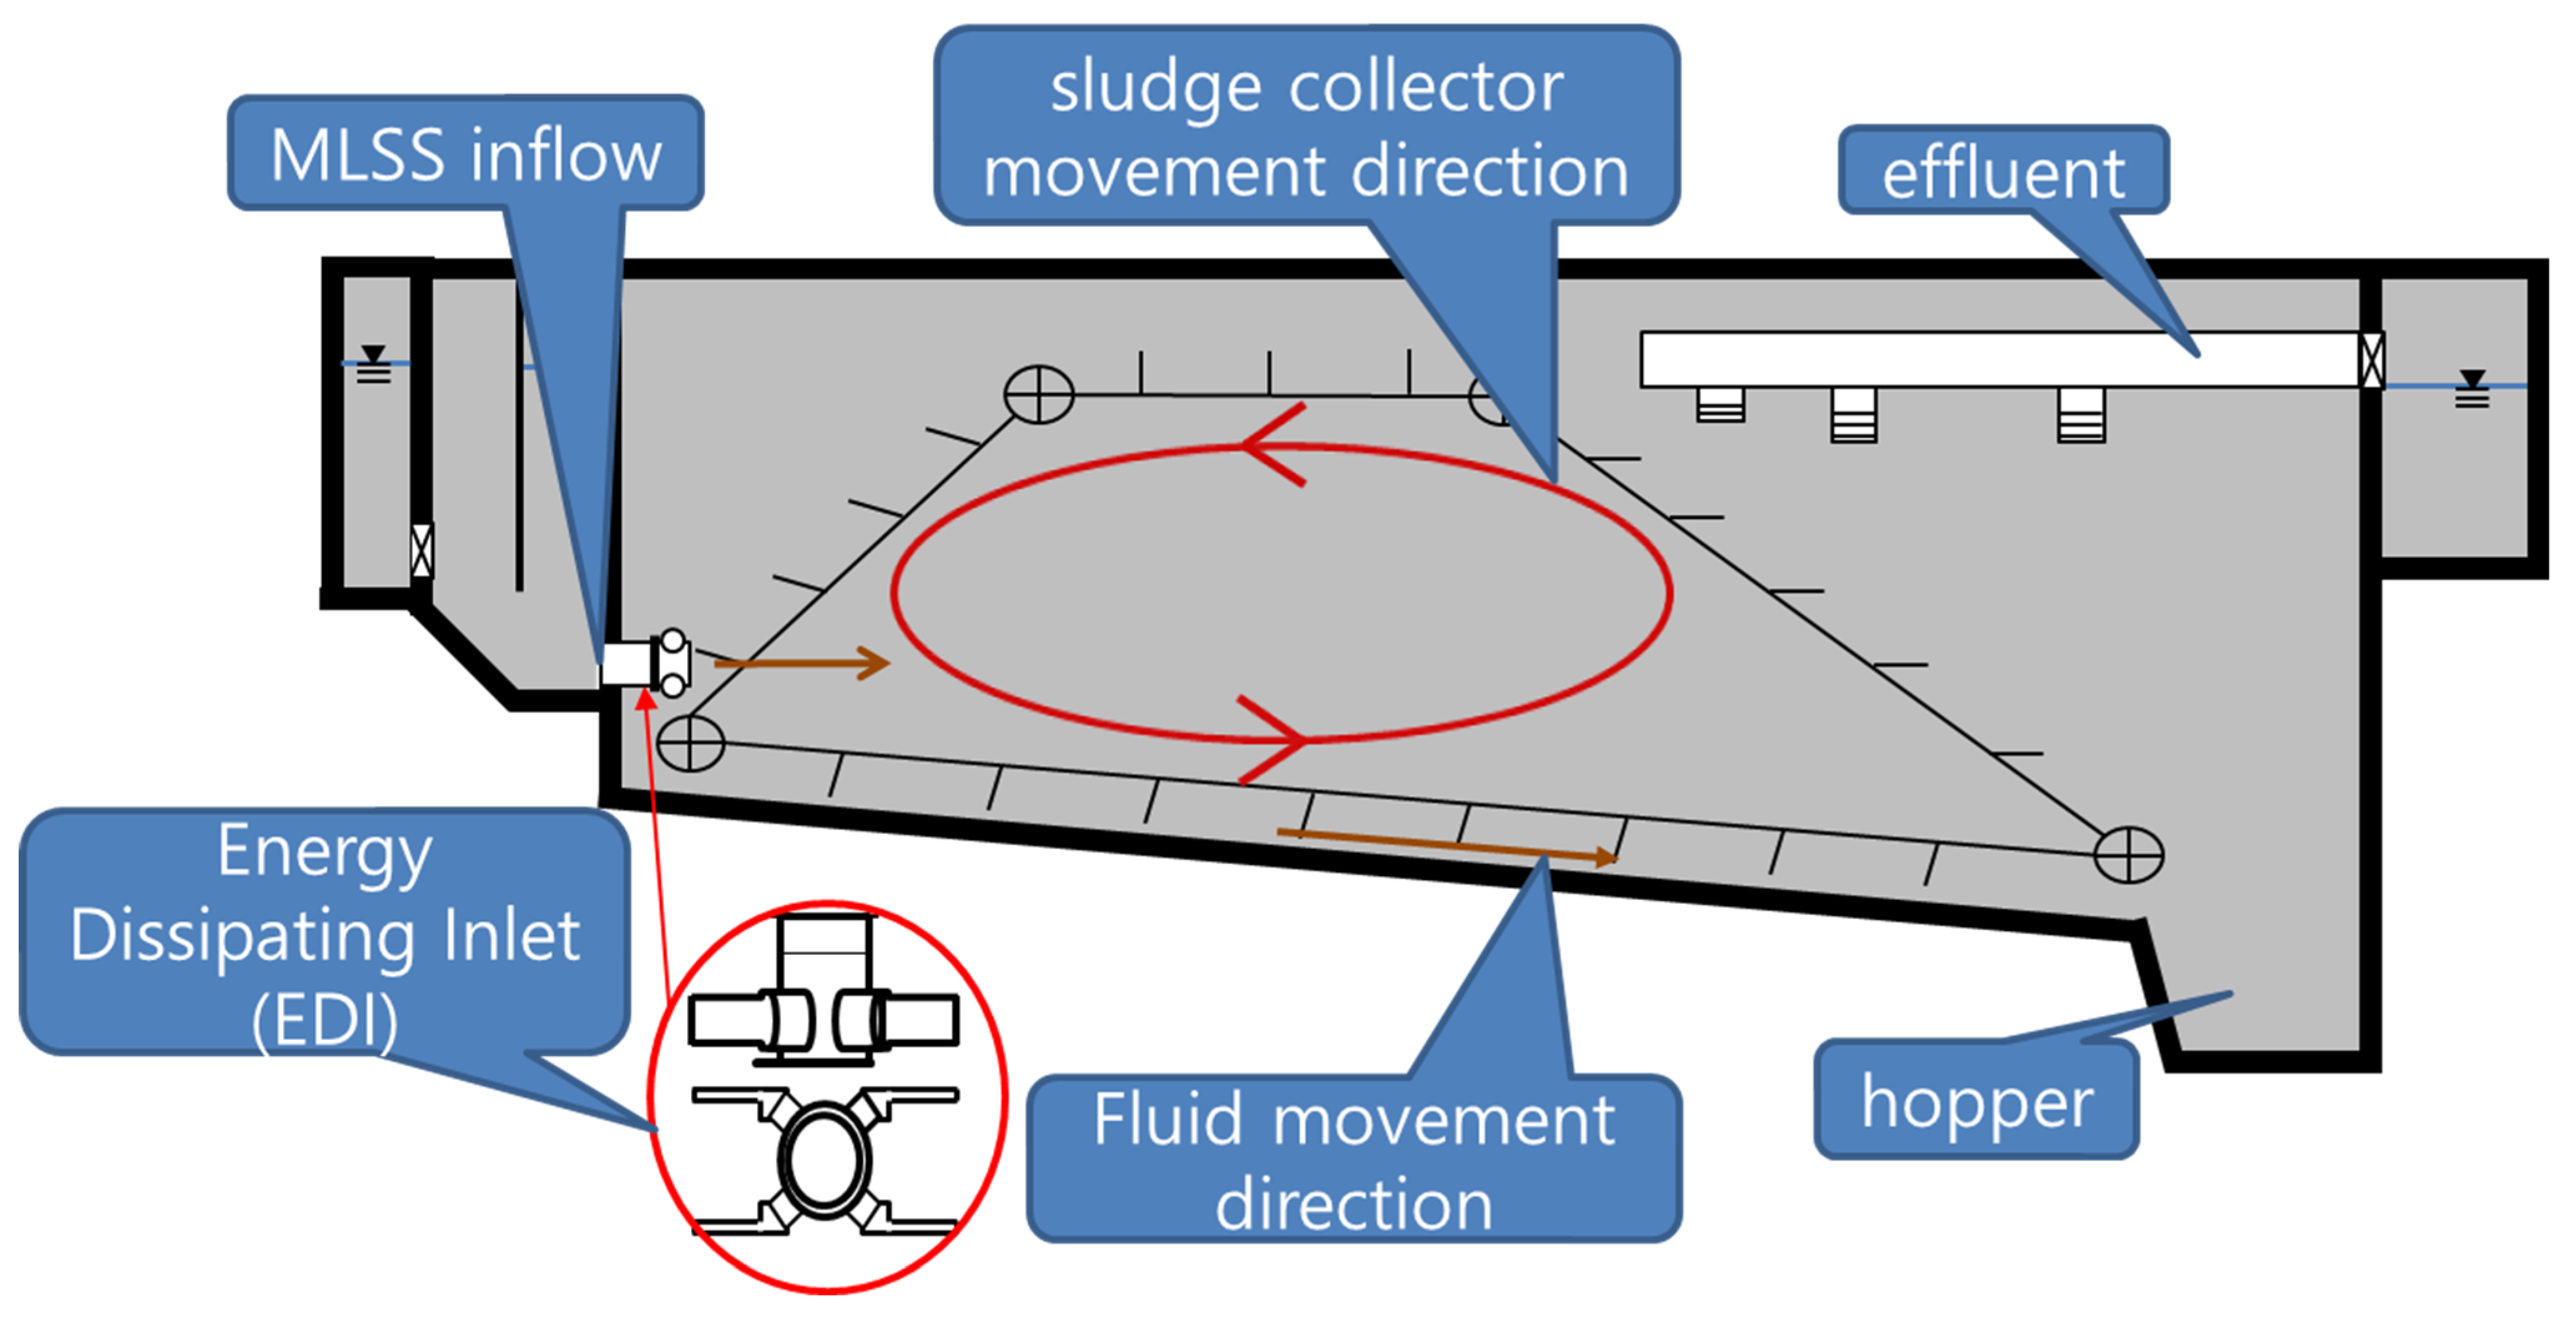
2.2. Plant B—With Gould Type I Secondary Clarifier
3. Results and Discussion
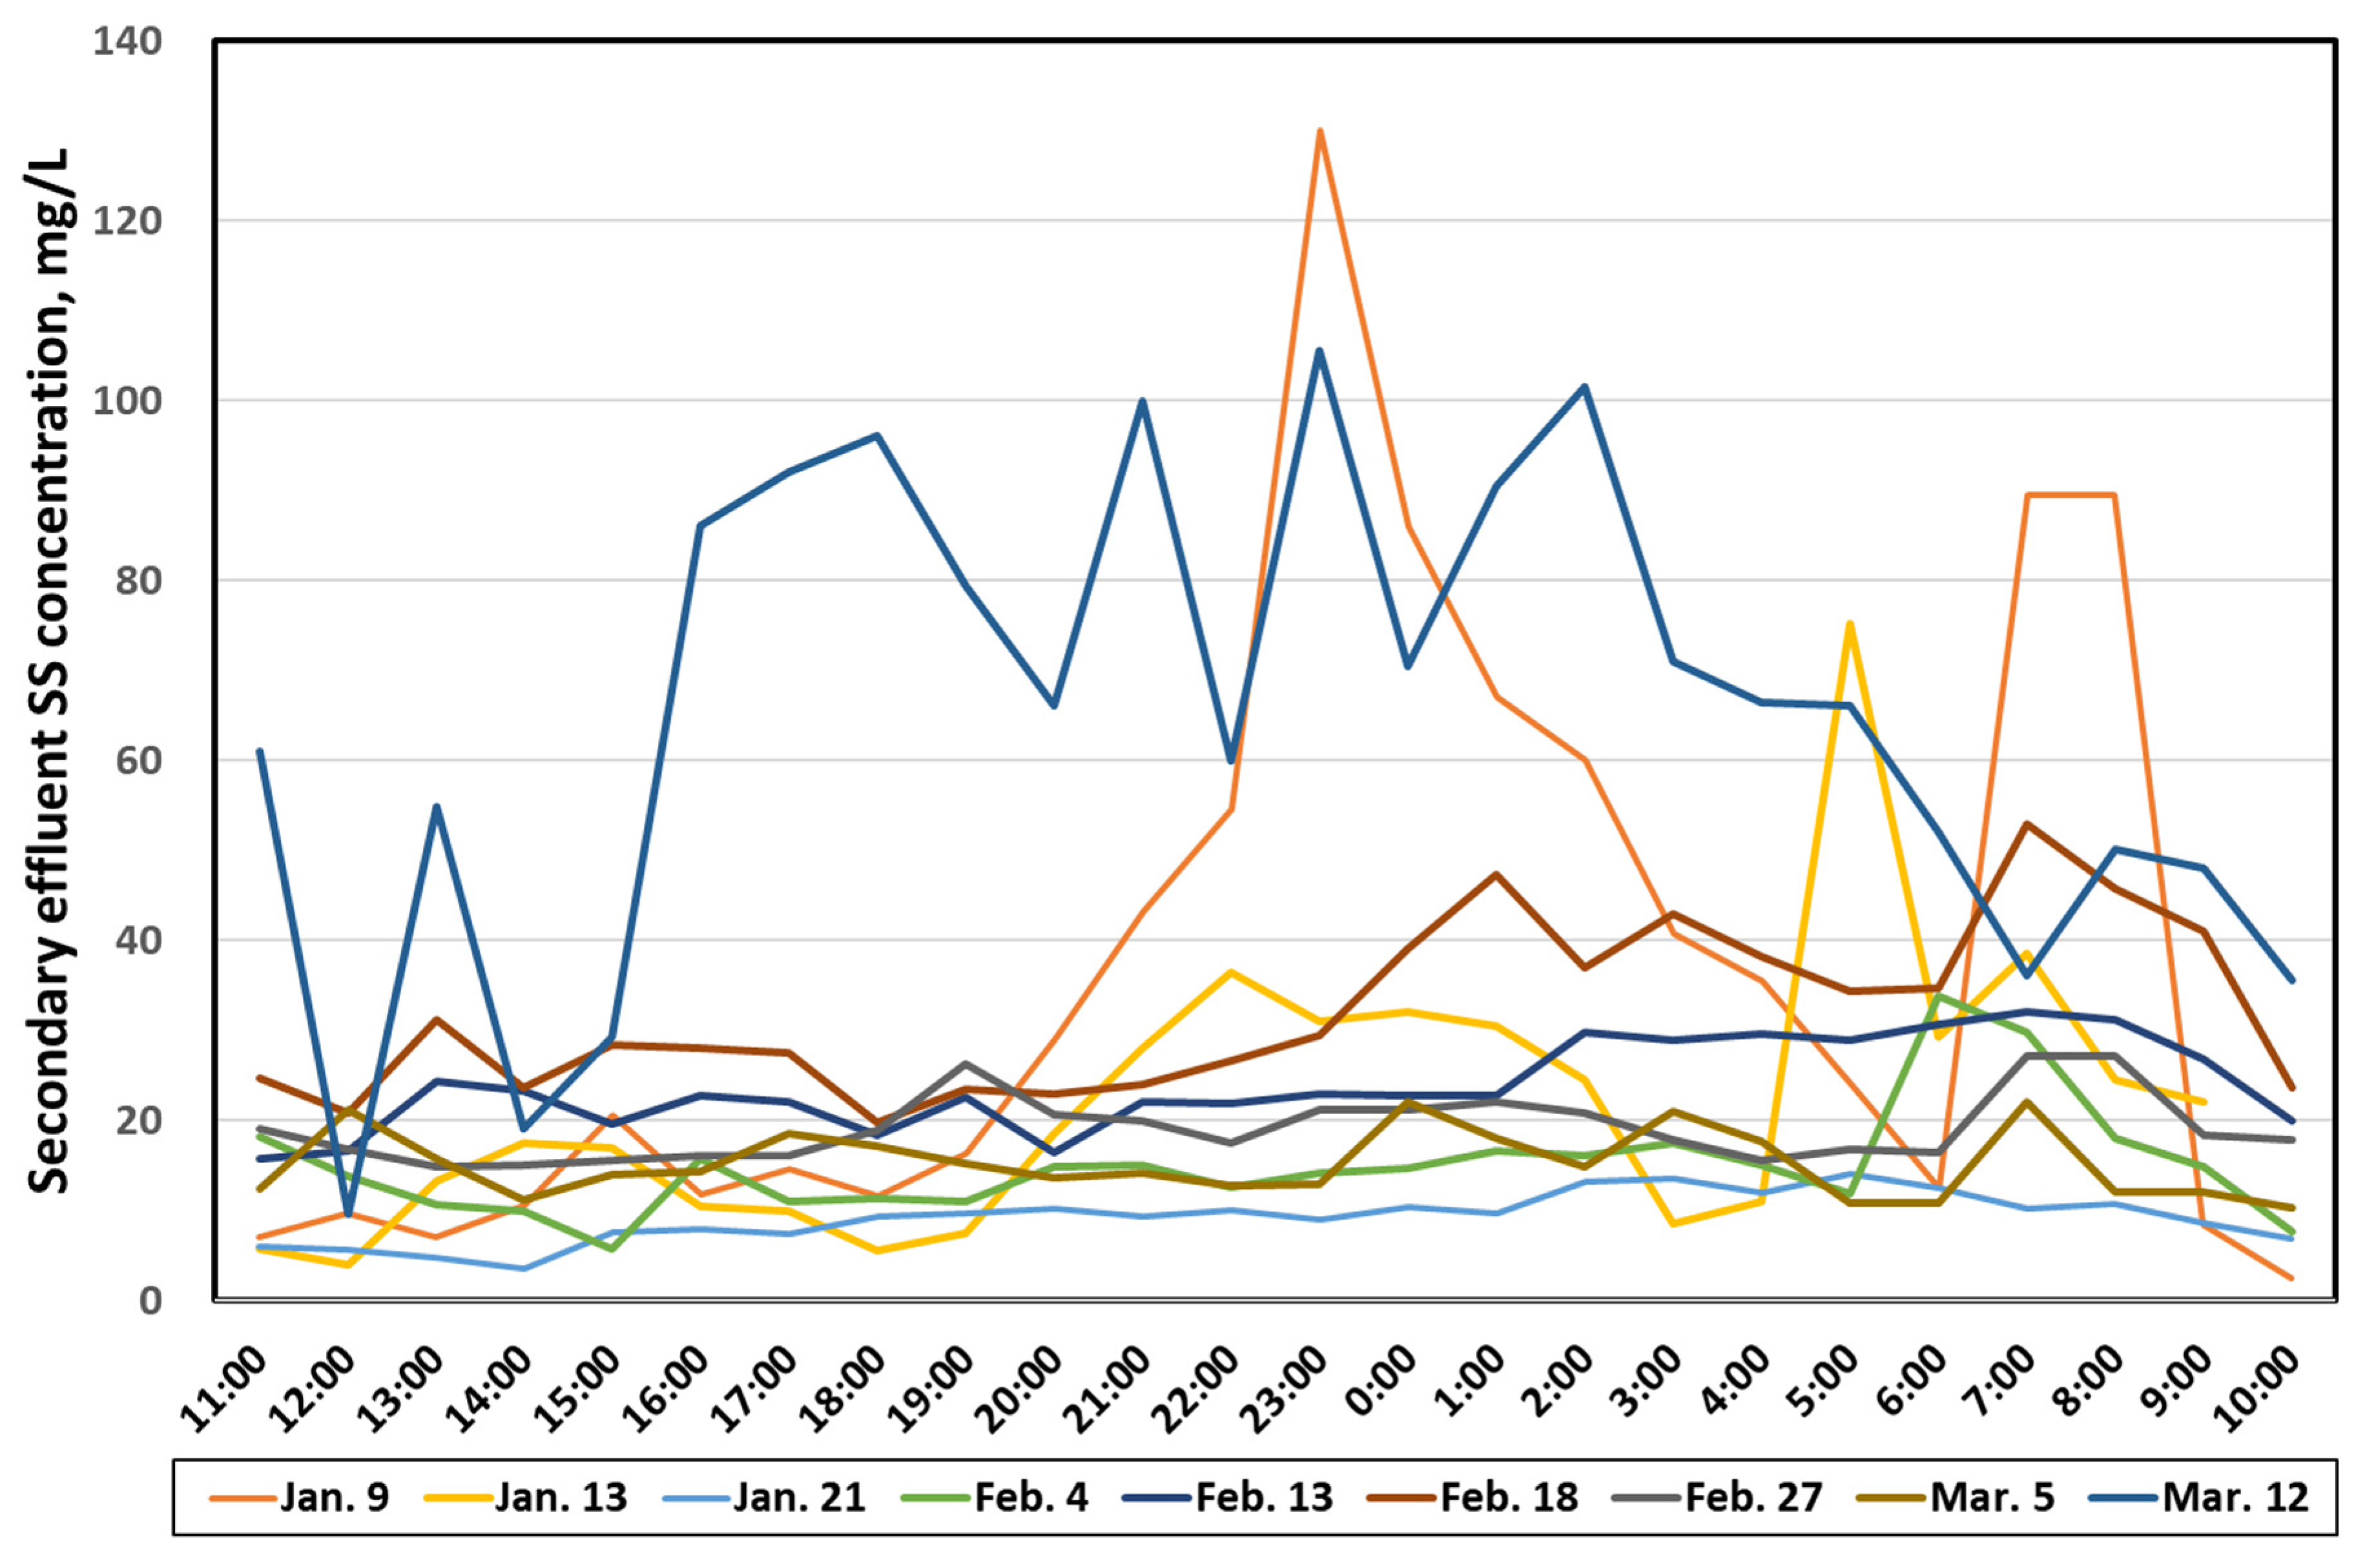
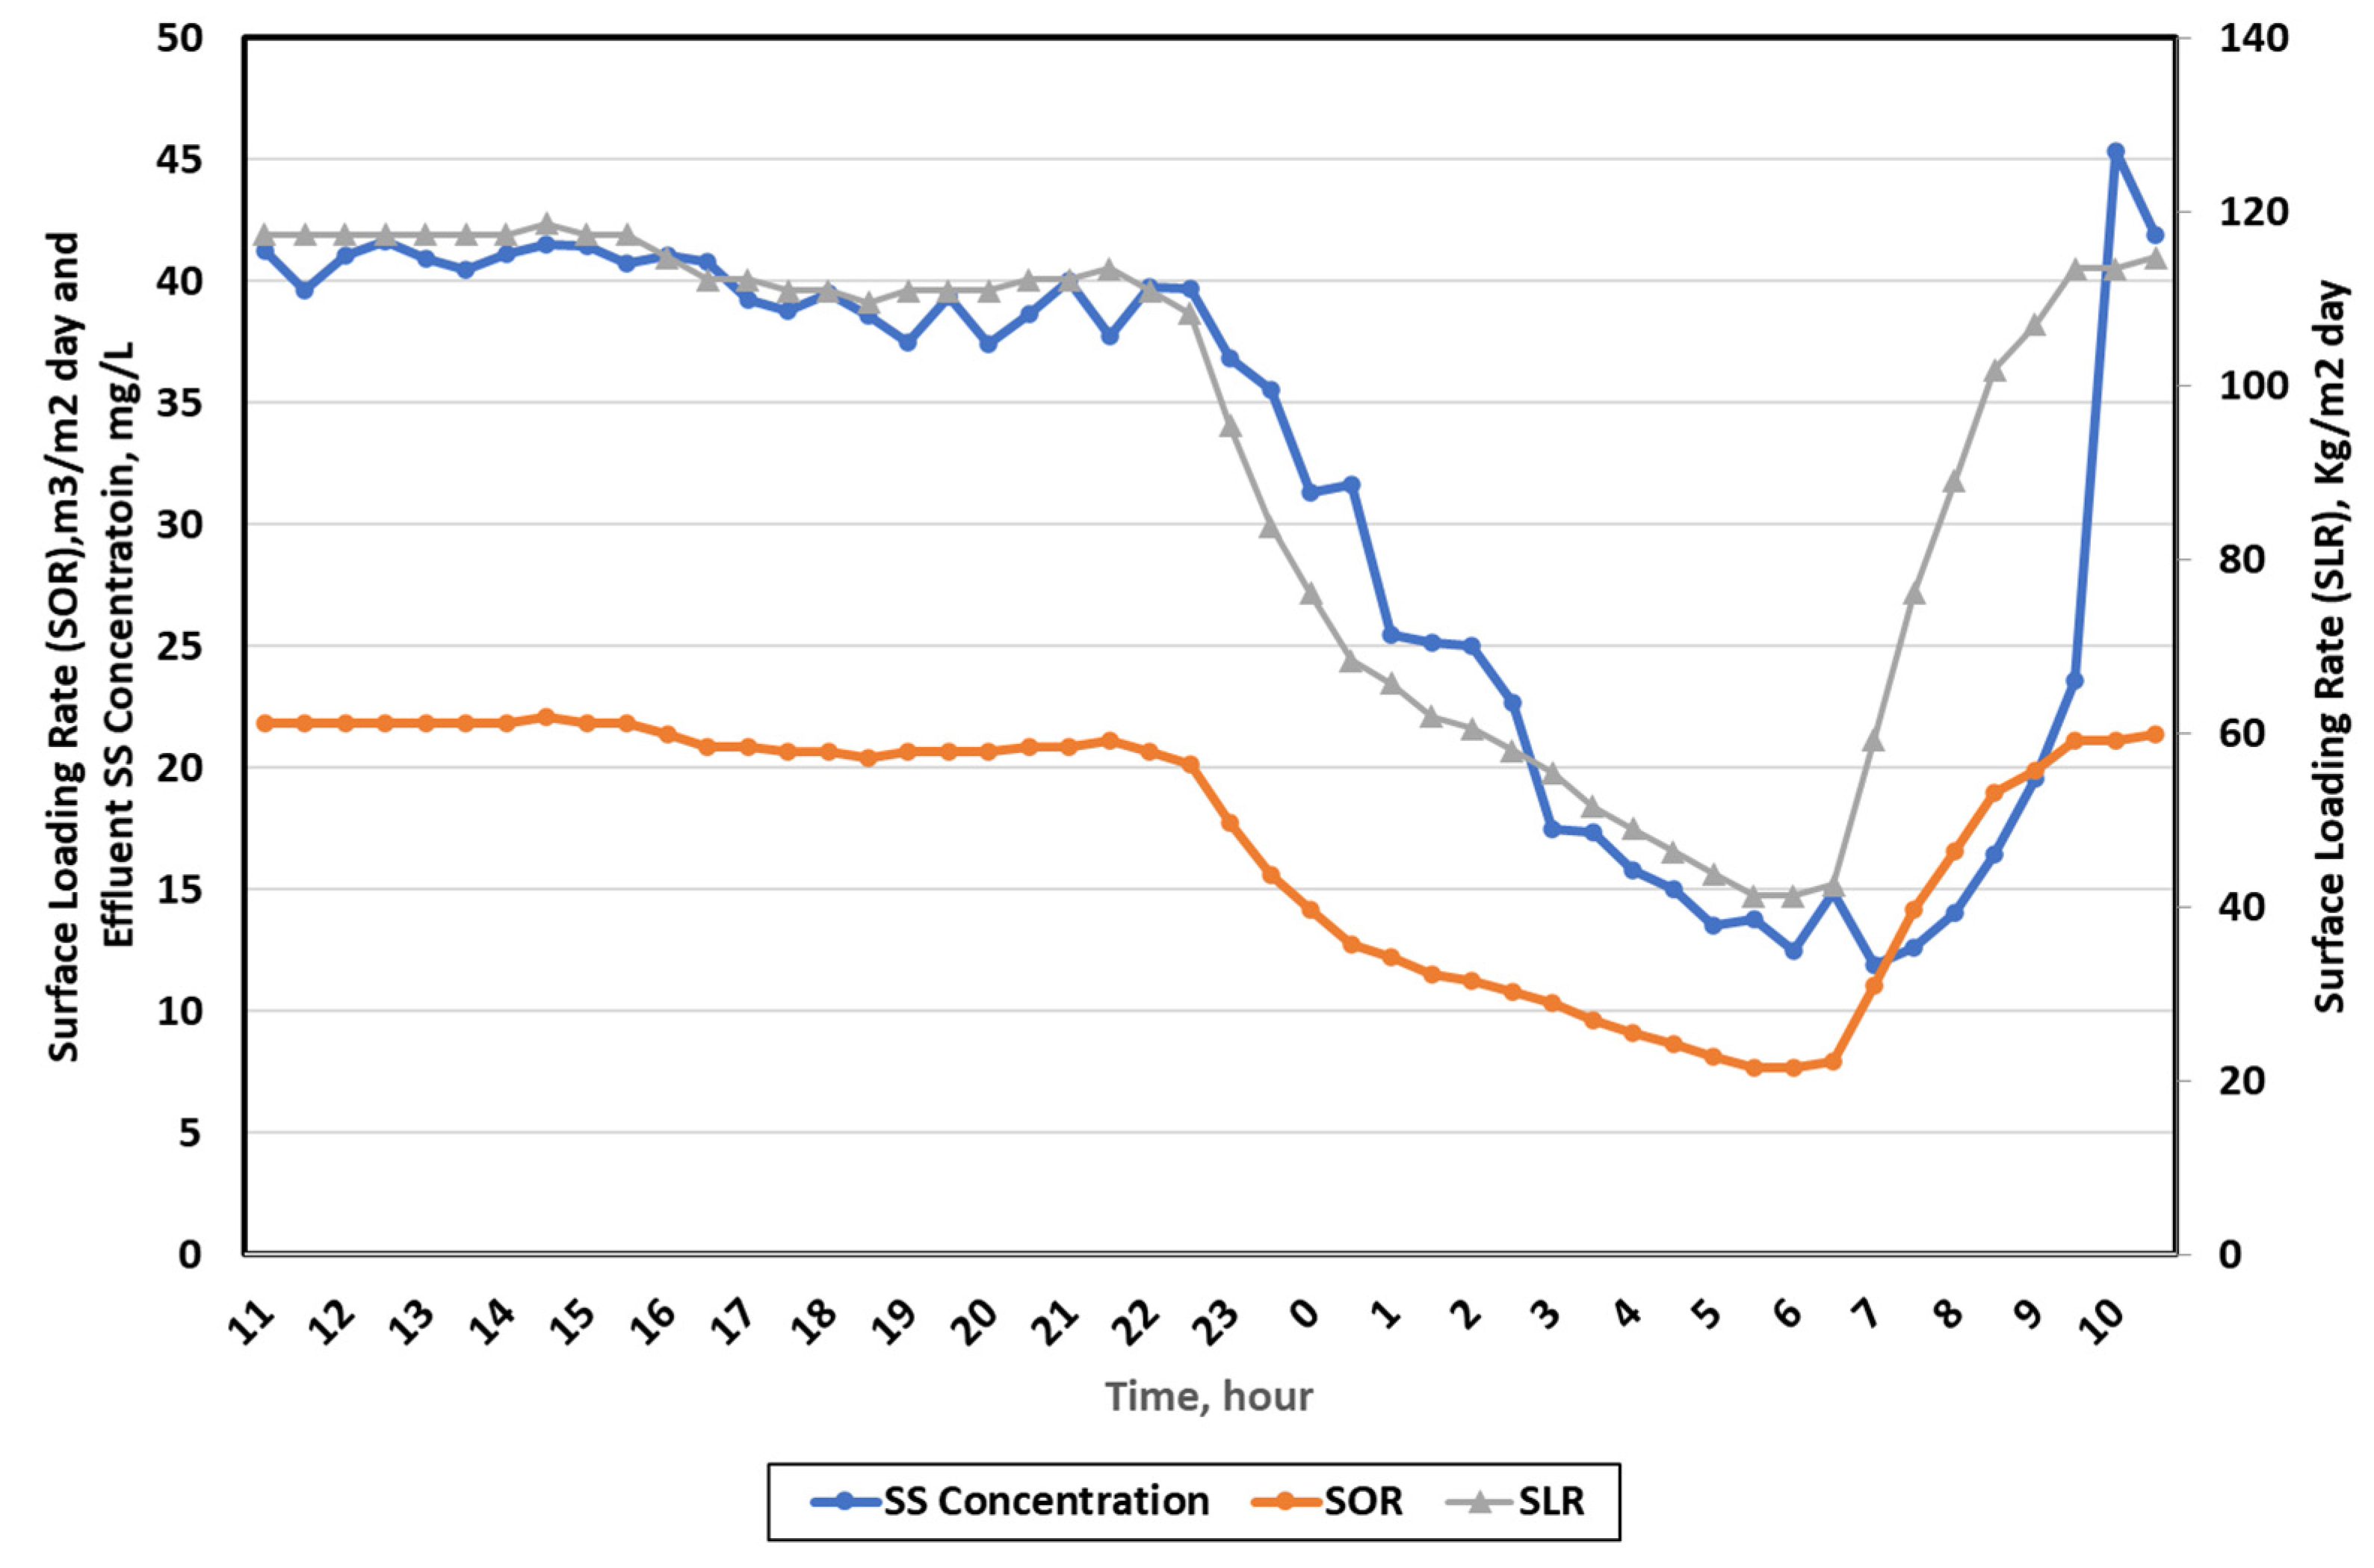
3.1. Experimental and Operational Data from Plant A
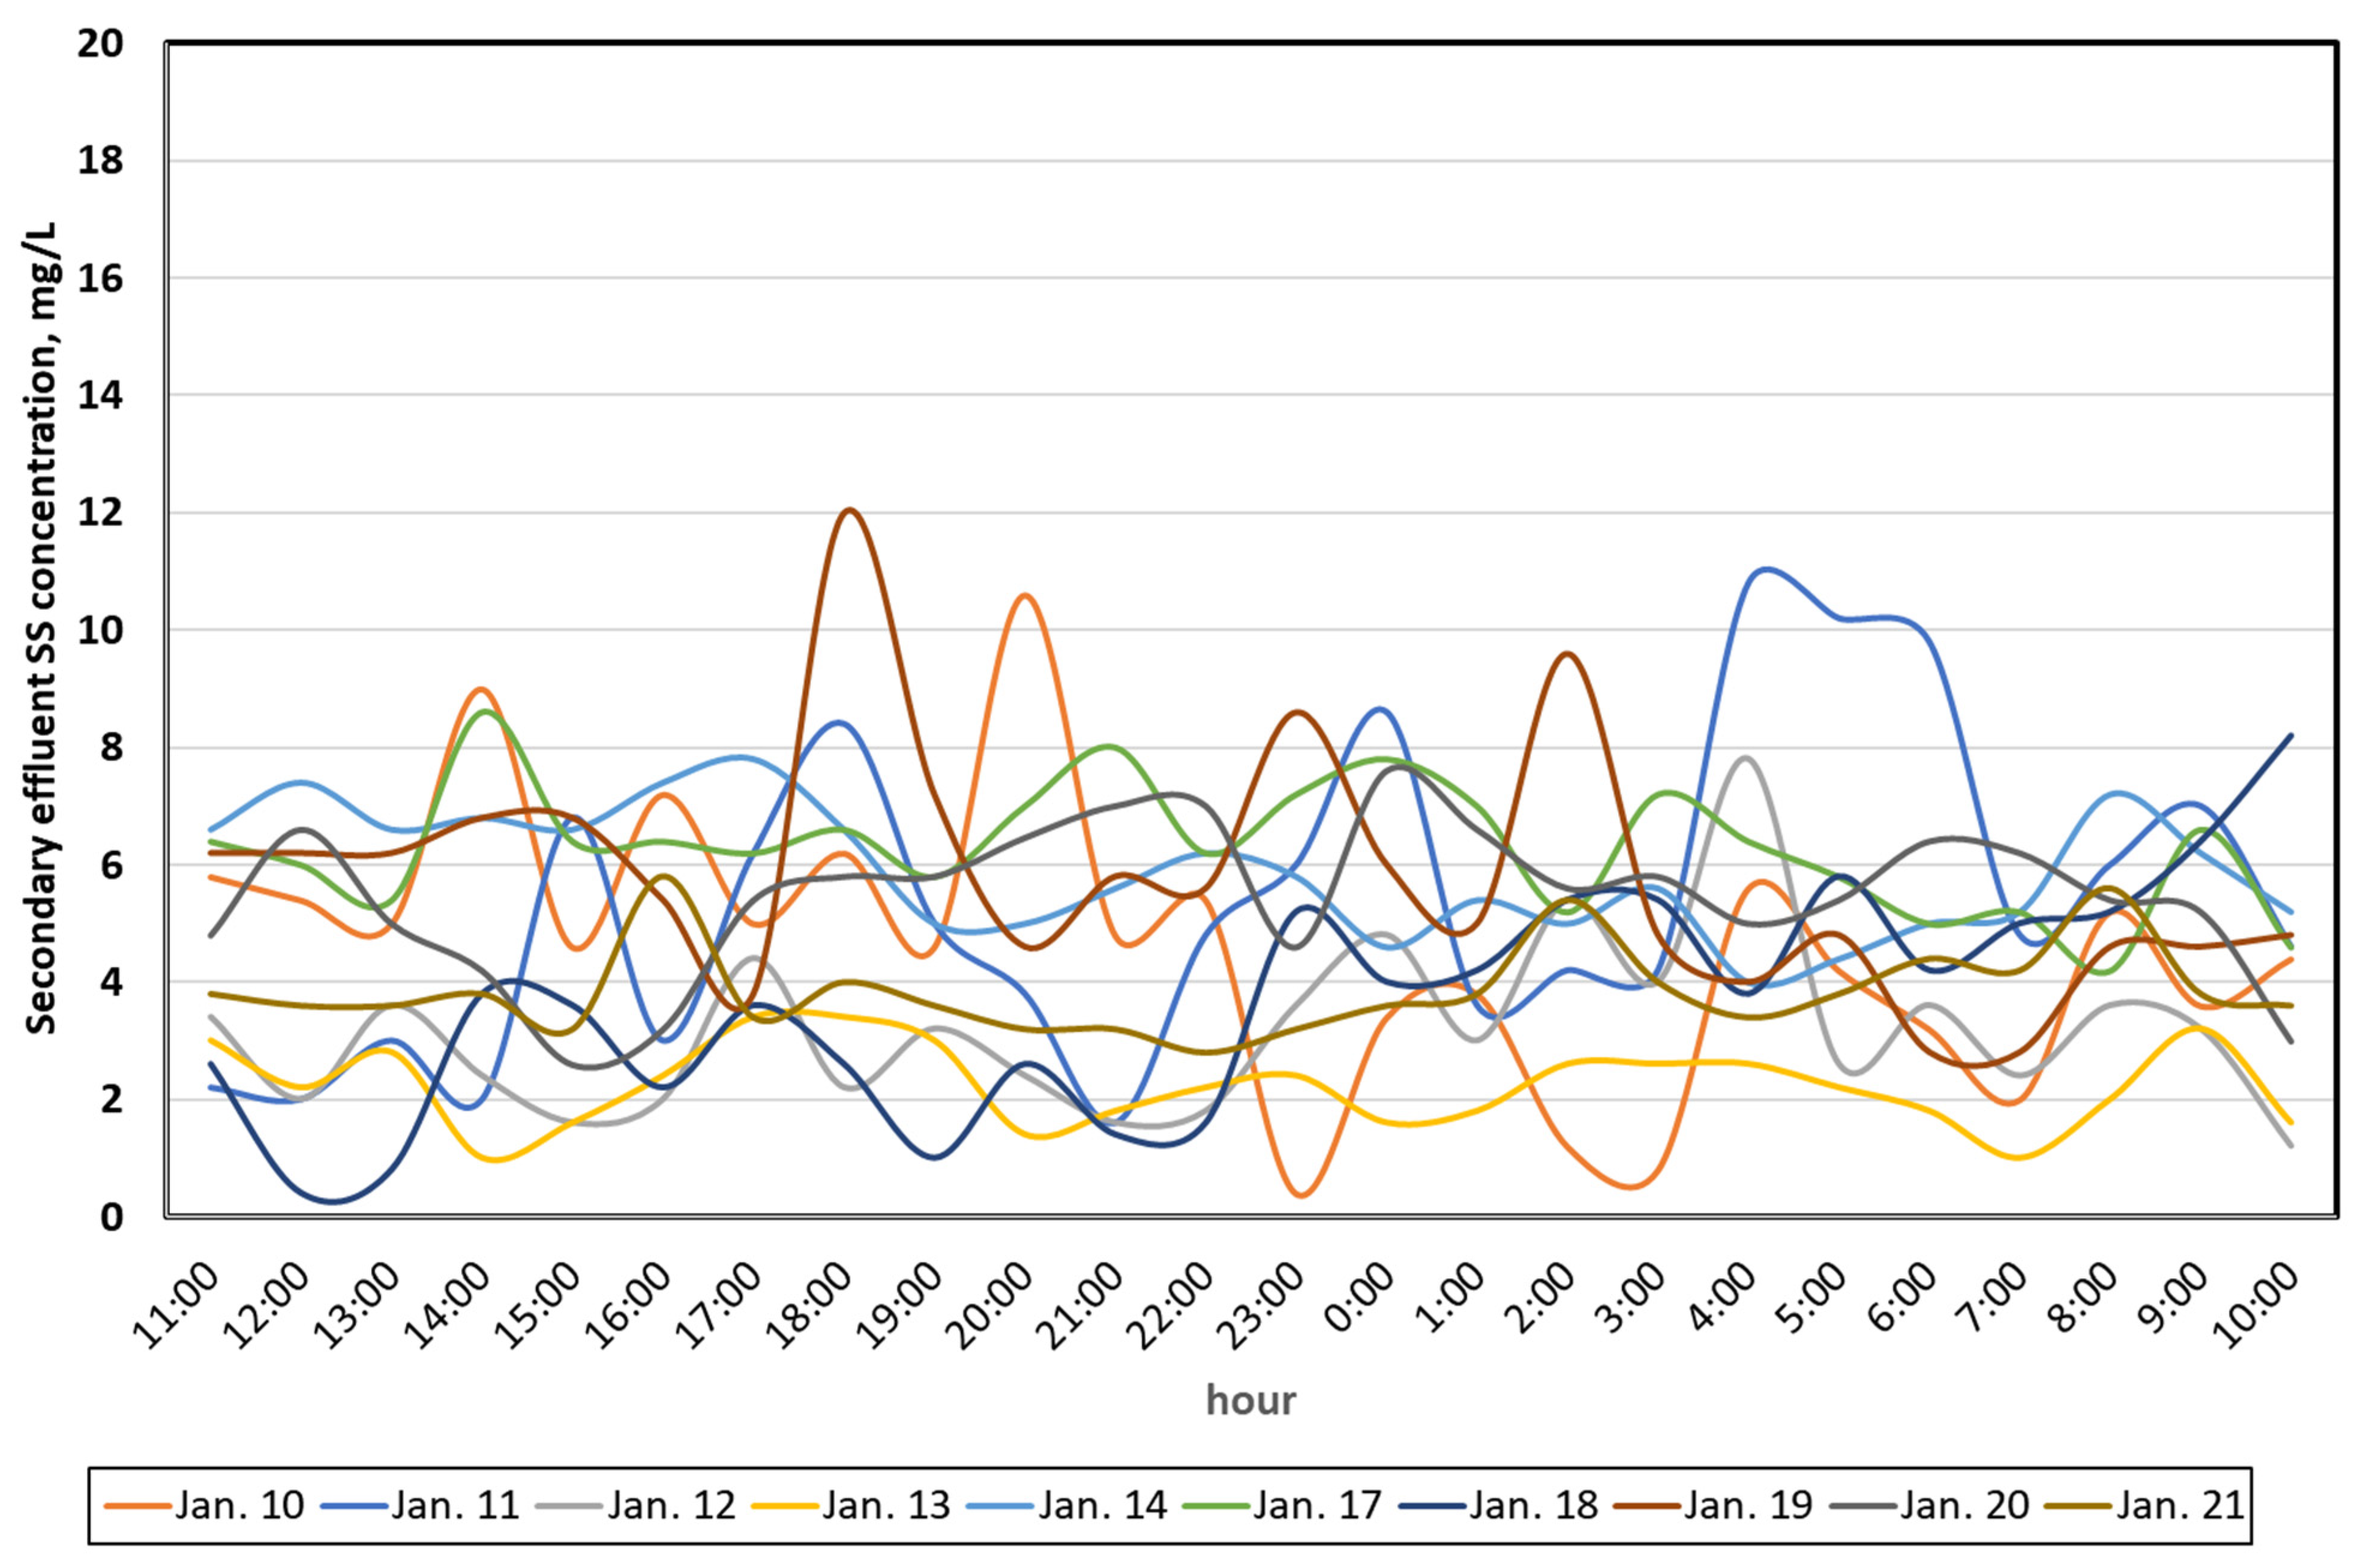
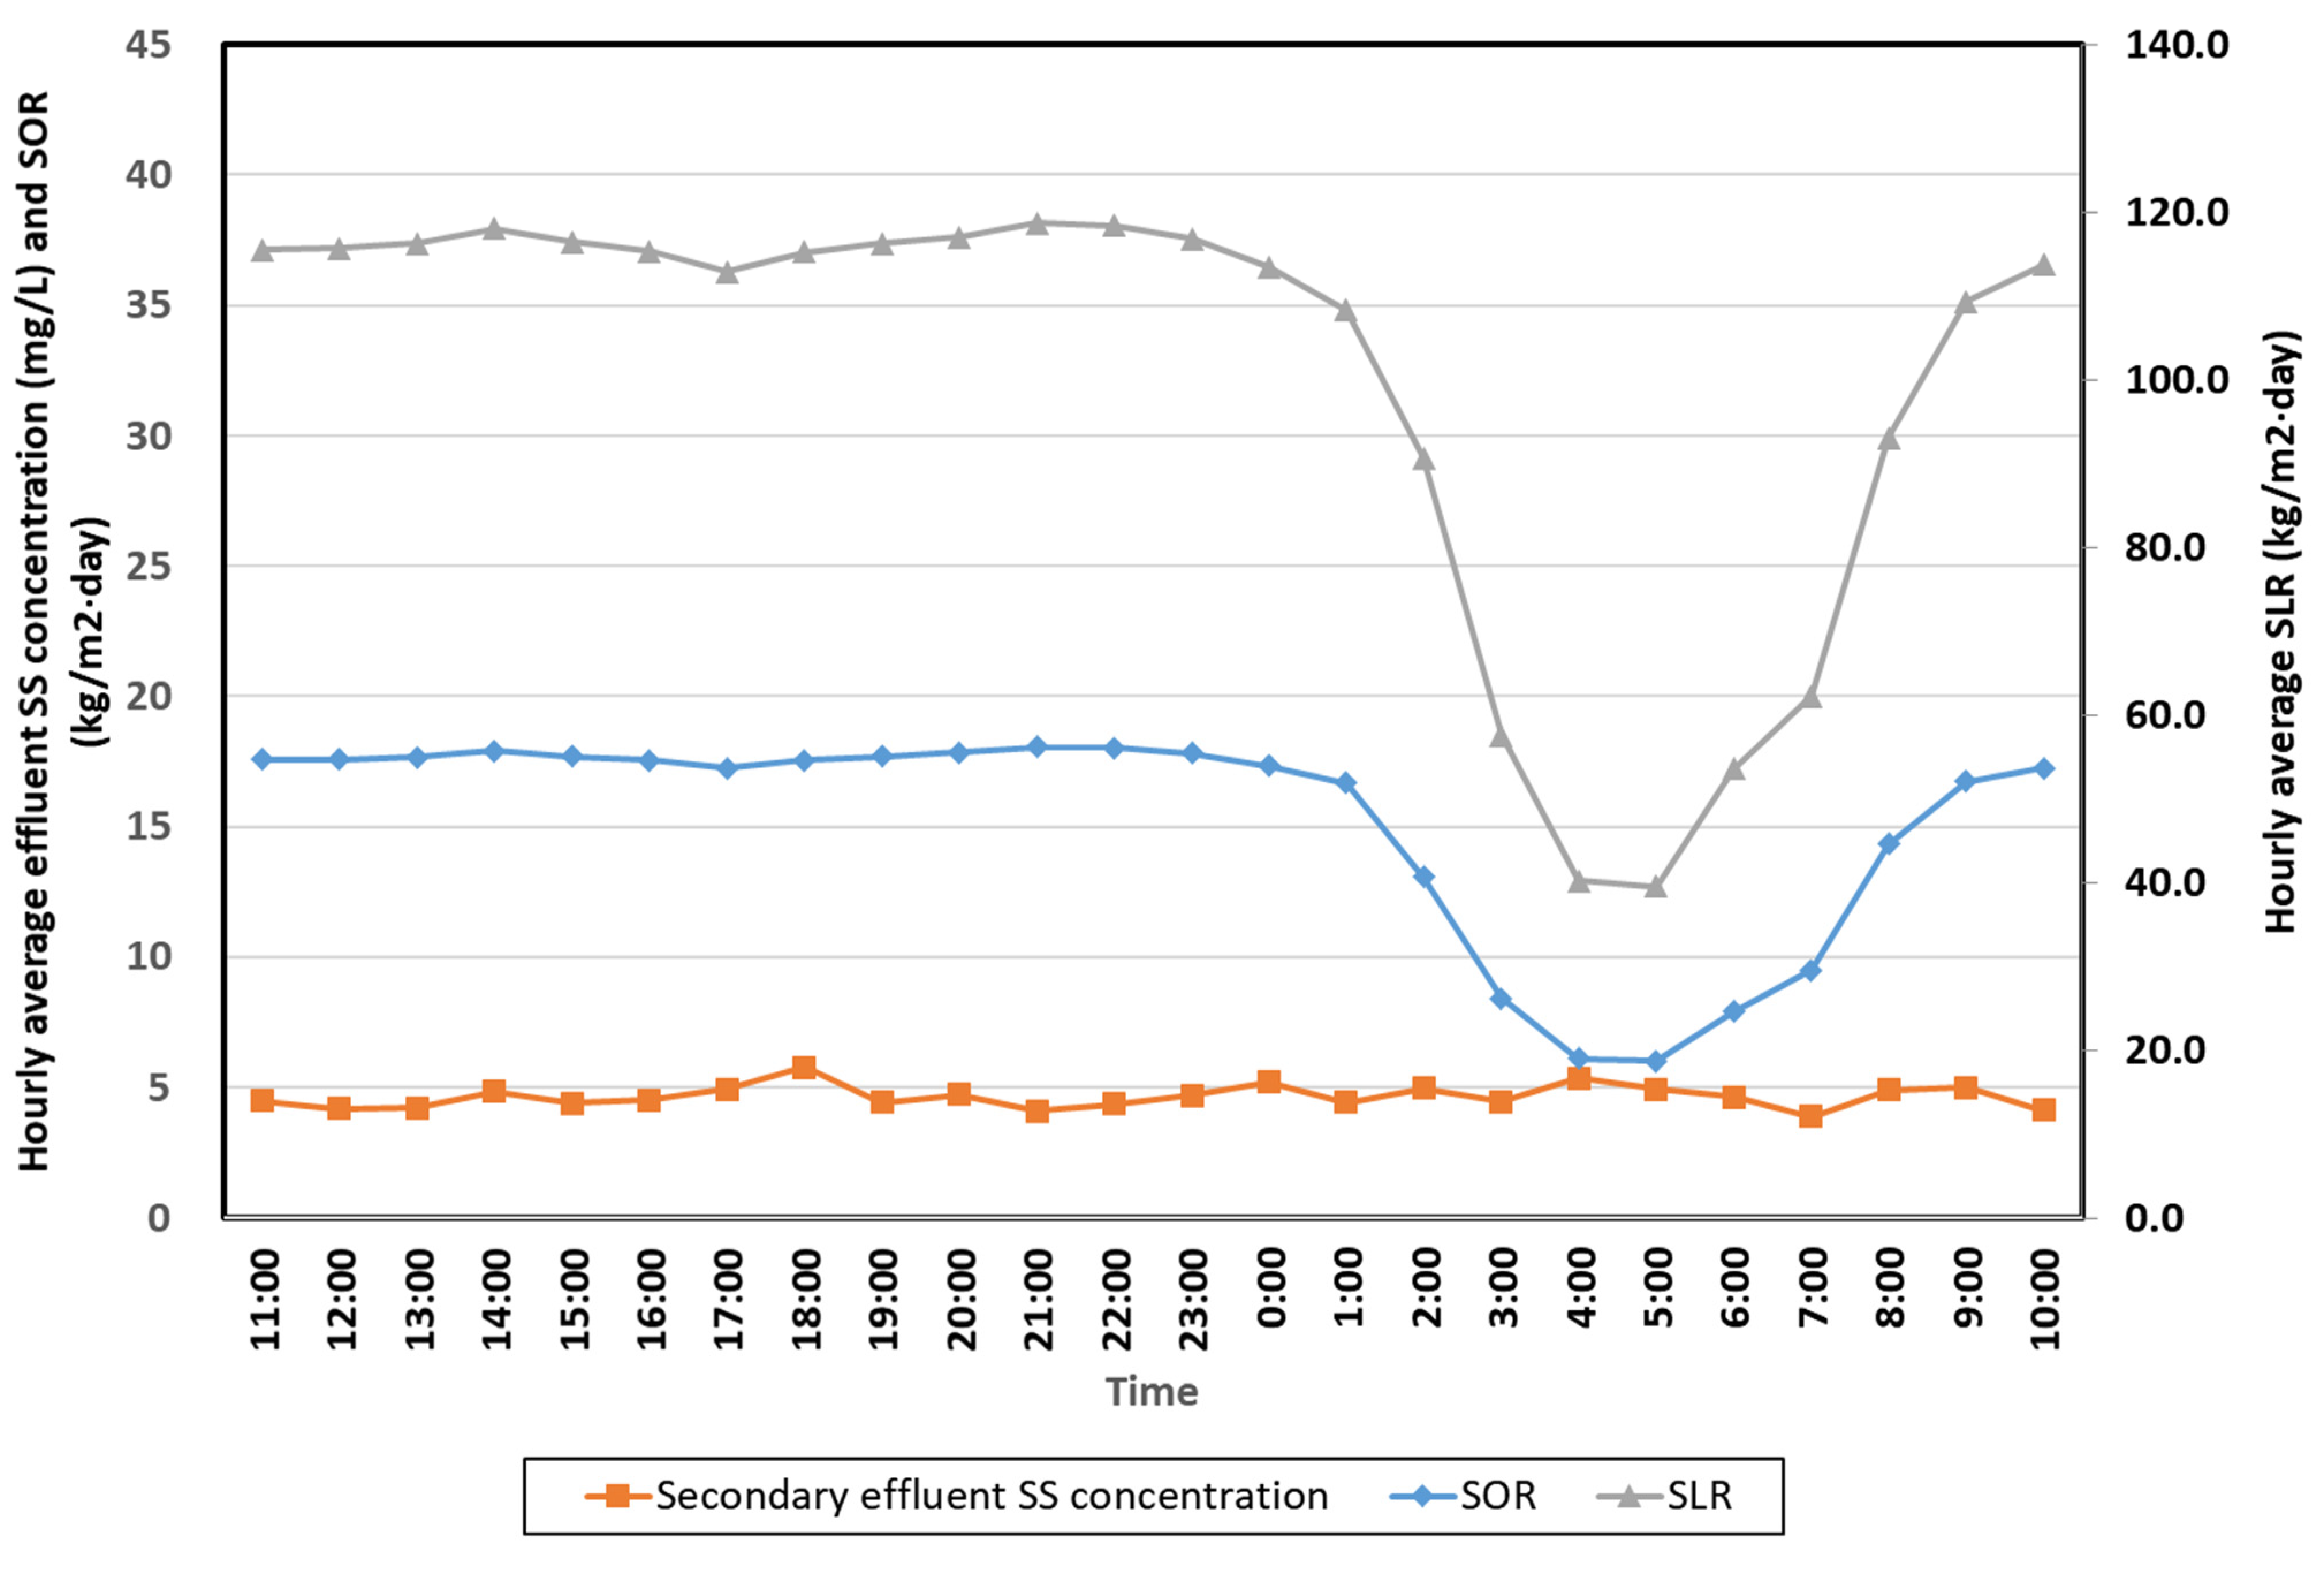
3.2. Experimental and Operational Data from Plant B
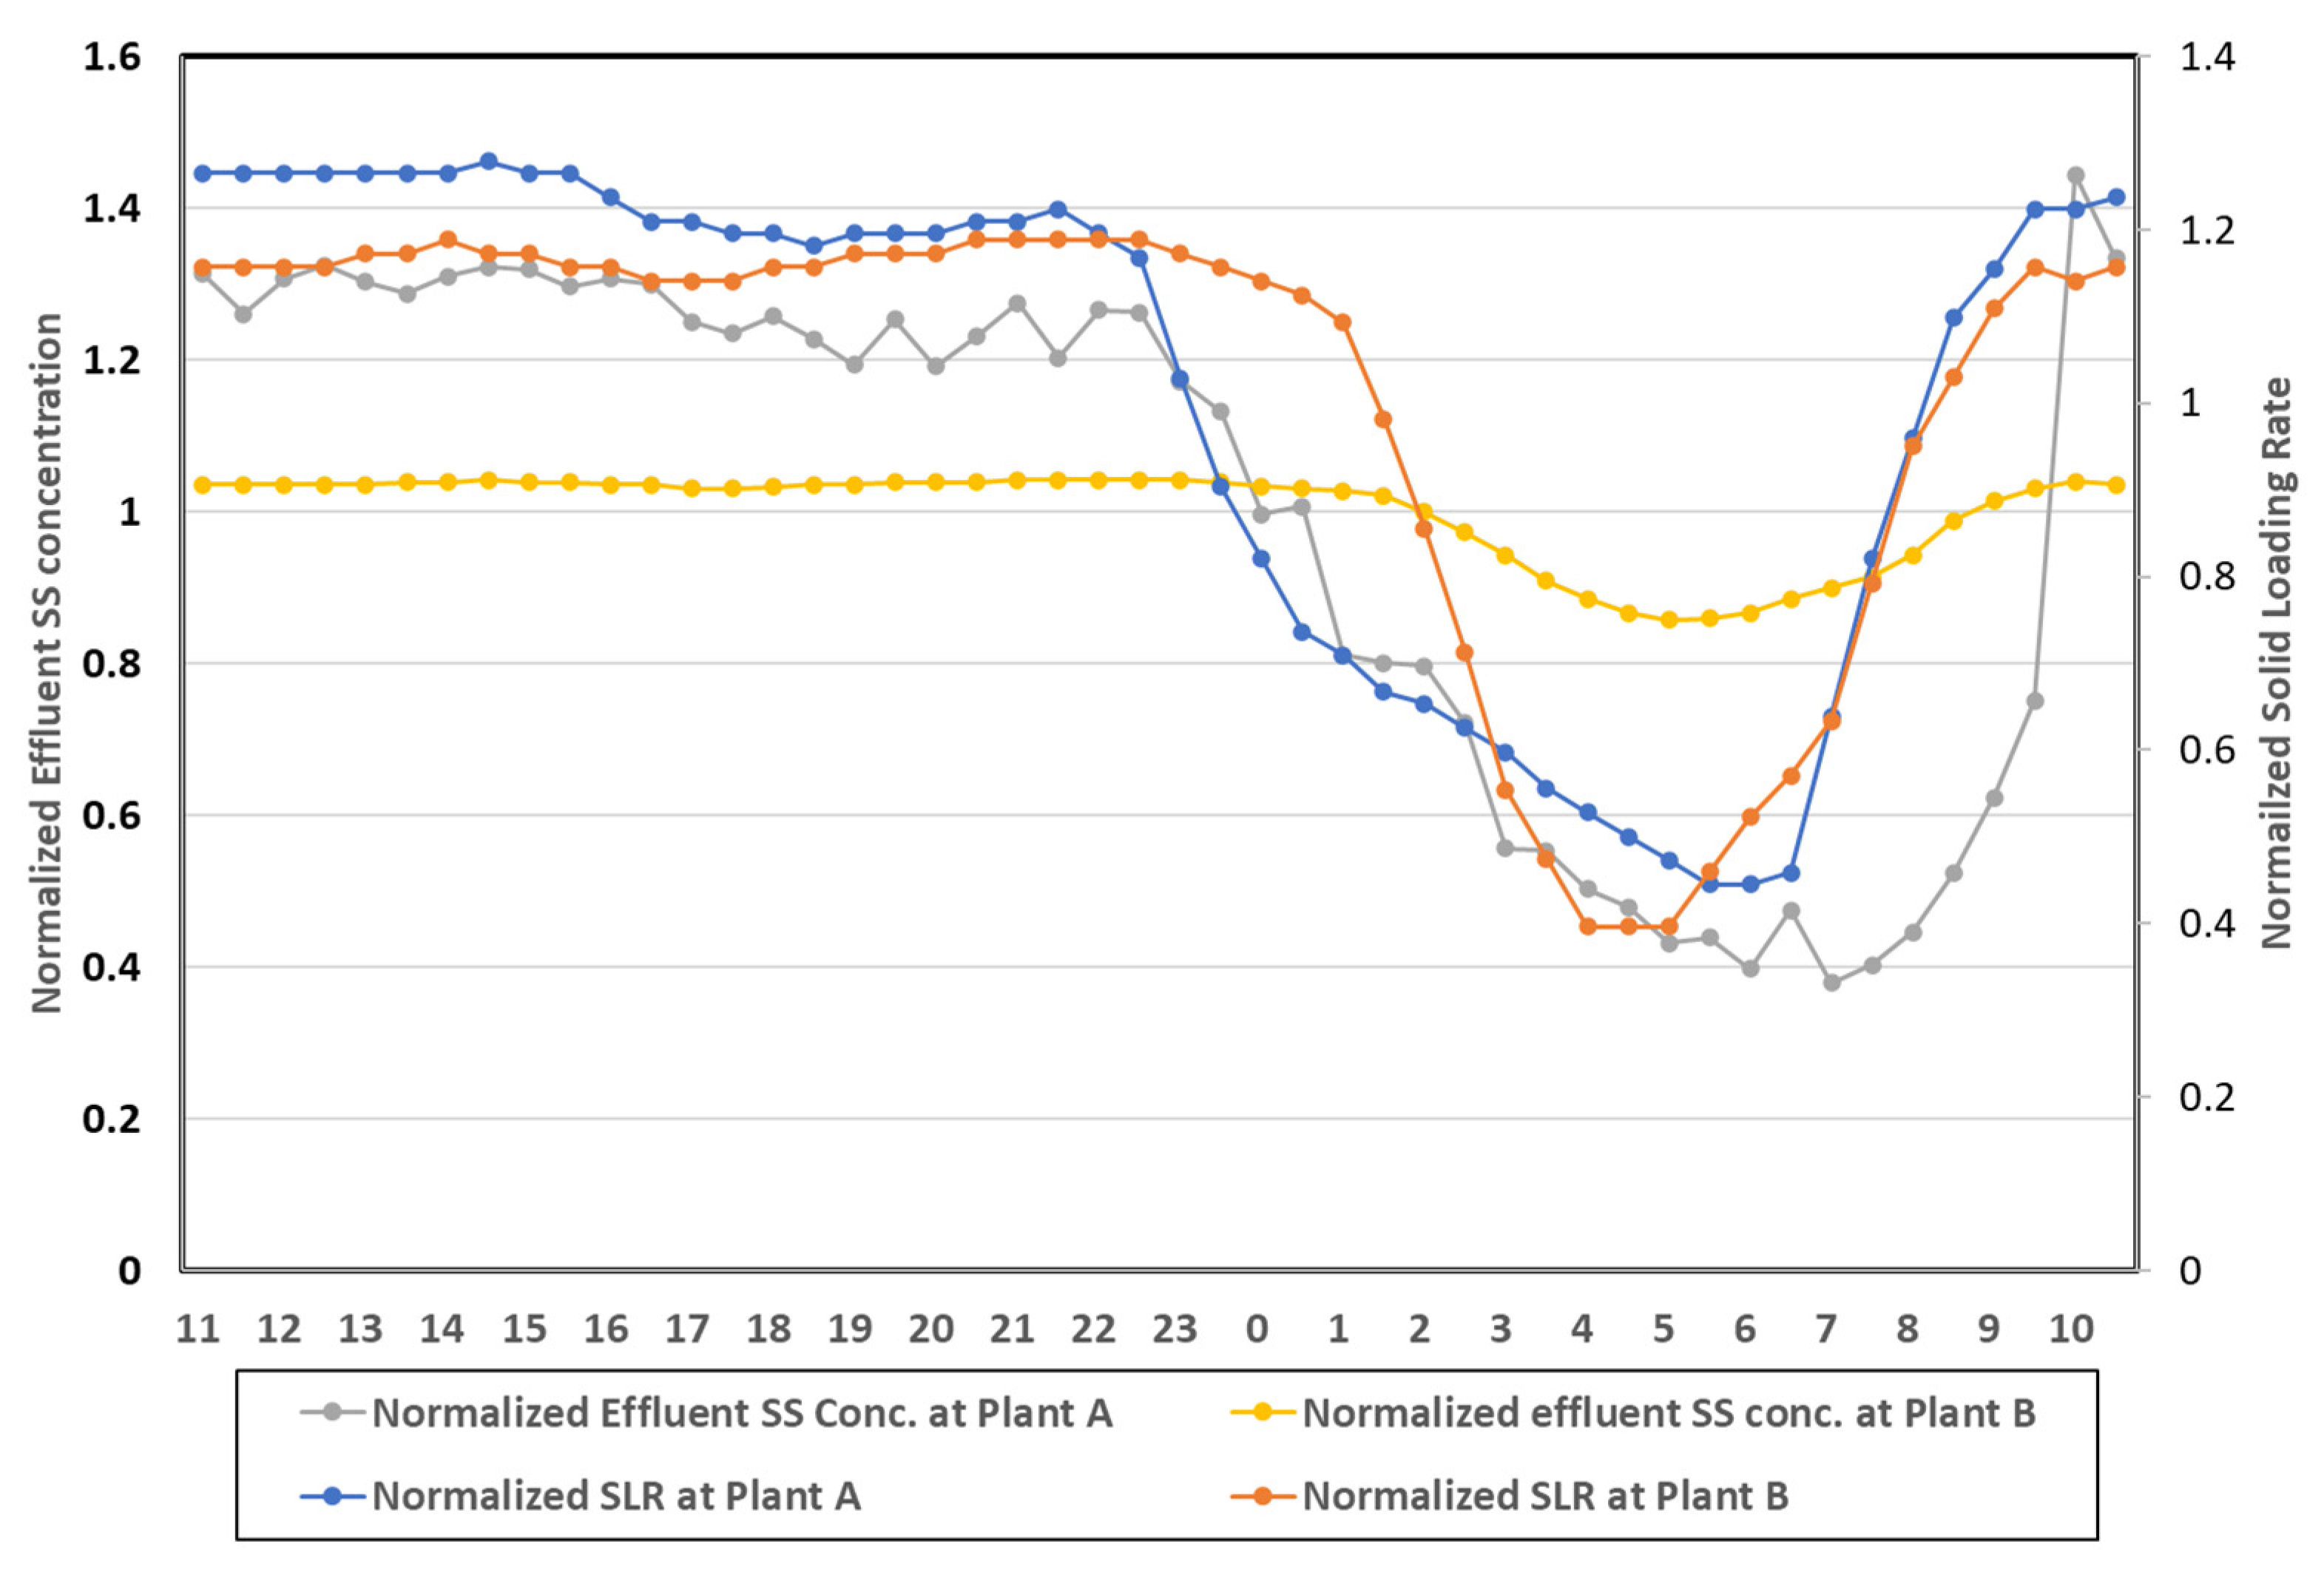
3.3. Secondary Effluent SS Concentrations Comparison by Experimental Data of Plants A and B
3.4. Computational Fluid Dynamic Simulation Results
4. Conclusions
Supplementary Materials
Funding
Institutional Review Board Statement
Informed Consent Statement
Acknowledgments
Conflicts of Interest
References
- Peavy, H.S.; Rowe, D.R.; Tchobanoglous, G. Environmental Engineering; McGraw-Hill Publishing Company: New York, NY, USA, 1985; pp. 234–235. [Google Scholar]
- Qasim, S.R. Wastewater Treatment Plants—Planning, Design and Operation; Technomic Publishing Company: Lancaster, PA, USA, 1999; pp. 921–926. [Google Scholar]
- Water Pollution Control Federation. Clarifier Design; Water Pollution Control Federation: Washington, DC, USA, 1985; pp. 51–72. [Google Scholar]
- Water Environmental Federation. Clarifier Design, 2nd ed.; McGraw-Hill: New York, NY, USA, 2006; pp. 492–495. [Google Scholar]
- ENVINEWS. Available online: http://www.envinews.co.kr/news/articleView.html?idxno=75 (accessed on 9 February 2022). (In Korean).
- Grady, C.P.L., Jr.; Daigger, G.T.; Lim, H.C. Biological Wastewater Treatment, 2nd ed.; Marcel Dekker, Inc.: New York, NY, USA, 1999; pp. 208–212. [Google Scholar]
- Eckenfelder, W.W.; Grau, P. Activated Sludge Process Design and Control-Theory and Practice; Technomic Publishing Company: Lancaster, PA, USA, 1998; p. 73. [Google Scholar]
- Al-Shammari, S.B.; Shahalam, A. Analysis of Sludge Settling and Rising Behavior in Sewage Treatment Plant in Kuwait. J. Environ. Sci. Eng. 2018, B7, 141–148. [Google Scholar] [CrossRef]
- Liquid Stream Fundamentals: Sedimentation. Available online: https://www.wef.org/globalassets/assets-wef/direct-download-library/public/03---resources/wsec-2017-fs-022-liquid-stream-fundamentals--clarification-sedimentation_final.pdf (accessed on 9 February 2022).
- Lee, B. Evaluating Two Types of Rectangular Secondary Clarifier Performance at Biological Nutrient Removal Facilities. J. Korean Soc. Water Wastewater 2013, 27, 561–570. (In Korean) [Google Scholar] [CrossRef] [Green Version]
- Wahlberg, E.J. WERF/CRTC Protocols for Evaluating Secondary Clarifier Performance; Water Environment Research Foundation: Alexandria, VA, USA, 2001; p. C2-55. [Google Scholar]
- American Public Health Association; American Water Works Association; Water Environment Federation. Standard Methods for the Examination of Water and Wastewater, 20th ed.; American Public Health Association: Washington, DC, USA, 1999; pp. 2-57–2-58. [Google Scholar]
- McCorquoda, J.A.; Griborio, A.; Georgiou, I. Application of a CFD Model to Improve the Performance of Rectangular Clarifiers. In Proceedings of the WEFTEC, Dallas, TX, USA, 21–25 October 2006; pp. 310–320. [Google Scholar]
- Digger, G.T.; Buttz, J.A. Upgrading Wastewater Treatment Plants; Technomic Publishing Company: Lancaster, PA, USA, 1998; p. 83. [Google Scholar]
- Metcalf & Eddy/Aecom. Wastewater Engineering—Treatment and Resource Recovery, 5th ed.; McGraw-Hill: New York, NY, USA, 2014; p. 890. [Google Scholar]
- Water Environment Federation; American Society of Civil Engineering; Environmental and Water Resources Institute. Design Municipal Wastewater Treatment, 5th ed.; ASCE/EWRI: Reston, VA, USA, 2010; Volume 2, pp. 14–109. [Google Scholar]
- Wahlberg, E.J.; Stahl, J.F.; Chen, C.-L.; Augustus, M. Field Application of the Clarifier Research Technical Committee’s Protocol for Evaluating Secondary Clarifier Performance: Rectangular, Co-current Sludge Removal Clarifier. In Proceedings of the Water Environmental Federation 66th Annual Conference and Exposition, Anaheim, CA, USA, 3–7 October 1993. [Google Scholar]
- Ekama, G.A.; Barnard, J.L.; Gunthert, F.W.; Krebs, P.; McCorquodale, J.A.; Parker, D.S.; Wahlberg, E.J. Secondary Settling Tank; International Association on Water Quality: London, UK, 1997; pp. 189–190. [Google Scholar]
- Jenkins, D.; Richard, M.G.; Digger, G. Manual on the Causes and Control of Activated Sludge Bulking, Foaming, and Other Solids Separation Problems, 3rd ed.; CRC Press: Boca Raton, FL, USA, 2017; pp. 50–52. [Google Scholar]
- Wanner, J. AS Separation Problems. In Activated Sludge Separation Problems-Theory, Control Measures, Practical Experience; Tandol, V., Jenkins, D., Wanner, J., Eds.; IWA Publishing: London, UK, 2006; pp. 37–38. [Google Scholar]
- Wahlberg, E.J. Update on Secondary Clarifiers: Design, Operation and Performance. In Proceedings of the Forth National Wastewater Treatment Technology Transfer Workshop, Kansas City, MI, USA, 17-19 May 1995. [Google Scholar]
- Takacs, I.; Patry, G.G.; Nolasco, D.A. Dynamic Model of the Clarification-Thickening Process. Water Res. 1991, 25, 1263–1271. [Google Scholar] [CrossRef]
- Lee, B. Evaluation of Double Perforated Baffles Installed in Rectangular Secondary Clarifiers. Water 2017, 9, 407. [Google Scholar] [CrossRef] [Green Version]


| Item | Values | Remarks | |
|---|---|---|---|
| Design Flow | Maximum daily flow | 47,000 m3/day | |
| Average daily flow | 37,600 m3/day | ||
| Secondary clarifier | Number of units | 8 | |
| Width | 8 m | ||
| Length | 32 m | ||
| Effective depth | 3.5 m | ||
| Total surface area | 2048 m2 | ||
| Design Surface Overflow Rate (SOR) | For maximum daily flow | 22.9 m3/m2·day | |
| For average daily flow | 18.4 m3/m2·day | 24–32 m3/m2·day is recommended [15] | |
| Item | Values | Remarks | |
|---|---|---|---|
| Design flow | Maximum day flow | 14,000 m3/day | |
| Average daily flow | 11,200 m3/day | ||
| Secondary clarifier | Number of units | 4 | |
| Width | 6.2 m | ||
| Length | 30.3 m | ||
| Effective depth | 3.5 m | ||
| Total surface area | 751.44 m2 | ||
| Design SOR | For Maximum day flow | 18.6 m3/m2·day | |
| For Daily Average flow | 14.9 m3/m2·day | 24–32 m3/m2·day is recommended [15] | |
| Items | Inflow m3/Day | RAS Flow m3/Day | RAS Ratio % | MLSS Conc. mg/L | Average MLSS Conc. mg/L | |
|---|---|---|---|---|---|---|
| Date | ||||||
| 9 January 2000 | 38,970 | 20,394 | 52.3 | 3738 | 3750 | |
| 10 January 2000 | 37,280 | 22,344 | 59.9 | 3763 | ||
| 13 January 2000 | 36,670 | 21,512 | 58.7 | 3808 | 3790 | |
| 14 January 2000 | 36,880 | 19,383 | 52.6 | 3773 | ||
| 21 January 2000 | 36,350 | 18,833 | 51.8 | 3688 | 3746 | |
| 22 January 2000 | 35,580 | 19,005 | 53.4 | 3805 | ||
| 4 February 2000 | 35,750 | 19,640 | 54.9 | 3668 | 3713 | |
| 5 February 2000 | 34,640 | 20,370 | 58.8 | 3758 | ||
| 13 February 2000 | 33,840 | 18,340 | 54.2 | 3703 | 3680 | |
| 14 February 2000 | 34,210 | 18,829 | 55.0 | 3658 | ||
| 18 February 2000 | 34,650 | 19,409 | 56.0 | 3668 | 3684 | |
| 19 February 2000 | 34,900 | 20,501 | 58.7 | 3700 | ||
| 27 February 2000 | 34,770 | 20,137 | 57.9 | 3618 | 3563 | |
| 28 February 2000 | 34,210 | 19,492 | 57.0 | 3508 | ||
| 5 March 2000 | 34,100 | 19,059 | 55.9 | 3550 | 3545 | |
| 6 March 2000 | 33,630 | 18,554 | 55.2 | 3540 | ||
| 12 March 2000 | 34,140 | 18,887 | 55.3 | 3523 | 3524 | |
| 13 March 2000 | 34,100 | 18,316 | 53.7 | 3525 | ||
| Average | 35,259 | 19,611 | 55.6 | 3666 | 3666 | |
| Maximum | 38,970 | 22,344 | 59.9 | 3808 | 3790 | |
| Minimum | 33,630 | 18,316 | 51.8 | 3508 | 3524 | |
| Sampling Time | Effluent SS Concentration mg/L | Inflow m3/h | SOR m3/m2·h | SLR kg/m2·day |
|---|---|---|---|---|
| 11:00 | 20.5 | 1860 | 21.8 | 115.0 |
| 12:00 | 13.3 | 1858 | 21.8 | 114.9 |
| 13:00 | 18.6 | 1860 | 21.8 | 115.0 |
| 14:00 | 14.4 | 1874 | 22.0 | 115.6 |
| 15:00 | 17.6 | 1861 | 21.8 | 115.0 |
| 16:00 | 24.4 | 1788 | 21.0 | 111.9 |
| 17:00 | 24.4 | 1758 | 20.6 | 110.6 |
| 18:00 | 23.6 | 1744 | 20.4 | 110.0 |
| 19:00 | 23.3 | 1751 | 20.5 | 110.3 |
| 20:00 | 22.3 | 1773 | 20.8 | 111.3 |
| 21:00 | 29.6 | 1806 | 21.2 | 112.7 |
| 22:00 | 27.1 | 1722 | 20.2 | 109.1 |
| 23:00 | 42.4 | 1329 | 15.6 | 92.2 |
| 0:00 | 35.3 | 1079 | 12.6 | 81.5 |
| 1:00 | 36.2 | 992 | 11.6 | 77.8 |
| 2:00 | 36.0 | 920 | 10.8 | 74.7 |
| 3:00 | 30.9 | 824 | 9.7 | 70.6 |
| 4:00 | 26.5 | 740 | 8.7 | 67.0 |
| 5:00 | 24.2 | 649 | 7.6 | 63.1 |
| 6:00 | 30.9 | 667 | 7.8 | 63.8 |
| 7:00 | 36.6 | 1207 | 14.1 | 87.0 |
| 8:00 | 35.9 | 1609 | 18.9 | 104.4 |
| 9:00 | 22.5 | 1793 | 21.0 | 112.3 |
| 10:00 | 16.2 | 1822 | 21.4 | 113.5 |
| Average | 26.3 | 1470.3 | 17.2 | 98.3 |
| Maximum | 42.4 | 1874.4 | 21.0 | 115.6 |
| Minimum | 13.2 | 648.9 | 7.6 | 63.1 |
| Date | SVI mL/mg |
|---|---|
| 9 January 2000 | 210 |
| 10 January 2000 | 208 |
| 13 January 2000 | 210 |
| 14 January 2000 | 209 |
| 21 January 2000 | 210 |
| 22 January 2000 | 213 |
| 4 February 2000 | 201 |
| 5 February 2000 | 212 |
| 13 February 2000 | 209 |
| 14 February 2000 | 211 |
| 18 February 2000 | 213 |
| 19 February 2000 | 211 |
| 27 February 2000 | 210 |
| 28 February 2000 | 209 |
| 5 March 2000 | 209 |
| 6 March 2000 | 207 |
| 12 March 2000 | 209 |
| 13 March 2000 | 210 |
| Average | 210 |
| Maximum | 213 |
| Minimum | 201 |
| Items | Inflow m3/Day | RAS Flow m3/Day | RAS Ratio % | MLSS Concentration mg/L | Average MLSS Concentration mg/L | |
|---|---|---|---|---|---|---|
| Date | ||||||
| 10 January 2021 | 11,331 | 10,953 | 96.7 | 3284 | 3290 | |
| 11 January 2021 | 10,800 | 11,392 | 105.5 | 3295 | ||
| 11 January 2021 | 10,800 | 11,392 | 105.5 | 3295 | 3287 | |
| 12 January 2021 | 11,031 | 11,235 | 101.8 | 3278 | ||
| 12 January 2021 | 11,031 | 11,235 | 101.8 | 3278 | 3271 | |
| 13 January 2021 | 11,630 | 12,009 | 103.3 | 3264 | ||
| 13 January 2021 | 11,630 | 12,009 | 103.3 | 3264 | 3258 | |
| 14 January 2021 | 11,352 | 11,533 | 101.6 | 3251 | ||
| 14 January 2021 | 11,352 | 11,533 | 101.6 | 3251 | 3244 | |
| 15 January 2021 | 11,185 | 11,612 | 103.8 | 3237 | ||
| 17 January 2021 | 11,300 | 11,786 | 104.3 | 3223 | 3216 | |
| 18 January 2021 | 11,004 | 11,301 | 102.7 | 3209 | ||
| 18 January 2021 | 11,004 | 11,301 | 102.7 | 3209 | 3203 | |
| 19 January 2021 | 10,797 | 11,774 | 109.0 | 3196 | ||
| 19 January 2021 | 10,797 | 11,774 | 109.0 | 3196 | 3178 | |
| 20 January 2021 | 10,988 | 11,479 | 104.5 | 3160 | ||
| 20 January 2021 | 10,988 | 11,479 | 104.5 | 3160 | 3168 | |
| 21 January 2021 | 11,055 | 11,820 | 106.9 | 3177 | ||
| 21 January 2021 | 11,055 | 11,820 | 106.9 | 3177 | 3172 | |
| 22 January 2021 | 11,084 | 11,589 | 104.6 | 3166 | ||
| Average | 11,111 | 11,551 | 104.0 | 3229 | 3229 | |
| Maximum | 11,630 | 12,009 | 109.0 | 3295 | 3290 | |
| Minimum | 10,797 | 10,953 | 96.7 | 3160 | 3168 | |
| Sampling Time Hour | Effluent SS Concentration mg/L | Average Hourly Inflow m3/h | SOR m3/m2·h | SLR kg/m2·day |
|---|---|---|---|---|
| 11:00 | 4.5 | 550 | 17.6 | 115.5 |
| 12:00 | 4.2 | 551 | 17.6 | 115.7 |
| 13:00 | 4.2 | 554 | 17.7 | 116.3 |
| 14:00 | 4.8 | 562 | 17.9 | 118.0 |
| 15:00 | 4.4 | 555 | 17.7 | 116.5 |
| 16:00 | 4.5 | 549 | 17.6 | 115.3 |
| 17:00 | 4.9 | 538 | 17.2 | 112.9 |
| 18:00 | 5.8 | 549 | 17.5 | 115.2 |
| 19:00 | 4.4 | 554 | 17.7 | 116.3 |
| 20:00 | 4.7 | 557 | 17.8 | 117.0 |
| 21:00 | 4.1 | 565 | 18.1 | 118.7 |
| 22:00 | 4.4 | 564 | 18.0 | 118.4 |
| 23:00 | 4.7 | 556 | 17.8 | 116.8 |
| 0:00 | 5.2 | 538 | 17.3 | 113.4 |
| 1:00 | 4.4 | 514 | 16.7 | 108.3 |
| 2:00 | 5.0 | 430 | 13.1 | 90.6 |
| 3:00 | 4.4 | 273 | 8.4 | 57.5 |
| 4:00 | 5.3 | 190 | 6.1 | 40.2 |
| 5:00 | 4.9 | 188 | 6.0 | 39.5 |
| 6:00 | 4.6 | 254 | 7.9 | 53.6 |
| 7:00 | 3.9 | 295 | 9.5 | 62.2 |
| 8:00 | 4.9 | 442 | 14.3 | 93.1 |
| 9:00 | 5.0 | 519 | 16.7 | 109.4 |
| 10:00 | 4.1 | 539 | 17.2 | 113.7 |
| Average | 4.6 | 474 | 15.1 | 99.8 |
| Maximum | 5.8 | 565 | 18.1 | 118.7 |
| Minimum | 3.9 | 188 | 6.0 | 39.5 |
| Date | SVI mL/mg |
|---|---|
| 10 January 2021 | 272 |
| 11 January 2021 | 273 |
| 12 January 2021 | 274 |
| 13 January 2021 | 275 |
| 14 January 2021 | 275 |
| 15 January 2021 | 276 |
| 17 January 2021 | 276 |
| 18 January 2021 | 277 |
| 19 January 2021 | 278 |
| 20 January 2021 | 279 |
| 21 January 2021 | 279 |
| 22 January 2021 | 280 |
| Average | 276 |
| Maximum | 280 |
| Minimum | 272 |
| Plant A | Plant B | ||
|---|---|---|---|
| Date | SVI mL/mg | Date | SVI mL/mg |
| 9 January 2000 | 210 | 10 January 2021 | 272 |
| 10 January 2000 | 208 | 11 January 2021 | 273 |
| 13 January 2000 | 210 | 12 January 2021 | 274 |
| 14 January 2000 | 209 | 13 January 2021 | 275 |
| 21 January 2000 | 210 | 14 January 2021 | 275 |
| 22 January 2000 | 213 | 15 January 2021 | 276 |
| 4 February 2000 | 201 | 17 January 2021 | 276 |
| 5 February 2000 | 212 | 18 January 2021 | 277 |
| 13 February 2000 | 209 | 19 January 2021 | 278 |
| 14 February 2000 | 211 | 20 January 2021 | 279 |
| 18 February 2000 | 213 | 21 January 2021 | 279 |
| 19 February 2000 | 211 | 22 January 2021 | 280 |
| 27 February 2000 | 210 | ||
| 28 February 2000 | 209 | ||
| 5 March 2000 | 209 | ||
| 6 March 2000 | 207 | ||
| 12 March 2000 | 209 | ||
| 13 March 2000 | 210 | ||
| Average | 210 | 276 | |
| Maximum | 213 | 280 | |
| Minimum | 201 | 272 | |
| Elements | Values | Remarks | |
|---|---|---|---|
| Plant A | Plant B | ||
| MLSS (kg/m3) | 3.400 | 3.300 | |
| ESS (kg/m3) | 0.005 | Xmin in Equation (1) | |
| Vo (m/h) | 14.718 | ||
| K1 (m3/kg) | 0.484 | ||
| K2 (m3/kg) | 9.500 | ||
Publisher’s Note: MDPI stays neutral with regard to jurisdictional claims in published maps and institutional affiliations. |
© 2022 by the author. Licensee MDPI, Basel, Switzerland. This article is an open access article distributed under the terms and conditions of the Creative Commons Attribution (CC BY) license (https://creativecommons.org/licenses/by/4.0/).
Share and Cite
Lee, B. Comparison of Effluent Suspended Solid Concentrations from Two Types of Rectangular Secondary Clarifiers. Water 2022, 14, 1577. https://doi.org/10.3390/w14101577
Lee B. Comparison of Effluent Suspended Solid Concentrations from Two Types of Rectangular Secondary Clarifiers. Water. 2022; 14(10):1577. https://doi.org/10.3390/w14101577
Chicago/Turabian StyleLee, Byonghi. 2022. "Comparison of Effluent Suspended Solid Concentrations from Two Types of Rectangular Secondary Clarifiers" Water 14, no. 10: 1577. https://doi.org/10.3390/w14101577
APA StyleLee, B. (2022). Comparison of Effluent Suspended Solid Concentrations from Two Types of Rectangular Secondary Clarifiers. Water, 14(10), 1577. https://doi.org/10.3390/w14101577