Article

Performance Evaluation of a Hybrid Enhanced Membrane Bioreactor (eMBR) System Treating Synthetic Textile Effluent

by
Kryssian Romeiro Manoel dos Santos
1,2,*,
Rosangela Bergamasco
2 and
Veeriah Jegatheesan
1
1
School of Engineering and Water: Effective Technologies and Tools (WETT) Research Centre, Royal Melbourne Institute of Technology (RMIT), Melbourne, VIC 3000, Australia
2
Department of Chemical Engineering, State University of Maringá, Av. Colombo, 5790, Bloco D90, Maringá 87020-900, PR, Brazil
*
Author to whom correspondence should be addressed.
Water 2022, 14(11), 1708; https://doi.org/10.3390/w14111708
Submission received: 11 March 2022 / Revised: 14 May 2022 / Accepted: 18 May 2022 / Published: 26 May 2022
(This article belongs to the Special Issue Section Wastewater Treatment and Reuse: Feature Papers)

Abstract

:
The textile industry produces a high volume of wastewater rich in toxic and harmful chemicals. Therefore, it is necessary to apply wastewater treatment methods such as membrane bioreactor (MBR) to achieve high efficiency, process stability, small footprint, and low maintenance costs. This work performed a study on a synthetic textile wastewater treatment using an enhanced membrane bioreactor (eMBR) equipped with two anoxic and one aerobic reactor and a UV disinfection unit. The results showed 100% removal of total suspended solids, 81.8% removal of chemical oxygen demand, and 96% removal of color. The SEM analysis indicated that the pores of the membrane were blocked by a compact and dense gel layer, as observed by the presence of the fouling layer. According to these results, an eMBR hybrid system is a suitable option for treating synthetic textile wastewater. Opportunities to increase the efficiencies in the removal of some pollutants, as well as stabilizing and standardizing the process are the improvements which require further investigations.

1. Introduction

The textile industry can consume a significant amount of water to produce natural and synthetic yarns, non-woven, technical, home, and furnishing textiles, automotive, medical, and synthetic leather etc. [1,2]. Thus, the textile industry is among the highest water-consuming sectors. This colossal production has impacted the environment because the wastewater generated should be considered a severe environmental problem since 17% to 20% of industrial water pollution comes from textile dyeing and finishing applied to fabrics [3,4,5].
Increasing the discharge of such effluents without proper and adequate treatment has adversely impacted the water bodies, soil, and ecosystems and caused risks to human health. Moreover, textile mill effluent is characterized by the presence of residues of reactive dyes and other hardly degradable chemicals, as well as high concentrations of chemical oxygen demand (COD) and biological oxygen demand (BOD5) [6].
Some chemicals in the textile mill effluent are volatile and can evaporate into the air we breathe or are absorbed through our skin and show up as allergic reactions, and may cause harm to babies even before their birth [5]. Textile dyes intensely impact and degrade the quality of water bodies, increase BOD and COD, impact photosynthesis, inhibit plant growth, enter the food chain, provide recalcitrance and bioaccumulation, and may promote toxicity, mutagenicity, and carcinogenicity [7].
Textile wastewater is complex and carries a high chemical load, characterized by its intense color, presence of concentrated organic compounds, and significant variations in composition, ranging from inorganic finishing agents, surfactants, chlorine molecules, salts, phosphate, and organic polymer products [2,8]. Textile effluent is considered the cause of a significant amount of environmental degradation and human illnesses [9]. Accordingly, it is of utmost importance for this vast industry around the globe to ensure the awareness of all stakeholders about the substantial environmental impact caused by its operations [1,2].
The stringent water quality requirements for discharging wastewater to the environment, societal pressure, and governmental laws force the industries to recycle treated wastewater [10]. Due to the above-mentioned facts, the textile wastewater treatment is crucial but also an extremely complicated task. There are many methods, such as biological, chemical, and physicochemical methods, which can be used to treat textile wastewater [11,12]. Biological methods use pure and mixed microbial cultures under aerobic and/or anaerobic conditions [4,13], physical methods include coagulation/flocculation [14], adsorption [15], and membrane filtration (ultrafiltration, nanofiltration, reverse osmosis, etc.) [16], and chemical and electrochemical advanced oxidation processes (AOPs/EAOPs) include hydrogen peroxide (H2O2) photolysis with ultraviolet (UV) radiation (H2O2/UVC) [17], Fenton [18], photo-Fenton [19], anodic oxidation (AO) [20], and electro-Fenton (EF) [21].
The filtration process is basically pumping the water/wastewater against the membrane surface, resulting in a separation, by positive or negative pressure, of permeate and waste streams. Membranes used in water/wastewater filtration are made with synthetic, most frequently polymers, and semipermeable materials. This means it is highly permeable to some constituents and less permeable to others [22]. Moreover, membrane separation processes (MSP) have become an important alternative to produce good-quality water due to their higher removal rate of low organic pollutants, minimizing the risk associated with the source and its contaminants as well as its modularity and ability to integrate with other systems [23]. Membrane-based processes provide interesting possibilities of separating hydrolyzed dye stuff and dyeing auxiliaries, thereby reducing coloration and COD content. The choice of a membrane process to separate contaminants is guided by the quality of permeates required for reuse by the textile mills [24]. Microfiltration has limited application in textile wastewater treatment when used by itself. Microfiltration membranes usually have pore sizes in the range of 0.1–10 μm, and separation through microfiltration is usually carried out at a low-pressure differential within 2 bars [25].
The membrane bioreactors (MBRs) composed of physical and biological processes (along with chemical processes if required) have been emerging as effective technologies to treat different wastewaters [11,26,27,28,29]. MBRs have advantages over classical methods, such as: (i) the generation of excellent and consistent effluent quality, (ii) withstanding higher volumetric organic loadings, (iii) producing less sludge, (iv) retaining the biomass completely within the reactor, (v) requiring less equipment, (vi) high performance with respect to nutrient removal, (vii) low energy demand, and (viii) having a small footprint [11,26,27,28,29]. Nevertheless, their principal problem in the application is cited as the fouling of membranes. This has led to the creation of hybrid MBRs, referred to as enhanced membrane bioreactors (eMBRs).
The hybrid system in MBRs refers to a combination of different treatments to achieve a specific water quality, cost effectiveness, or both. A hybrid eMBR system is where an MBR is the main treatment module that is connected to other known treatment units. The eMBR technology has emerged as an efficient compact technology for wastewater treatment, but its performance has not been fully explored and evaluated to treat textile wastewater [26,30,31]. Thus, according to its actual performance to treat different types of wastewaters as well as its advantages, along with the lack of data about its applicability in certain effluents, this study was formulated to investigate the treatment of synthetic textile wastewater using a hybrid eMBR system composed of two anoxic (ANX) biological reactors, one aerobic membrane bioreactor (AMBR), an ultraviolet light disinfection (UV), and an activated carbon (AC) filter, referred to as 2ANX + AMBR + UV + AC.

2. Materials and Methods

2.1. Composition of Synthetic Textile Wastewater

A grey synthetic wastewater (GSWW) to acclimatize the activated sludge was prepared with several components, such as: sunscreen or moisturizer (15 or 10 mg/L), toothpaste (32.5 mg/L), deodorant (10 mg/L), sodium sulfate (35 mg/L), sodium bicarbonate (25 mg/L), disodium phosphate (39 mg/L), clay (100 mg/L), vegetable oil (0.5 mL/L), vegetable soup (500 mg/L), full-cream milk (0.6 mL/L), lard (250 mg/L), shampoo/hand-washing liquid (720 mg/L), laundry soap (150 mg/L), dishwashing (sink) detergent (0.01 mL/L), dishwasher detergent (50 mg/L), and secondary effluent (40 mL/L). Besides, to test the efficiency of the eMBR system, a synthetic textile wastewater (TSWW) was formulated as shown in Table 1. Both of these feeds were kept at 4 °C and brought to room temperature (22 ± 2 °C) before placing them in the feed system.
The 158-day experiment was divided into 3 different stages according to the time needed to change the feed from 100% grey synthetic wastewater (GSWW) to 100% textile synthetic wastewater (TSWW), and a gradual transition was performed to preserve the activity of the microbiome. In the first stage, 100% GSWW was used as the feed for the eMBR (denoted as phase 1, 1–22 days). The second stage had three steps since the feed was 75% GSWW and 25% TSWW at first (phase 2, 23–31 days), and changed to 50% GSWW and 50% TSWW (phase 3, 32–72 days), and then 25% GSWW and 75% TSWW (phase 4, 73–101 days). Finally, in stage 3, the last operational condition was applied, where 100% TSWW was fed to the eMBR (phase 5, 102–158 days).

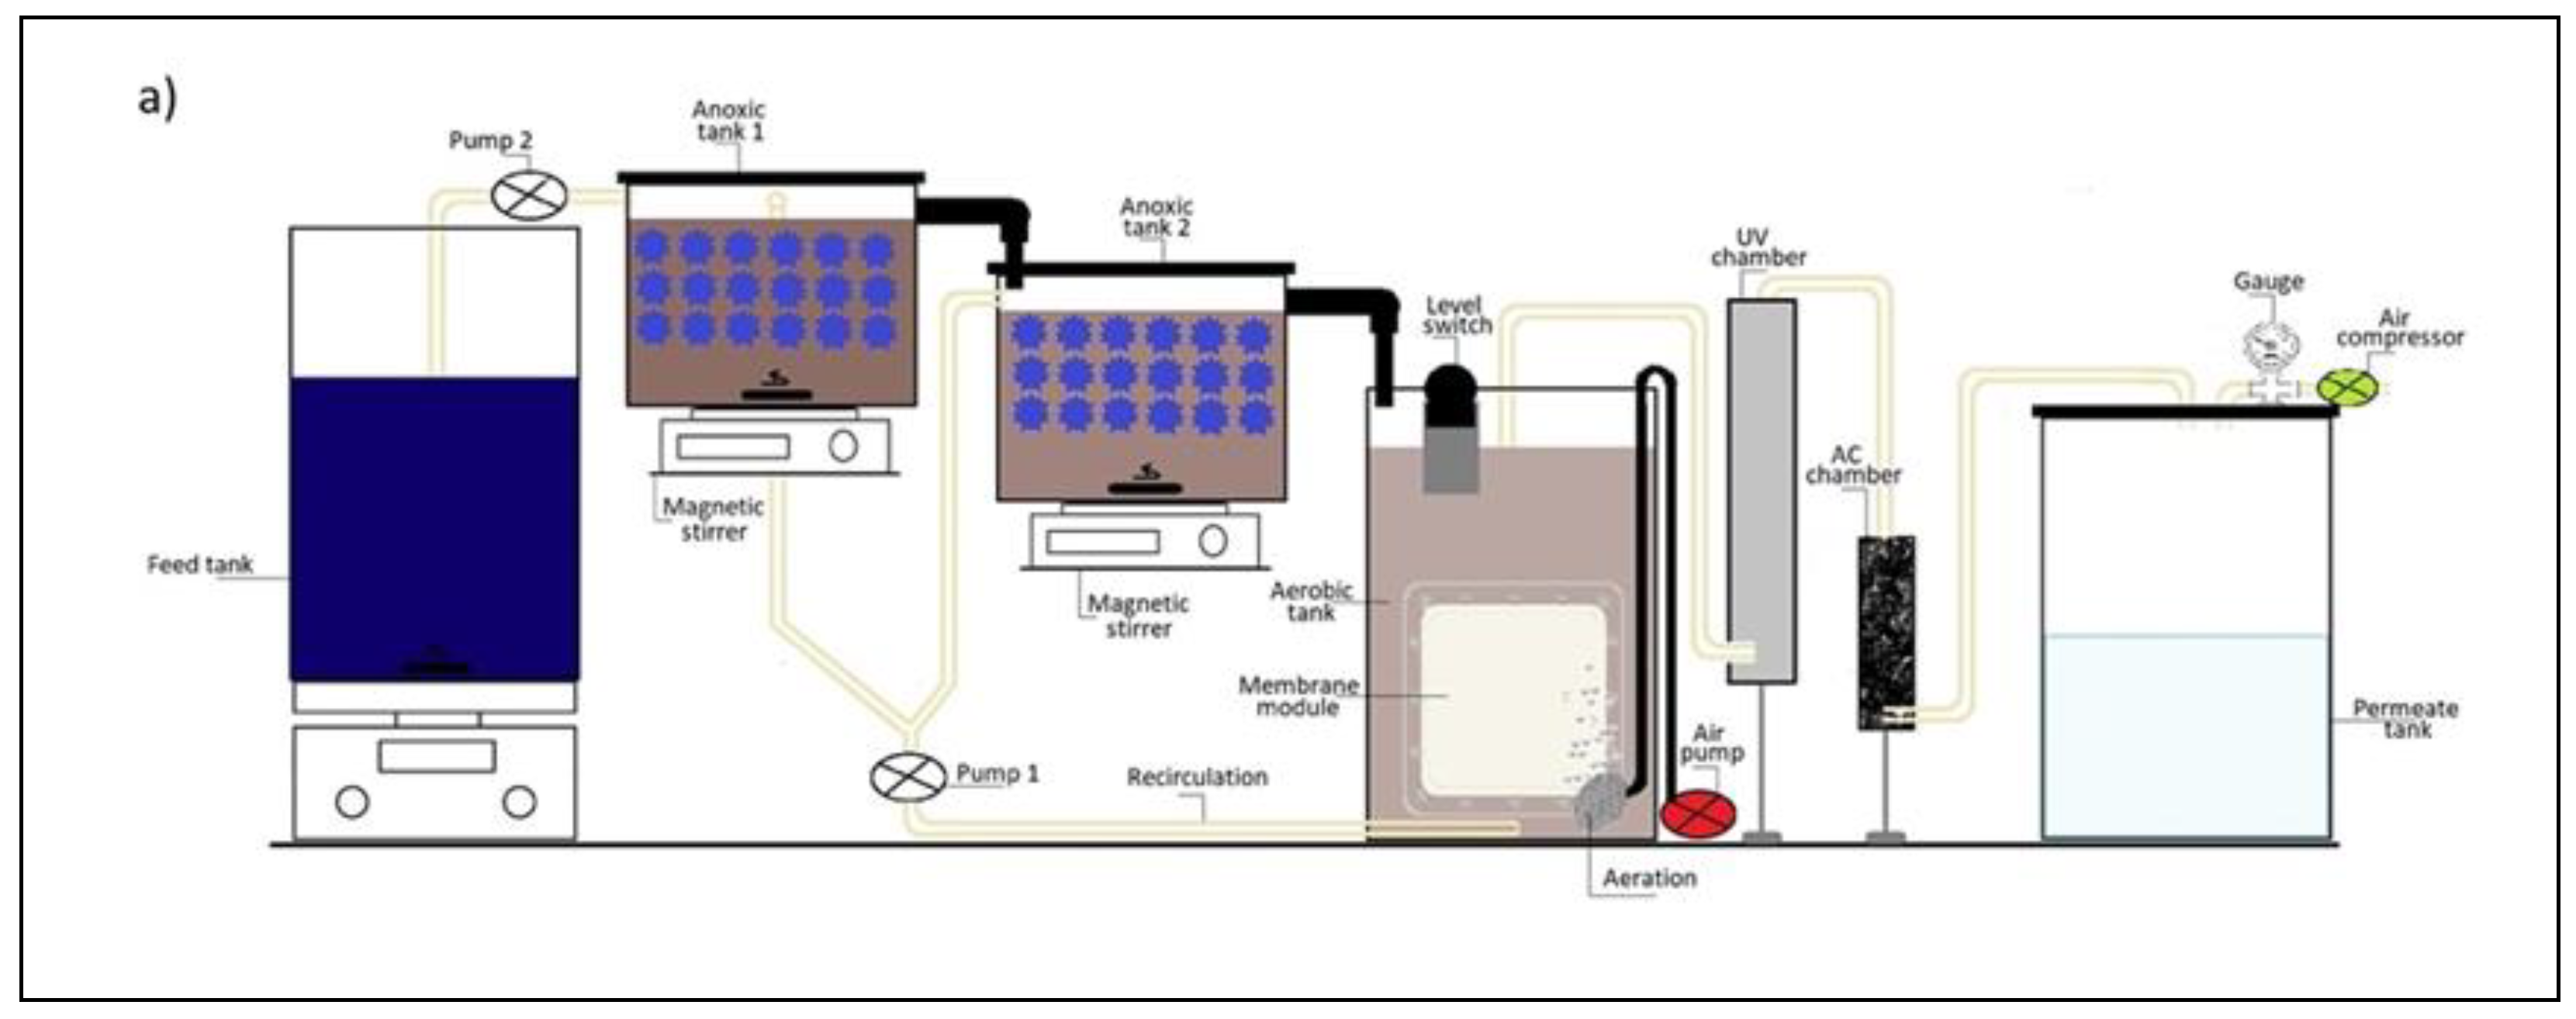
2.2. Experimental Setup of Hybrid eMBR System

A laboratory-scale hybrid eMBR system similar to the one used by Moazzem et al. [32] was used in this study. Thus, three interconnected bioreactors made of Perspex were setup in a sequence to form two anoxic bioreactors (ANX1 and ANX2), followed by an aerobic membrane bioreactor (AMBR) with 5.5, 5.5, and 11 L of maximum hydraulic capacity, respectively. PolySeed (InterLab) capsules were used as the microbial source and aimed to increase microbial activities in ANX and aerobic reactors. Additionally, random packs of plastic media (40 mm nominal diameter) and magnetic stirrers were installed underneath the reactors for mixing. Plastic media encouraged attached microbial growth. Recirculation was carried out in the system by a peristaltic pump from AMBR to both ANX reactors. The feed was added automatically through the activation of a level controller installed in the AMBR tank. Flat-sheet PVDF membranes supplied by STERLITECH Corporation (Auburn, WA, USA) (surface area of 0.0196 m2 and pore size of 0.3 μm) were attached to the membrane module and immersed in the aerobic tank. Air was supplied to the AMBR tank from a central compressed air system via airflow pipes and the air stones placed in the AMBR tank. The dissolved oxygen in the aerobic tank was kept constant at 2–3 mg/L. A peristaltic pump fed the ANX1, ANX2, and AMBR tanks so that each one received wastewater by overflow from the predecessor. A vacuum pressure gauge was placed at the permeate side of the membrane to measure transmembrane pressure (TMP). A UV-C lamp (wavelength: 134 nm, 170 mA, 4 W) with a stainless-steel body (made at AUVS UltraViolet Pty Ltd., Thomastown, Australia) was installed after AMBR to disinfect the permeate from AMBR. A granular activated carbon column (GAC) made of glass with a total height of 24 cm and an internal diameter of 3.5 cm was used for final polishing of the AMBR permeate. GAC column was filled with granular activated carbon (the determined surface area was 575 m2/g, with a pore diameter of 1.19 nm) from palm coconut, made by Bahia Carbon Ltd. (Bahia, Brazil). An electronically controlled timer was put in the system to operate it intermittently (8 min “on” and 2 min “off”), where backward airflow was supplied at the membrane module during the 2 min relaxation period (“off” period), helping to reduce the fouling. After day 75, the peristaltic pump used for suction, the electronically controlled timer, and the backward airflow were turned off. Thus, the system started to work in a continuous mode, where the vacuum was used for the suction of permeate through the membrane.

2.3. Analytical Methodologies

The experiments in this study involved analytical methods for different purposes. Table 2 summarizes these parameters, the equipment used, and the locations where the samples were collected. The frequency of analysis was twice a week for dissolved oxygen (DO), electrical conductivity (EC), oxide reduction potential (ORP), pH, temperature (T), color, and turbidity, weekly for total organic carbon (TOC), biweekly for total suspended solids (TSS), mixed liquor suspended solids (MLSS), and mixed liquor volatile suspended solids (MLVSS): NH3+, NO3, and NO2, and monthly for chemical oxygen demand (COD), total phosphorus (TP), total nitrogen (TN), and heavy metals. Finally, scanning electron microscopy (SEM) was used at the end of experiments to evaluate membrane fouling.

2.4. Operational Parameters of Enhanced Membrane Bioreactor

Flow rates in the recycling lines and permeate flux were obtained using a timer, a graduated cylinder, or a beaker. A beaker on a balance was used to collect permeate from the membrane. Thus, once a week, a sample was collected in recycled tubes and permeate, where flow rate and flux were calculated using Equations (1) and (2):
F l o w   r a t e   ( L / h ) = V o l u m e   ( L ) T i m e   ( h )
F l u x   ( L / m 2 h ) = F l o w   r a t e   ( L / h ) T o t a l   m e m b r a n e   a r e a   ( m 2 )
Hydraulic retention time (HRT) is necessary to: (i) verify the time provided for the treatment in each unit, (ii) correctly size the reactors, and (iii) provide sufficient contact time between wastewater and the microorganisms, which will influence the microbial growth and pollutant removal efficiency. This critical parameter was obtained for all tanks and the UV chamber weekly by using Equation (3):
H R T   ( d a y ) = V o l u m e   ( L ) F l o w   r a t e   ( L / d a y )
The total dissolved solids (TDS) concentration can be correlated with electrical conductivity (EC), since it is directly affected by the salinity of the water. The TDS parameter (Equation (4)) is mainly composed of cations and anions, such as: sodium (Na+), calcium (Ca2+), potassium (K+), magnesium (Mg2+), chloride (Cl), sulfate (SO42−), carbonate (CO32−), and bicarbonate (HCO3) [34].
TDS   ( mg / L ) = EC   ( µ S / cm ) × 0.55 0.70
The difference between parameters showed the process efficiency (Equation (5)). Therefore, the percentage of removal of the parameters evaluated was determined using the following equation, where Ci,in is the influent concentration and Ci,out is the effluent concentration at a given time:
%   r e m o v a l = C i , i n C i , o u t C i , i n × 100

3. Results and Discussion

3.1. Operational Phases of the eMBR

The experiments ran for 158 days, divided into 3 different stages. All phases and parameters of their respective stages are described in Table 3. To minimize the impact of the increase in the TSWW, during phases 2 and 3, the system flux was kept low and consequently resulted in a high HRT. However, membrane replacement was necessary to increase the flux and HRT in subsequent phases, since the backwashing pressure adjustment went out of order. However, after three days, a new membrane was required for the system, and it did not work as expected because of the high and fast fouling in the eMBR, which explains the low flow rate and high HRT during phase 5.
The characteristics of feed monitoring in each stage (Table 4) showed a low COD level when TSWW started to increase. According to Shoukat et al. [34], the loading strength of the TSWW should be 3000 mg/L, but the real value found in this work was an average of 314 mg/L during all experiments. At phase 4, a glucose increment in the feed was applied to enhance COD loading; however, due to the nitrification in the aerobic digestion, a high amount of acid was liberated, which had been recirculated to all tanks and caused a drastic drop in pH in all tanks, resulting in massive bacterial death.

3.2. Monitoring of the Hybrid eMBR System Parameters

Samples were collected at different locations of the eMBR, aiming to evaluate its performance through various parameters, as shown in Figure 1.

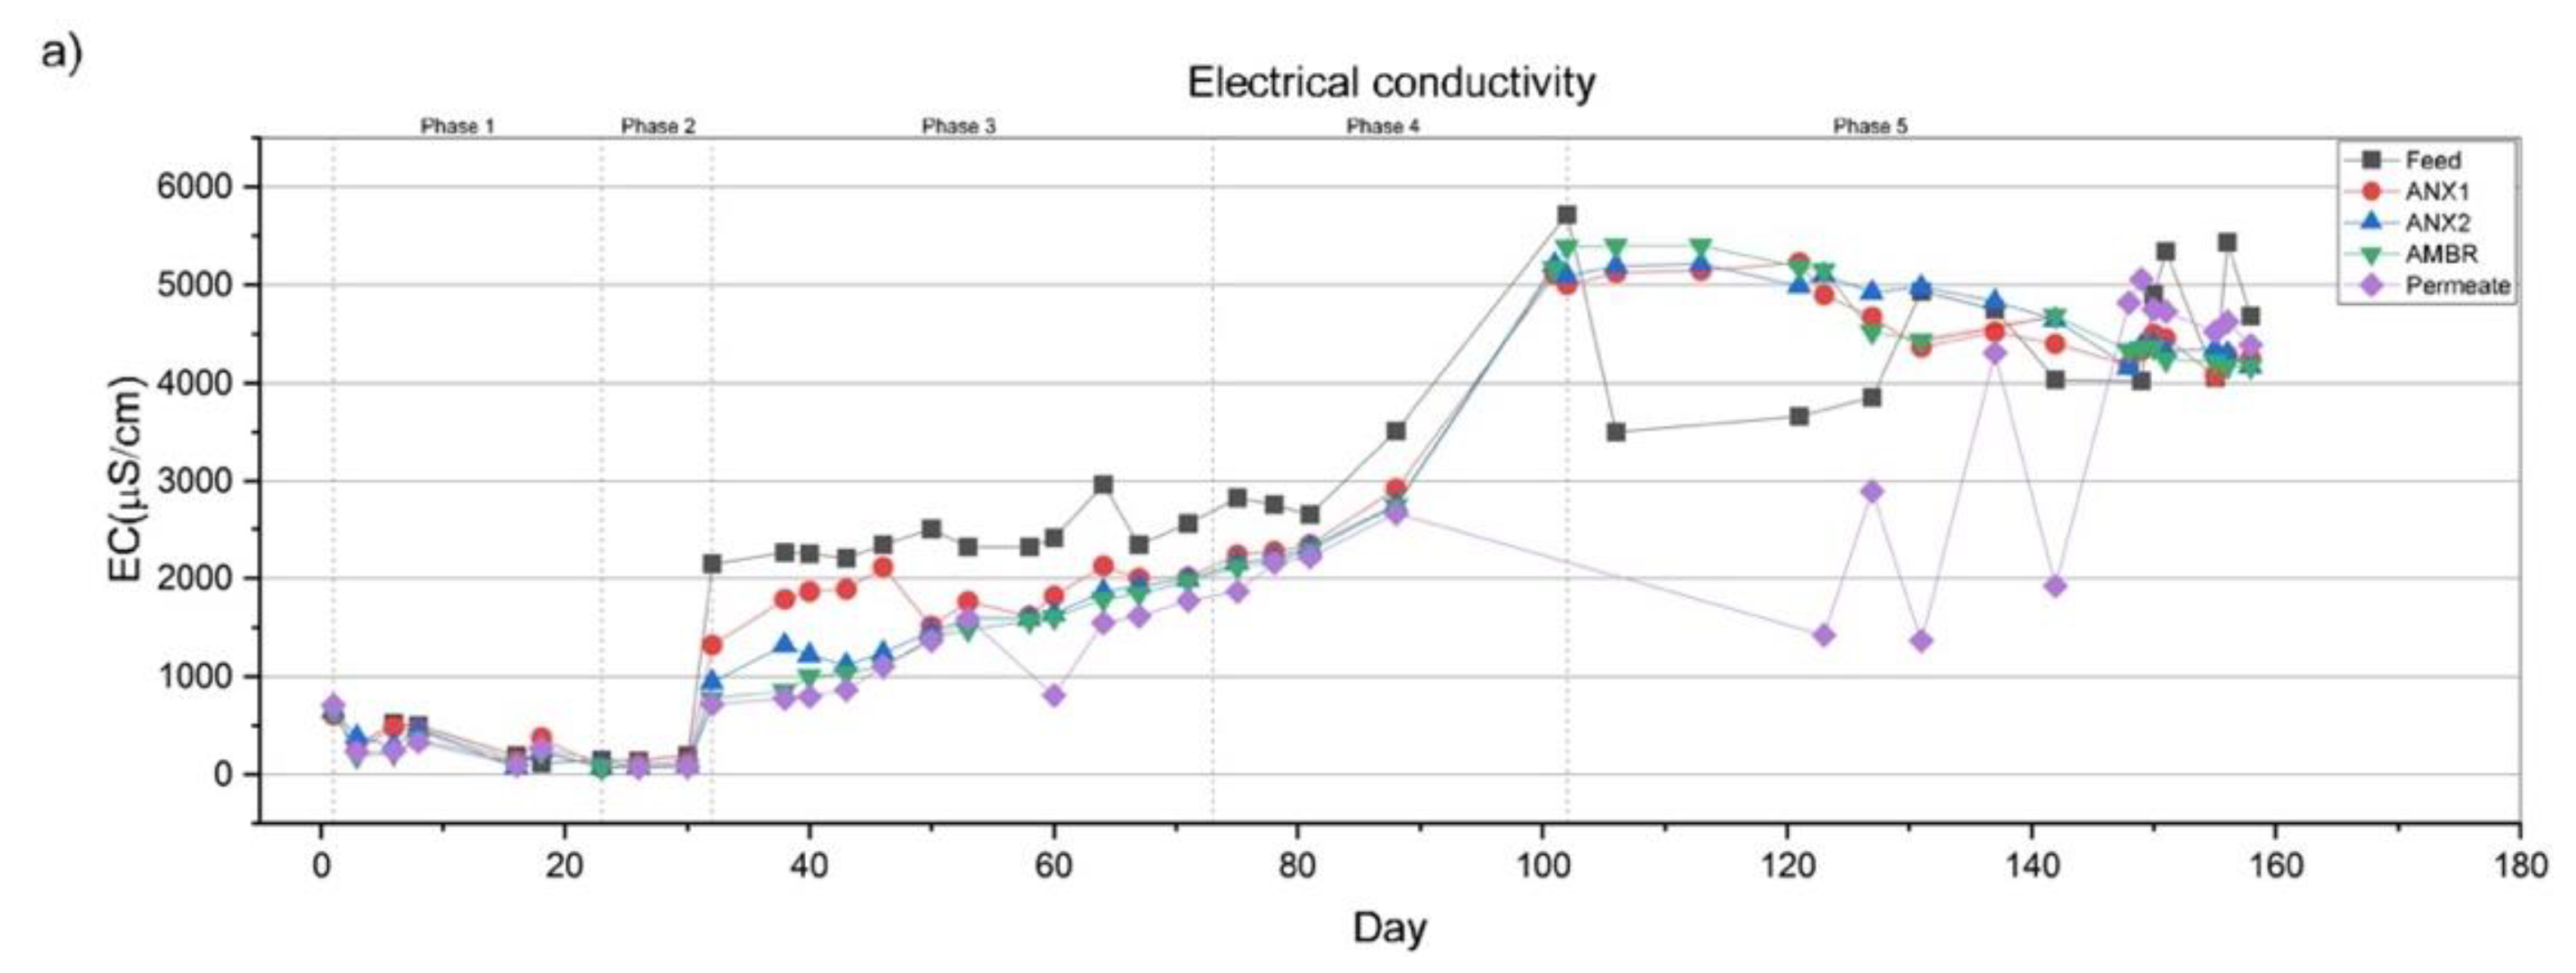
3.2.1. Electrical Conductivity and Total Dissolved Solids

TSWW is rich in salts, and the proportional increase of electrical conductivity throughout the stages was possible to verify after phase 1, as shown in Figure 2a. These conductive ions come from dissolved salts and inorganic materials such as alkalis, chlorides, sulfides, and carbonate compounds [35], and can be corroborated with total dissolved solids (TDS) analysis. The ratios used were 0.72 and 0.64, for EC values up to 800 μS/cm and over 800 μS/cm, respectively. Both EC and TDS (Figure 2a,b) results occurred for the same reason: the system did not efficiently remove salts.
Biological treatment processes need a long-term acclimation to culture-specific microbial communities that have salt-resistance characteristics and then become capable of removing the salt [36]. In the case of high salinity, the metabolic enzyme activity can be reduced and damage the microbial enzyme structure and cause inhibition to the growth of the microorganisms [37]. Sathya et al. [38] noticed in their experiments that TDS cannot be removed because microfiltration has no effect on dissolved solids’ removal, and in a MBR experiment used to treat carwash wastewater, EC and TDS remained unchanged during the treatment process [32].

3.2.2. Temperature Variation

According to Seneviratne [39], the typical temperature of textile wastewaters is between 35 and 45 °C. Thus, after phase 2, the feed temperature was increased to an average of 33.3 °C, and in phase 3, the temperature reached 42.1 °C. However, the increase in temperature caused a variation in the feed pH. Due to this, after day 92, when low pH resulted in the death of microbial biomass, the system was cooled to keep it more stable and decrease the number of variables that influenced the pH of the system (Figure 2c).

3.2.3. Dissolved Oxygen (DO) and Oxidation Reduction Potential (ORP)

The DO level in water and wastewater depends on the physical, chemical, and biochemical activities. In freshwater, DO reaches 14.6 mg/L at 0 °C and approximately 9.1, 8.3, and 7.0 mg/L at 20, 25, and 35 °C, respectively. For a living organism, the minimum required DO is 4 mg/L [40]. Biological processes can be characterized by the amount of DO present, and its typical concentrations in various zones of an MBR are 0.0 to 0.5 mg/L (anoxic), 1.5 to 3.0 mg/L (aerobic), and 2.0 to 6.0 mg/L [22]. Figure 2d presents the DO found in all stages of this study, and its variation could be related to the oscillation in temperature. In phase 3, a low feed value of DO was found, which can be justified by the temperature during this period [40], and throughout all the phases of MBR, values of DO varied due to the oscillation in the aeration pump required to manually control the feed.
According to Gerardi [41], it is possible to define biochemical reactions by ORP, wherein each reaction is supposed to occur most efficiently in a specific range of ORP. Thus, it is possible to use ORP to identify and understand nutrient removal processes such as nitrification, denitrification, and phosphorus release as they are characterized by the ORP values of +100 to +350, +50 to −50, and −100 to −250 mV, respectively. The average ORPs of the ANX and AMBR reactors were estimated at −228, −245, and −16 mV, respectively (Figure 2e). These values justify incomplete removal of nitrogen and some phosphorus release as they characterize the ANX reactors as more anaerobic than anoxic. Anaerobic digestion is a step required to remove phosphorus in the subsequent aerobic condition [42]. The relation between DO and ORP was calculated using a linear equation, and had an R2 of 0.91.

3.2.4. Hydrogen Potential (pH)

Figure 2f indicates that pH was declining gradually during phases 2 and 3, and at day 92 (phase 4), a sharp decrease was observed in the pH of ANX and AMBR reactors, bringing the pH down to a range of 3.5–4. This pH value indicates a highly acidic medium that can inhibit bacteria and/or succeed in the loss of microbial biomass since nitrification is suspended at a pH lower than 4.3 and denitrification decreases or even ceases to occur at a pH lower than 6 [42,43,44,45]. Sufficient alkalinity is not available to allow nitrification of all of the ammonia released from the destruction of biomass, resulting in depression of the pH as the available alkalinity is consumed. Another detail previously presented about the ORP of the ANX bioreactor indicates that its behavior was more anaerobic, and thus decreased the efficiency and capability of anoxic/aerobic digestion cycles to maintain the control of pH [46]. Therefore, high return activated sludge (RAS), a low nutrient requirement ratio (C:N:P), and high salinity are the potential factors which together caused the system to collapse. To overcome this issue, the following parameters were adjusted:
  • Return activated sludge (RAS): to retain nitrifying organisms in sufficient concentrations, the range should be between 75% and 150% of the influent flow rate [47], and as shown in Figure 1, during phases 3 and 4 it was 543% and 344%, respectively.
  • Nutrient requirements (C:N:P ratio): Minimum ratios required for optimal microbial growth in the aerobic and anaerobic processes are 100:5:1 (aerobic processes) and 330:5:1 (anaerobic processes) [39]. In this study, during phases 3, 4, and 5, the ratio of nutrients was 3.66:TN:1, 3.16:2.15:1, and 3.25:2.49:1, respectively.
  • High salinity might cause plasmolysis and a loss of activities of the organisms. This was confirmed with the decrease in nutrient removal [39,48].

3.2.5. Temporal Variation of Flux and Transmembrane Pressure (TMP)

The temporal variations of permeate flux and transmembrane pressure during the experimental period are shown in Figure 3. During stages 1 and 2, the flux was kept low to acclimatize the bacterial biomass to the change in the feed composition. However, the membrane needed to be replaced on day 52 (during phase 3). After that action, a sharp increase in the TMP was detected, where the TMP increased from 12.3 to over 70 kPa, leading to conclude that the membrane had not properly opened its pores (corroborating with SEM analysis). On day 103, the membrane was replaced after a not successful and short try on of the membrane made in-house on day 100. After day 103, TMP became stable at around 48.5 kPa, and after the membrane became porous, the flux increased to a maximum of 6.24 L/m2h, but it decreased with time due to fouling (Figure 3). After day 137, one more change in the system setup had to be made, where a new vacuum suction was installed, replacing the peristaltic pump because it did not have enough power to suck the permeate through the membrane due to high membrane fouling. Due to that modification, TMP became fixed at 50 kPa, and from then onwards, the fouling behavior was verified by oscillation in the flux. The membrane module was cleaned three times daily by physical backwashing with 10 kPa of pressure, and it was cleaned chemically once a week by soaking the membrane for 1 h in 0.05% aqueous sodium hydroxide solution. It was observed that the average flux after day 137 was 1.26 L/m2h, at 50 kPa.

3.2.6. Mixed Liquor Suspended Solids (MLSS) and Mixed Liquor Volatile Suspended Solids (MLVSS)

Total suspended solids, including bacteria, dead biomass, and higher life forms, are termed mixed liquor suspended solids (MLSS). In another way, the concentration of active biomass is called mixed liquor volatile suspended solids (MLVSS) [39]. The MLVSS from the MLSS value could be obtained by multiplying the MLSS concentration by 0.75 [49]. In this study, the multiplier was 0.71.
Table 5 contains data on MLSS. It could be observed from the table that MLSS decreased in ANX2 and AMBR reactors after the increase of the concentration of TSWW. It occurred because microorganisms required time to acclimatize with the change in feed composition, and a high RAS rate was detected that made difficult the retention of nitrifying organisms in sufficient concentrations [47]. It is possible to verify the considerable increase of MLSS in phase 4 due to the intensive work carried out to increase microbial biomass, although the MLSS in the AMBR kept decreasing in phase 5. A similar finding was detected by Moazzem et al. [32] in MBR research used to treat carwash wastewater, wherein the authors observed that MLSS of AMBR also decreased due to the lack of food. Therefore, the microorganisms in the AMBR could not consume enough food to grow. However, higher consumption of food in the ANX tanks will reduce the fouling of the membrane in the AMBR, as the AMBR is being used as a polishing treatment with low MLSS. However, secretion of extracellular polymeric substances (EPS) by the microbes in the AMBR under such conditions needs to be evaluated, as EPS could cause serious fouling of the membrane.

3.3. Treated Water Quality
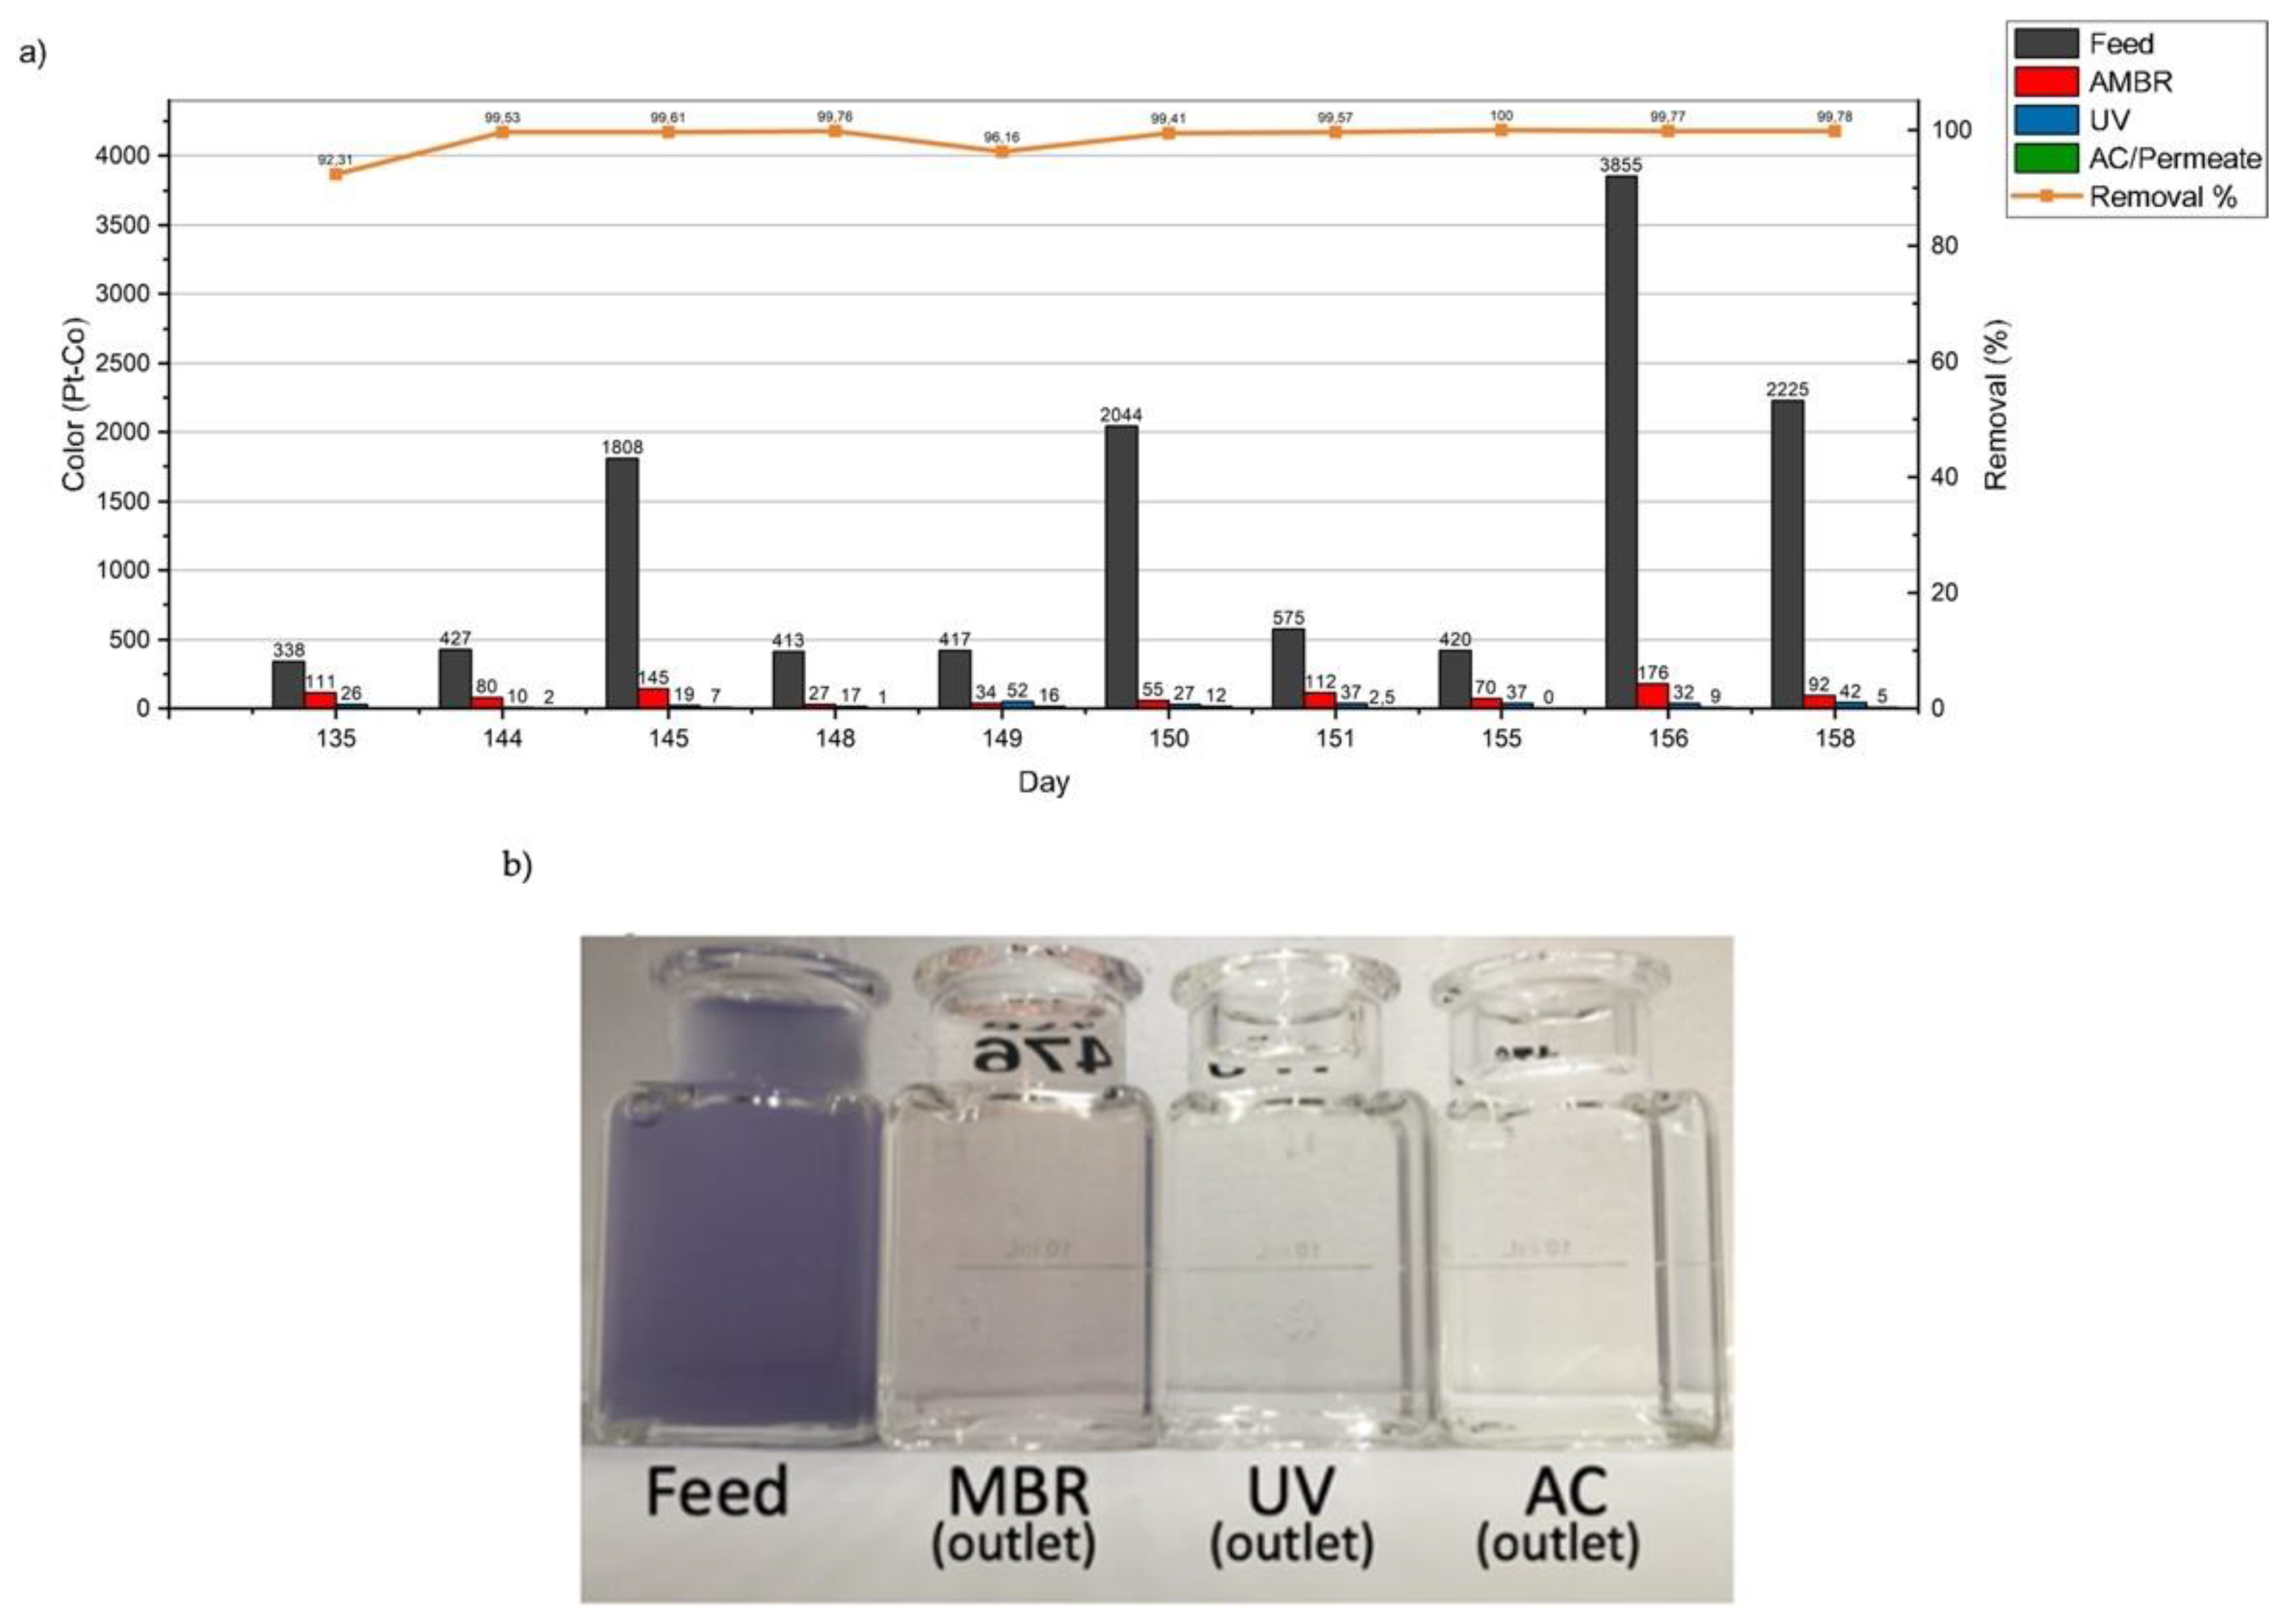
Water quality parameters of textile wastewater were monitored during the experiments. The analysis involved finding the alterations in color, turbidity, chemical oxidation demand, total organic carbon, and total suspended solids.

3.3.1. Color

Textile wastewater is rich in color, and it is one of the foremost parameters that requires removal. This study achieved great color removal capacity by having an average removal of 96%, which was checked by true color analyses, and the results are presented in Figure 4a. The feed had a high variability of color: the longer it was stored or placed in the system, the higher the color removal became (Figure 4b). Additionally, it was possible to check the role of color removal in each step of the process, where ANX1&2 + AMBR were responsible for 90%, and UV and GAC were responsible for 6% and 3% of the total color removal, respectively. This observation is supported by a study which reports that most of the color removal was found to occur in anaerobic conditions [50]. Anaerobic conditions assist in the degradation of azo bonds found in azo dyes, resulting in decolorization of the azo dyes [51,52]. MBRs with higher MLSS can efficiently remove color at lower HRTs. For example, in one study, the MBR removed 88.9% of Reactive Dye 390 under the following conditions: HRT = 15.25 h, SRT = 3 days, and MLSS = 10,950–11,910 mg/L (Table 6) [53]. Another study found removal efficiencies of 48.2% and 63.2% for the dark and medium-colored dyes in the anaerobic treatment stage, indicating the cleavage of azo bonds (Table 6) [54].

3.3.2. Turbidity

Turbidity has a similar characteristic to color, which means high intensity and variability along the duration of the experiments. The hybrid eMBR system showed excellent removal, achieving an average of 99.5%, and ANX1&2 + AMBR provided significant removal (Figure 5). Membranes are extremely efficient in reducing turbidity as they do not allow particles larger than their pore size to pass through. In this study, a microfilter of 0.3 μm was used, which produced effluent with a turbidity of 0.66 NTU. Generally, drinking water can have turbidity up to 5 NTU, but most of the water treatment plants can produce water with a turbidity of 0.1–0.2 NTU. In this sense, the treatment efficiency provided by the MBR used in this study, with respect to turbidity, was very high. Analysis of turbidity values for feed (inlet), AMBR, UV, and AC (outlet) pointed out a gradual increase in turbidity between UV and AC. This was due to inadequate sealing of the activated carbon column, where even after washing AC a few times, it still released small particles, similar to a powder, that interfered with the turbidity reading. Relating the turbidity with particles sizes will be useful and will provide an indication on the sizes of the particles present in the treated effluent [55].

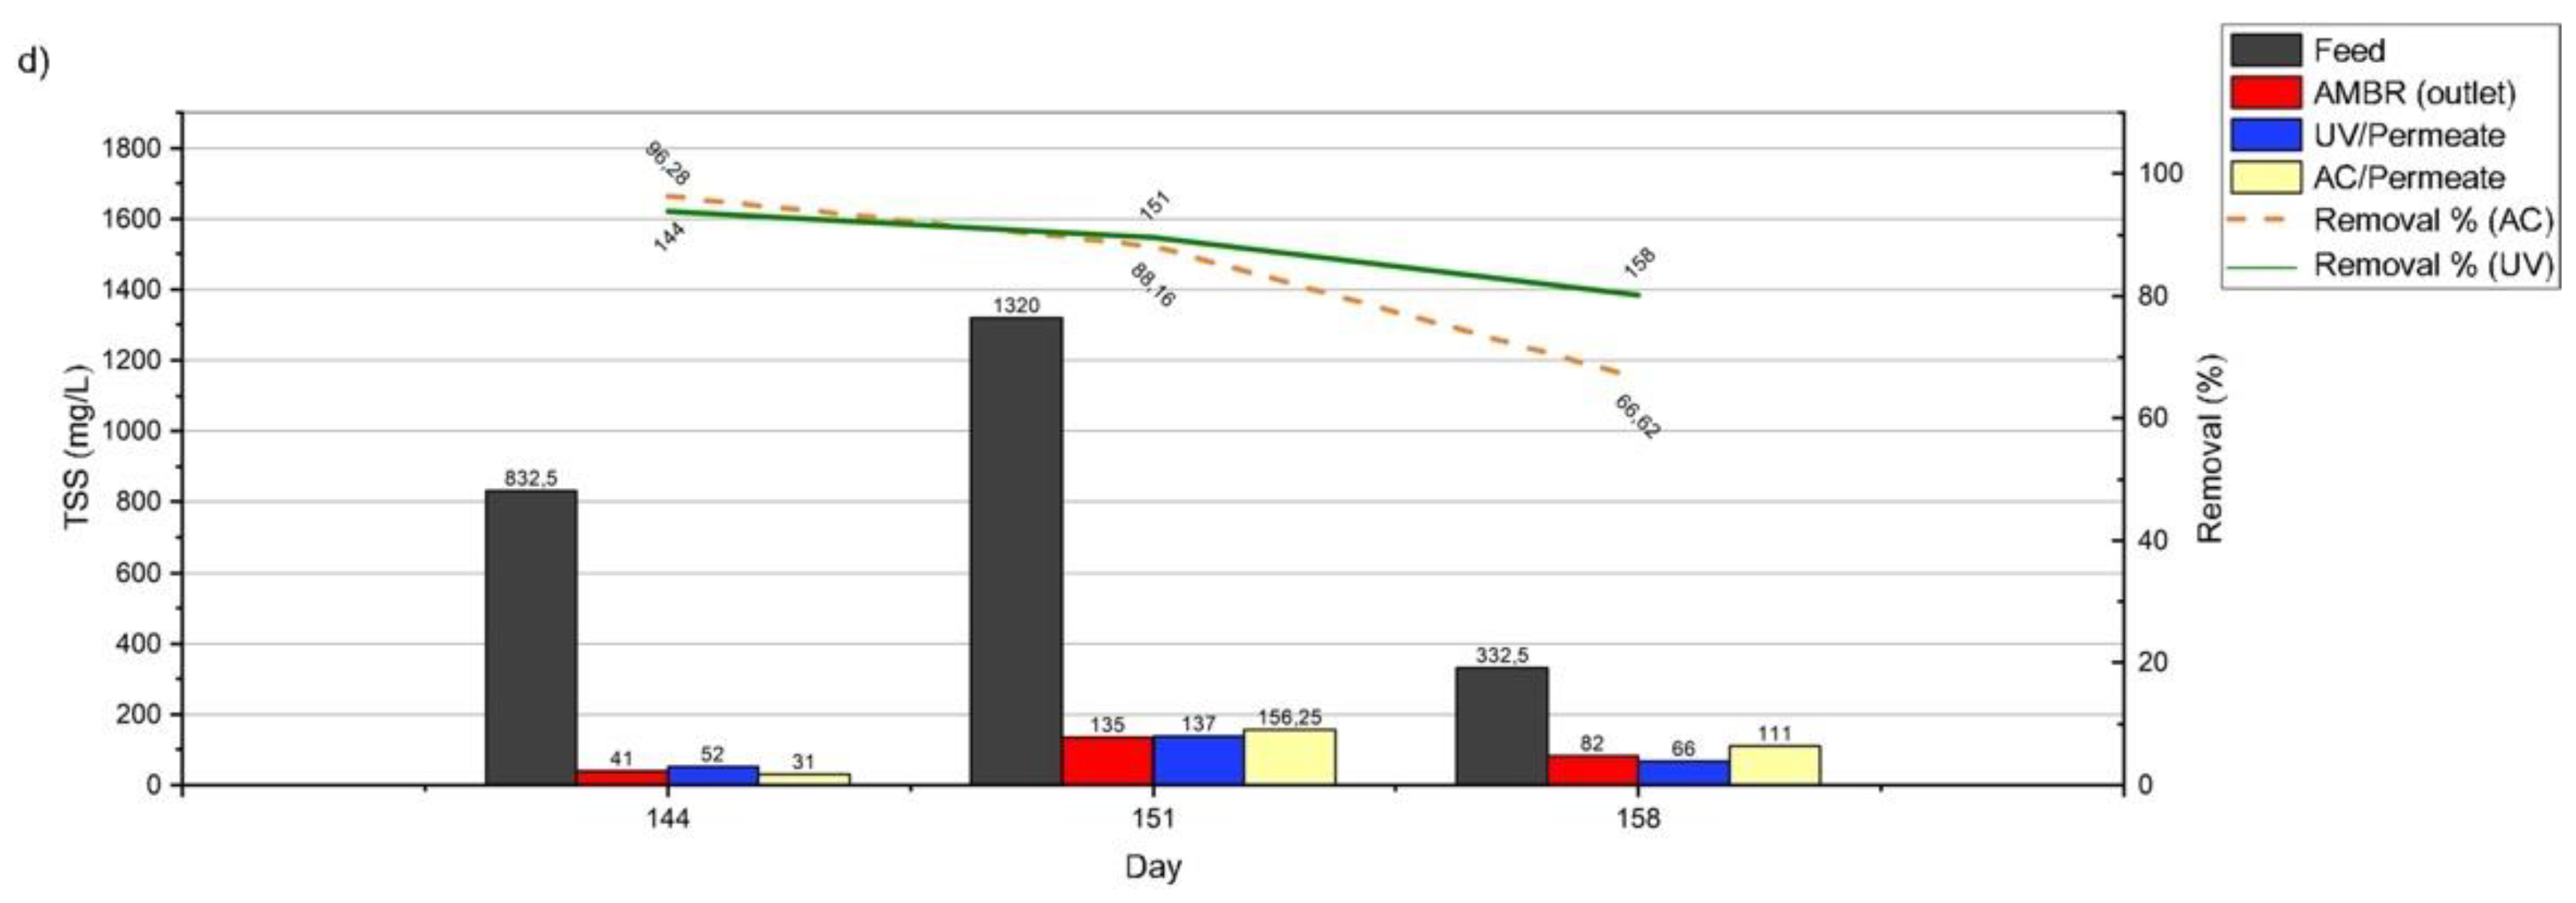
3.3.3. Chemical Oxygen Demand (COD), Total Organic Carbon (TOC), and Total suspended Solids (TSS)

The COD of individual steps of the process is shown in Figure 6a, along with their removal percentages. The average influent COD in phase 1 was estimated to be around 1681 mg/L. According to the textile effluent recipe, it was supposed to be 3000 mg/L; however, the average COD found at feed was just 307 mg/L. It can be observed in Figure 5 that a high COD removal of 93% was maintained throughout the period of operation of eMBR. The average COD removals in phases 2, 3, 4, and 5 were found to be 99%, 95%, 100%, and 87%, respectively. It can be identified that most COD removal occurred in the biological reactors, and UV and GAC had low or no capacity to remove COD. As presented by previous data, the tendency to lose system efficiency in the last phase was also confirmed, where the average COD removal of phases 2, 3, and 4 was 98%, and phase 5 declined to 87%. Similar studies that worked with an anaerobic, anoxic MBR (A2O MBR) system treating TSWW [56] and carwash wastewater [57] had COD removals of 85% and 99.8%, respectively.
When using the COD data available on days 145, 150, and 158, it can be seen that around 51.1% COD removal occurred in the ANX1 tank as it received the feed first, and therefore was able to utilize half of the available COD. ANX2 and AMBR had average removal of 7.7% and 15% of feed COD, respectively. On some of those days, they had negative removal. The activated carbon column removed on average 13.5% of the feed COD. Thus, the system had an average COD removal of 87.4% during phase 5.
The food (F) to microorganism (M) ratio computed using available COD in the influent can be an indicator of the availability of the food for microbial consumption. The F/M ratios in phases 3, 4, and 5 were very low, in the order of 0.01 kg MLSS/day, where the MLSS is considered as the summation of MLSS in all three reactors. However, the ANX1 had an F/M ratio of 0.02 to 0.03 kg MLSS/day in those phases. Even under such a low F/M ratio, the system could perform well, showing the resilience of the system.
TOC is the amount of organic carbon found in the compound and is often used as a non-specific water quality indicator. Additionally, elevated TOC concentrations in drinking water supply systems can lead to increased problems with microbial growth and biofouling [58]. The eMBR system presents a high TOC removal capacity, and in all experiments during phases 3, 4, and 5, the average removals detected were 97%, 99.7%, and 92%, respectively. The overall removal average was 95% during the entire experimental period. Figure 6b presents the amount of TOC in mg/L in each step of the process throughout the experimental period.
On day 155, around 73.4% TOC removal occurred in the ANX1 tank. ANX2 and AMBR had average removals of 3.2% and 15.9% of feed TOC, respectively. The activated carbon column removed 2.3% of the feed TOC. Thus, the system had a TOC removal of 94.9% on that day. The COD to TOC ratio increased from 0.25 in the feed to 1.1 in the effluent from the activated carbon column, indicating that the degradable carbon was utilized in the system.
Total suspended solids (TSS) are a portion of total solids retained on a filter of 2 μm or smaller nominal pore size after keeping them in an oven at a constant temperature of 105 °C [49]. During TSS analyses, some issues in the system setup were able to be identified. As shown in Figure 6c, the results on days 3, 44, 59, and 72 removed 100% of TSS, as expected, because the membrane was present in the treatment process. However, the day 96 analysis showed 171 mg/L of SS, caused due to high TMP that had damaged the membrane borders and allowed some particles to pass through. After membrane replacement, another TSS analysis was performed, which resulted in 100% of TSS removal. Meanwhile, readings at days 144, 151, and 158 found more TSS variation (Figure 6d) due to some physical and other problems in the system setup. The first issue was the bad GAC column seal, which also caused interference in turbidity results. The second issue was the new membrane module that had been changed, which had some minor leaking. Figure 6d presents the results for the last three TSS analyses and their effect on TSS removal. These issues are good examples showing that each problem must be investigated individually, which could help to troubleshoot the problems of the system. It is not always the case that bad results represent the inefficiency of the system. One of the aims of this paper is to discuss practical issues that can arise in a laboratory-scale eMBR and how they could be alleviated by carefully observing the system.
Table 6. Results obtained from previous studies.
MBR Configuration Types of WastewaterRemoval EfficienciesMembrane SpecificationReferences
Membrane bioreactor
(dsMBR) incorporating two ultrafiltration (UF) side-stream membrane modules
Dyehouse wastewater of a textile companyCOD: 75%
Turbidity: 94%
Color: 28.6%
TSS: 70.6–100% TOC: 2.5–91.5%
Norit X-flow Airlift™
UF-membrane/109 tubular UF-membranes
with a diameter of 5 mm and surface area of 0.046 m2
[54]
Submerged membrane bioreactor integrated with ozonation and photocatalysisReal textile wastewaterCOD: 93%
Turbidity: 99.9%
Color: 94%
TSS: 99.9%
TOC: 80%
PVDF hollow fiber membrane
with 0.6 m2 surface area and pore size of 0.1 μm
[38]
Sequential anaerobic–aerobic
(MBSBBR and SBR)
Synthetic textile dyeing wastewater containing three commercial reactive azo dyes was considered.COD: 77.1% ± 7.9%
Color: 79.9% ± 1.5%
Flat-sheet microfiltration chlorinated polyethylene membrane (KUBOTA,
Japan) with 0.4 μm pore size and surface area of 0.1 m2
[59]
Submerged membrane bioreactor (SMBR)Synthetic textile dye wastewater COD: 90%
Color: 20–70%
Membrane: UF, membrane material: PES, pore
size: 0.050 μm, dimensions: 25 × 25 cm
[60]
Sequential anaerobic moving
bed bioreactor and aerobic membrane bioreactor (AnMBBR and AeMBR).
Real textile wastewater from Dye Textile IndustryCOD: 54.8–64.42%
Color: 20–70%
Flat-sheet membranes, polyethersulfone (PES), total surface area and pore size
of 0.0196 m2 and 0.45 μm
[61]
Aerobic membrane bioreactor (MBR)Synthetic textile Reactive Dye wastewater of cotton and cellulose fibersCOD: 76–94%
Turbidity: 100%
Color: 66–98%
External tubular crossflow microfiltration (MF), alumina/alumina, 30 cm, 0.2 μm, 7.53 × 10⁻³ m2, internal/external diameter 8/10 mm[62]
Aerobic membrane bioreactor (MBR-NF)Real textile wastewater from Dye Textile IndustryTurbidity: 62–72%
Color: 93–94%
Flat-sheet UF membrane[63]
Bioaugmented membrane bioreactor (MBR) with a
GAC-packed zone
Synthetic textile dye wastewaterColor: 70–100%
TOC: 96%
A 4.5 cm compact bundle (packing density=56%) of microporous
(0.4 mm) hydrophilic-treated, polyethylene hollow fibers,
obtained from Mitsubishi Rayon, Japan
[64]
Combined moving bed biofilm reactors
and a membrane filtration system (MBBRs, anaerobic–aerobic in series, and MF)
Azo dye Reactive Brilliant Red X-3B-containing synthetic wastewaterCOD: 85%
Color: 90%
TSS: 94%
Hollow fiber
PVDF, pore size of 0.02 μm, housing of 1880 mm-long, and a diameter of 220 mm
[50]
Aerobic reactor Decolorization of Reactive Red 11 and 152 azo dyesColor: 100%-[51]
Anaerobic–aerobic, one and two-stage processes for the biological
treatment
Synthetic wastewaters containing Reactive Black 5 (RB5)COD: 81–90%
Color: 73–92%
TOC: partial mineralization of the RB5
-[52]

3.3.4. Scanning Electron Microscopy (SEM) and Energy Dispersive Spectroscopy (EDS) for Membrane Analysis

SEM images are presented in Figure 7. In Figure 7a, a new PVDF membrane with high porosity compared to the same membrane could be observed after some time being used in the AMBR filtering TSWW, where the pores were blocked by a gel layer densely compacted onto the membrane surface. Additionally, it is possible to see that the fouling layer had cracked while drying the sampling. Figure 7b,c show the membrane surface through the cracks. Figure 8 exemplifies the morphology difference between a membrane used to treat TSWW (A) and GSWW (B), wherein Figure 8a presents valleys and roughness characteristics of the used membrane. On the other hand, there is a clear physical difference in relation to Figure 8b, since it shows the compaction aspect, and flat and dense fouling over its surface. The surface blockage or clogging phenomenon is always attributed to the type of membrane, biomass in the reactor, and operating conditions [65]. In our experiments, all those factors were together responsible for this intense fouling at high HRT and TMP, the absence of correct backwashing and relaxation time, pH oscillation, and TSWW composition (especially due to elevated concentration of salts). Salinity is an essential factor which affects not only the proliferation of salt-tolerant microbes but also the surface charge of particles in the culture media, hydrophobicity, flocculation, and sedimentation [66]. EPS from microbial cells is responsible for the release of SMP (soluble microbial products), which attach to the inner membrane pore surfaces and block the membrane pores [30], and the drastic increase in TMP during the long-term operation that will lead to the occurrence of fouling [65].
The EDS elemental analysis shown in Table 7 indicates the apparent prevalence of element F in the new membrane’s composition. Additionally, the elemental composition of the fouled membranes was N, O, F, K, Cl, Na, Si, Al, and Fe, indicating the prevalence of fouling.

3.3.5. Summary and Evaluation of the Results Achieved during the Study

The results presented in Table 8 represent the average treated water quality achieved during the last phase of the experimental study. Removal of TSS was considered 100% because it was possible to assure the capability of the system to remove all suspended solids. Removal of total phosphorus (TP) was achieved during phases 3 and 4, and the reason to present that result is to show the capability of the system in removing TP even under unstable operating conditions. In general, among all 15 parameters shown in Table 8, treatment of synthetic textile wastewater with eMBR produced good or excellent results in 12 of those parameters.
The results presented in Table 9 allow for checking the compliance of results achieved during the experiments against the industrial, governmental, and international standards to verify the effectiveness and applicability of eMBR in treating textile wastewater. Table 9 compares the wastewater discharge requirements from principal countries with textile products, leading brands, internal regulations for brands, and countries’ and private standards as benchmarks. The percentage of compliance shown in the table does not contain the complete requirement of respective standards but contains only the parameters analyzed in this study.

4. Conclusions

The eMBR used in this research consisting of two anoxic (ANX) biological reactors, one aerobic membrane bioreactor (AMBR), ultraviolet light disinfection (UV), and an activated carbon (AC) filter, presented a high potential for treating effluent from textile industries for the purpose of reuse. The eMBR produced treated effluent which met the international regulations required for reuse in the textile industry. After 158 days of experiments with a laboratory-scale eMBR, excellent removal had been registered for most of the water quality parameters. The removal percentages of TSS, COD, NH3-N, TN, TP, TOC, true color, and turbidity achieved by the eMBR used in this study were 100%, 81.8%, 94.0%, 73.1%, 42.0%, 92.3%, 99.6%, and 99.3%, respectively. Lower C:N:P ratios (3.25:2.49:1) required higher HRT (19.12 day) to treat the high-strength textile wastewater, which had TSS, TDS, COD, NH3-N, TN, TP, TOC, true color, and turbidity of 828.3, 4393, 296, 167, 227, 92.3, 1108 mg/L, 1252 Pt-Co unit, and 132 NTU, respectively. Thus, the flux yielded by the membrane placed in the aerobic reactor was 2.26 L/m2h when it was operated in a continuous mode under suction by vacuum. The membrane needed physical cleaning daily and chemical cleaning weekly; nonetheless, a dense fouling of organic matter formed over the membrane surface, showing that the chosen cleaning system needs to be improved. Further, the high level of salinity in the effluent indicates the importance of culturing appropriate bacterial consortia in all three reactors. Despite the good results, it was possible to detect deficiencies and opportunities for improvement of the system to ensure more stable and flexible processes to cope with the variations in the feed water characteristics, which are common and frequent in the textile industry. The main issues faced during the study were pH control, backwashing setup, and membrane performance. Low membrane performance consequently affected the hydraulic retention time. However, it is possible to affirm that as long as appropriate changes could be made, the eMBR technology has high potential of applicability in treating textile wastewater.

Author Contributions

Conceptualization and methodology, K.R.M.d.S. and V.J.; validation, K.R.M.d.S., R.B. and V.J.; formal analysis, K.R.M.d.S.; investigation, K.R.M.d.S.; resources, V.J.; data curation, K.R.M.d.S. and V.J.; writing—original draft preparation, K.R.M.d.S.; writing—review and editing, K.R.M.d.S.; supervision, R.B. and V.J.; project administration, K.R.M.d.S.; funding acquisition, V.J. All authors have read and agreed to the published version of the manuscript.

Funding

This work was supported by the research agency CNPq, and the first author was supported by RMIT to conduct her experiments through a grant funded by the Department of Economic Development, Jobs, Transport and Resources (DEDJTR), under the Victoria–Parana Collaboration (2018–2019).

Acknowledgments

The authors are thankful to RMIT University for its support.

Conflicts of Interest

The authors declare that they have no known competing financial interests or personal relationships that could have appeared to influence the work reported in this paper.

References

  1. Radhakrishnan, S. Sustainable consumption and production patterns in fashion. In The UN Sustainable Development Goals for the Textile and Fashion Industry; Gardetti, M.A., Muthu, S.S., Eds.; Textile Science and Clothing Technology; Springer: Singapore, 2020. [Google Scholar]
  2. Rather, L.J.; Bhat, A.K.; Mohammad, F.; Jameel, S.; Ganie, S.A.; Dar, O.A. Advances in the Sustainable Technologies for Water Conservation in Textile Industries. In Water in Textiles and Fashion; Elsevier: Amsterdam, The Netherlands, 2019. [Google Scholar]
  3. Bilińska, L.; Gmurek, M.; Ledakowicz, S. Comparison between Industrial and Simulated Textile Wastewater Treatment by AOPs—Biodegradability, Toxicity and Cost Assessment. Chem. Eng. J. 2016, 306, 550–559. [Google Scholar] [CrossRef] [Green Version]
  4. Sarayu, K.; Sandhya, S. Current Technologies for Biological Treatment of Textile Wastewater-A Review. Appl. Biochem. Biotechnol. 2012, 167, 645–661. [Google Scholar] [CrossRef] [PubMed]
  5. Kant, R. Textile Dyeing Industry an Environmental Hazard. Nat. Sci. 2012, 04, 22–26. [Google Scholar] [CrossRef] [Green Version]
  6. GilPavas, E.; Dobrosz-Gómez, I.; Gómez-García, M.Á. Optimization and Toxicity Assessment of a Combined Electrocoagulation, H2O2/Fe2+/UV and Activated Carbon Adsorption for Textile Wastewater Treatment. Sci. Total Environ. 2019, 651, 551–560. [Google Scholar] [CrossRef] [PubMed]
  7. Lellis, B.; Fávaro-Polonio, C.Z.; Pamphile, J.A.; Polonio, J.C. Effects of Textile Dyes on Health and the Environment and Bioremediation Potential of Living Organisms. Biotechnol. Res. Innov. 2019, 3, 275–290. [Google Scholar] [CrossRef]
  8. Takahashi, N.; Kumagai, T.; Shimizu, M.; Suzuki, T.; Ohtsuki, T. Removal of Dissolved Organic Carbon and Color from Dyeing Wastewater by Pre-Ozonation and Subsequent Biological Treatment Using Test-Scale Plant. Ozone Sci. Eng. 2007, 29, 139–145. [Google Scholar] [CrossRef]
  9. Sivaram, N.M.; Barik, D.; Gopal, P.M. Toxic Waste from Textile Industries. In Energy from Toxic Organic Waste for Heat and Power Generation; Barik, D., Ed.; Woodhead Publishing: Sawston, UK, 2018; pp. 43–54. [Google Scholar]
  10. Yaqub, M.; Lee, W. Zero-Liquid Discharge (ZLD) Technology for Resource Recovery from Wastewater: A Review. Sci. Total Environ. 2019, 681, 551–563. [Google Scholar] [CrossRef]
  11. Paździor, K.; Wrębiak, J.; Klepacz-Smółka, A.; Gmurek, M.; Bilińska, L.; Kos, L.; Sójka-Ledakowicz, J.; Ledakowicz, S. Influence of Ozonation and Biodegradation on Toxicity of Industrial Textile Wastewater. J. Environ. Manag. 2017, 195, 166–173. [Google Scholar] [CrossRef]
  12. Naim, M.M.; El Abd, Y.M. Removal and Recovery of Dyestuffs from Dyeing Wastewaters. Sep. Purif. Methods 2002, 31, 171–228. [Google Scholar] [CrossRef]
  13. Shoukat, R.; Khan, S.J.; Jamal, Y. Hybrid Anaerobic-Aerobic Biological Treatment for Real Textile Wastewater. J. Water Process Eng. 2019, 29, 100804. [Google Scholar] [CrossRef]
  14. Verma, A.K.; Dash, R.R.; Bhunia, P. A Review on Chemical Coagulation/Flocculation Technologies for Removal of Colour from Textile Wastewaters. J. Environ. Manag. 2012, 93, 154–168. [Google Scholar] [CrossRef] [PubMed]
  15. Al-Ghouti, M.A.; Khraisheh, M.A.M.; Allen, S.J.; Ahmad, M.N. The Removal of Dyes from Textile Wastewater: A Study of the Physical Characteristics and Adsorption Mechanisms of Diatomaceous Earth. J. Environ. Manag. 2003, 69, 229–238. [Google Scholar] [CrossRef] [PubMed]
  16. Marcucci, M.; Ciardelli, G.; Matteucci, A.; Ranieri, L.; Russo, M. Experimental Campaigns on Textile Wastewater for Reuse by Means of Different Membrane Processes. Desalination 2002, 149, 137–143. [Google Scholar] [CrossRef]
  17. Soares, P.A.; Batalha, M.; Souza, S.M.A.G.U.; Boaventura, R.A.R.; Vilar, V.J.P. Enhancement of a Solar Photo-Fenton Reaction with Ferric-Organic Ligands for the Treatment of Acrylic-Textile Dyeing Wastewater. J. Environ. Manag. 2015, 152, 120–131. [Google Scholar] [CrossRef] [PubMed]
  18. Karthikeyan, S.; Titus, A.; Gnanamani, A.; Mandal, A.B.; Sekaran, G. Treatment of Textile Wastewater by Homogeneous and Heterogeneous Fenton Oxidation Processes. Desalination 2011, 281, 438–445. [Google Scholar] [CrossRef]
  19. Kang, S.-F.; Liao, C.-H.; Po, S.-T. Decolorization of Textile Wastewater by Photo-Fenton Oxidation Technology. Chemosphere 2000, 41, 1287–1294. [Google Scholar] [CrossRef]
  20. Martínez-Huitle, C.A.; dos Santos, E.V.; de Araújo, D.M.; Panizza, M. Applicability of Diamond Electrode/Anode to the Electrochemical Treatment of a Real Textile Effluent. J. Electroanal. Chem. 2012, 674, 103–107. [Google Scholar] [CrossRef] [Green Version]
  21. Wang, J.; Chen, H.; Yuan, R.; Wang, F.; Ma, F.; Zhou, B. Intensified Degradation of Textile Wastewater Using a Novel Treatment of Hydrodynamic Cavitation with the Combination of Ozone. J. Environ. Chem. Eng. 2020, 8, 103959. [Google Scholar] [CrossRef]
  22. Davis, M.L. Water and Wastewater Engineering, Professional Edition: Design Principles and Practice, 1st ed.; McGraw-Hill: New York, NY, USA, 2010; ISBN 0-07-171384-0. [Google Scholar]
  23. Fonseca Couto, C.; Lange, L.C.; Santos Amaral, M.C. A Critical Review on Membrane Separation Processes Applied to Remove Pharmaceutically Active Compounds from Water and Wastewater. J. Water Process Eng. 2018, 26, 156–175. [Google Scholar] [CrossRef]
  24. Chollom, M.N.; Rathilal, S.; Pillay, V.L.; Alfa, D. The Applicability of Nanofiltration for the Treatment and Reuse of Textile Reactive Dye Effluent. Water SA 2015, 41, 398–405. [Google Scholar] [CrossRef] [Green Version]
  25. Lafi, R.; Gzara, L.; Lajimi, R.H.; Hafiane, A. Treatment of Textile Wastewater by a Hybrid Ultrafiltration/Electrodialysis Process. Chem. Eng. Process.—Process Intensif. 2018, 132, 105–113. [Google Scholar] [CrossRef]
  26. Jalilnejad, E.; Sadeghpour, P.; Ghasemzadeh, K. Advances in Membrane Bioreactor Technology; Elsevier Inc.: Amsterdam, The Netherlands, 2019; ISBN 978-0-12816-8-226. [Google Scholar]
  27. Xiao, K.; Xu, Y.; Liang, S.; Lei, T.; Sun, J.; Wen, X.; Zhang, H.; Chen, C.; Huang, X. Engineering Application of Membrane Bioreactor for Wastewater Treatment in China: Current State and Future Prospect. Front. Environ. Sci. Eng. 2014, 8, 805–819. [Google Scholar] [CrossRef]
  28. Meng, F.; Zhang, S.; Oh, Y.; Zhou, Z.; Shin, H.S.; Chae, S.R. Fouling in Membrane Bioreactors: An Updated Review. Water Res. 2017, 114, 151–180. [Google Scholar] [CrossRef] [PubMed]
  29. Krzeminski, P.; Leverette, L.; Malamis, S.; Katsou, E. Membrane Bioreactors—A Review on Recent Developments in Energy Reduction, Fouling Control, Novel Configurations, LCA and Market Prospects. J. Membr. Sci. 2017, 527, 207–227. [Google Scholar] [CrossRef] [Green Version]
  30. Liao, Y.; Bokhary, A.; Maleki, E.; Liao, B. A Review of Membrane Fouling and Its Control in Algal-Related Membrane Processes. Bioresour. Technol. 2018, 264, 343–358. [Google Scholar] [CrossRef]
  31. Jegatheesan, V.; Pramanik, B.K.; Chen, J.; Navaratna, D.; Chang, C.Y.; Shu, L. Treatment of Textile Wastewater with Membrane Bioreactor: A Critical Review. Bioresour. Technol. 2016, 204, 202–212. [Google Scholar] [CrossRef]
  32. Moazzem, S.; Ravishankar, H.; Fan, L.; Roddick, F.; Jegatheesan, V. Application of Enhanced Membrane Bioreactor (EMBR) for the Reuse of Carwash Wastewater. J. Environ. Manag. 2020, 254, 109780. [Google Scholar] [CrossRef]
  33. Baird, R.B.; Eaton, A.D.; Rice, E.W. Standard Methods for the Examination of Water and Wastewater, 23rd ed.; American Public Health Association: Washington, DC, USA, 2017. [Google Scholar]
  34. Metropolitan Water District of Southern California, U.S. Department of the Interior. Salinity Management Study, Final Report; Technical Appendix: Salinity and Total Dissolved Solids; Bookman-Edmonston Engineering, Inc.: Olympia, WA, USA, 1999.
  35. Speight, J.G. The Properties of Water. In Natural Water Remediation; Elsevier: Amsterdam, The Netherlands, 2020; ISBN 978-0-12803-8-109. [Google Scholar]
  36. He, H.; Chen, Y.; Li, X.; Cheng, Y.; Yang, C.; Zeng, G. Influence of Salinity on Microorganisms in Activated Sludge Processes: A Review. Int. Biodeterior. Biodegrad. 2017, 119, 520–527. [Google Scholar] [CrossRef]
  37. Hong, J.; Li, W.; Lin, B.; Zhan, M.; Liu, C.; Chen, B.Y. Deciphering the Effect of Salinity on the Performance of Submerged Membrane Bioreactor for Aquaculture of Bacterial Community. Desalination 2013, 316, 23–30. [Google Scholar] [CrossRef]
  38. Sathya, U.; Keerthi; Nithya, M.; Balasubramanian, N. Evaluation of Advanced Oxidation Processes (AOPs) Integrated Membrane Bioreactor (MBR) for the Real Textile Wastewater Treatment. J. Environ. Manag. 2019, 246, 768–775. [Google Scholar] [CrossRef]
  39. Seneviratne, M. Wastewater Treatment Technologies ZDHC-Roadmap to Zero Programme. Ministry of Environment and Forest, “Guide for Assessment of Effluent Treatment Plant”; Amsterdam, The Netherlands. 2008, p. 119. Available online: https://uploads-ssl.webflow.com/5c4065f2d6b53e08a1b03de7/5db6f50d7a90f4e4a47725cf_Wastewater_Treatment_Technologies_for_the_Textile_Industry-FINAL.pdf (accessed on 17 May 2022).
  40. Patel, H.; Vashi, R.T. Characterization and Treatment of Textile Wastewater; Elsevier: Amsterdam, The Netherlands, 2015. [Google Scholar]
  41. Gerardi, M.H. ORP Management in Wastewater as an Indicator of Process Efficiency. YSI Yellow Springs 2008. Available online: http://www.ysi.com/media/pdfs/A567-ORP-Management-in-Wastewater-as-an-Indicator-of-Process-Efficiency.pdf (accessed on 27 February 2017).
  42. Metcalf & Eddy, Inc.; Tchobanoglous, G.; Stensel, H.D.; Tsuchihashi, R.; Burton, F.L.; Abu-Orf, M.; Bowden, G.; Pfrang, W. Wastewater Engineering Treatment and Resource, 5th ed.; McGraw-Hill: New York, NY, USA, 2014; ISBN 978-0-07340-1-188. [Google Scholar]
  43. Till, B.A.; Weathers, L.J.; Alvarez, P.J.J. Fe(O)-Supported Autotrophic Denitrification. Environ. Sci. Technol. 1998, 32, 634–639. [Google Scholar] [CrossRef]
  44. Ghafari, S.; Hasan, M.; Aroua, M.K. Effect of Carbon Dioxide and Bicarbonate as Inorganic Carbon Sources on Growth and Adaptation of Autohydrogenotrophic Denitrifying Bacteria. J. Hazard. Mater. 2009, 162, 1507–1513. [Google Scholar] [CrossRef] [PubMed]
  45. Palmer, M.; Hatley, H. The Role of Surfactants in Wastewater Treatment: Impact, Removal and Future Techniques: A Critical Review. Water Res. 2018, 147, 60–72. [Google Scholar] [CrossRef] [PubMed]
  46. Grady, C.P.L., Jr.; Love, N.G.; Filipe, C.D.M.; Daigger, G.T. Biological Wastewater Treatment; CRC Press: Boca Raton, FL, USA, 2011. [Google Scholar]
  47. Metcalf & Eddy, Inc.; Tchobanoglous, G.; Stensel, H.D.; Burton, F.L. Wastewater Engineering: Treatment and Reuse, 4th ed.; McGraw-Hill: New York, NY, USA, 2003; Volume 4, ISBN 0071122508. [Google Scholar]
  48. Uygur, A.; Kargi, F. Salt Inhibition on Biological Nutrient Removal from Saline Wastewater in a Sequencing Batch Reactor. Enzyme Microbial Technol. 2004, 34, 313–318. [Google Scholar] [CrossRef]
  49. Seneviratne, M. Wastewater Treatment Technologies, 1st ed.; ZDHC: Amsterdam, The Netherlands, 2018. [Google Scholar]
  50. Dong, B.; Chen, H.; Yang, Y.; He, Q.; Dai, X. Treatment of Printing and Dyeing Wastewater Using MBBR Followed by Membrane Separation Process. Desalination Water Treat. 2014, 52, 4562–4567. [Google Scholar] [CrossRef]
  51. Kodam, K.M.; Kodam, K.M.; Gawai, K.R. Decolorisation of Reactive Red 11 and 152 Azo Dyes under Aerobic Conditions; CSIR: New Delhi, India, 2006; Volume 5. [Google Scholar]
  52. Bonakdarpour, B.; Vyrides, I.; Stuckey, D.C. Comparison of the Performance of One Stage and Two Stage Sequential Anaerobic-Aerobic Biological Processes for the Treatment of Reactive-Azo-Dye-Containing Synthetic Wastewaters. Int. Biodeterior. Biodegrad. 2011, 65, 591–599. [Google Scholar] [CrossRef]
  53. Sari Erkan, H.; Çağlak, A.; Soysaloglu, A.; Takatas, B.; Onkal Engin, G. Performance Evaluation of Conventional Membrane Bioreactor and Moving Bed Membrane Bioreactor for Synthetic Textile Wastewater Treatment. J. Water Process Eng. 2020, 38, 101631. [Google Scholar] [CrossRef]
  54. de Jager, D.; Sheldon, M.S.; Edwards, W. Colour Removal from Textile Wastewater Using a Pilot-Scale Dual-Stage MBR and Subsequent RO System. Sep. Purif. Technol. 2014, 135, 135–144. [Google Scholar] [CrossRef]
  55. Yao, M.; Nan, J.; Chen, T. Effect of Particle Size Distribution on Turbidity under Various Water Quality Levels during Flocculation Processes. Desalination 2014, 354, 116–124. [Google Scholar] [CrossRef]
  56. Sun, F.; Sun, B.; Hu, J.; He, Y.; Wu, W. Organics and Nitrogen Removal from Textile Auxiliaries Wastewater with A2O-MBR in a Pilot-Scale. J. Hazard. Mater. 2015, 286, 416–424. [Google Scholar] [CrossRef] [PubMed]
  57. Moazzem, S. Application of Ceramic Ultrafiltration/Reverse Osmosis Membranes and Enhanced Membrane Bioreactor for the Reuse of Car Wash Wastewater. Master’s Thesis, RMIT University, Melbourne, VIC, Australia, 2017. [Google Scholar]
  58. Hashempour, Y.; Nasseri, M.; Mohseni-Bandpei, A.; Motesaddi, S.; Eslamizadeh, M. Assessing vulnerability to climate change for total organic carbon in a system of drinking water supply. Sustain. Cities Soc. 2020, 53, 101904. [Google Scholar] [CrossRef]
  59. Azimi, B.; Abdollahzadeh-Sharghi, E.; Bonakdarpour, B. Anaerobic-Aerobic Processes for the Treatment of Textile Dyeing Wastewater Containing Three Commercial Reactive Azo Dyes: Effect of Number of Stages and Bioreactor Type. Chin. J. Chem. Eng. 2021, 39, 228–239. [Google Scholar] [CrossRef]
  60. Deowan, S.A.; Galiano, F.; Hoinkis, J.; Figoli, A.; Drioli, E. Submerged Membrane Bioreactor (SMBR) for Treatment of Textile Dye Wastewatertowards Developing Novel MBR Process. APCBEE Procedia 2013, 5, 259–264. [Google Scholar] [CrossRef] [Green Version]
  61. Kozak, M.; Cırık, K.; Dolaz, M.; Başak, S. Evaluation of Textile Wastewater Treatment in Sequential Anaerobic Moving Bed Bioreactor—Aerobic Membrane Bioreactor. Process Biochem. 2021, 105, 62–71. [Google Scholar] [CrossRef]
  62. Khouni, I.; Louhichi, G.; Ghrabi, A. Assessing the Performances of an Aerobic Membrane Bioreactor for Textile Wastewater Treatment: Influence of Dye Mass Loading Rate and Biomass Concentration. Process Saf. Environ. Prot. 2020, 135, 364–382. [Google Scholar] [CrossRef]
  63. Li, K.; Liu, Q.; Fang, F.; Wu, X.; Xin, J.; Sun, S.; Wei, Y.; Ruan, R.; Chen, P.; Wang, Y.; et al. Influence of Nanofiltration Concentrate Recirculation on Performance and Economic Feasibility of a Pilot-Scale Membrane Bioreactor-Nanofiltration Hybrid Process for Textile Wastewater Treatment with High Water Recovery. J. Clean. Prod. 2020, 261, 121067. [Google Scholar] [CrossRef]
  64. Hai, F.I.; Yamamoto, K.; Nakajima, F.; Fukushi, K. Bioaugmented Membrane Bioreactor (MBR) with a GAC-Packed Zone for High Rate Textile Wastewater Treatment. Water Res. 2011, 45, 2199–2206. [Google Scholar] [CrossRef] [Green Version]
  65. Musa, M.A.; Idrus, S.; Man, H.C.; Daud, N.N.N. Wastewater Treatment and Biogas Recovery Using Anaerobic Membrane Bioreactors (AnMBRs): Strategies and Achievements. Energies 2018, 11, 1675. [Google Scholar] [CrossRef] [Green Version]
  66. Tan, X.; Acquah, I.; Liu, H.; Li, W.; Tan, S. A Critical Review on Saline Wastewater Treatment by Membrane Bioreactor (MBR) from a Microbial Perspective. Chemosphere 2019, 220, 1150–1162. [Google Scholar] [CrossRef]
Figure 1. Experimental setup: (a) schematic, (b) laboratory setup, and (c) frontal and side views of membrane in the aerobic tank.
Water 14 01708 g001aWater 14 01708 g001b
Figure 2. Monitoring of temporal variations of different water quality parameters during the entire experimental duration. (a) electrical conductivity, (b) total dissolved solids, (c) temperature variation, (d) dissolved oxygen, (e) oxidation-reduction potential, (f) hydrogen potential (pH).
Water 14 01708 g002aWater 14 01708 g002b
Figure 3. Temporal variation of flux and transmembrane pressure (TMP).
Water 14 01708 g003
Figure 4. (a) Removal and average of the color in the feed and at the outlet of AMBR, UV, and AC during the experimental period, and (b) demonstration of color removal by eMBR.
Water 14 01708 g004
Figure 5. Removal and average of turbidity of feed and permeate during the experiment.
Water 14 01708 g005
Figure 6. Removal of (a) COD, (b) TOC, and (c) TSS in the feed, ANX reactors, and outlet of AMBR, UV, and AC during the experiment. (d) Removal and average of TSS of feed, and in the outlet of AMBR, UV, and AC after day 144.
Water 14 01708 g006aWater 14 01708 g006b
Figure 7. Scanning electron microscopy (SEM) of images of PVDF flat-sheet membrane. (a) Pristine membrane (5000×), (b) membrane used in TSWW treatment (5000×), (c) membrane used in TSWW treatment (50×), and (d) membrane used in TSWW treatment (3000× of magnitude).
Water 14 01708 g007
Figure 8. SEM images at 5000× of PVDF flat-sheet membrane used for the treatment of (a) TSWW and (b) GSWW.
Water 14 01708 g008
Table 1. Composition of synthetic textile wastewater used in eMBR experiments [13].
SubstanceConcentration (mg/L)
Glucose3000
Ammonium chloride1146
Monopotassium phosphate143.10
Calcium chloride29.19
Magnesium sulfate heptahydrate9.73
Iron (III) chloride1.00
Sodium bicarbonate500
Cobalt (II) chloride0.1
Zinc chloride0.1
Reactive Black 05 (RB05)7.5
Reactive Blue 222 (RB222)7.5
Table 2. Description of analytical methods applied during the experiments.
AnalysisEquipment/StandardLocation of Sample Collection
Chemical oxygen demand (COD)DR5000 Spectrophotometer (HACH Company, Loveland, CO, USA) + HACH test kits/DR5000 Spectrophotometer—Procedures from the ManualOutlet of all tanks/UV chamber/GAC column
Total phosphorus (TP)
Total nitrogen (TN)
Ammonia
NitrateThermo Scientific Dionex Aquion Ion Chromatography System (Thermo Scientific, Waltham, MA, United States)Outlet of all tanks/UV chamber/GAC column
Nitrite
ColorDR5000 Spectrophotometer (HACH Company, Loveland, CO, USA)/Method 8025—True ColorFeed: at the inlet
MBR/UV/GAC: at the outlet
Dissolved oxygen (DO)HQ40D Portable Multi + Probes LDO101; CDC401; MTC101; PHC201/HQ40D + Probes Manuals (HACH Company, Loveland, CO, USA)Inlet of feed/ANX/MBR/permeate
Electrical conductivity (EC)
Oxide reduction potential (ORP)
pH
Temperature (T)
Heavy MetalsAtomic Absorption spectroscopy—VARIAN AA240 FS (Varian -previous, now it is part of Agilent-, Palo Alto, CA, USA)Outlet of all tanks/UV chamber/GAC column
Mixed liquor suspended solids (MLSS)[33]—2540 D. Total Suspended Solids Dried at 103–105 °CInlet of ANX/MBR
Mixed liquor volatile suspended solids (MLVSS)[30,32]—2540 D. Total Suspended Solids Dried at 103–105 °CInlet of ANX/MBR
Total Organic Carbon (TOC)TOC-L Shimadzu
Analyzer (Shimadzu, Kyoto, Japan)
Outlet of all tanks/UV chamber/GAC column
Total Suspended Solids (TSS)[30]—2540 D. Total Suspended Solids Dried at 103–105 °CFeed: at the inlet
MBR/UV/AC: at the outlet
TurbidityHach (2100N) turbidimeter/ [30]—2130 TURBITY (HACH Company, Loveland, CO, USA)Feed: at the inlet
MBR/UV/AC: at the outlet
SEM analysis of membraneScanning Electron Microscopy—Quanta 200 (FEI, Hillsboro, OR, USA)New and used membrane
SEM analysis of activated carbonScanning Electron Microscopy—Quanta 200 (FEI, Hillsboro, OR, USA)New and used AC
Table 3. Operational phases and variation in system parameters during the experiment.
ParametersGSWW 100%GSWW 75% + TSWW 25%GSWW 50% + TSWW 50%GSWW 25% + TSWW 75%TSWW 100%
Stage 1Stage 2Stage 3
Phase 1Phase 2Phase 3Phase 4Phase 5
Period of operation (day)
(number of days)
1–22
(23)
23–31
(7)
32–72
(40)
73–101
(28)
102–158
(56)
Average of system flow rate (L/day)-1.060.560.871.06
Flux (L/m2h)-2.251.191.852.26
Hydraulic retention time, HRT (day)-19.8537.4124.1819.12
Return activated sludge, RAS (L/day)--3.052.981.76
Influent C:N:P ratio-1681:N:P3.66:N:13.16:2.15:13.25:2.49:1
Table 4. Average feed characteristics during each process phase.
ParameterUnitPhase 1Phase 2 Phase 3 Phase 4 Phase 5
DOmg/L2.742.760.532.742.98
ECµS/cm329.7169.2238834904383
ORP mV62.7186.548.3−71.4−139.9
pH-6.675.475.056.367.63
T °C23.733.342.13730.6
TSSmg/L757.5-398.3631828.3
TDSmg/L311106165031214393
CODmg/L-1681333313296
NH3-Nmg/L-61155215167
TNmg/L---275227
TPmg/L--9799.492.3
TOCmg/L--62527471108
True ColorPt-Co----1252
TurbidityNTU-23224370132
Zinc mg/L--0.0450.0060.92
Iron mg/L--0.13-0.55
DO—dissolved oxygen; EC—electrical conductivity; ORP—oxidation reduction potential, T—temperature; TSS—total suspended solids; TDS—total dissolved solids; COD—chemical oxygen demand; TN—total nitrogen; TP—total phosphorus; TOC—total organic carbon.
Table 5. Average of MLSS and MLVSS of ANX and AMBR reactors during each phase.
TankPhase 1Phase 2Phase 3Phase 4Phase 5
MLSSMVLSSMLSSMVLSSMLSSMVLSSMLSSMVLSSMLSSMVLSS
ANX1610---1143-2257163318011389
ANX2775---833-1750117321531386
AMBR963---473-1847128713941026
Table 7. EDS elemental composition of the new membrane in comparison with the membrane used to filter textile synthetic wastewater (TSWW).
Elementwt.%
New MembraneMembrane Used to Filter TSWW
N-17.36
O4.1746.50
F94.481.24
Na-3.32
Mg-0.29
Al-1.46
Si-3.30
P-8.36
S0.403.59
Cl-2.26
K-6.44
Ca-1.61
Fe-1.05
Cu0.950.58
Zn-0.31
Ir *-2.34
Total: 100.00100.00
* Iridium was used to coat the samples.
Table 8. Summary of final treated water quality using enhanced membrane bioreactor.
ParameterUnitPermeate in Phase 5 Evaluation
DOmg/L7.04S
EC µS/cm3731NS
ORP mV67S
pH-7.98S
T °C21.1S
TSSmg/L0100.0%
TDSmg/L23880%
CODmg/L5481.8%
NH3-Nmg/L1094.0%
TNmg/L6173.1%
TPmg/L26442% *
TOCmg/L8592.3%
True ColorPt-Co599.6%
TurbidityNTU0.9699.3%
Znmg/L0.00299.8%
S: Satisfactory, NS: Not Satisfactory. * Average in phases 3 and 4.
Table 9. Compliance verification of experimental results with international requirements.
ParameterUnitPermeate
Phase 5
OEKO-TEX®®Levi StraussNIKEAdidasC&AChinaIndiaBrazilUSAReuse
pH-7.986–86–96–96–96–96–95.5–95–95.5–116.5–8.5
T °C21.125–4037N/AN/A37N/Avariation >5 °C<4060N/A
TSSmg/L015–1003030503020–1001000N/A30
TDSmg/L2388N/AN/AN/AN/AN/AN/AN/AN/AN/AN/A
CODmg/L5430–200N/A20012520060–200N/AN/AN/A60
NH3-Nmg/L102.5–10N/AN/AN/AN/A8–20N/A20N/A10
TNmg/L61N/AN/AN/A10N/A15–30N/AN/AN/Anone
TPmg/L2640.5–5N/AN/A2N/A0.5–1.5N/AN/AN/A1
TOCmg/L85N/AN/AN/AN/AN/AN/AN/AN/AN/AN/A
True ColorPt-Co5N/AN/A150N/A15030–80400 N/AN/A30
TurbidityNTU0.96N/AN/AN/AN/AN/AN/AN/AN/AN/A5
Znmg/L0.0020.3–51N/A112–55525N/A
Femg/L0.87N/AN/AN/AN/AN/AN/AN/A15N/A none
% of Compliance *71100100671007510010010067
N/A: Not available. * Compliance related only to parameters in the table. Green background: experimental result is in compliance with respective law/standard/regulation. Red background: experimental result is not in compliance with respective law/standard/regulation.
Publisher’s Note: MDPI stays neutral with regard to jurisdictional claims in published maps and institutional affiliations.

