Article

Automated versus Manual Mapping of Gravel Pit Lakes from South-Eastern Romania for Detailed Morphometry and Vegetation

by
Petre Bretcan
1,
Daniel Dunea
2,
Gabriel Vintescu
1,
Danut Tanislav
1,
Martina Zelenakova
3,
Laurențiu Predescu
4,*,
Gheorghe Șerban
5,*,
Dariusz Borowiak
6,
Ioan Rus
5,*,
Daniel Andrei Sabău
5,
Oana Mititelu-Ionuș
7,
Maria Hueci
1,
Alexandru Moreanu
1,
Eduardt Samoila
8,
Huu Duy Nguyen
9,
Loredana Neagu Frasin
2,
Ioana-Alexandra Mirea
10 and
Răzvan-Cristian Muntean
10
1
Department of Geography, Faculty of Humanities, Valahia University of Targoviste, 130105 Targoviste, Romania
2
Department of Environmental Engineering, Faculty of Environmental Engineering and Food Science, Valahia University of Targoviste, Aleea Sinaia No. 13, 130004 Targoviste, Romania
3
Environmental Engineering Department, Faculty of Civil Engineering, Technical University of Kosice, Vysokoškolská 4, 042 00 Kosice, Slovakia
4
Department of Food Engineering, Faculty of Environmental Engineering and Food Science, Valahia University of Targoviste, Aleea Sinaia No. 13, 130004 Targoviste, Romania
5
Faculty of Geography, Babes-Bolyai University, 400084 Cluj-Napoca, Romania
6
Department of Limnology, Institute of Geography, University of Gdansk, Bażyńskiego 4, 80-309 Gdansk, Poland
7
Department of Geography, Faculty of Sciences, University of Craiova, 13 A.I. Cuza St., 200585 Craiova, Romania
8
Department of Geography, Faculty of Social Science Humanities and Nature, Hyperion University, Blvd. Calarasi, no.169, 030615 Bucharest, Romania
9
Faculty of Geography, VNU Vietnam National University, Hanoi 100000, Vietnam
10
Faculty of Geography, University of Bucharest, Bd. Nicolae Balescu 1, 010041 Bucharest, Romania
*
Authors to whom correspondence should be addressed.
Water 2022, 14(12), 1858; https://doi.org/10.3390/w14121858
Submission received: 6 April 2022 / Revised: 29 May 2022 / Accepted: 6 June 2022 / Published: 9 June 2022
(This article belongs to the Section Hydrology)

Abstract

:
In recent years, the accelerated development of the remote sensing domain and the improvement of the resolution and frequency of satellite images allowed the increase in the accuracy of the evaluation of morphometric characteristics and the spatiotemporal distribution of pit lakes, including the small ones. Our study quantitatively analyzes small-scale pit lakes in the piedmont and subsidence plains from contact with the Getic and Curvature Subcarpathians from Romania using the normalized difference water index (NDWI) and data series, with different resolutions, from Landsat 8, Google Earth, and Sentinel 2A. The problems encountered in extracting the contours of the gravel pit lakes were determined by the different resolution of the images, the uneven quality of the images exported from Google Earth, and an additional challenge was given by the diversity of the analyzed land surfaces, the land use, and the optical properties of the lakes. A comparison of the obtained NDWI values using data series from Sentinel 2A and Landsat 8 highlighted the importance of resolution and also showed a larger spectral difference between the identified water bodies and the surrounding land in favor of Sentinel 2A. Regarding the vegetation-derived indices, superior leaf area index (1.8–3) was recorded in low-lying plains and mixed areas (tall shrubs, wetlands, etc.) because the river banks have increased moisture that supports taller species with denser foliage and the sparsely vegetated areas are located in agricultural crops and in/near villages. Changes in vegetation richness and abundance can be spatiotemporally monitored using indices derived from the spectral bands of satellite imagery.

1. Introduction

In recent decades, the growing demand for mineral resources has led to the opening of new quarries or increased existing ones, worldwide, with a direct impact on land use, natural habitat degradation [1]; numerous air pollutant emissions; and negative impacts on inland waters, soil, etc. Monitoring the spatiotemporal impact of these exploitations is absolutely necessary [2,3] and involves field monitoring [4,5], time, and numerous human and financial resources [6]. When the groundwater is intercepted or the gravel and sand exploitation is ceased/abandoned, many of the negative forms of relief/excavation resulting from the exploitation of mineral resources are filled with water and will gradually turn into lakes and wetlands.
Whether we are talking about lakes resulting from the exploitation of coal [7], salt [8,9], various metals [10], or ballast [11], their formation involves both negative aspects (contamination of groundwater with metals, pesticides, and fertilizers by draining meteoric waters; increasing soil erosion due to torrentiality; increasing the loss of freshwater by evaporation) [12,13,14] and positive aspects (emergence of new habitats, increasing biodiversity, reducing the concentration of nitrates in groundwater, development of recreational areas: fishing, boating/water sports) [15,16,17,18]. At the same time, the increase in air humidity due to evaporation losses supports the development of these new habitats, reduces aridity, and diminishes the effects of heat waves. Overall, numerous studies showed that an integrated approach to the benefits of these ecosystems can be quantified in money, and the values obtained are positive and significant [19,20].
In Romania, most studies evaluate lakes located in former salt mines [21,22], and a small number of works are dedicated to lakes located in former coal mines, kaolin [23], gold [24], or ballast extraction sites [25]. Thus, this is the first study that evaluates the spatial distribution and morphometric characteristics of the gravel pit lakes located in the piedmont and subsidence plains in Romania (the contact area between the Romanian Plain and the Curvature and Getic Subcarpathians).
Knowing the morphometric characteristics of lakes (surface, depth, shoreline development, wind exposure) [26] allows understanding the mechanisms that influence thermal stratification, mixing type [27], biochemical cycles, biological productivity [28,29,30], and aspects regarding greenhouse gas emissions [31,32,33].
Globally, the spatial distribution of lakes and wetlands is uneven, and the inventory of small bodies of water is difficult. In the case of large lakes and intermediate-sized lakes, there are numerous studies and databases created [34,35,36,37,38], while in the case of small-size lakes (<1 ha), which are the most numerous, their inventory and the acquisition of existing knowledge regarding their morphometric characteristics are difficult and done more often based on the extrapolation of statistical estimates [38,39,40,41].
In these conditions, remote sensing is a very useful solution that allows the monitoring of the environment and land-cover changes on a large scale [6,41]. The use of remote sensing in the evaluation of the spatiotemporal distribution of the morphometric, physical, chemical, and biological characteristics of the lakes in mining areas, characterized by accentuated dynamics, represents an extremely versatile tool due to the increasing number of options (Landsat, Sentinel, MODIS, Aster) and much-improved resolution in recent years [42,43,44]. Thus, it is possible to improve the quantification of the number and morphometric characteristics of small lakes and reduce the uncertainties generated by statistical models.
For water mapping, McFeeters (1996) [45] developed one of the first specific indices. Still, over time, many indices have been developed that use two or more different spectral bands in the automatic extraction of water bodies (single band ratio (SBR) [46], modified normalized difference water index (MNDWI) [47], automated water extraction index (AWEIInsh) [48], enhanced water index (EWI) [49], simple water index (SWI) [50], multi-spectral water index (MuWI) [51]). However, the main problem with small lakes is the omission in identifying these areas, which can range from 15 to 88% [52] depending on imagery resolution (medium-resolution 30 m on Landsat 8 or fine-resolution imagery 0.5 m). In addition, it is possible to use manual digitization on high-resolution images from Google Earth, but this method is time-consuming when used for large areas and depends on the experience of the person in charge of digitization.
Riparian vegetation plays an important role in keeping an optimal ecological status of rivers and is useful in nutrient uptake, lowering temperatures through shadowing, and maintaining high humidity at ground level. While most of the gravel pit lakes are in the closer limit to riverbeds, the riparian vegetation is affected by the extraction operations.
The normalized difference vegetation index (NDVI) is a key indicator of vegetation status and dynamics in many ecological studies. In some cases, more robust indicators are required to characterize the characteristics of a specific biome, and one of these indicators is the leaf area index (LAI). When the absolute values of LAI are not needed, NDVI values can directly approximate the LAI. The direct reliable estimation of LAI may require the development of a field-based NDVI-LAI regression model [53].
Changes in vegetation richness and abundance can be monitored using the leaf area index (LAI). LAI is defined as the “one-sided leaf area projected horizontally on the ground” [54] because it tells how much foliage there is. It is used as an indicator of ecological processes such as evapotranspiration and photosynthesis as a proxy of the incident light intercepted by a canopy. Ultimately, LAI values are able to indicate the amount of water lost through transpiration and the amount of photosynthetically active radiation received by the plant, both being reliable parameters in the growth and development of plants [55]. Based on a global synthesis of LAI conducted by Asner et al. (2003) [56], the mean global LAI is 4.5 (std. = 2.5). The highest values have been identified in plantations (mean LAI = 8.7, std. = 4.3), temperate evergreen forests (mean LAI = 6.7, std. = 6.0), and wetlands (mean LAI = 6.3, std. = 2.3). A very important factor influencing LAI values is the climate, which, therefore, determines the emergence of eco-zones with specific vegetation features. It is clear that having rapid and accurate methods of LAI assessment is a key component of process-based ecological research for elucidating gas–vegetation exchange at various spatial scales starting from the individual canopy to the landscape.
In this context, our study aims to (i) obtain the automatic and manual extraction of small bodies of water formed in sand/gravel mining quarries using satellite images from Landsat 8, Sentinel 2A (automatically extracted), and Google Earth (manually extracted); (ii) perform a comparative statistical evaluation of the morphometric characteristics of the gravel pit lakes (surface, perimeter, shoreline) using shoreline development index (SDI), lake circularity (C), lemniscate ratio (K), spreading, form factor (F), compacity (C), area/lake length ratio (R), lake elongation (E), length/maximum breadth ratio (Rlb); and (iii) identify areas occupied by riparian vegetation and the extent to which vegetation is affected by gravel pit lake operation. In Romania, an inventory of gravel pits is not available, and our approach provides a solution for creating a comprehensive dataset that contains useful information regarding the conformity with the Mining Law 85/2003 and specifications stipulated in GD 445/2009 that regulate their activity; the spatial extent; how long it takes for the vegetation installed to recover spontaneously after the finishing of exploitation; and the assessment of the direct or indirect impact on human settlements, flora, fauna, soil, water, air, and material goods.

2. Methods

2.1. Morphometric Analyses

The determination of the number, shape, and all irregularities of the lake shoreline, depends on the scale of the map or the resolution of the satellite image [57,58,59]. Thus, knowing the main morphometric parameters of lakes (area, perimeter, length, width, direction of major axes, irregularity of shoreline) helps us to calculate different morphometric indices and understand the structure and functions of lakes [60]. In the present study, the following morphometric indices were calculated using the contours of the lakes extracted from the satellite images [61,62,63,64,65,66,67,68]:
Shoreline   development   index   S D I = P 2 π A
Lake   circularity   L c i = 4 π A P 2 = 1 S D I 2
Lemniscate   ratio   K = L 2 π 4 A
The   spreading   ratio   or   Morton   index   spreading   M I S = 4 A π L 2
Lake   elongation   L e = 2 A L π  
Form   factor   F f = A L 2
Lake   compacity   L c o = L 2 A
Area / lake   length   ratio   R A / L = A L
Length / maximum   breadth   ratio   R L / B m a x = L B m a x
where A is lake area, P is shoreline length, L is lake length, and Bmax is maximum width calculated as the maximum extension of the lake perpendicular to the length; all these indices are dimensionless. SDI and Lci use combinations of area and shoreline ratios; K, MSI, Ff, Lco, RA/L, and Le use combinations of area and lake length ratios; and RL/Bmax is the ratio between lake length and maximum width. Since the gravel pit lakes are the result of anthropogenic activities, the geometric shapes from which the evaluation was started are related to the basic geometric figures (circle, square, rectangle), so SDI, Lci, K, MSI, and Le are related to a circle and Ff, Lco, RA/L, Le, and RL/Bmax are related to a square/rectangle.

2.2. Remote Sensing

Landsat, Google Earth, and Sentinel 2A datasets are important resources that can be used in various monitoring applications of water bodies [69,70] ranging from the determination of their morphometric characteristics to qualitative analyses of physical, chemical, biological, or ecological characteristics. The Landsat data series has the advantage of a collection of images over a longer period of time (starting with 1972) and a resolution of 30 m, while Sentinel 2A images have a collection with a shorter period of time (starting with 2015), a resolution of 10–60 m, and a repeatability of 5 days at the Equator and 2–3 days at mid-latitudes (Table 1).
The images provided by Google Earth are made available to the public by Google, being provided by Maxar and Airbus companies, and a number of other agencies that deal with the processing and distribution of satellite images. They generally have a very good spatial resolution (<10 m), allow the extraction of attributes, and do not need to be downloaded or processed. The disadvantage is that they do not have spectral bands, the spatial resolution is still uneven, and the time series differ from one region to another [71]. For the selection of the satellite image processing date for the evaluation of the morphometric characteristics, the use of Web-enabled free sources was considered, and a relatively similar period was identified for the 3 options (Landsat 8—4/4/2019; Sentinel 2A—26/04/2019; Google Earth—Spring 2019), plant rest, and reduced cloud cover in order to have the best possible image clarity for the entire study area. The lake contour extraction based on Landsat 8 and Sentinel 2A images was done automatically using spectral band combinations to calculate the normalized difference water index (NDWI) (Equation (10)) [45] while lake contours were extracted from Google Earth images through manual vectorization.
N D W I = G r e e n N I R G r e e n + N I R
The combination of the two spectral bands is used due to the different properties: the green band has high reflectance and the NIR band has low or no reflectance on the water surface. From Google Earth, gravel pit lake contours were extracted from images through manual vectorization, exported in .kml format, and transformed into shapefiles in ArcGIS 10.8.
Sentinel 2A images were used to calculate the normalized difference vegetation index (NDVI) and LAI because of the improved resolution (10 m) [72].
N D V I = N I R   n a r r o w R e d N I R   n a r r o w + R e d
On the ground, LAI can be assessed directly by cutting a statistically significant sample of foliage from the plant canopy, assessing the leaf area per plot usually using a leaf area meter or scanning device, and dividing it by the plot land surface area (m2 m−2). On the other hand, there are non-destructive methods (e.g., ceptometers) that approximate light extinction within the canopy or canopy geometry that allow the indirect calculation of LAI based on specific algorithms (https://edepot.wur.nl/171923 accessed on 27 May 2022). Several remote sensing products were specially developed providing spatiotemporal datasets of LAI dynamics including Moderate Resolution Imaging Spectroradiometer (MODIS) and PROBA-V.
In this paper, the leaf area index was assessed using the NDVI calculated from the Sentinel 2A datasets based on the following equation [73]:
LAI = a × exp (b × NDVI) 
where a and b are weighted regression coefficients that vary with plant association type (grassland, shrubs, and trees, respectively)—in this paper, we used the average values of a = 0.5 and b = 2.3. Similar regressions were applied by Fan et al. (2009), Jinling et al. (2009), etc. [74,75].
The assessment of LAI at the area level was also considered using two well-established missions, i.e., PROBA-V and MODIS.
PROBA-V time series of LAI were retrieved from the Time Series Viewer application using two products, PROBAV_TOC_NDVI and LAI_V1 (https://proba-v-mep.esa.int/applications/time-series-viewer/app/app.html accessed on 27 May 2022), for the vegetation season in 2019. More technical information regarding the PROBA-V LAI product compared to other missions including MODIS can be found at https://land.copernicus.eu/global/sites/cgls.vito.be/files/products/CGLOPS1_PUM_FCOVER1km-V1_I2.40.pdf (accessed on 27 May 2022).
An 8-day composite dataset with 500 m pixel resolution is provided within the MCD15A2H Version 6 (MODIS) Level 4 product, combining fraction of photosynthetically active radiation (FPAR) and LAI. The best pixel available from all the acquisitions of both MODIS sensors located on NASA’s Terra and Aqua satellites within the 8-day period is chosen by a special algorithm (https://lpdaac.usgs.gov/products/mcd15a2hv006/ accessed on 27 May 2022). In this paper, we have selected two .hdf datasets that correspond to the time of Sentinel 2A acquisition (MCD15A2H.A2019153.h19v04.006.2019162042131 and MCD15A2H.A2019209.h19v04.006.2019218045734). The subdataset 1 (variable: LAI_500 m) was imported in ArcGIS, and then the following syntax (SetNull (“raster” ≥ 71, “raster”) ∗ 0.1) was used in Raster Calculator to transform DNs to LAI values (Figure 1).
The creation of the database with gravel pit lakes and the image processing was completed in ESRI ArcGIS 10.8. The study area included lakes with different concentrations of organic matter, phytoplankton, and suspended sediments resulting in different colors and different absorption of sunlight. In addition, the brightness of the lakes and the ratio between the amount of light absorbed and reflected also depends on the angle of incidence of the sun. The bodies of water resulting from the NDWI were visually inspected and filtered to avoid the inclusion of river segments in the category of gravel pit lakes. The removal of the natural lakes from the study area was done manually, the advantage being given by the fact that the gravel pit lakes are concentrated near the rivers in well-defined areas where vegetation is often missing; NDVI and LAI also contributed to their identification.
The differences between the resulted LAI rasters were calculated using the Diff and Minus functions from the ArcGIS toolbox. They determine which values from the first input are logically different from the values of the second input on a cell-by-cell basis. If the values of the two inputs are different, the value of the first input is output (https://www.esri.com/en-us/arcgis/products/arcgis-spatial-analyst/overview accessed on 27 May 2022).
Correlation analysis between the obtained LAI datasets from various satellite missions was performed using the following steps: (1) the Geostatistical Analyst Tool—Simulation—Extract values were applied to a table, for each subbasin; (2) the obtained LAI indicators for each subbasin were averaged to obtain a single indicator for the study area; and (3) logarithmic trendlines were plotted for each time series and correlation between the time series was determined.

3. Results and Discussions

The study area is located in the central-southern part of Romania, in the northern half of the Romanian Plain, occupying an area of 6762 km2. The altitudes gradually decrease from the northwest (350 m, in the Pitești Plain) to the south and southeast (50 m, in the Sărata Plain) (Figure 2a).
Overall, there are two relief steps: a higher step, of Piedmont origin (Pitești–Târgoviște–Ploiești–Istrița), at the contact with the northern Sub-Carpathian region, which has well-highlighted terraces and extensive river low-lying plains, and a lower step, of the subsidence type (Titu–Gherghița–Sărata), to the southeast, in which the terraces are missing, only the waterside is developed, and frequent divagation phenomena occur.
Given the evolution of the hydrographic network during the Quaternary, imposed by the presence of the subsidence area of the lower Siret, northeast of the Romanian Plain, there is a presence of many old, abandoned riverbeds, located further west of current courses.
Regarding the current geomorphological processes, there are several aspects as follows: river erosion processes, with grind-type forms or microdepressions with excessive moisture, at the level of riverbeds, to which are added courses and abandoned meanders or cones of manure from smaller tributaries, and settling processes and slight suffusion in loessoid deposits on the surface of terrace bridges and interfluvial fields.
From a lithological point of view, alluvial deposits are made up of a whole range of alluvial materials, being represented by sands and gravels (Strate de Frățești), along with loessoid deposits. Thus, a siliceous structure of the deposits predominates.
From a climatic point of view, the average annual temperature increases from west to east, from 9–10 °C in the Pitești Plain to 11 °C in the Istrița, Sărata, and Gherghiței plains. The average annual rainfall is between 450 and 600 mm, decreasing from northwest to southeast.
The hydrographic network most influences the study area by the number of sediments transported. Two river basins (Argeș and Ialomița) cover the entire study area: Argeș (70 m3/s), with its tributaries Dâmbovița (10 m3/s) and Sabar (8 m3/s) on the left and Neajlov (9 m3/s) on the right, and Ialomita (45 m3/s), with its tributaries Prahova (27 m3/s) and Teleajen (10 m3/s) on the left. The type of sediments transported is a factor in the location of the gravel pits, so in addition to the sediments from the Subcarpathians, Argeș and its tributary Dâmbovița come with sediments from mountain units formed in crystalline schists, while Ialomița, Prahova, and Teleajen rivers bring calcareous sediments or conglomerates and hard sandstones.
The region includes a series of bodies of groundwater of the permeable porous type, located at different depths (15–20 m in the northern half and 1–5 m in the southern subsidence areas). The groundwater is drinkable, except for a small territory between Cricovul Dulce and Ialomiţa, located south of the area of the Moreni–Gura Ocniţei diapir folds.
From the point of view of land use, there is a slight distinction between the western half (agricultural land, deciduous forests, and steppe secondary grasslands, on luvosols, preluvosols, and planosols) and the eastern one (heavily modified agricultural lands and grasslands, on chernozems). The population density (with higher values, of 60–80 inhabitants/km2 in the central area of Târgoviște–Bolintin–Buftea–Ploiești) and the anthropic activities exert constant pressure on the environmental factors, through the following: industrial activities (petrochemistry, in the Ploiești areas and Pitești, and metallurgy, in Târgoviște) and agricultural activities (intensive vegetable growing, in the north of Bucharest, and fishing facilities).

3.1. Morphometric Analyses

Knowing as accurately as possible the length of the shoreline in combination with the surface of the lakes is extremely important because it provides information on the irregularity of the line and can provide clues about the bathymetric characteristics, which determine the main hydrological and sedimentation processes [76]. Over time, the main morphometric characteristics of the lakes and the calculated indices have been used to understand the thermal stratification of the lakes, mixing type, nutrient loading in the lake [77], productivity and biological diversity, fish community structure [78], the biogeochemical cycle or emissions of greenhouse gases [60,79]. The main morphometric characteristics determined for the gravel pit lakes in the study area are shown in Table 2.
NDWI is commonly used in lake contour extraction because it provides accurate results in a short time. The problems encountered in extracting the contours of the gravel pit lakes were determined by the different resolution of the images (10 m Sentinel 2A; 30 m Landsat) and the uneven quality of the images exported from Google Earth. In addition, an additional challenge was given by the diversity of the analyzed land surfaces, the land use, and the optical properties of the lakes. However, in the case of small lakes, the correct identification of shoreline contour depends on the resolution and quality of the images because along the shores we find pixels containing mixed information water/vegetation/gravel which can be attributed to water or non-water based on NDWI value. In addition, in the case of lakes with high turbidity, the spectral reflectance of the water surface indicates values similar to those of the surrounding surfaces, which leads to their non-inclusion in the “water” category. The binary values of NDWI (water/non-water) were evaluated comparatively using gravel pit lakes perimeters from manual vectorization data (Google Earth). Based on these considerations, the evaluation of the number of lakes highlighted the importance of image resolution in the conditions in which the gravel pit lakes are concentrated on terraces or river low-lying plains, on restricted areas, with small distances between them and various geometric contours (Figure 2b). Because of this, the 30 m resolution of Landsat images causes many small, very close lakes to be “merged” into a single water body, which has led to an overall decrease in the total number (406 lakes) and surface growth (Figure 2c,d). Even though the resolution of Google Earth images in densely populated areas is better, the number of manually extracted lakes is comparable to that of Landsat because there was a balance between areas with very good resolutions and areas where the resolution is lower (436 lakes).
The areas with high densities of the number of lakes are located in the Arges river low-lying plain approximately at half the distance between Bucharest–Pitesti and can be attributed to the easy access to the highway (Figure 3). Even if the gravel pit lakes are concentrated along the main rivers, other extremely important criteria in their positioning are the proximity of the main communication axes or the road junctions and access to the highway. In addition, the distance from the large urban settlements is another determining factor because the gravel and sand mined from the gravel pits must be transported as cost-effectively as possible to the beneficiaries.
In the analysis of the surface of the lakes, we must take into account the fact that the size of this parameter is variable over time, due to changes in interaction with groundwater [80,81,82], anthropogenic activities, and changes in land use [83,84,85] in the area of gravel pits [86]. In addition, depending on the distance from the hydrographic network, the evolution of the surface of the water surface is related to the amount of precipitation and water levels in the river. The validation of the surface size was done crosswise using 209 lakes chosen randomly whose contours were similar (Figure 4). The degree of similarity between the surfaces extracted automatically from Sentinel 2A and those extracted manually using Google Earth was 96%.
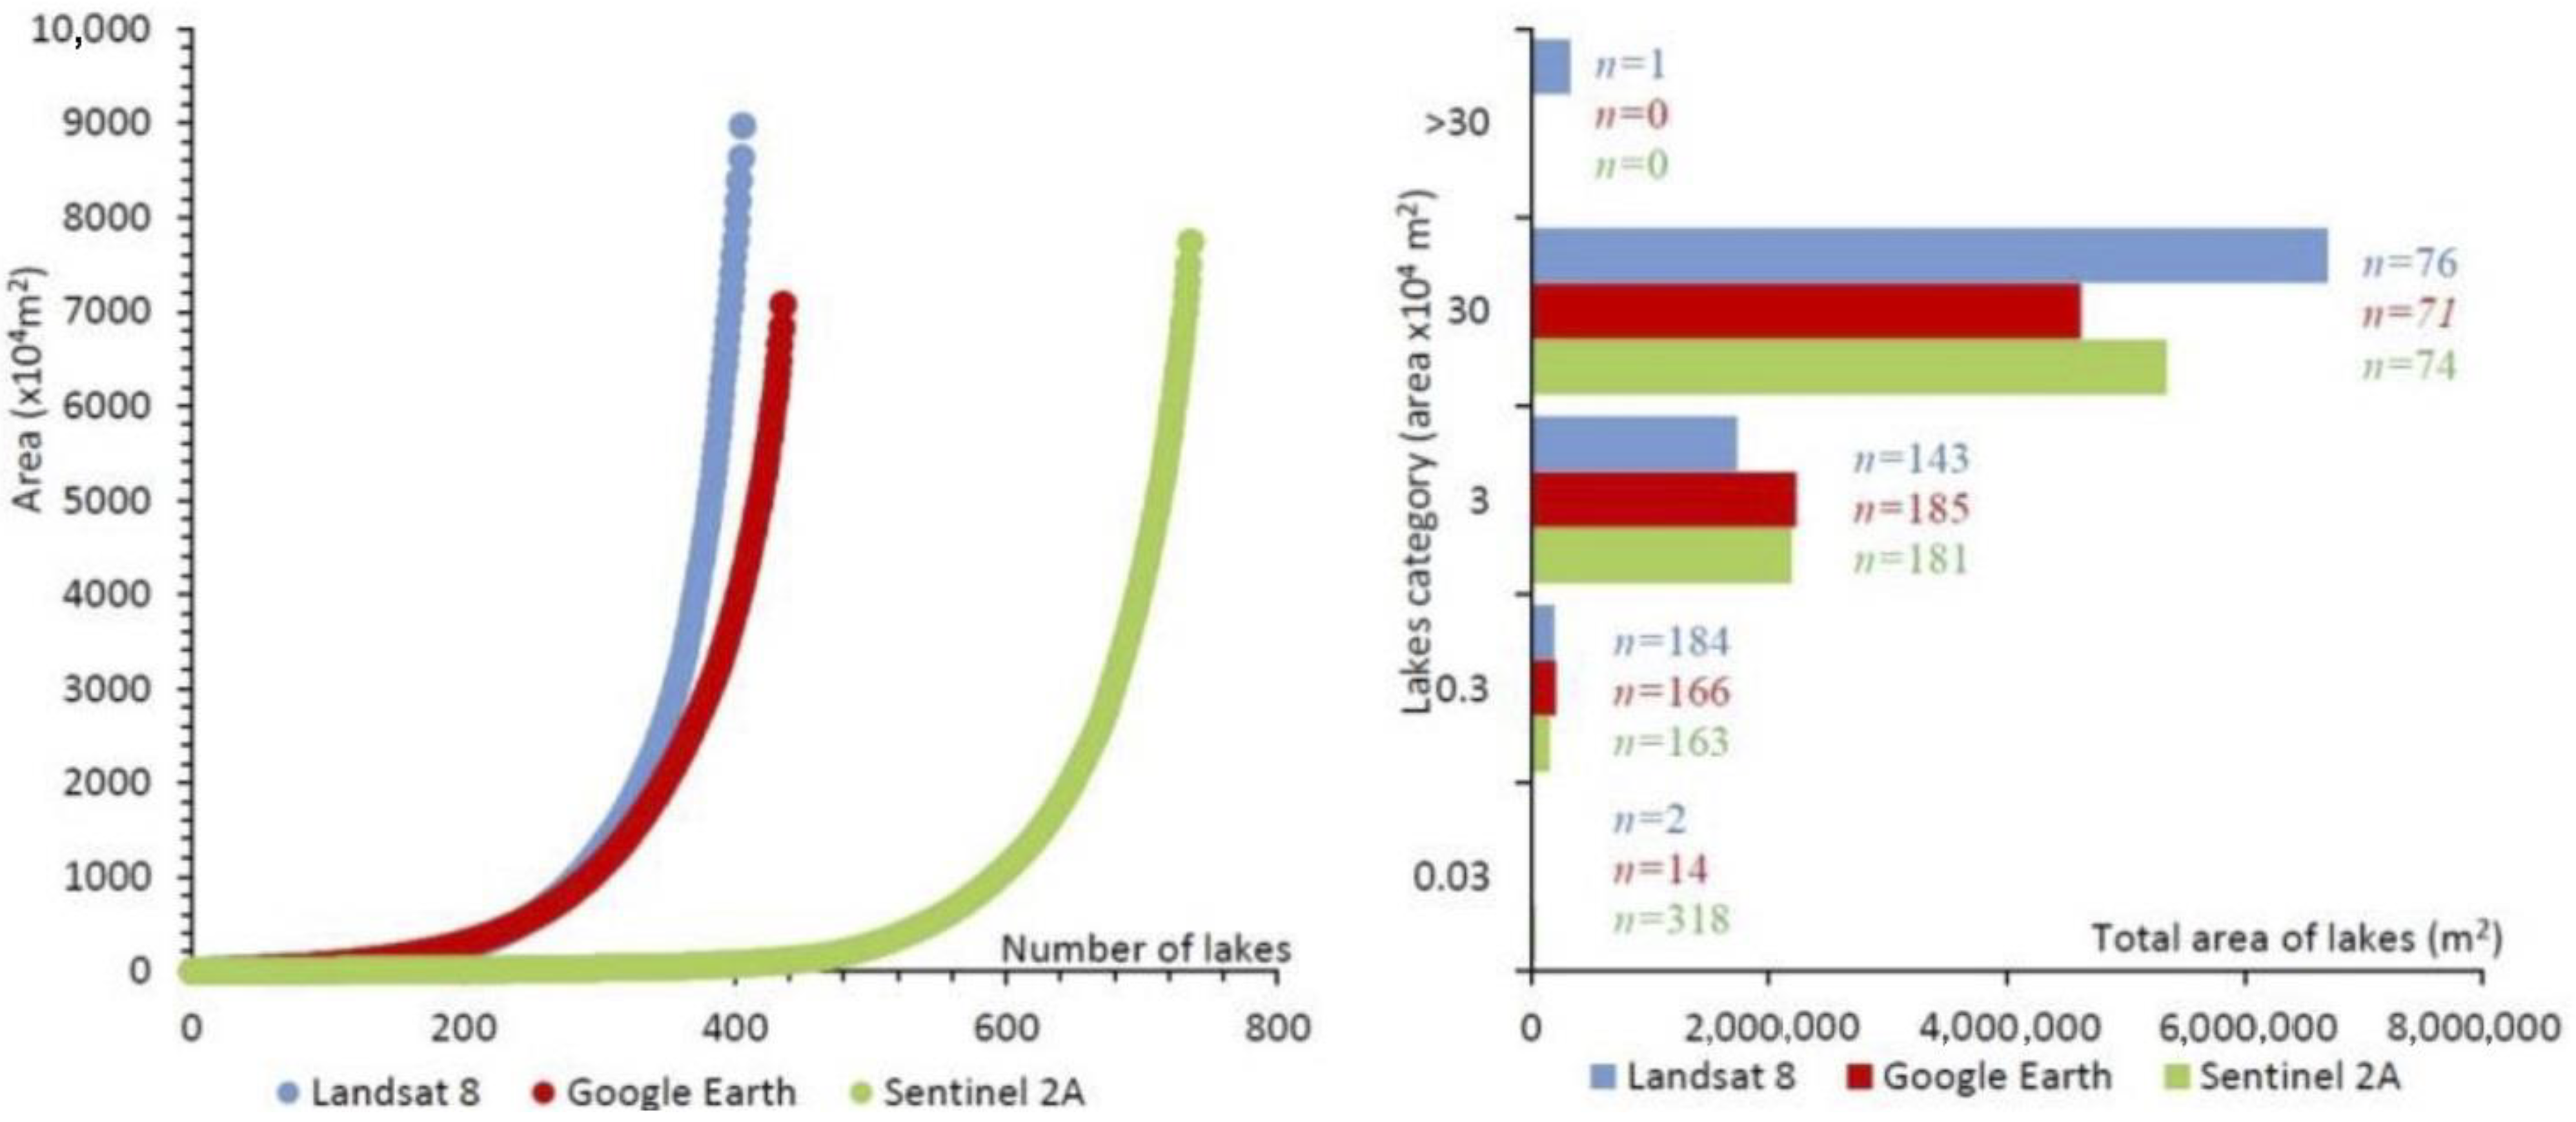
Thus, the comparative analysis of the number of lakes relative to the surface shows the importance of the image resolution (Figure 5). The number of lakes is close for the categories of lakes whose surface is between 0.3–3 ha while significant differences are recorded in extreme cases: very small lakes (detected mostly only on Sentinel 2A images) or very large (detected on Landsat images by joining the lakes which are very close to each other). In all three satellite image processing analyses, there is a good correlation between area and shoreline length (Figure 6), with higher values of R2 (0.89) in the case of Landsat 8 due to the increase in lake surfaces due to the joining of the small lakes that are close to each other.
The morphometric indices used in the analysis of the lakes’ surfaces reflect the anthropic way of formation and the elongated characteristics of the lands on which they are positioned. In the case of small lakes, the values of the indices related to the circle are close to 1 (for example, SDI), which corresponds to a small difference between length and width for RL/Bmax whose ratio is close to 1, but the values of the ratios change with increasing area in the sense that lakes with large areas become elongated.

3.2. Evaluation of the Spatial Distribution of Gravel Pit Lakes Using Sentinel 2A Datasets

The spatial distribution of the lakes using Sentinel 2A datasets relative to the physical-geographical units (Table 3) shows us that most of the lakes are found in the Titu–Sarata subsidence plain (47%) with a total area of approximately 4.7 km2. The asymmetrical development of the river banks, much more extensive on the left bank, with the extended river low-lying plain that can reach 14 km in the above-mentioned sector, determines a concentration of lakes on this bank both on the Arges River and on the other main hydrographic channels. The asymmetry is due to the decrease in the base level of the Black Sea during the Wurm glaciation and the accelerated deepening of the riverbeds followed by clogging processes against the background of the increase in the base level during the interglacial period. Consequently, the river low-lying plains of Arges and the main rivers in the study area have greatly expanded in the thick layers of gravel and sand that reach the first terrace, and the intercalation of sand/gravel and clay determines the formation of extensive aquifers that feed the newly formed gravel pit lakes.
Numerically, almost 70% of the lakes have small areas (<0.5 ha) and are located on the left bank of the river (87.82%), so the abundance of lakes is inversely proportional to the size of the area (Figure 7). Most gravel pit lakes have been identified on the left bank of the Arges River, having small dimensions and elongated contours. Their formation is related to the intersection of the groundwater in the process of aggregate exploitation.
The length of the lakes combined with the direction of development of the main axes (NS, EW, NE–SW, NW–SE) allows the understanding of the formation of waves and currents and their role in the processes of transport and resuspension of organic particles and sediments [14,35].
The measured values of lengths, widths, and A/L ratio show that the lakes have small areas and consequently small values of length or width (only 20 lakes have lengths greater than 500 m; the highest value is 929 m). An analysis of the direction of the dominant winds (Figure 2a) and the arrangement of the major axis of the lakes in accordance with the dominant direction shows that most lakes (286 lakes—38.8%) are in the NE–SW direction while the rest of the lakes are arranged approximately equally: 162 in the NS direction (22%), 148 in the NW–SE direction (20.1%), and 124 in the EW direction (16.8%), and a clear development direction cannot be identified only in the case of 2.1%. Only for 23.4% of the total number of lakes is the development direction/length identical to the dominant wind direction in the respective area, amounting to an area of 190 ha. However, of the 172 lakes in this situation, only 30% of them have an area of more than 1 ha. Most of the lakes in this situation are those in the NE–SW direction.
From the analysis of the lakes extracted using Sentinel 2A images, good correlations are observed between the area, perimeter, and length of the shores (Table 4), and also there are positive correlation coefficients between indices that use the same geometric figure (SDI/Lci; Ff /Le; Ff/RA/L) and indirect correlations between formulas related to the circle and elongated forms (SDI and RA/L; Le or K and RA/L; Le).

3.3. Assessment of Vegetation Dynamics Based on Satellite-Derived LAI

Leaf area information is essential for evaluating modifications in ground cover and canopy structure due to intrinsic biological factors, climate change, pollution impact, and anthropogenetic influences such as gravel pit exploitation [87]. It is also useful for predicting crop yields and land-use efficiency [88]. Leaf area index (LAI) is a key plant biophysical parameter frequently used in ecological studies. LAI derived from remote sensing to assess the spatiotemporal dimensions of vegetation’s seasonal variations has increased in accuracy when considering Sentinel 2A imagery, avoiding the production of maps from low spatial resolution satellite images [89].
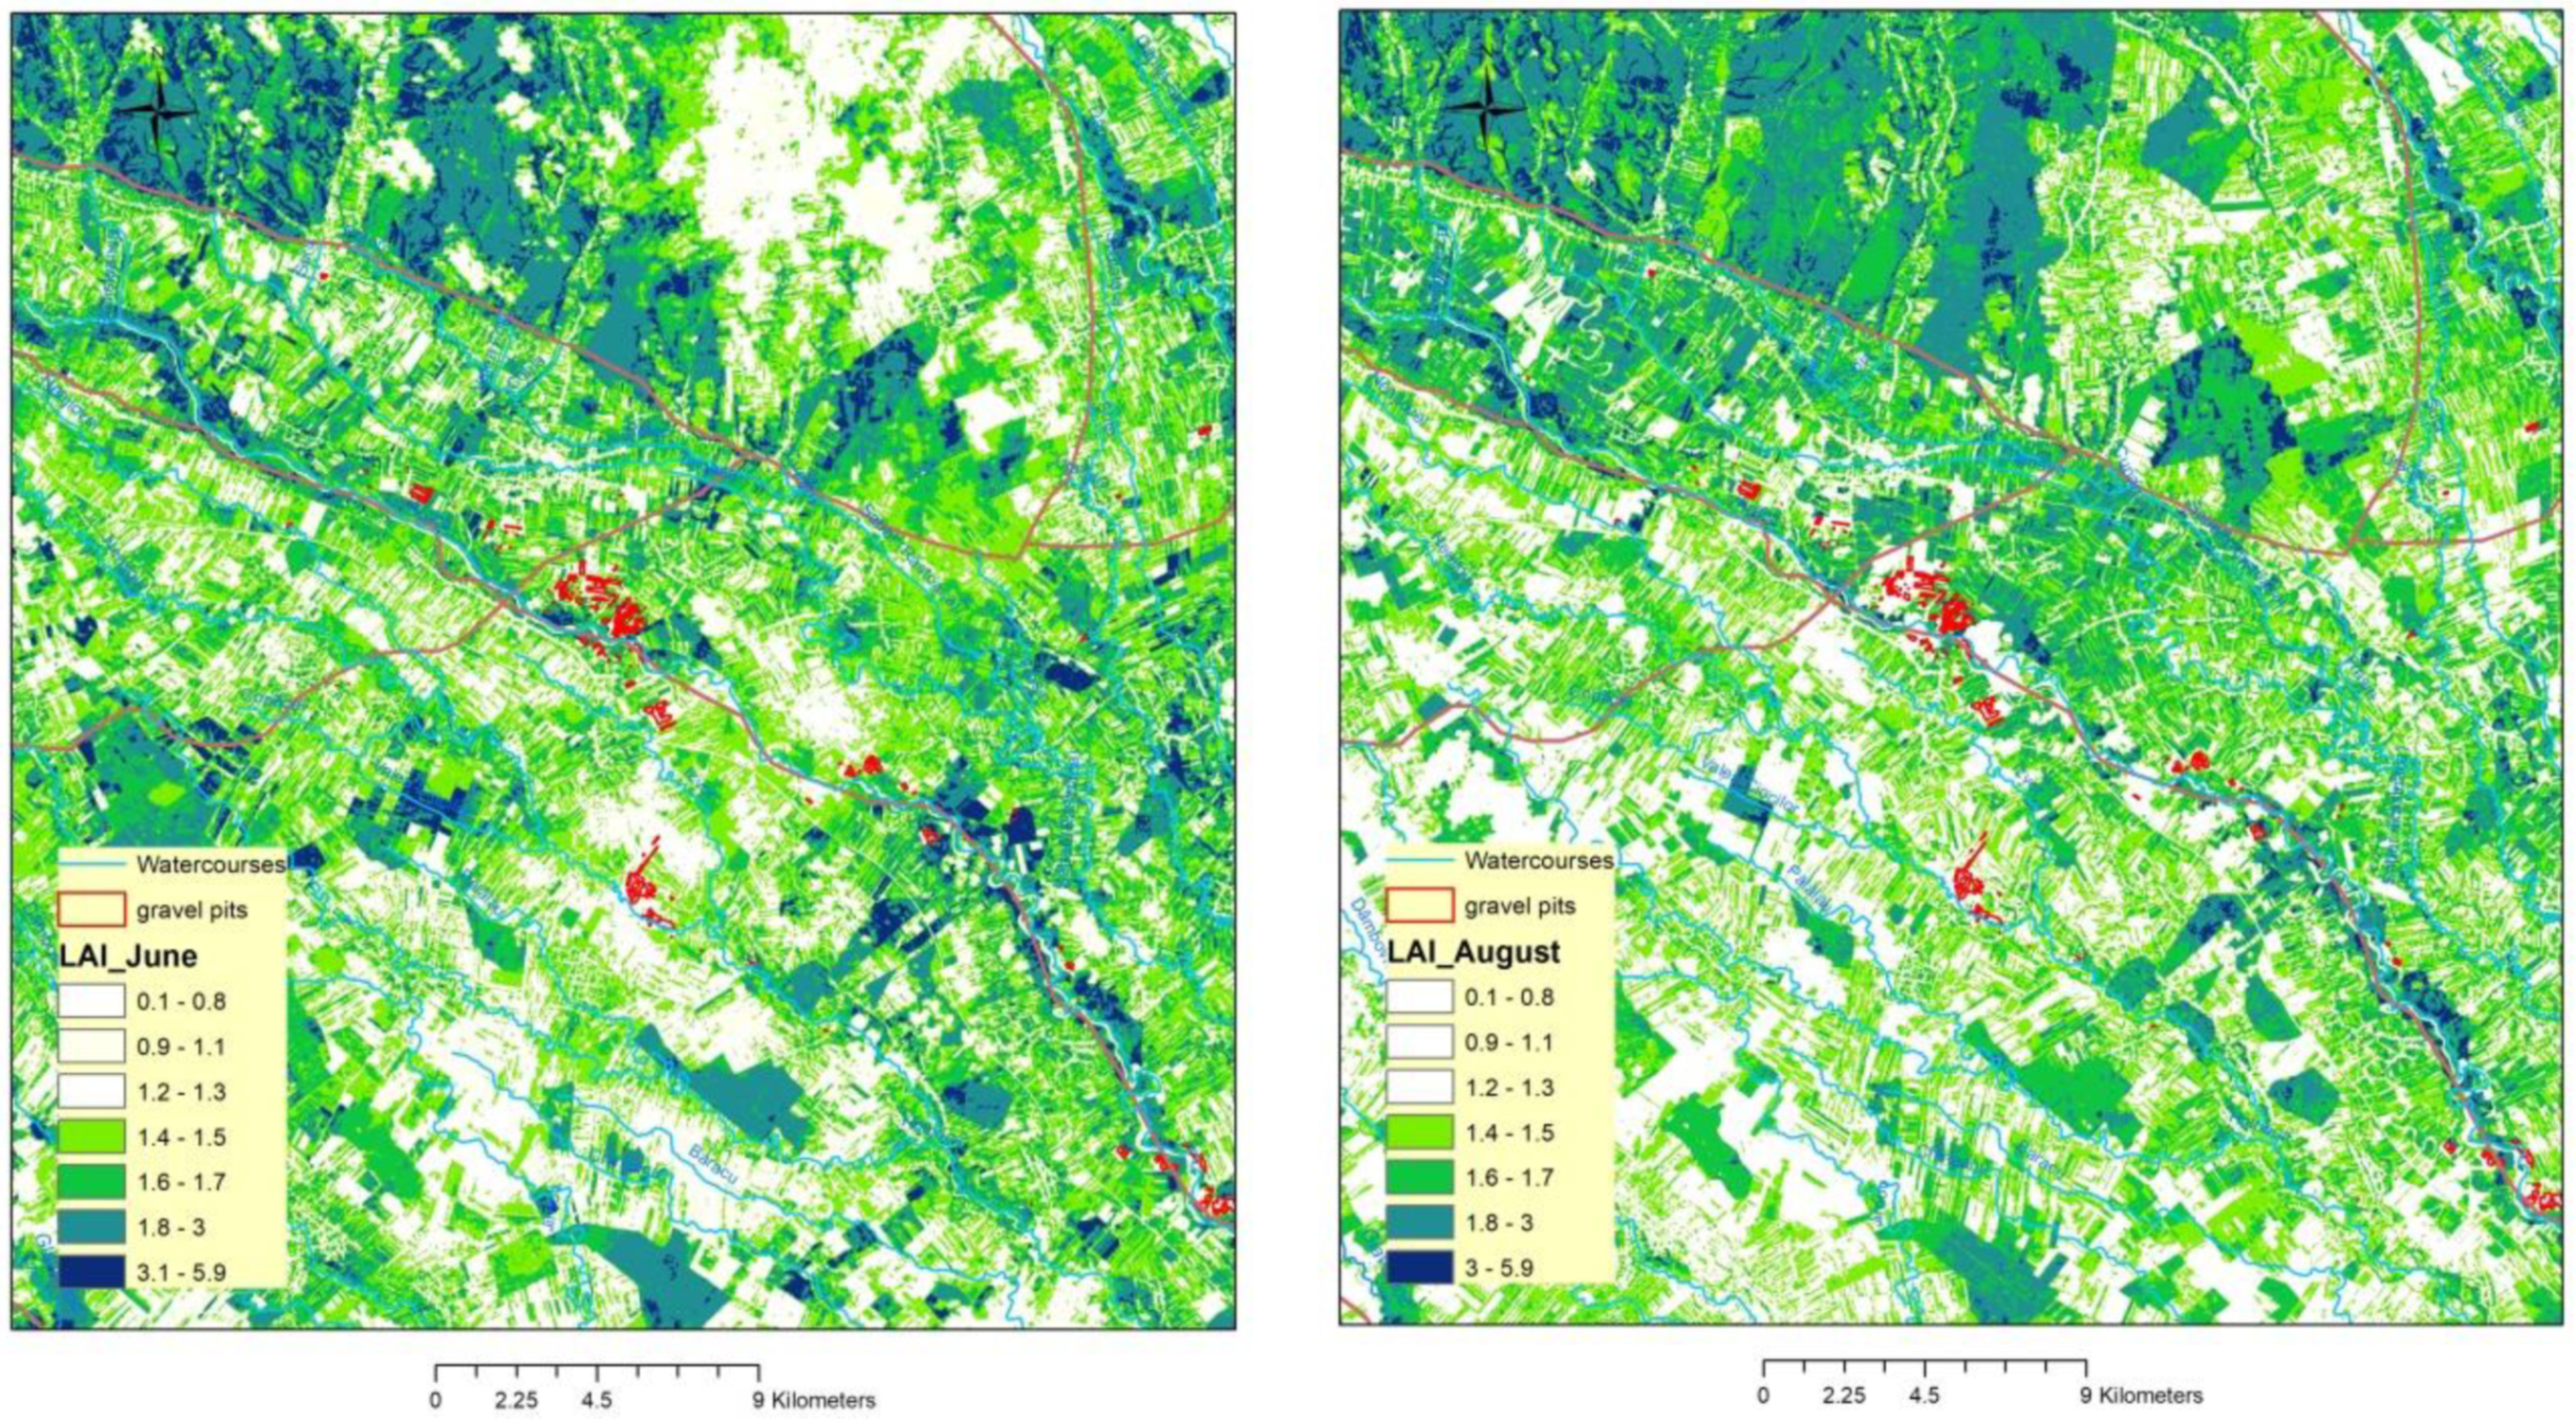
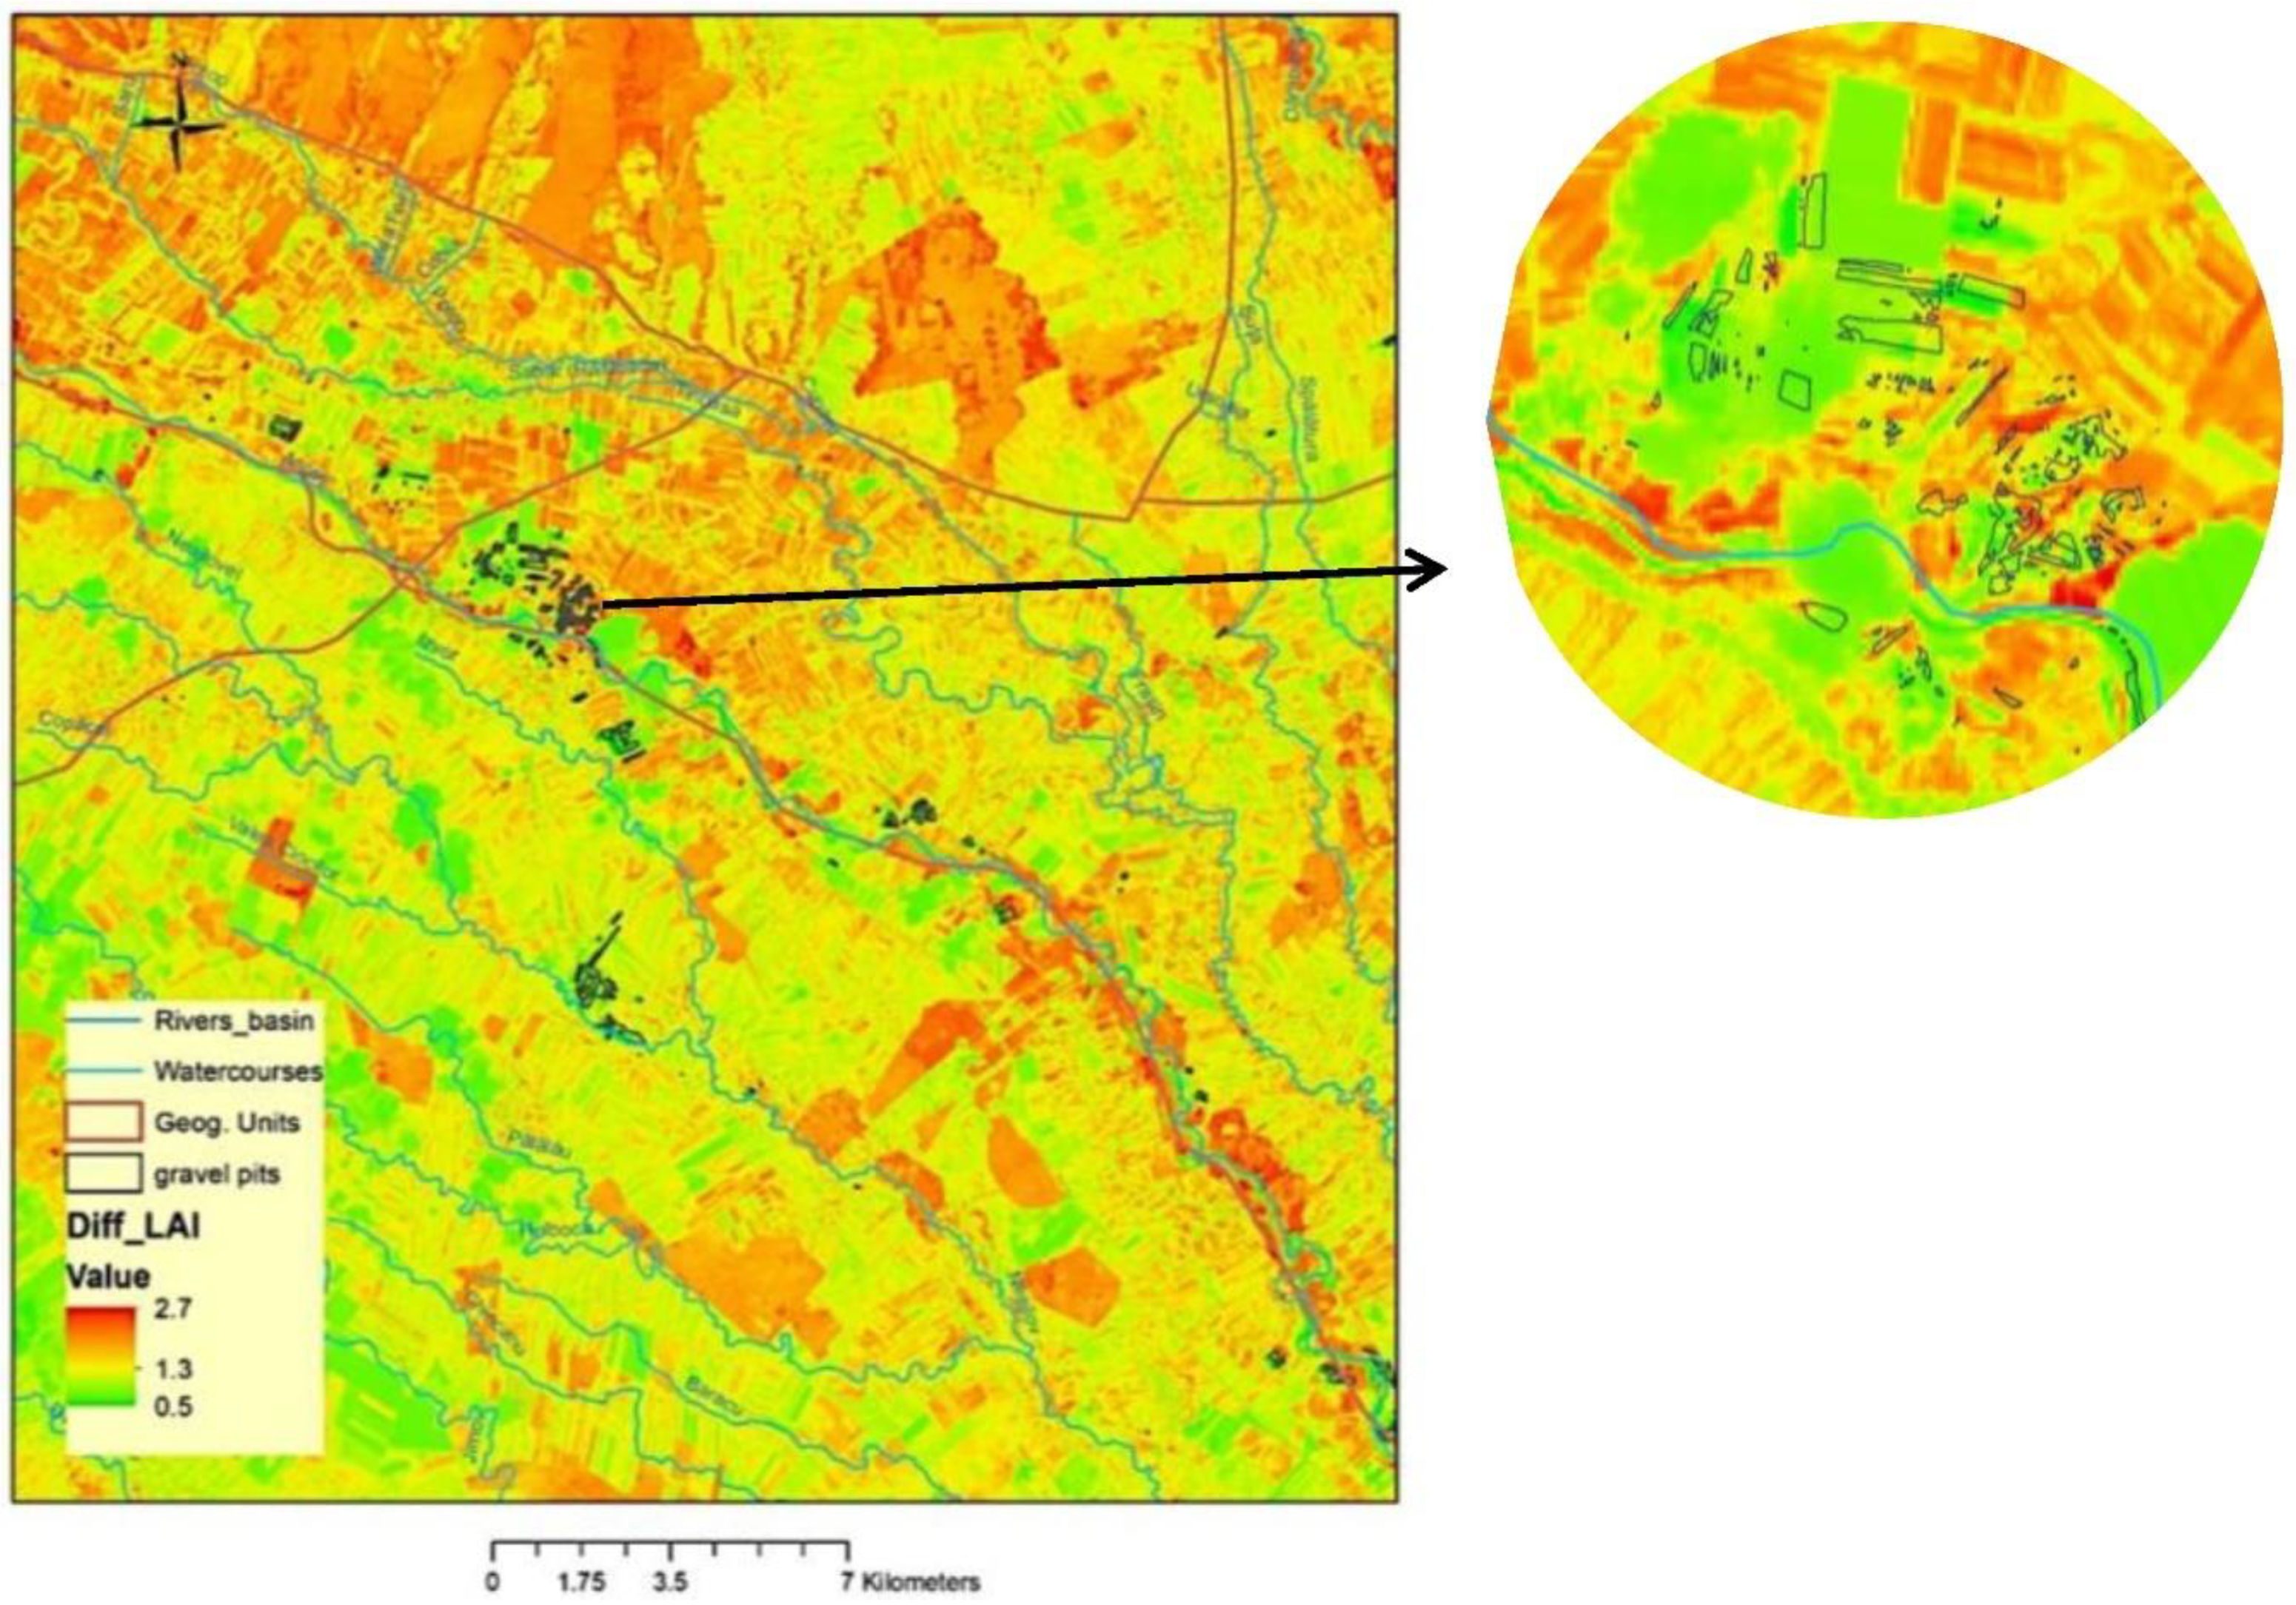
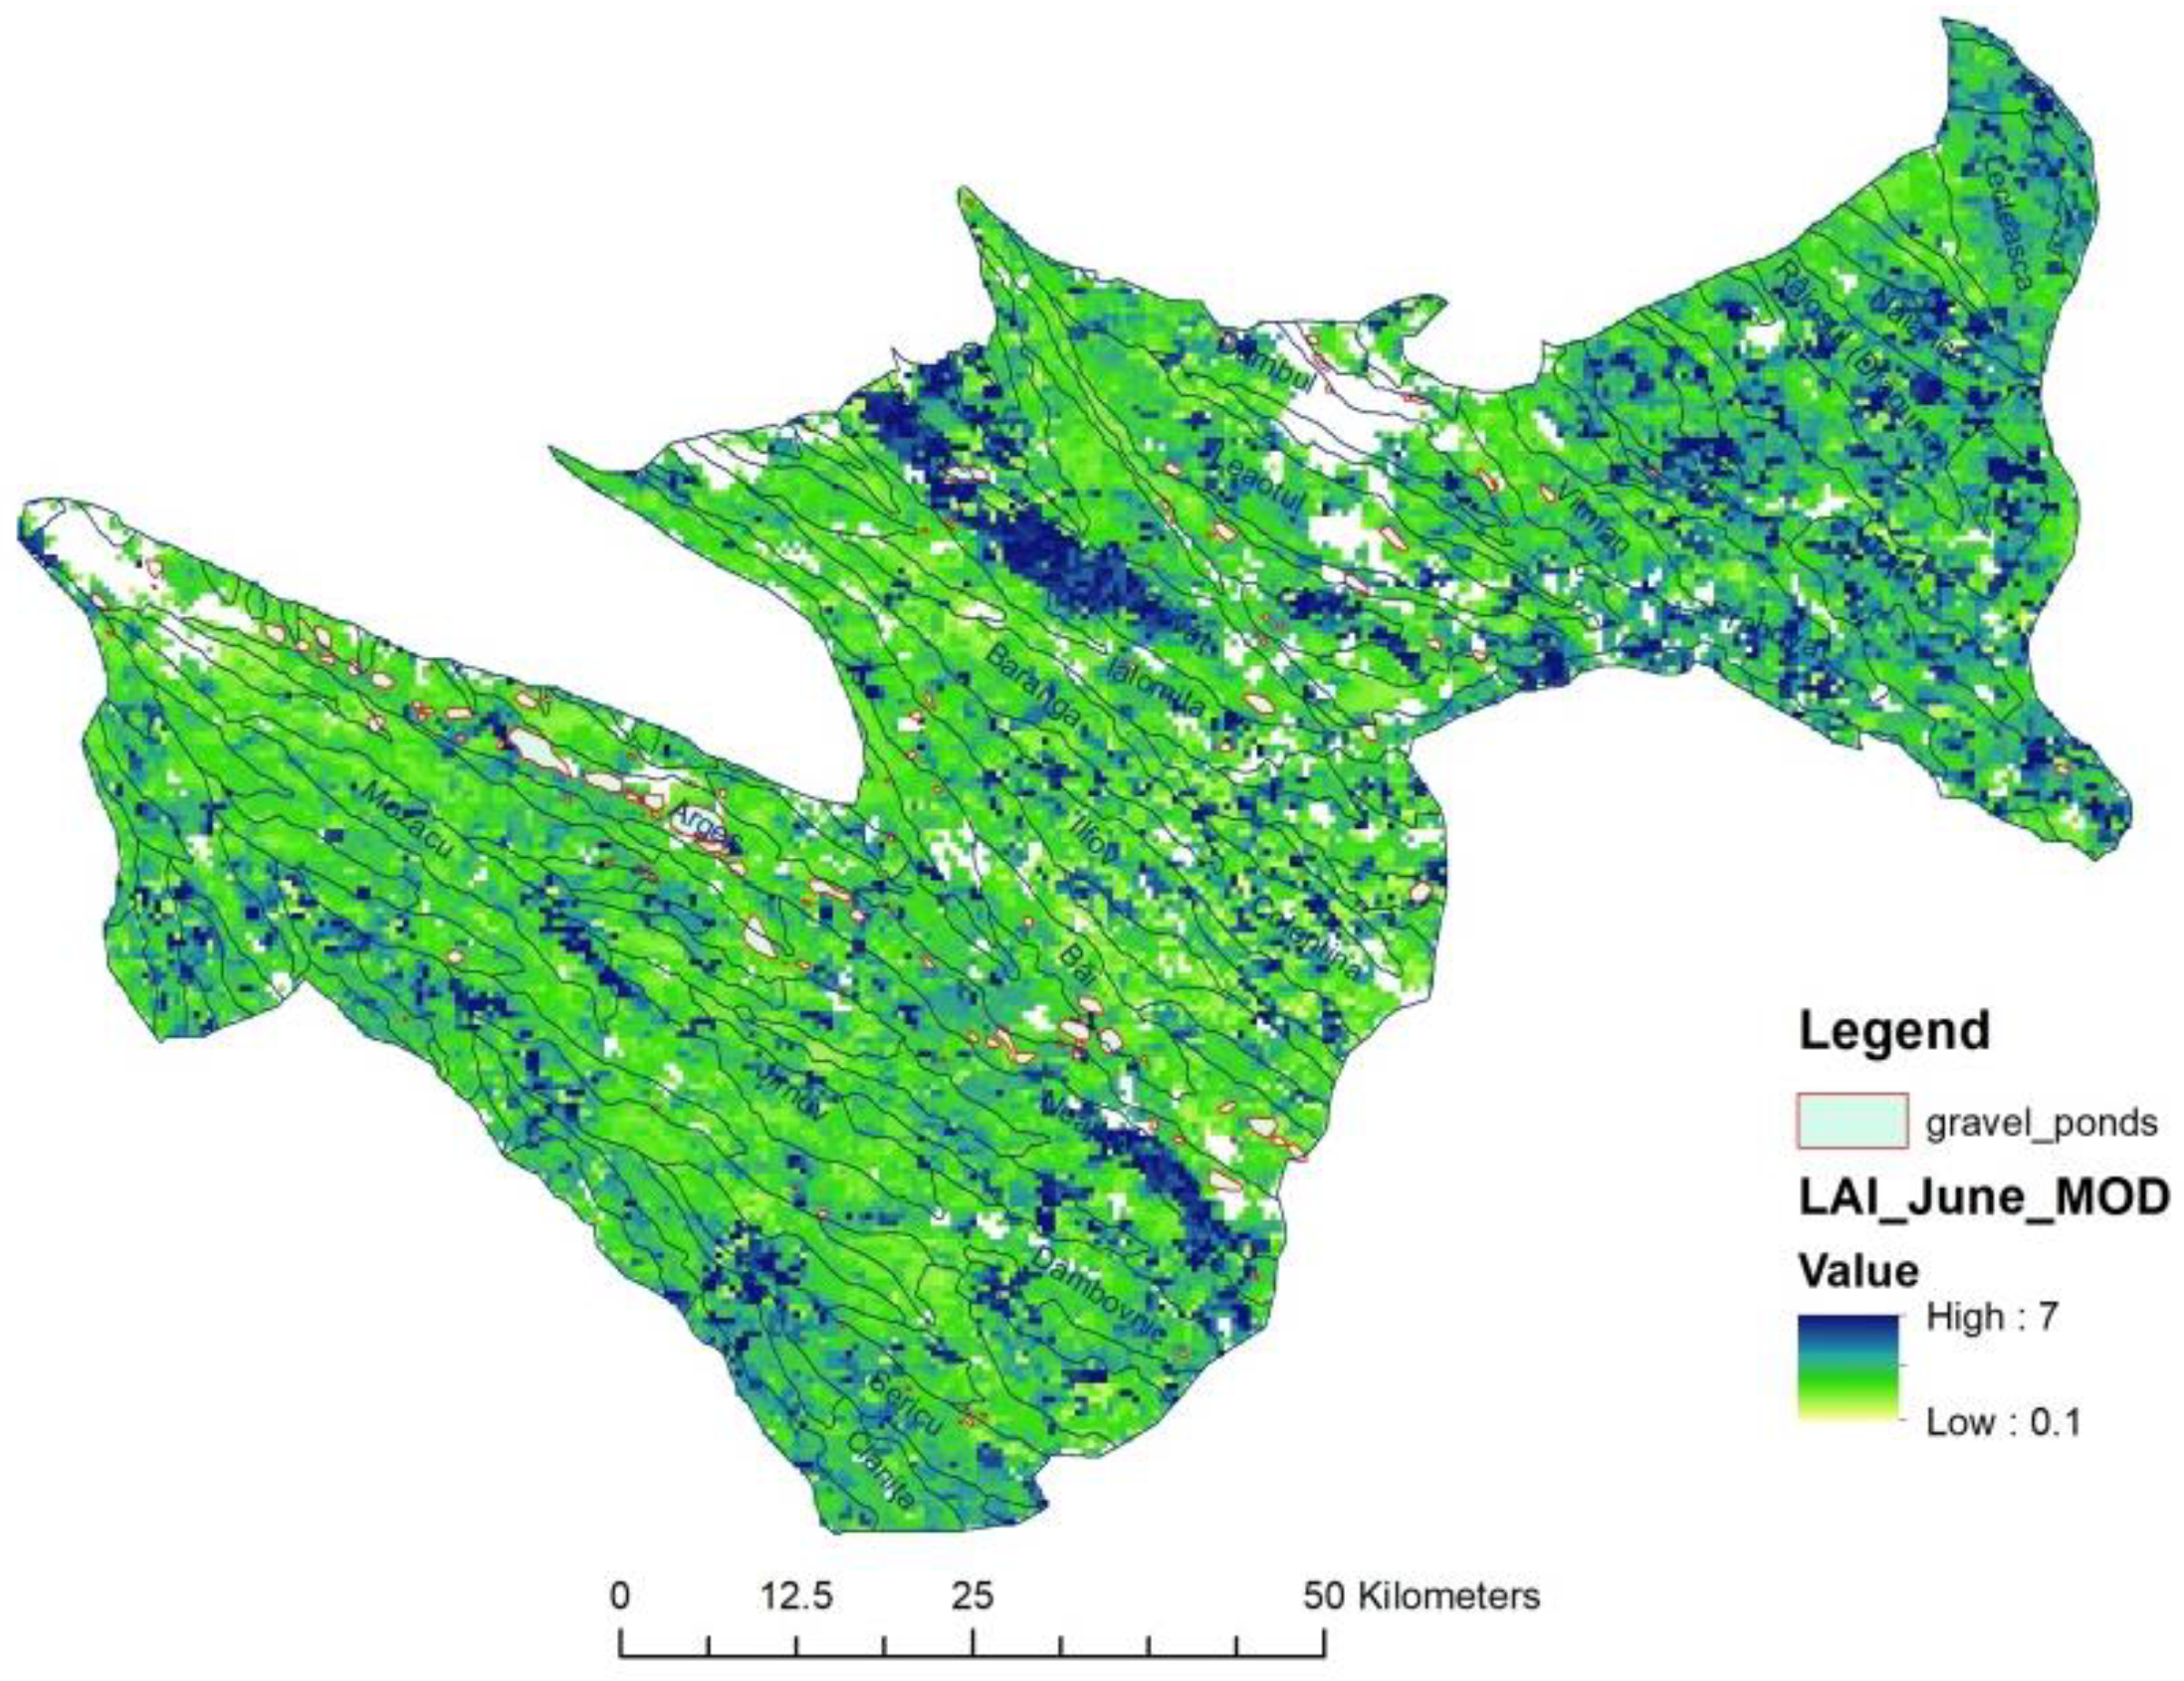
Figure 8 provides an assessment of the vegetation dynamics between two moments in 2019 (July and August) in an area of Arges River where the number of gravel pits is significant. Satellite imagery showed normal modifications related to seasonal phenology with a major drop in LAI of up to 2.7 units, especially in areas occupied by forests, but also in some riparian sectors where gravel pits are not present. Agricultural lands (with regulated forms) have average reductions in LAI due to crop maturation/harvesting. The areas surrounding the gravel pits showed almost no modifications in LAI (low values) suggesting that the vegetation in these areas is less present.
This is more visible in the close-up capture with many gravel ponds grouped. The operations in these areas for mineral extraction eliminate most of the vegetation, which represents an important environmental and ecological impact. When the exploitation ceases, the vegetation around the gravel ponds starts to grow, and after some time, specific vegetation appears on the shoreline.
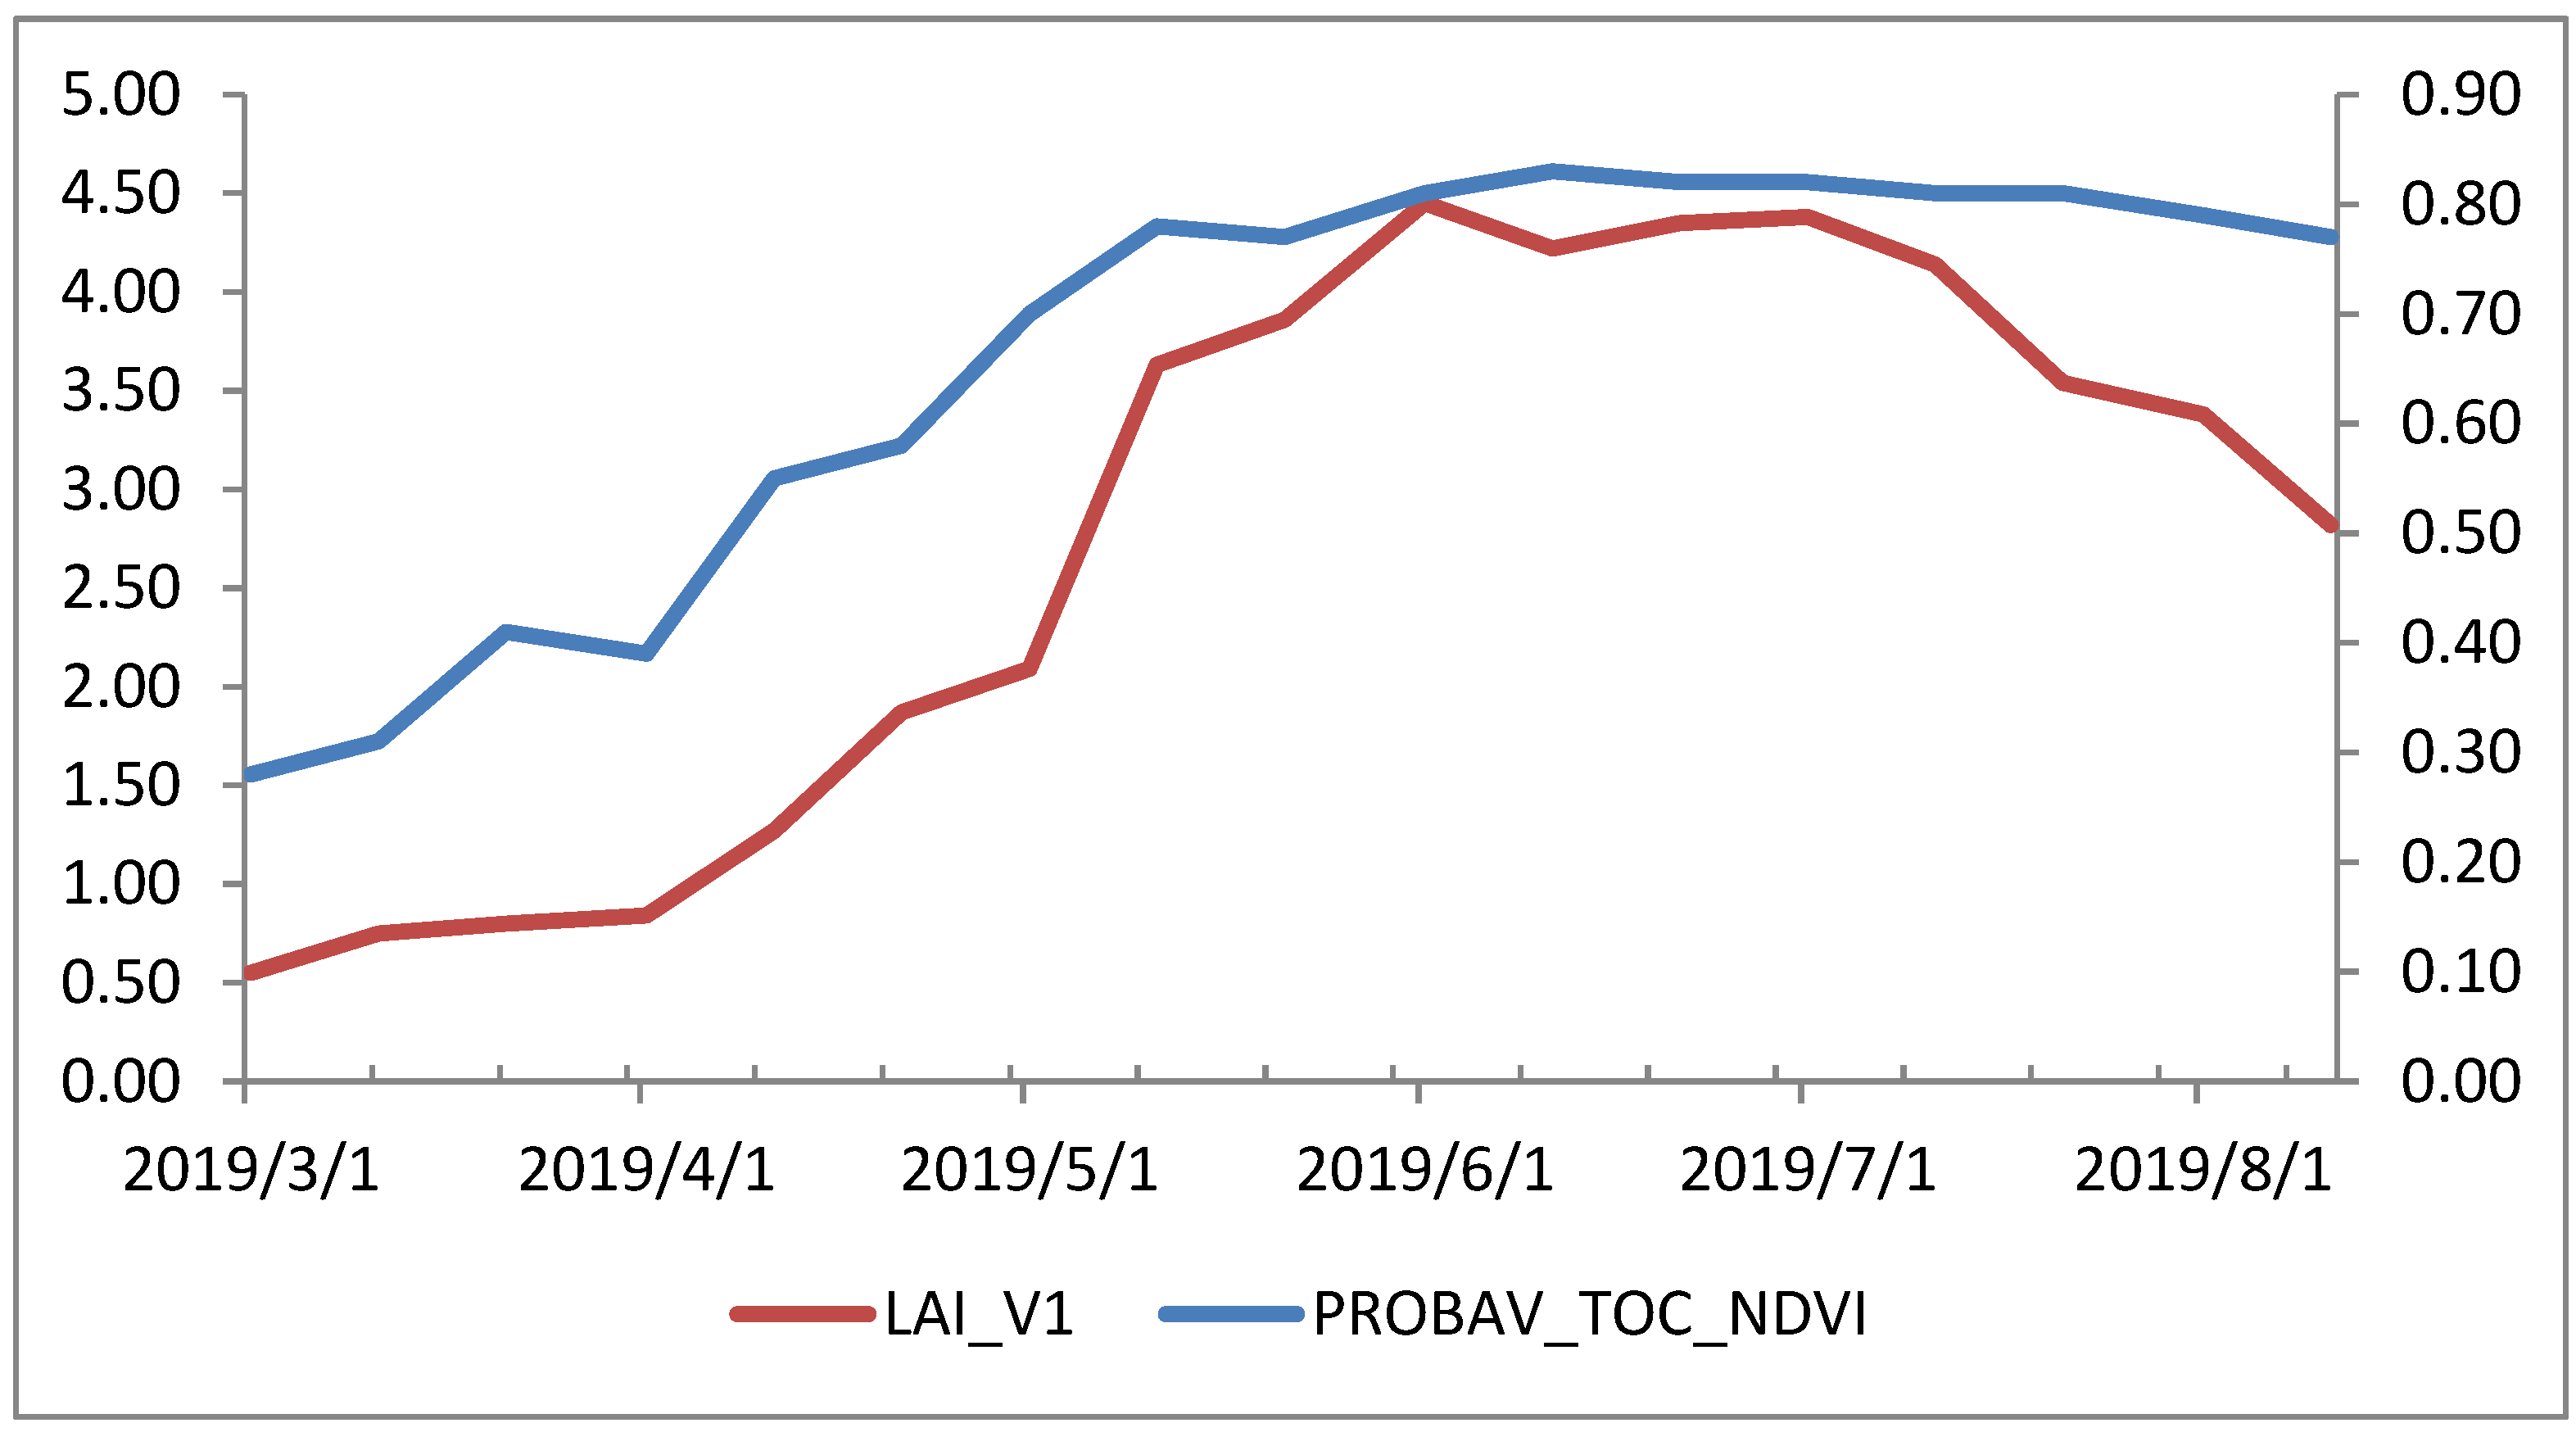
Compared to other satellite-derived LAI values such as that from PROBA-V, the reduction in LAI is also highlighted in the Arges River basin, showing a drop of 1.6 units on average from 6 June 2019 to 11 August 2019 (Figure 9). Based on the long time series recorded by PROBA-V since 2013 in the region, the maximum LAI value was assessed between June and July 2019, which is the period selected for our study (Figure A1).
In summary, the higher LAI values (3.1–5.9) are represented by dark blue along the river banks (dense riparian patches on the Arges River) and old deciduous forests. The lowest LAI values in green areas (1.4–1.7) are scattered in the study area and are common in less productive grasslands and agricultural crops. The average LAI values (1.8–3) were recorded in low-lying plains and mixed areas (tall shrubs, wetlands, etc.). The results are reasonable, given that the river banks have increased moisture that supports taller species with superior LAI and that the sparsely vegetated areas are located in agricultural crops and in/near villages. Changes in vegetation richness and abundance can be spatiotemporally monitored through the vegetation indices provided by the spectral bands of Sentinel 2A imagery.
Overall, the relationship between NDVI and LAI is generally robust when the LAI reaches values between 0 and 3, and this relationship starts to weaken as the LAI value increases (especially between 3 and 4) [90,91].
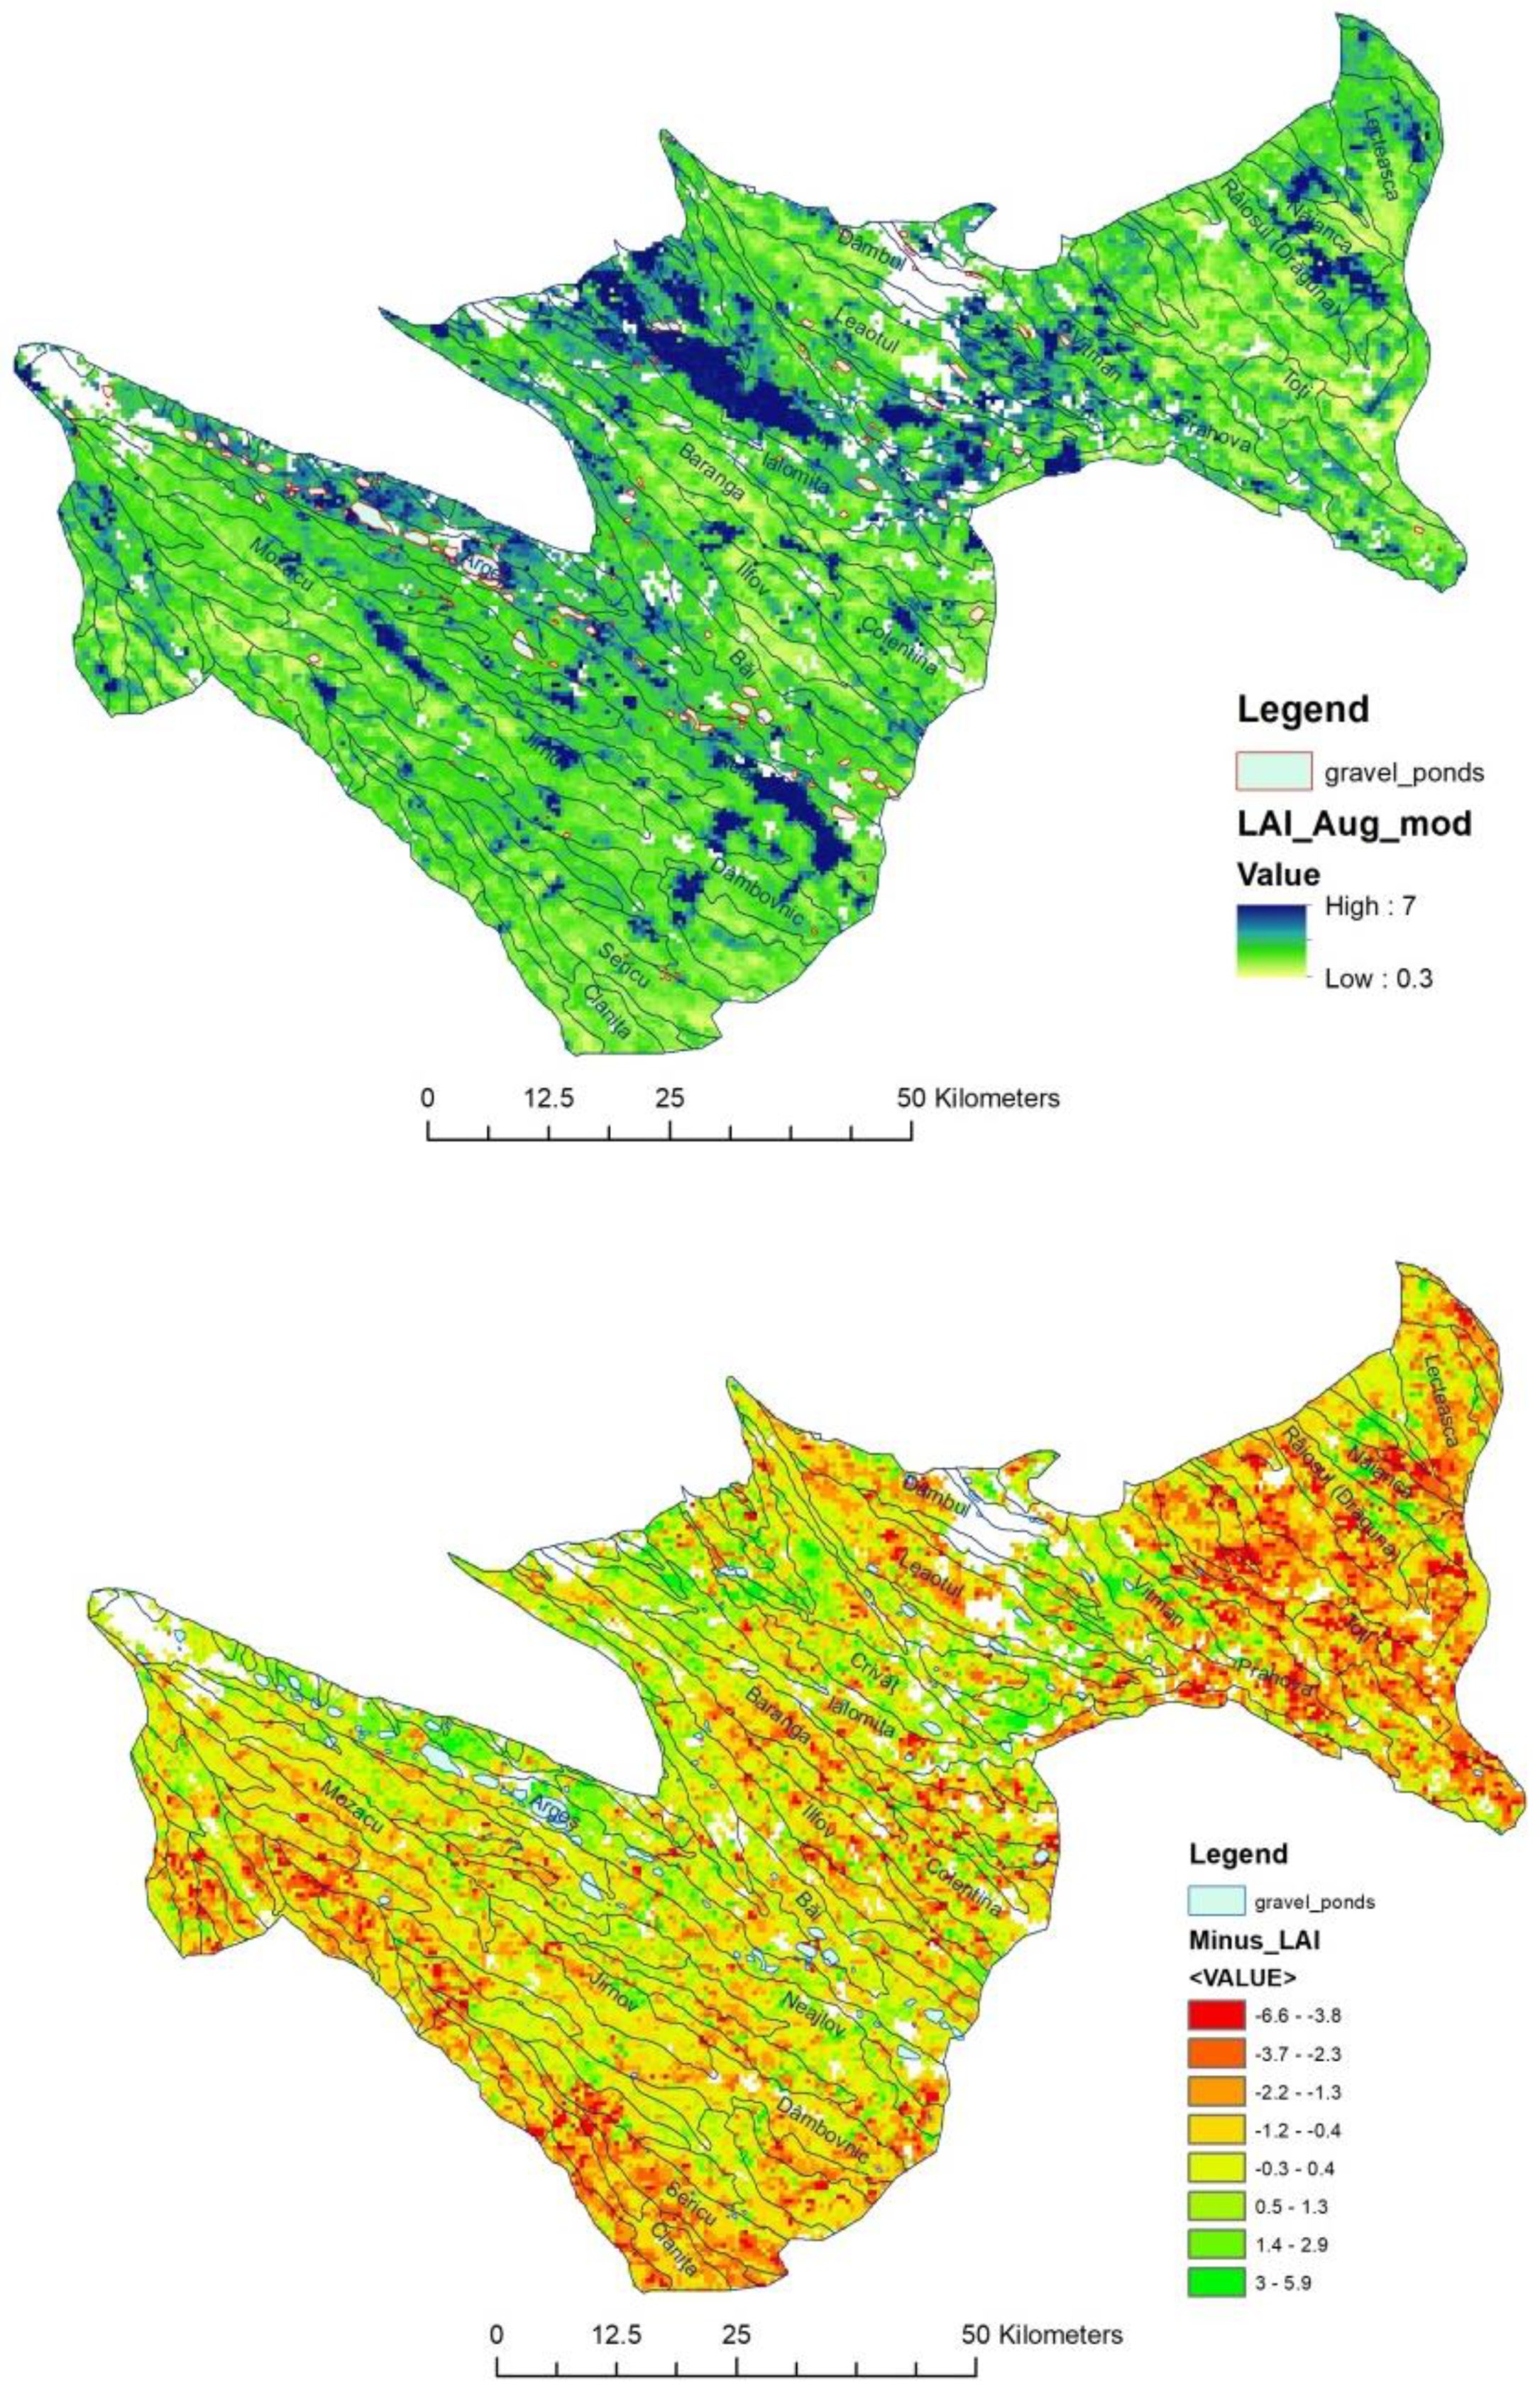
Another well-established method for LAI assessment through remote sensing is the use of the MODIS LAI product. In the study region, according to the processed datasets, the maximum LAI in the region was 7 for both considered moments, occurring in the areas with deciduous forests (Figure 10). The GIS analysis showed differences between the two considered moments assessed with the Minus function in the ArcGIS environment. The major reductions in LAI between June and August were visible, especially in agricultural lands where crops have been harvested or there is a predominance of the senescence/maturation processes. Lower reductions or even increases in LAI were located near rivers where the riparian vegetation is present, including the abandoned pit lakes. On the other hand, the LAIs of deciduous forests increased from June to August. Considering that previous temporal comparisons indicated that all MODIS products assess the seasonality accurately in different biomes [92], the results of the analysis well captured the LAI dynamics in the study region. The calculations are useful to create a secondary database for each low-order subbasin for better management of the vegetation, including areas around the pit lakes if present in their land cover structure.
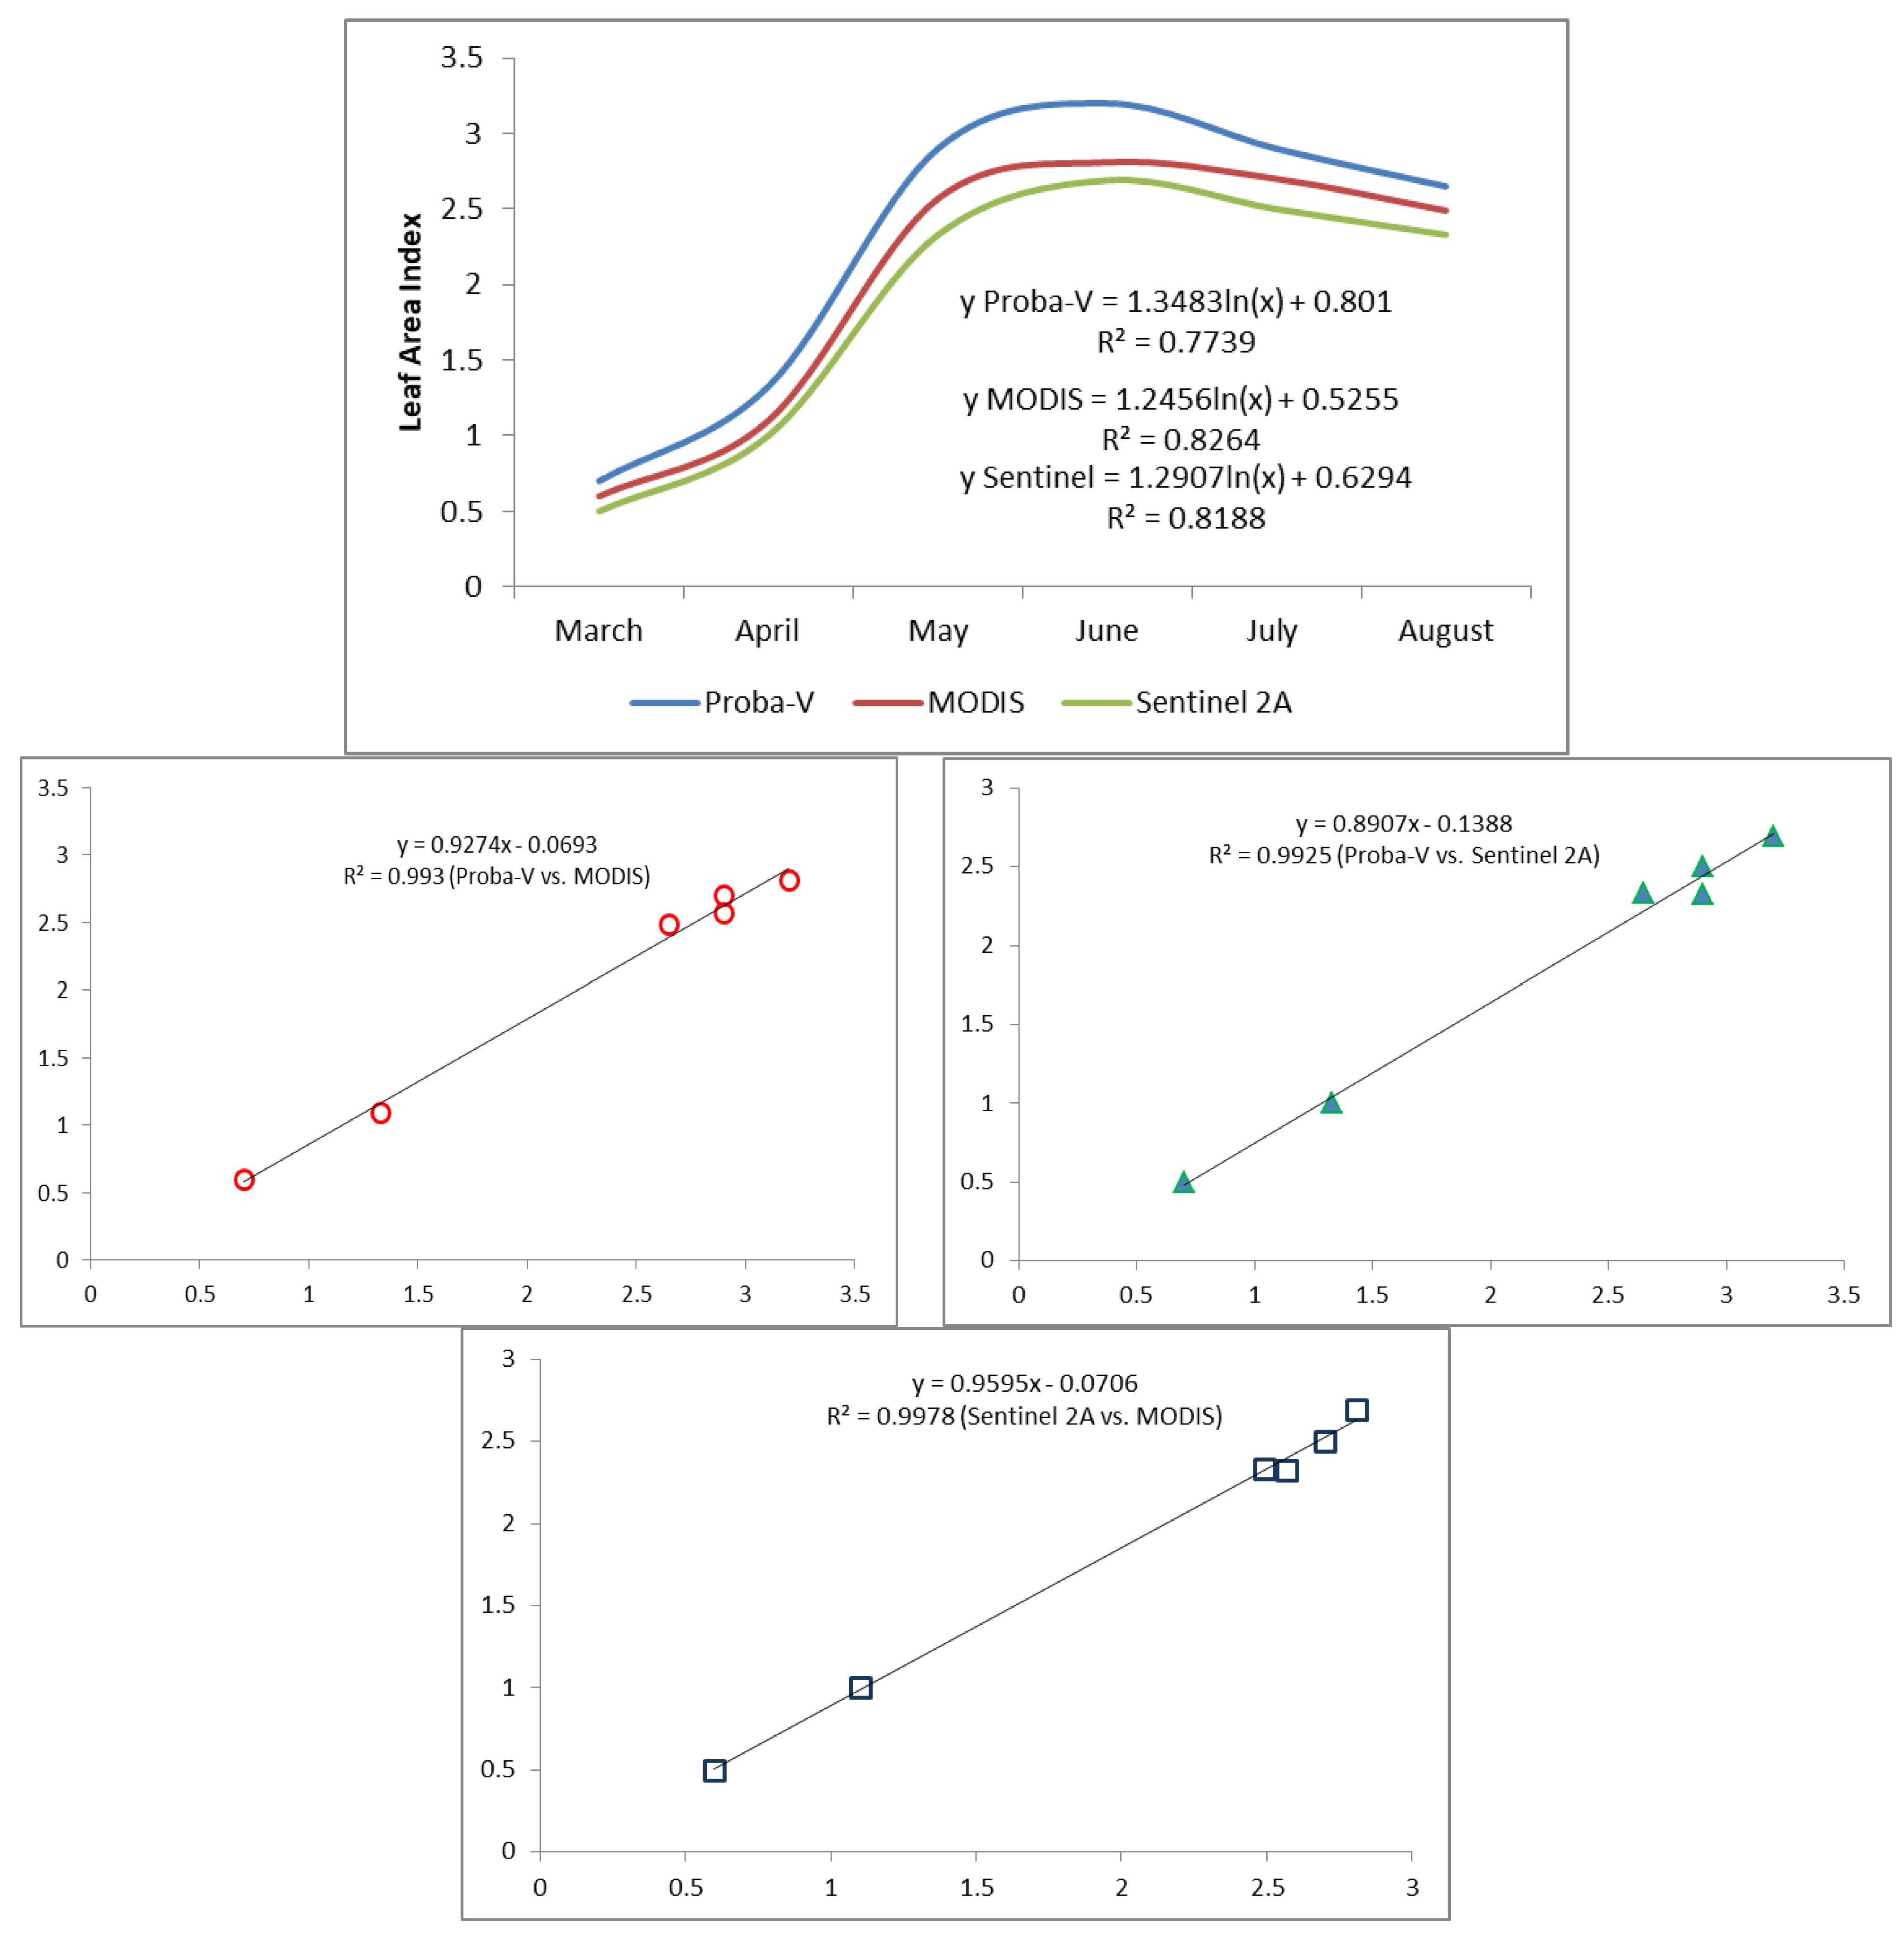
Figure 11 shows a comparison between the indicators extracted for each month using the Geostatistical Analyst Tool for each component subbasin in the entire study area. A similar logarithmic trendline was observed for each time series (PROBA-V, MODIS, Sentinel 2A) with significant R2. More analytical assessments will be performed in future approaches to improve the accuracy of indirect algorithms based on NDVI-LAI regressive models since the Sentinel 2A time series tends to underestimate the averaged integrative LAI between March and August 2019 (1.9; St. Dev. = 0.91) compared to MODIS (2.04; St. Dev. = 0.95) and PROBA-V (2.2; St. Dev. = 1.01). PROBA-V time series contained the maximum integrative values of LAI.
Obviously, a calibration study is required using longer time series, but this was not the main purpose of this work. One of the objectives was to observe how LAI can be estimated by relevant and trustful sources of vegetation assessment from satellite missions. Based on the correlations’ results it can be seen that the trends were similar with close insights according to the field reality in the study area.

4. Conclusions

The creation of a database with small gravel pit lakes is a necessity given the rapidity of their appearance and the increased modifications of landscape changes along the rivers. The advantage of identifying areas with gravel pits using remote sensing is given by free images, good frequency of data series, and high resolution and thus a very good efficiency/cost ratio. However, a smaller surface area of the lakes and a higher density result in a greater possibility of errors in detecting small bodies of water. The comparison of NDWI values obtained using data series from Sentinel 2A and Landsat 8 highlighted the importance of resolution and also showed a larger spectral difference between the identified water bodies and the surrounding land in favor of Sentinel 2A. In addition, the validation of the surface size for a number of 209 lakes, which were chosen at random but were common in all three analyses, showed that the surfaces extracted manually using Google Earth correlate very well with those extracted automatically using Sentinel 2A with R2 = 0.96.
Government organizations, environmental specialists, conservation groups, and researchers could take advantage of LAI maps derived from modern imagery to monitor important biophysical properties of the vegetation near the gravel pits and thus assess the negative impact to ensure sustainable wildlife and critical habitat management near river banks and at the basin level.
One research direction will be the correlation of remote sensing datasets with ground studies on LAI of plant species from the gravel pits using dedicated ceptometers (e.g., Delta-T SunScan Canopy Analysis System) for herbaceous canopies and other systems (such as hemispherical photography for the canopy of trees) to improve the accuracy of indirect algorithms based on NDVI-LAI regressive models. On the other hand, future studies will focus on existing biomes in conjunction with satellite products featuring land cover such as MODIS Land Cover MCD12Q1 Version 6) for improved classification. The final step will consider proper data fusion and downscaling methods to enhance low-resolution data.

Author Contributions

All authors contributed equally to the preparation of this scientific paper. All authors have read and agreed to the published version of the manuscript.

Funding

The research was supported by a grant from the Romanian National Education Ministry, CNFIS-FDI-2021-0240. The publication of this article was supported by 2021 Development Fund of the Babeș-Bolyai University, Cluj-Napoca, Romania.

Institutional Review Board Statement

Not applicable.

Informed Consent Statement

Not applicable.

Data Availability Statement

The data presented in this study are available on request from the corresponding author. The data are not publicly available due to further development of the dataset.

Conflicts of Interest

The authors declare no conflict of interest.

Appendix A

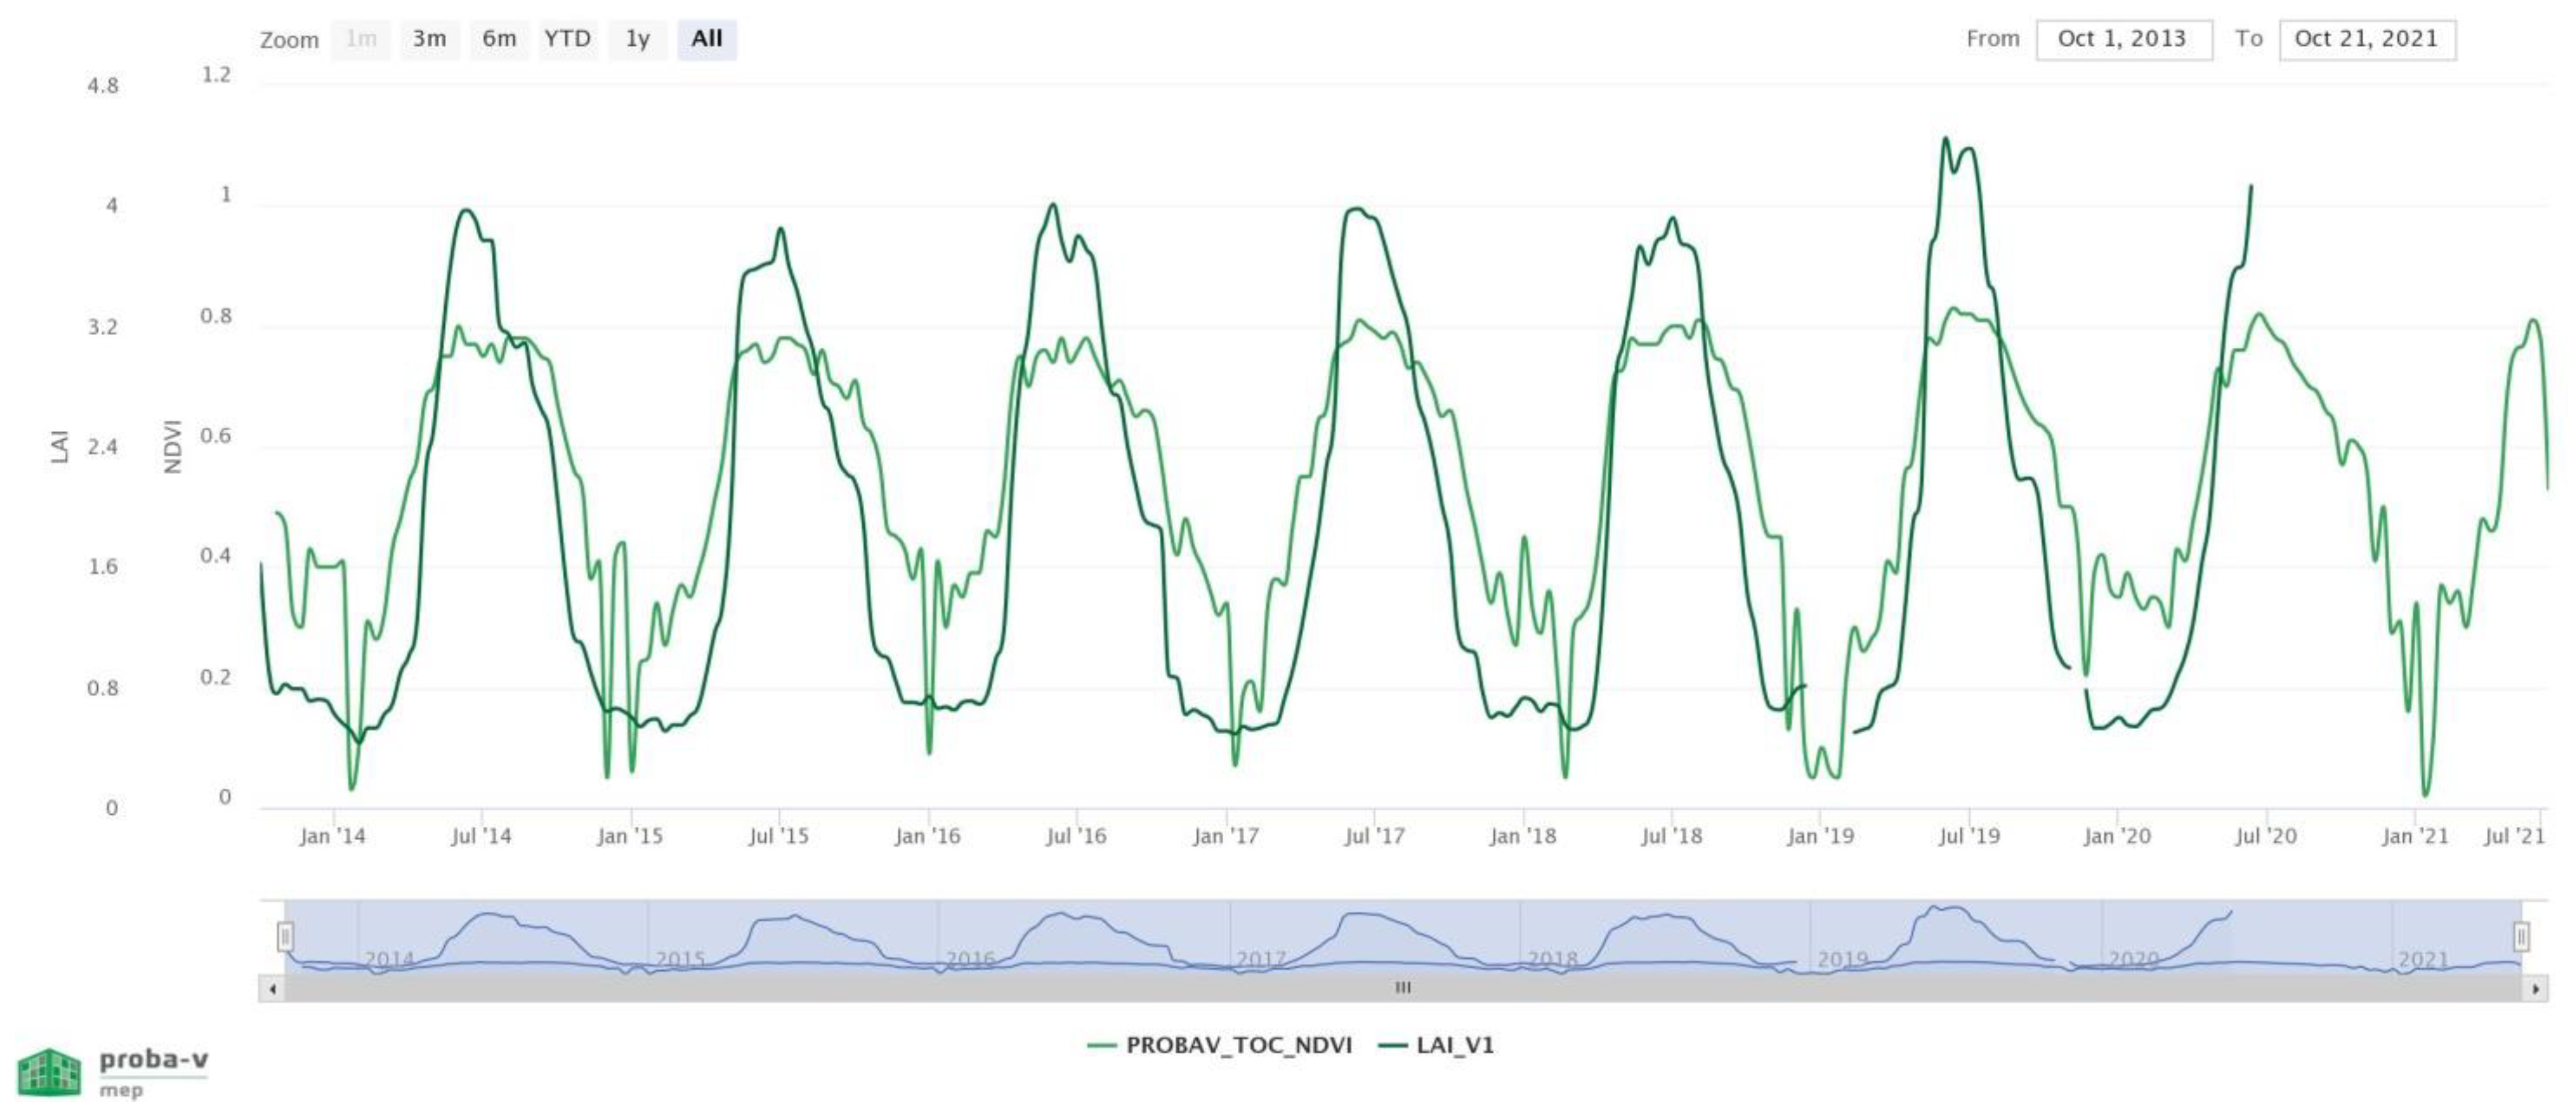
Figure A1. Evolution of leaf area index and NDVI in the area of the Arges River basin characterized by a high density of gravel ponds retrieved from PROBA-V time series application between 2013 and 2021 (VITO NV-https://proba-v-mep.esa.int/applications/time-series-viewer/app/app.html accessed on 27 May 2022).
Water 14 01858 g0a1

References

  1. Liu, S.; Li, W.; Qiao, W.; Wang, Q.; Hu, Y.; Wang, Z. Effect of natural conditions and mining activities on vegetation variations in arid and semiarid mining regions. Ecol. Indic. 2019, 103, 331–345. [Google Scholar] [CrossRef]
  2. Yu, L.; Xu, Y.; Xue, Y.; Li, X.; Cheng, Y.; Liu, X.; Gong, P. Monitoring surface mining belts using multiple remote sensing datasets: A global perspective. Ore Geol. Rev. 2018, 101, 675–687. [Google Scholar] [CrossRef]
  3. DeWitt, J.D.; Chirico, P.G.; Bergstresser, S.E.; Warner, T.A. Multi-scale 46-year remote sensing change detection of diamond mining and land cover in a conflict and post-conflict setting. Remote Sens. Appl. Soc. Environ. 2017, 8, 126–139. [Google Scholar] [CrossRef]
  4. Nixdorf, B.; Rücker, J.; Grüneberg, B. Importance of internal nitrogen recycling on water quality and cyanobacterial biomass in a shallow polymictic lake (Lake Langer See, Germany). In Proceedings of the 3rd International Conference Water Resources and Wetlands, Tulcea, Romania, 8–10 September 2014. [Google Scholar]
  5. Asaeda, T.; Sanjayaa, K. The influence of the gravel sediment shortage in midstream river channels on riparian vegetation colonization. In Proceedings of the 3rd International Conference “Water resources and wetlands”, Tulcea, Romania, 8–10 September 2014. [Google Scholar]
  6. Davies, P.; Lawrence, S.; Turnbull, J.; Rutherfurd, I.; Grove, J.; Silvester, E.; Macklin, M. Mining modification of river systems: A case study from the Australian gold rush. Geoarchaeology 2020, 35, 384–399. [Google Scholar] [CrossRef]
  7. Schultze, M.; Pokrandt, K.H.; Hille, W. Pit lakes of the Central German lignite mining district: Creation, morphometry and water quality aspects. Limnologica 2010, 40, 148–155. [Google Scholar] [CrossRef] [Green Version]
  8. Gastescu, P. Lacurile Din România—Limnologie Regională; Editura Academiei Republicii Socialiste România: Bucharest, Romania, 1971. [Google Scholar]
  9. Mollema, P.N.; Antonellini, M.; Dinelli, E.; Greggio, N.; Stuyfzand, P.J. The influence of flow-through saline gravel pit lakes on the hydrologic budget and hydrochemistry of a Mediterranean drainage basin. Limnol. Oceanogr. 2015, 60, 2009–2025. [Google Scholar] [CrossRef] [Green Version]
  10. Rzymski, P.; Klimaszyk, P.; Marszelewski, W.; Borowiak, D.; Mleczek, M.; Nowiński, K.; Poniedziałek, B. The chemistry and toxicity of discharge waters from copper mine tailing impoundment in the valley of the Apuseni Mountains in Romania. Environ. Sci. Pollut. Res. 2017, 24, 21445–21458. [Google Scholar] [CrossRef] [Green Version]
  11. Cobelas, M.A.; García-Morato, C.R. That twenty years is nothing for gravel-pit limnology. Limnetica 2021, 40, 169–187. [Google Scholar] [CrossRef]
  12. Hupfer, M.; Fischer, P.; Friese, K. Phosphorus retention mechanisms in the sediment of a eutrophic mining lake. Water Air Soil Pollut 1998, 108, 341–352. [Google Scholar] [CrossRef]
  13. Nixdorf, B.; Uhlmann, W.; Lessmann, D. Potential for remediation of acidic mining lakes evaluated by hydrogeochemical modelling: Case study Grünewalder Lauch (Plessa 117, Lusatia/Germany). Limnologica 2010, 40, 167–174. [Google Scholar] [CrossRef] [Green Version]
  14. Weilhartner, A.; Muellegger, C.; Kainz, M.; Mathieu, F.; Hofmann, T.; Battin, T.J. Gravel pit lake ecosystems reduce nitrate and phosphate concentrations in the outflowing groundwater. Sci. Total Environ. 2012, 420, 222–228. [Google Scholar] [CrossRef] [PubMed]
  15. Trevisan, R.; Zancan, S.; Naselli-Flores, L. Phytoplankton assemblages in two gravel-pit lakes with different morphologies. Int. Ver. Für Theor. Und Angew. Limnol. Verh. 2000, 27, 2895–2898. [Google Scholar] [CrossRef]
  16. Søndergaard, M.; Larsen, S.E.; Johansson, L.S.; Lauridsen, T.L.; Jeppesen, E. Ecological classification of lakes: Uncertainty and the influence of year-to-year variability. Ecol. Indic. 2015, 61, 248–257. [Google Scholar] [CrossRef]
  17. Søndergaard, M.; Lauridsen, T.L.; Johansson, L.S.; Jeppesen, E. Gravel pit lakes in Denmark: Chemical and biological state. Sci. Total Environ. 2018, 612, 9–17. [Google Scholar] [CrossRef] [PubMed]
  18. Chamberlain, D.A.; Possingham, H.P.; Phinn, S.R. Decision-making with ecological process for coastal and marine planning: Current literature and future directions. Aquat. Ecol. 2021, 56, 1–19. [Google Scholar] [CrossRef]
  19. Blanchette, M.L.; Lund, M.A. Pit lakes are a global legacy of mining: An integrated approach to achieving sustainable ecosystems and value for communities. Curr. Opin. Environ. Sustain. 2016, 23, 28–34. [Google Scholar] [CrossRef]
  20. McCullough, C.D.; Schultze, M.; Vandenberg, J. Realizing beneficial end uses from abandoned pit lakes. Minerals 2020, 10, 133. [Google Scholar] [CrossRef] [Green Version]
  21. Șerban, G. Anthropo-saline and karsto-saline lakes from Ocna Sugatag–Maramures (Romania). Lakes Reserv. Ponds 2008, 1, 80–89. [Google Scholar]
  22. Sorocovschi, V. The Mineralisation Degree and Chemical Composition of The Lakes in The Transylvanian Plain. Lakes Reserv. Ponds 2009, 3, 13–24. [Google Scholar]
  23. Şerban, G.; Antonie, M.; Roman, C. Remanent lakes formed through the work of kaolin exploiting from Aghireşu (Cluj County). Lakes Reserv. Ponds 2009, 3, 40–52. [Google Scholar]
  24. Bătinaş, R.H. The Lakes from Roşia Montană. Lakes Reserv. Ponds 2009, 3, 85–93. [Google Scholar]
  25. Zaharia, L.; Grecu, F.; Ioana-Toroimac, G.; Neculau, G. Sediment Transport and River Channel Dynamics in Romania-Variability and Control Factors; INTECH Open Access Publisher: London, UK, 2011. [Google Scholar]
  26. Diaconu, D.C.; Bretcan, P.; Peptenatu, D.; Tanislav, D.; Mailat, E. The importance of the number of points, transect location and interpolation techniques in the analysis of bathymetric measurements . J. Hydrol. 2019, 570, 774–785. [Google Scholar] [CrossRef]
  27. Bie, W.; Fei, T.; Liu, X.; Liu, H.; Wu, G. Small water bodies mapped from Sentinel-2 MSI (MultiSpectral Imager) imagery with higher accuracy. Int. J. Remote Sens. 2020, 41, 7912–7930. [Google Scholar] [CrossRef]
  28. Marcaccio, J.V.; Chow-Fraser, P. Mapping options to track invasive Phragmites australis in the Great Lakes basin in Canada. In Proceedings of the 3 rd International Conference “Water resources and wetlands”, Tulcea, Romania, 8–10 September 2014. [Google Scholar]
  29. Luo, N.; Yu, R.; Mao, D.; Wen, B.; Liu, X. Spatiotemporal variations of wetlands in the northern Xinjiang with relationship to climate change. Wetl. Ecol. Manag. 2021, 29, 617–631. [Google Scholar] [CrossRef]
  30. Ongun Sevindik, T.; Erdoğan, M.; Tunca, H.; Güzel, U.; Erturaç, M.K. The effects of inter-annual fluctuations in precipitation, lake surface area, and wind speed on phytoplankton structure in three shallow Mediterranean lakes (Sakarya, Turkey). Aquat. Ecol. 2022, 1–22. [Google Scholar] [CrossRef]
  31. Weithoff, G.; Moser, M.; Kamjunke, N.; Gaedke, U.; Weisse, T. Lake morphometry and wind exposure may shape the plankton community structure in acidic mining lakes. Limnologica 2010, 40, 161–166. [Google Scholar] [CrossRef] [Green Version]
  32. Marszelewski, W.; Dembowska, E.A.; Napiórkowski, P.; Solarczyk, A. Understanding abiotic and biotic conditions in post-mining pit lakes for efficient management: A case study (Poland). Mine Water Environ. 2017, 36, 418–428. [Google Scholar] [CrossRef] [Green Version]
  33. Grenfell, M.C.; Abrahams, E.; Fisher, R.M. Analysis and conceptual geospatial modelling of the intermediary role of wetlands in drylands in post-fire material flux dynamics, Silvermine River catchment, Cape Town. Wetl. Ecol. Manag. 2022, 1–23. [Google Scholar] [CrossRef]
  34. Meybeck, M. Global distribution of lakes. In Physics and Chemistry of Lakes; Lerman, A., Imboden, D.M., Gat, J.R., Eds.; Springer: Berlin/Heidelberg, Germany, 1995; pp. 1–35. [Google Scholar] [CrossRef]
  35. Kalff, J. Limnology: Inland Water Ecosystems, 2nd ed.; Upper Saddle River (NJ): Prentice Hall, NJ, USA, 2002. [Google Scholar]
  36. Lehner, B.; Döll, P. Development and validation of a global database of lakes, reservoirs and wetlands. J. Hydrol. 2004, 296, 1–22. [Google Scholar] [CrossRef]
  37. Downing, J.A.; Prairie, Y.T.; Cole, J.J.; Duarte, C.M.; Tranvik, L.J.; Striegl, R.G.; Middelburg, J.J. The global abundance and size distribution of lakes, ponds, and impoundments. Limnol. Oceanogr. 2006, 51, 2388–2397. [Google Scholar] [CrossRef] [Green Version]
  38. Lewis, W.M. Global primary production of lakes: 19th Baldi Memorial Lecture. Inland Waters 2011, 1, 1–28. [Google Scholar] [CrossRef] [Green Version]
  39. Cael, B.B.; Seekell, D.A. The size-distribution of Earth’s lakes. Sci. Rep. 2016, 6, 1–8. [Google Scholar] [CrossRef] [PubMed] [Green Version]
  40. Verpoorter, C.; Kutser, T.; Seekell, D.A.; Tranvik, L.J. A global inventory of lakes based on high-resolution satellite imagery. Geophys. Res. Lett. 2014, 41, 6396–6402. [Google Scholar] [CrossRef]
  41. Yang, Z.; Li, J.; Zipper, C.E.; Shen, Y.; Miao, H.; Donovan, P.F. Identification of the disturbance and trajectory types in mining areas using multitemporal remote sensing images. Sci. Total Environ. 2018, 644, 916–927. [Google Scholar] [CrossRef] [PubMed]
  42. Ovakoglou, G.; Alexandridis, T.K.; Crisman, T.L.; Skoulikaris, C.; Vergos, G.S. Use of MODIS satellite images for detailed lake morphometry: Application to basins with large water level fluctuations. Int. J. Appl. Earth Obs. Geoinf. 2016, 51, 37–46. [Google Scholar] [CrossRef]
  43. Sikora, M.; Cieśliński, R. Using GIS to discover changes in the local water cycle of wetlands—Case study Poblockie Peatbog. Limnol. Rev. 2016, 16, 155–164. [Google Scholar] [CrossRef] [Green Version]
  44. Diani, K.; Kacimi, I.; ElBelrhiti, H.; Zemzami, M.; Tabyaoui, H.; Masmoudi, L. Remote sensing and sig contribution for the identification of the fracturation influence on the drainage network architecture in the High Ziz River basin, Central High Atlas, Morocco. Limnol. Rev. 2019, 19, 149–158. [Google Scholar] [CrossRef] [Green Version]
  45. McFeeters, S.K. The use of the Normalized Difference Water Index (NDWI) in the delineation of open water features. Int. J. Remote Sens. 1996, 17, 1425–1432. [Google Scholar] [CrossRef]
  46. Wessels, R.; Kargel, J.; Kieffer, H. ASTER measurement of supraglacial lakes in the Mount Everest region of the Himalaya. Ann. Glaciol. 2002, 34, 399–408. [Google Scholar] [CrossRef] [Green Version]
  47. Xu, H.Q. Modification of normalized difference water index (NDWI) to enhance open water features in remotely sensed imagery. Int. J. Remote Sens. 2006, 27, 3025–3033. [Google Scholar] [CrossRef]
  48. Feyisa, G.L.; Meilby, H.; Fensholt, R.; Proud, S.R. Automated water extraction index: A new technique for surface water mapping using Landsat imagery. Remote Sens. Environ. 2014, 140, 23–35. [Google Scholar] [CrossRef]
  49. Wang, S.; Baig, M.H.A.; Zhang, L.; Jiang, H.; Ji, Y.; Zhao, H.; Tian, J. A simple enhanced water index (EWI) for percent surface water estimation using landsat data. IEEE J. Sel. Top. Appl. Earth Obs. Remote Sens. 2015, 8, 90–97. [Google Scholar] [CrossRef]
  50. Malahlela, O.E. Inland waterbody mapping: Towards improving discrimination and extraction of inland surface water features. Int. J. Remote Sens. 2016, 37, 4574–4589. [Google Scholar] [CrossRef]
  51. Wang, Z.; Liu, J.; Li, J.; Zhang, D.D. Multi-SpectralWater Index (MuWI): A native 10-m Multi-SpectralWater Index for accuratewater mapping on Sentinel-2. Remote Sens. 2018, 10, 1643. [Google Scholar] [CrossRef] [Green Version]
  52. Watson, C.S.; King, O.; Miles, E.S.; Quincey, D.J. Optimising NDWI supraglacial pond classification on Himalayan debris-covered glaciers. Remote Sens. Environ. 2018, 217, 414–425. [Google Scholar] [CrossRef]
  53. METER Group. Leaf Area Index (LAI): The Researcher’s Complete Guide. Available online: https://www.metergroup.com/en/meter-environment/education-guides/researchers-complete-guide-leaf-area-index-lai (accessed on 14 May 2022).
  54. Dunea, D.; Dincă, N. Improving land utilization using intensive grass-clover mixtures in forage production systems. Rom. Agric. Res. 2014, 31, 147–158. [Google Scholar]
  55. Myneni, R.; Knyazikhin, Y.; Park, T. 2015. MCD15A2H MODIS/Terra + Aqua Leaf Area Index/FPAR 8-day L4 Global 500 m SIN Grid V006 [Data Set]. NASA EOSDIS Land Processes DAAC. Available online: https://lpdaac.usgs.gov/products/mcd15a2hv006/ (accessed on 13 May 2022). [CrossRef]
  56. Asner, G.P.; Scurlock, J.M.; AHicke, J. Global synthesis of leaf area index observations: Implications for ecological and remote sensing studies. Glob. Ecol. Biogeogr. 2003, 12, 191–205. [Google Scholar] [CrossRef] [Green Version]
  57. Bagli, S.; Soille, P. Automatic delineation of shoreline and lake boundaries from Landsat satellite images. In Proceedings of the Initial ECO-IMAGINE GI and GIS for Integrated Coastal Management, Seville, Spain, 13–15 May 2004. [Google Scholar]
  58. Bardossy, A.; Schmidt, F. GIS approach to scale issues of perimeter-based shape indices for drainage basins. Hydrol. Sci. J. 2002, 47, 931–942. [Google Scholar] [CrossRef]
  59. Kopeć, D.; Sabat-Tomala, A.; Michalska-Hejduk, D.; Jarocińska, A.; Niedzielko, J. Application of airborne hyperspectral data for mapping of invasive alien Spiraea tomentosa L.: A serious threat to peat bog plant communities. Wetl. Ecol. Manag. 2020, 28, 357–373. [Google Scholar] [CrossRef] [Green Version]
  60. Mollema, P.N.; Antonellini, M. Water and (bio)chemical cycling in gravel pit lakes: A review and outlook. Earth Sci. Rev. 2016, 159, 247–270. [Google Scholar] [CrossRef]
  61. Gravelius, H. Grundrifi Der Gesamten Gewcisserkunde; Band I: Flufikunde Compendium of Hydrology, Rivers; Goschen: Berlin, Germany, 1914; Volume I. (In German) [Google Scholar]
  62. Hutchinson, G.E. A treatise on limnology. In Geography, Physics and Chemistry; Wiley: New York, NY, USA, 1957; Volume 1. [Google Scholar]
  63. Miller, V.C. A Quantitative Geomorphic Study of Drainage Basin Characteristics in the Clinch Mountain Area, Virginia and Tennessee; Project No. 389–042, Tech. Report No. 3; Office of Naval Research: Geography, Branch, 1953; pp. 1–30. [Google Scholar]
  64. Chorlev, R.J.; Malm, D.E.G.; Poaorzelski, H.A. A new standard for estimating basin shape. Am. J. Sei. 1957, 255, 138–141. [Google Scholar]
  65. Verpoorter, C.; Kutser, T.; Tranvik, L. Automated mapping of water bodies using Landsat multispectral data. Limnol. Oceanogr. Methods 2012, 10, 1037–1050. [Google Scholar] [CrossRef]
  66. Schumm, S.A. The evolution of drainage systems and slopes in badlands at Perth Amboy, New Jersey. Bull. Geol. Soc. Am. 1956, 67, 597–646. [Google Scholar] [CrossRef]
  67. Horton, R.E. Drainage-basin characteristics. Trans. Am. Geophys. Union 1932, 13, 350–361. [Google Scholar] [CrossRef]
  68. Roche, M. Hydrologie de Surface; Gauthier-Villars et ORSTOM: Paris, France, 1963. (In French) [Google Scholar]
  69. Borowiak, D.; Nowiński, K.; Grabowska, K. A new bathymetric survey of the Suwałki Landscape Park lakes. Limnol. Rev. 2016, 16, 185–197. [Google Scholar] [CrossRef] [Green Version]
  70. Langat, P.K.; Kumar, L.; Koech, R. Monitoring river channel dynamics using remote sensing and GIS techniques. Geomorphology 2019, 325, 92–102. [Google Scholar] [CrossRef]
  71. Hachemi, K.; Grecu, F.; Ioana-Toroimac, G.; Grigorie-Omrani, Ş.; Ozer, A.; Kuzucuoglu, C. The utility of morphometric parameters extracted from SAR radar images in the monitoring of the dynamics of the Danube Island system, Giurgiu-Călăraşi sector, Romania. Int. J. Des. Nat. Ecodynamics 2021, 16, 13–19. [Google Scholar] [CrossRef]
  72. Rouse, J.W.; Haas, R.H.; Schell, J.A.; Deering, D.W. Monitoring vegetation systems in the Great Plains with ERTS. In Proceedings of the Third Earth resources Technology Satellite-1 Symposium, Greenbelt: NASA SP-351, Washington, DC, USA; 1974; pp. 301–317. [Google Scholar]
  73. Gitelson, A.A.; Merzlyak, M.N. Remote Sensing of Chlorophyll Concentration in Higher Plant Leaves. Adv. Space Res. 1998, 22, 689–692. [Google Scholar] [CrossRef]
  74. Fan, L.; Gao, Y.; Brück, H.; Bernhofer, C. Investigating the relationship between NDVI and LAI in semi-arid grassland in Inner Mongolia using in-situ measurements. Theor. Appl. Climatol. 2009, 95, 151–156. [Google Scholar] [CrossRef]
  75. Jinling, S.; Jindi, W.; Zhiqiang, X.; Yuetiing, X. The method on generating LAI production by fusing BJ-1 remote sensing data and modis LAI product. IEEE Int. Geosci. Remote Sens. Symp. 2009, 4, IV-825–IV-828. [Google Scholar] [CrossRef] [Green Version]
  76. Hakanson, L. Lakes: Form and Function; The Blackburn Press: Caldwell, NJ, USA, 2004. [Google Scholar]
  77. Piasecki, A.; Marszelewski, W. Dynamics and consequences of water level fluctuations of selected lakes in the catchment of the Ostrowo-Gopło Channel. Limnol. Rev. 2014, 14, 187–194. [Google Scholar] [CrossRef] [Green Version]
  78. Emmrich, M.; Schälicke, S.; Hühn, D.; Lewin, C.; Arlinghaus, R. No differences between littoral fish community structure of small natural and gravel pit lakes in the northern German lowlands. Limnologica 2014, 46, 84–93. [Google Scholar] [CrossRef]
  79. Muellegger, C.; Weilhartner, A.; Battin, T.J.; Hofmann, T. Positive and negative impacts of five Austrian gravel pit lakes on groundwater quality. Sci. Total Environ. 2013, 443, 14–23. [Google Scholar] [CrossRef] [PubMed]
  80. Radulescu, C.; Pohoata, A.; Bretcan, P.; Tanislav, D.; Stihi, C.; Chelarescu, E. Quantification of major ions in groundwaters using analytical techniques and statistical approaches. Rom. Rep. Phys. 2017, 69, 705. [Google Scholar]
  81. Radulescu, C.; Bretcan, P.; Pohoata, A.; Tanislav, D.; Stirbescu, R.M. Assessment of drinking water quality using statistical analysis: A case study. Rom. J. Phys 2016, 61, 1604–1616. [Google Scholar]
  82. Popa, C.L.; Bretcan, P.; Radulescu, C.; Carstea, E.M.; Tanislav, D.; Dontu, S.I.; Dulama, I.D. Spatial distribution of groundwater quality in connection with the surrounding land use and anthropogenic activity in rural areas. Acta Montan. Slovaca 2019, 24, 73–87. [Google Scholar]
  83. Dunea, D.; Tanislav, D.; Stoica, A.; Bretcan, P.; Muratoreanu, G.; Frasin, L.N.; Alexandrescu, D.; Iliescu, N. ECO-PRACT: A project for developing the research competences of students regarding the monitoring of floristic composition in mountain grasslands. J. Sci. Arts 2018, 18, 225–238. [Google Scholar]
  84. Dunea, D.; Bretcan, P.; Tanislav, D.; Serban Gh Teodorescu, R.; Iordache, S.; Petrescu, N.; Tuchiu, E. Evaluation of Water Quality in Ialomita River Basin in Relationship with Land Cover Patterns. Water 2020, 12, 735. [Google Scholar] [CrossRef] [Green Version]
  85. Alexe, M.; Şerban, G. The evolution of heliotherm phenomenon in the karstosaline lake Ursu from Sovata, Romania. Carpathian J. Earth Environ. Sci. 2014, 9, 103–111. [Google Scholar]
  86. Piasecki, A.; Rajmund, S. Changing the geometry of basins and water resources of Lakes Gopło and Ostrowskie under the influence of anthropopressure. Limnol. Rev. 2014, 14, 33–43. [Google Scholar]
  87. Dunea, D.; Bretcan, P.; Purcoi, L.; Tanislav, D.; Serban, G.; Neagoe, A.; Iordache, V.; Iordache, S. Effects of riparian vegetation on evapotranspiration processes and water quality of small plain streams. Ecohydrol. Hydrobiol. 2021, 21, 629–640. [Google Scholar] [CrossRef]
  88. Dunea, D.; Moise, V. Artificial neural networks as support for leaf area modelling in crop canopies. In Proceedings of the 12th WSEAS International Conference on Computers, Heraklion, Greece, 23–25 July 2008; pp. 440–446. [Google Scholar]
  89. He, Y.; Guo, X.; Wilmshurst, J. Studying Mixed Grassland Ecosystems I: Suitable Hyperspectral Vegetation Indices. Can. J. Remote Sens. 2006, 32, 98–107. [Google Scholar] [CrossRef]
  90. Romano, G.; Ricci, G.F.; Gentile, F. Influence of Different Satellite Imagery on the Analysis of Riparian Leaf Density in a Mountain Stream. Remote Sens. 2020, 12, 3376. [Google Scholar] [CrossRef]
  91. Ricci, G.F.; Romano, G.; Leronni, V.; Gentile, F. Effect of check dams on riparian vegetation cover: A multiscale approach based on field measurements and satellite images for Leaf Area Index assessment. Sci. Total Environ. 2019, 657, 827–838. [Google Scholar] [CrossRef] [PubMed]
  92. Yan, K.; Park, T.; Yan, G.; Liu, Z.; Yang, B.; Chen, C.; Nemani, R.R.; Knyazikhin, Y.; Myneni, R.B. Evaluation of MODIS LAI/FPAR Product Collection 6. Part 2: Validation and Intercomparison. Remote Sens. 2016, 8, 460. [Google Scholar] [CrossRef] [Green Version]
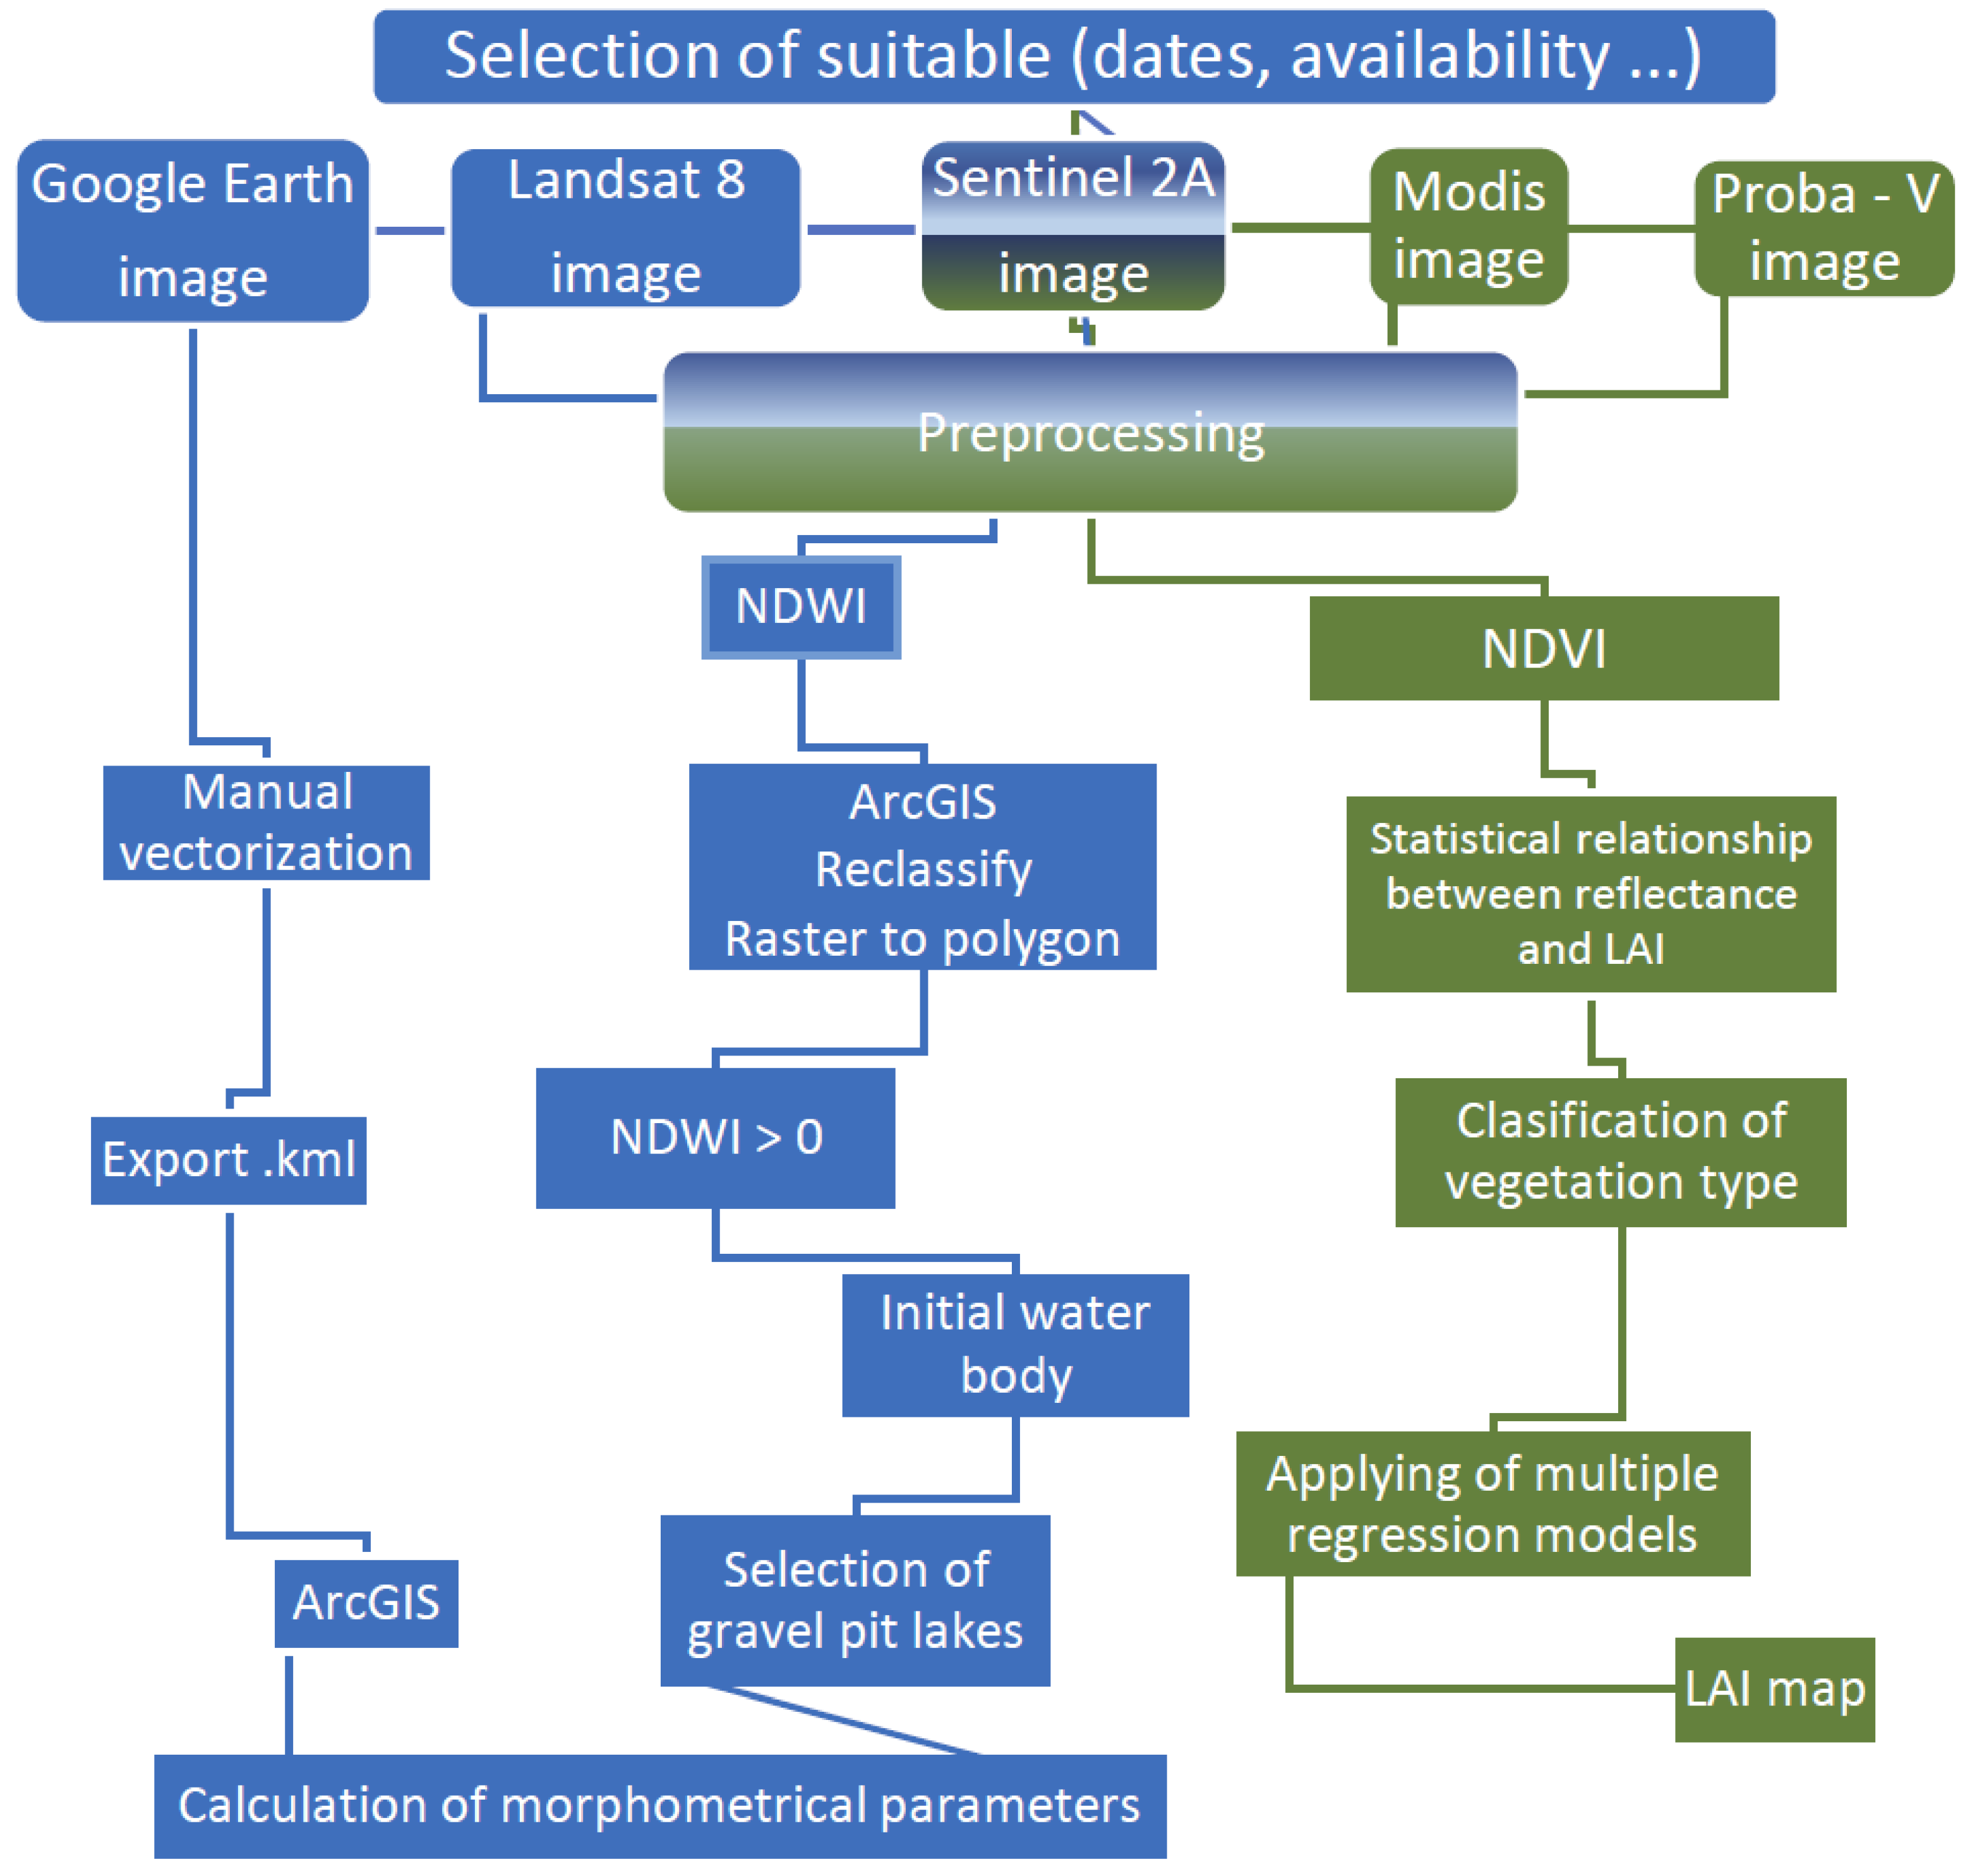
Figure 1. Flowchart of producing NDWI, NDVI, and LAI.
Water 14 01858 g001
Figure 2. Study area (contact of Romanian Plain with the Sub-Carpathian region) showing the gravel pit lakes assessed using various spatial sources (Google Earth, Landsat 8, and Sentinel 2A). The study area (a); the total number (b); surface (c); Google Earth, Landsat 8, and Sentinel 2A (d).
Water 14 01858 g002
Figure 3. Density of gravel pit lakes in the study area (pit lakes/km2).
Water 14 01858 g003
Figure 4. Correlations between the surfaces of lakes calculated automatically and manually.
Water 14 01858 g004
Figure 5. Total cumulative lake area (left) and lake area by categories (right).
Water 14 01858 g005
Figure 6. Correlations between lake area and shoreline length.
Water 14 01858 g006
Figure 7. Distribution of the number of lakes according to the size of the surface (left) and distribution of the number of lakes on the main rivers according to the distribution on the banks (center) and the size of the surface (right).
Water 14 01858 g007
Figure 8. Leaf area index obtained from Sentinel 2A images in June and August 2019 and the resulting difference assessed with the Diff function in GIS environment (LAI values from 0.1 to 1.3 were excluded to keep only relevant vegetation).
Water 14 01858 g008aWater 14 01858 g008b
Figure 9. Vegetation indices (LAI and NDVI) provided by the PROBA-V satellite in the area of the Arges River basin during the vegetation season in 2019 (data from PROBA-V time series application VITO NV (https://proba-v-mep.esa.int/applications/time-series-viewer/app/app.html accessed on 27 May 2022).
Water 14 01858 g009
Figure 10. Leaf area index provided by MODIS in June and August 2019 and the resulting calculated difference between months; the overlapped layer presents the delineation of each subbasin.
Water 14 01858 g010aWater 14 01858 g010b
Figure 11. Comparison between the LAI datasets for the study areas during March–August 2019 and the corresponding correlations.
Water 14 01858 g011
Table 1. Spectral and spatial characteristics of the Landsat 8 and Sentinel 2A.
Landsat 8Sentinel 2A
Type of BandsBand No.Wavelength (nm)Spatial Resolution (m)Type of BandsBand No.Wavelength (nm)Spatial Resolution (m)
Coastal/Aerosol1433–45330Coastal Aerosol1433–45360
Blue2450–51530Blue2458–52310
Green3525–60030Green3543–57810
Red4630–68030Red4650–68010
Near Infrared5845–88530Red Edge 15698–71320
Short Wavelength
Infrared (SWIR 1)
61560–166030Red Edge 26733–74820
Short Wavelength
Infrared (SWIR 2)
72100–230030Red Edge 37773–79320
Panchromatic8500–68015NIR8785–90010
NIR Narrow8a855–87520
Cirrus (SWIR)91360–139030Water Vapor9935–95560
Long Wavelength Infrared101030–1130100SWIR/Cirrus101360–139060
Long Wavelength Infrared111150–1250100SWIR 1111566–165520
SWIR 2122100–228020
Table 2. Statistical parameters of gravel pit lakes and morphometric indices.
Landsat 8
(4.4.2019)
Google Earth
(Spring 2019)
Sentinel 2A
(26.4.2019)
Landsat 8
(4.4.2019)
Google Earth
(Spring 2019)
Sentinel 2A
(26.4.2019)
Number of Lakes406436736Number of Lakes406436736
Area (m2)Maximum 333,978246,955240,122Morton index spreading (MIS)Maximum 2.411.811.27
Minimum1243564Minimum0.090.030.02
Average22,081.3716,227.0610,505.3Average0.550.430.43
St.dev.43,172.4227,665.9024,715.73St.dev.0.270.230.19
Total 8,965,0367,075,0017,731,899
Perimeter/shore line (m)Maximum 336334303244Form factor (Ff)Maximum 1.891.421
Minimum542537Minimum0.070.030.01
Average547.01527.23334.51Average0.430.330.34
St.dev.632.06487.64475.64St.dev.0.210.180.15
Total 222,088227,288246,206
Length (m)Maximum 9671170929Lake compacity (Lco)Maximum 12.7532.1563.13
Minimum22910Minimum0.520.701
Average181.16183.66117.77Average2.904.453.67
St.dev.185.65157.30151.29St.dev.1.554.203.04
Maximum width (m)Maximum 608477473Area/lake length ratio (RA/L)Maximum1.371.191
Minimum1159Minimum0.270.170.12
Average101.3283.0957.42Average0.640.550.57
St.dev.106.0283.3979.07St.dev.0.150.150.12
Shoreline development index (SDI)Maximum 2.383.293.43Lake elongation (Le)Maximum 1.551.341.12
Minimum1.071.031.07Minimum0.310.190.14
Average1.361.501.39Average0.720.630.64
St.dev.0.190.440.25St.dev.0.170.170.14
Lake circularity (Lci)Maximum 0.860.920.86Length/maximum breadth ratio (RL/Bmax)Maximum 8.521.1721.38
Minimum0.170.090.08Minimum0.980.920.92
Average0.560.520.54Average1.783.132.14
St.dev.0.120.200.13St.dev.0.952.971.67
Lemniscate ratio (K)Maximum 10.0125.2449.55
Minimum0.410.550.78
Average2.273.492.88
St.dev.1.223.302.38
Table 3. The main statistical parameters of the gravel pit lakes, by physical-geographical subunits, obtained using Sentinel 2A image processing.
Name of Physico-Geographical UnitName of SubunitArea (km2)RiverGravel Pit Lakes from The Study Area
Number of LakesSurface Average (m2)Surface Total (m2)Average Shoreline Length (m)Total Shoreline Length (m)Length Average (m)Maximum Width
Average (m)
Pitesti plainLunca Argesului218.78Arges left riverbank1146724.94766,643263.4530,03395.2240.48
Pitesti723.75Arges right riverbank103406.3034,063193.20193274.9037.30
Total942.53 124
(16.84%)
6457.30800,706257.7831,96593.5840.22
Gavanu plainGavanu 1755.82Neajlov 567662.00429,072283.5315878111.1043.74
Arges right riverbank4011,896.65475,866405.5316,221145.6870.53
Glavacioc7149.57104755.2838721.0014.14
Total1755.82 103
(13.99%)
9795.97905,985315.3932,486118.4052.13
Targoviste–Ploiesti plainTargoviste 405.33Dambovita left riverbank 174838.8282,260266.65453387.4752.65
Dambovita right riverbank55476.0027,380366.001830119.4071.00
Ialomita right riverbank52405.4012,027180.0090063.8038.40
Cricovului 294.36Ialomita left riverbank9587.11528480.7772728.0018.77
Cricov right riverbank9716.446448116.88105243.5523.77
Ploiesti 672.80Cricov left riverbank164234.3867,750244.13390693.3138.56
Prahova left riverbank5311,697.32619,958306.1716,227115.6462.53
Prahova right riverbank15759.005759431431144.0060.00
Teleajen left riverbank2511,153.12278,828377.009425141.0763.76
Teleajen right riverbank122684.6632,216179.58215569.1640,092
Total1372.49 152
(20.65%)
7486.251,437,910270.9641,18699.8051.98
Titu–Sarata plainTitu1072.28Arges left riverbank30211,867.323,583,931357.52107,917122.8259.12
Ialomita left riverbank2425718.21617,237646.1315,507200.46121.08
Puchenilor (Gherghitei)432.13Ialomita left riverbank635,875.83215,255779.664678273.66150.50
Prahova left riverbank1224,816.25297,795532.426389178.5097.08
Sarata 729.99Ialomita left riverbank312,494.0037,482476.331429156.00102.66
Total2234.4 347
(47.14%)
13,693.664,751,700391.85135,920133.0166.67
Istritei plainValea Calugareasca244.45Teleajen left riverbank10
(1.35%)
13559.80135,598459.504595155.6086.70
Total study area73610,505.37,731,899334.51246,152117.7757.42
Table 4. Matrix of correlation based on Sentinel 2A (4/26/2019).
AreaPerimeterLegthMaximum
Width
SDILciKMISFfLcoRA/LLeRL/Bmax
Area1
Perimeter0.911
Legth0.860.961
MaximumWidth0.890.880.821
SDI0.260.510.480.221
Lci−0.21−0.41−0.39−0.15−0.921
K−0.020.100.19−0.080.49−0.491
MIS0.03−0.10−0.200.08−0.540.67−0.561
Ff0.03−0.10−0.200.08−0.540.67−0.5611
Lco−0.020.100.19−0.080.49−0.491−0.56−0.561
RA/L0.03−0.12−0.230.10−0.610.72−0.670.980.98−0.671
Le0.03−0.12−0.230.10−0.610.72−0.670.980.98−0.6711
RL/Bmax0.060.240.37−0.040.58−0.530.69−0.56−0.560.69−0.67−0.671
Confidence level 95%.
Publisher’s Note: MDPI stays neutral with regard to jurisdictional claims in published maps and institutional affiliations.