
The Runoff in the Upper Taohe River Basin and Its Responses to Climate Change


Abstract
:1. Introduction
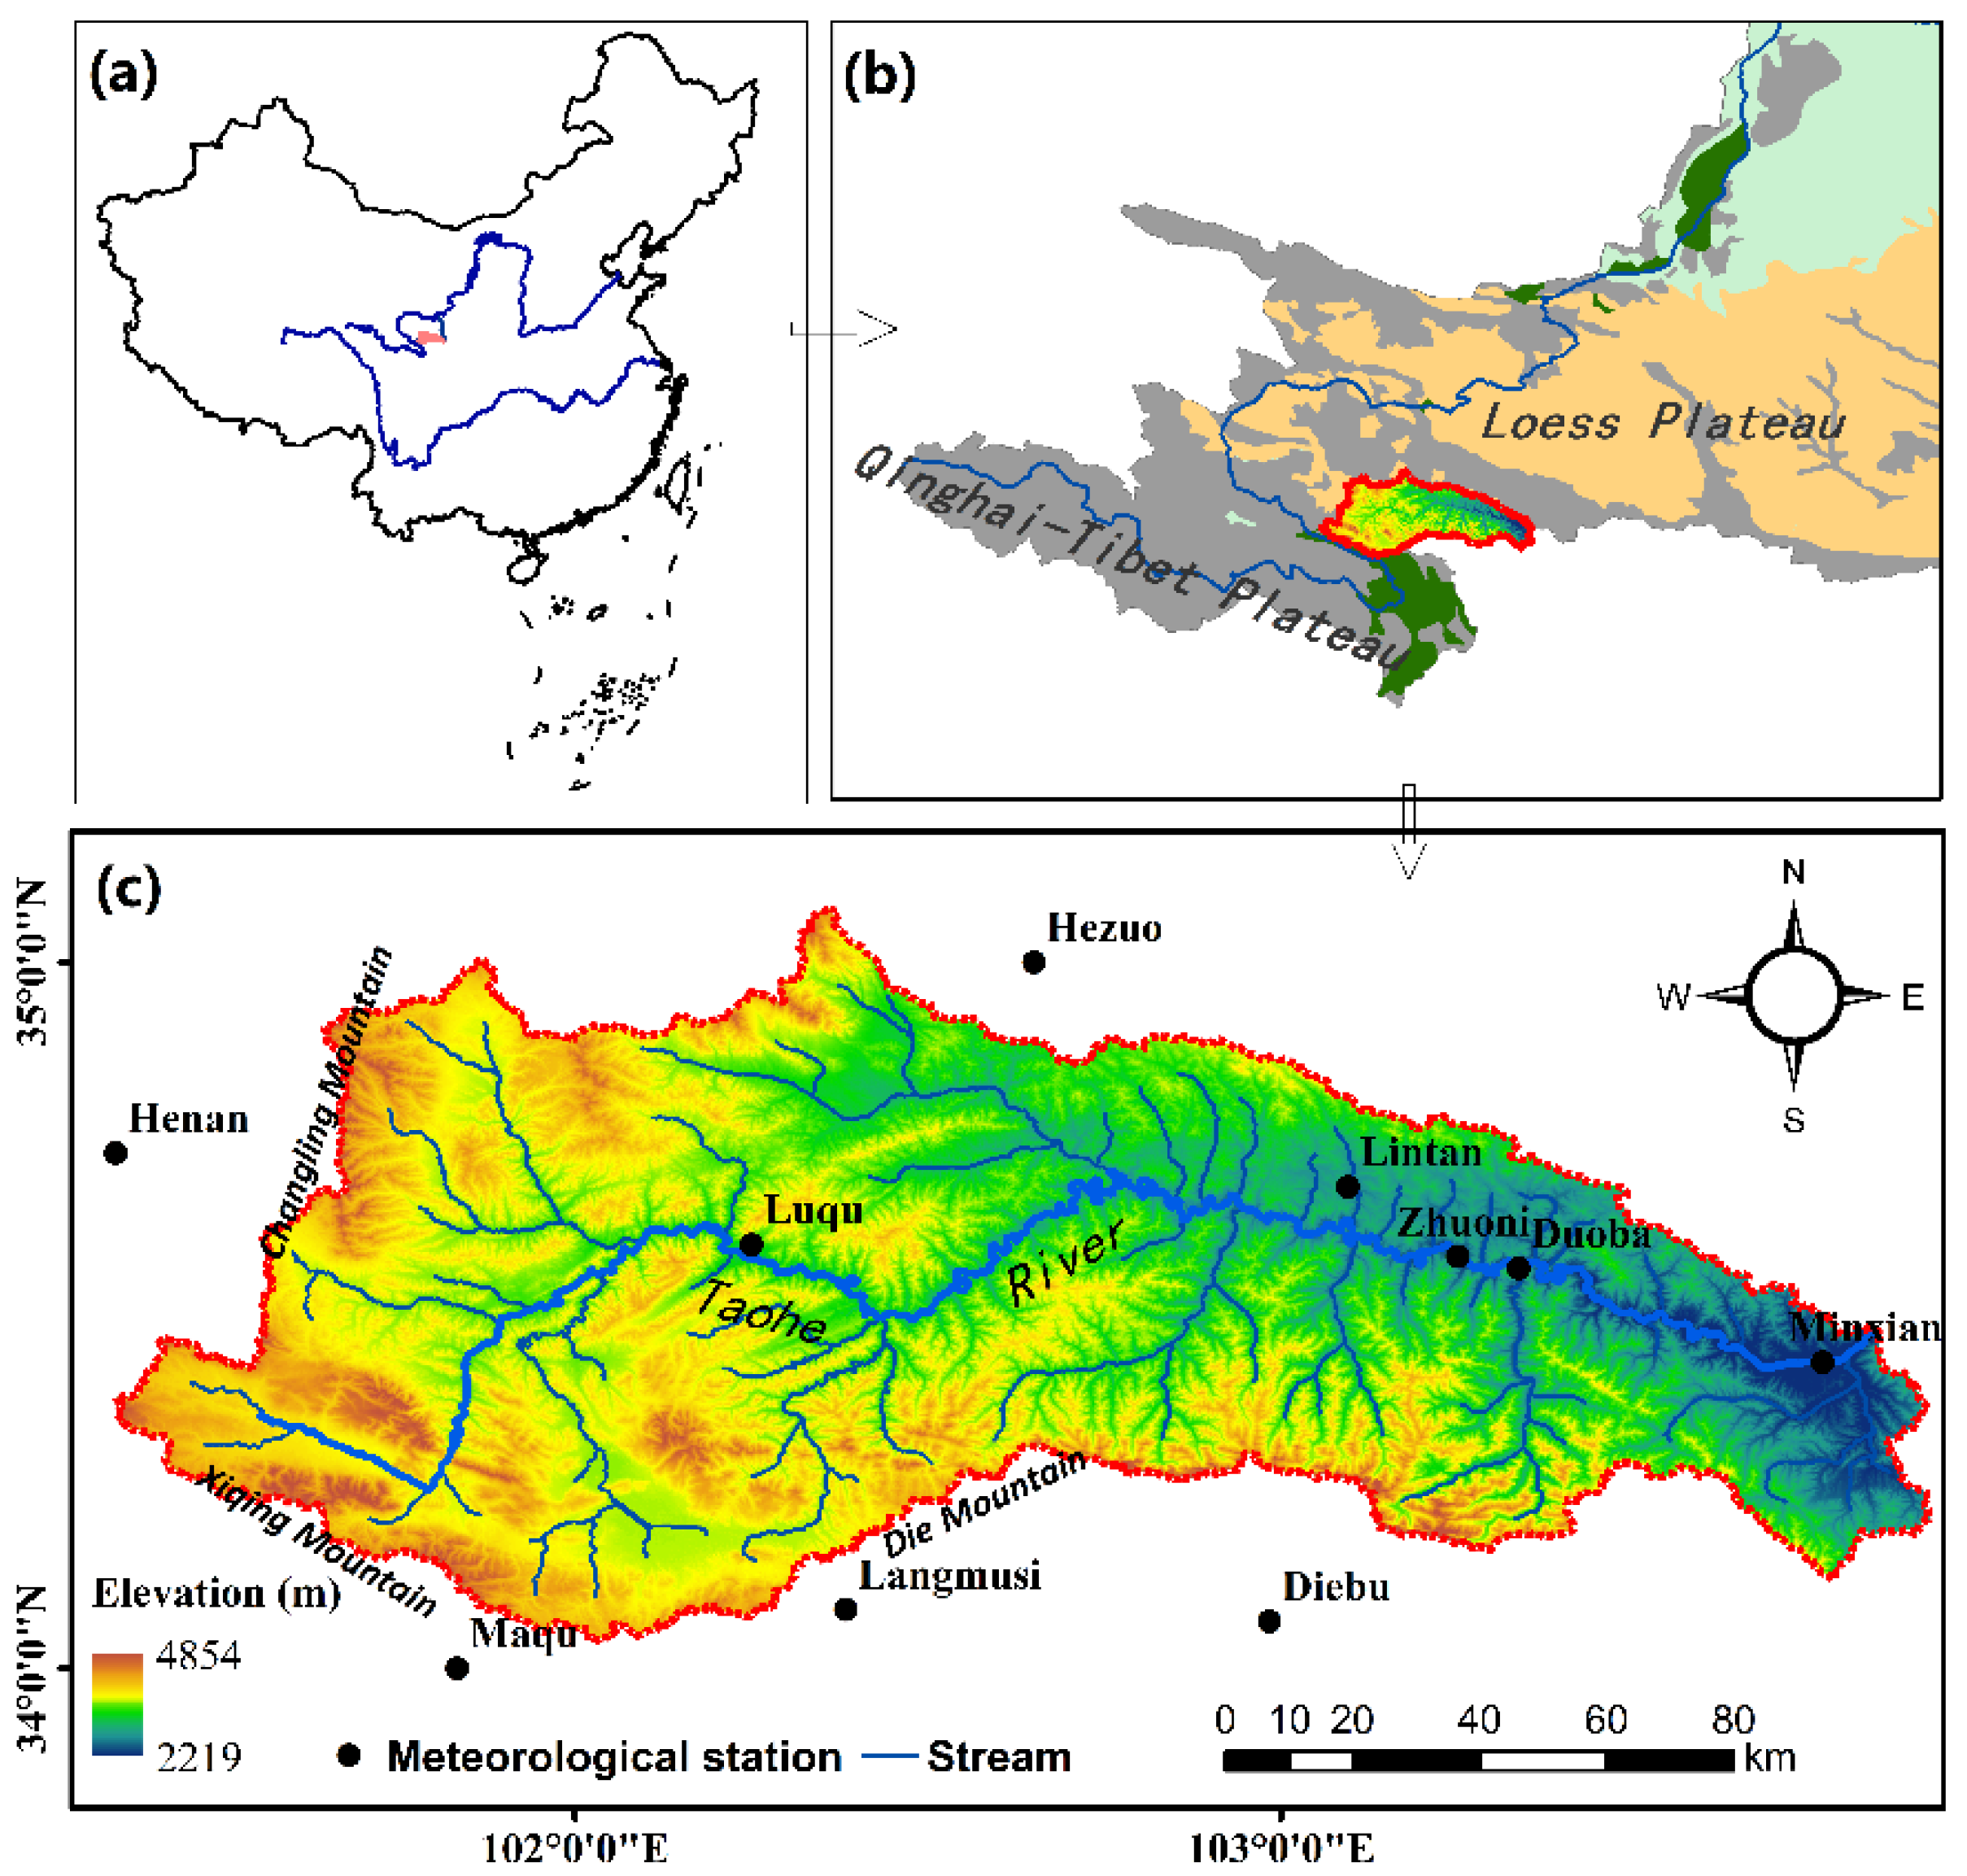
2. Study Area
3. Data and Methods
3.1. Climate Change Scenario Data
3.2. Meteorological and Hydrological Data
3.3. SWAT Model Construction Data
3.4. Evaluation Indicators
4. Result Analysis
4.1. Climate Change Prediction under Different Scenarios
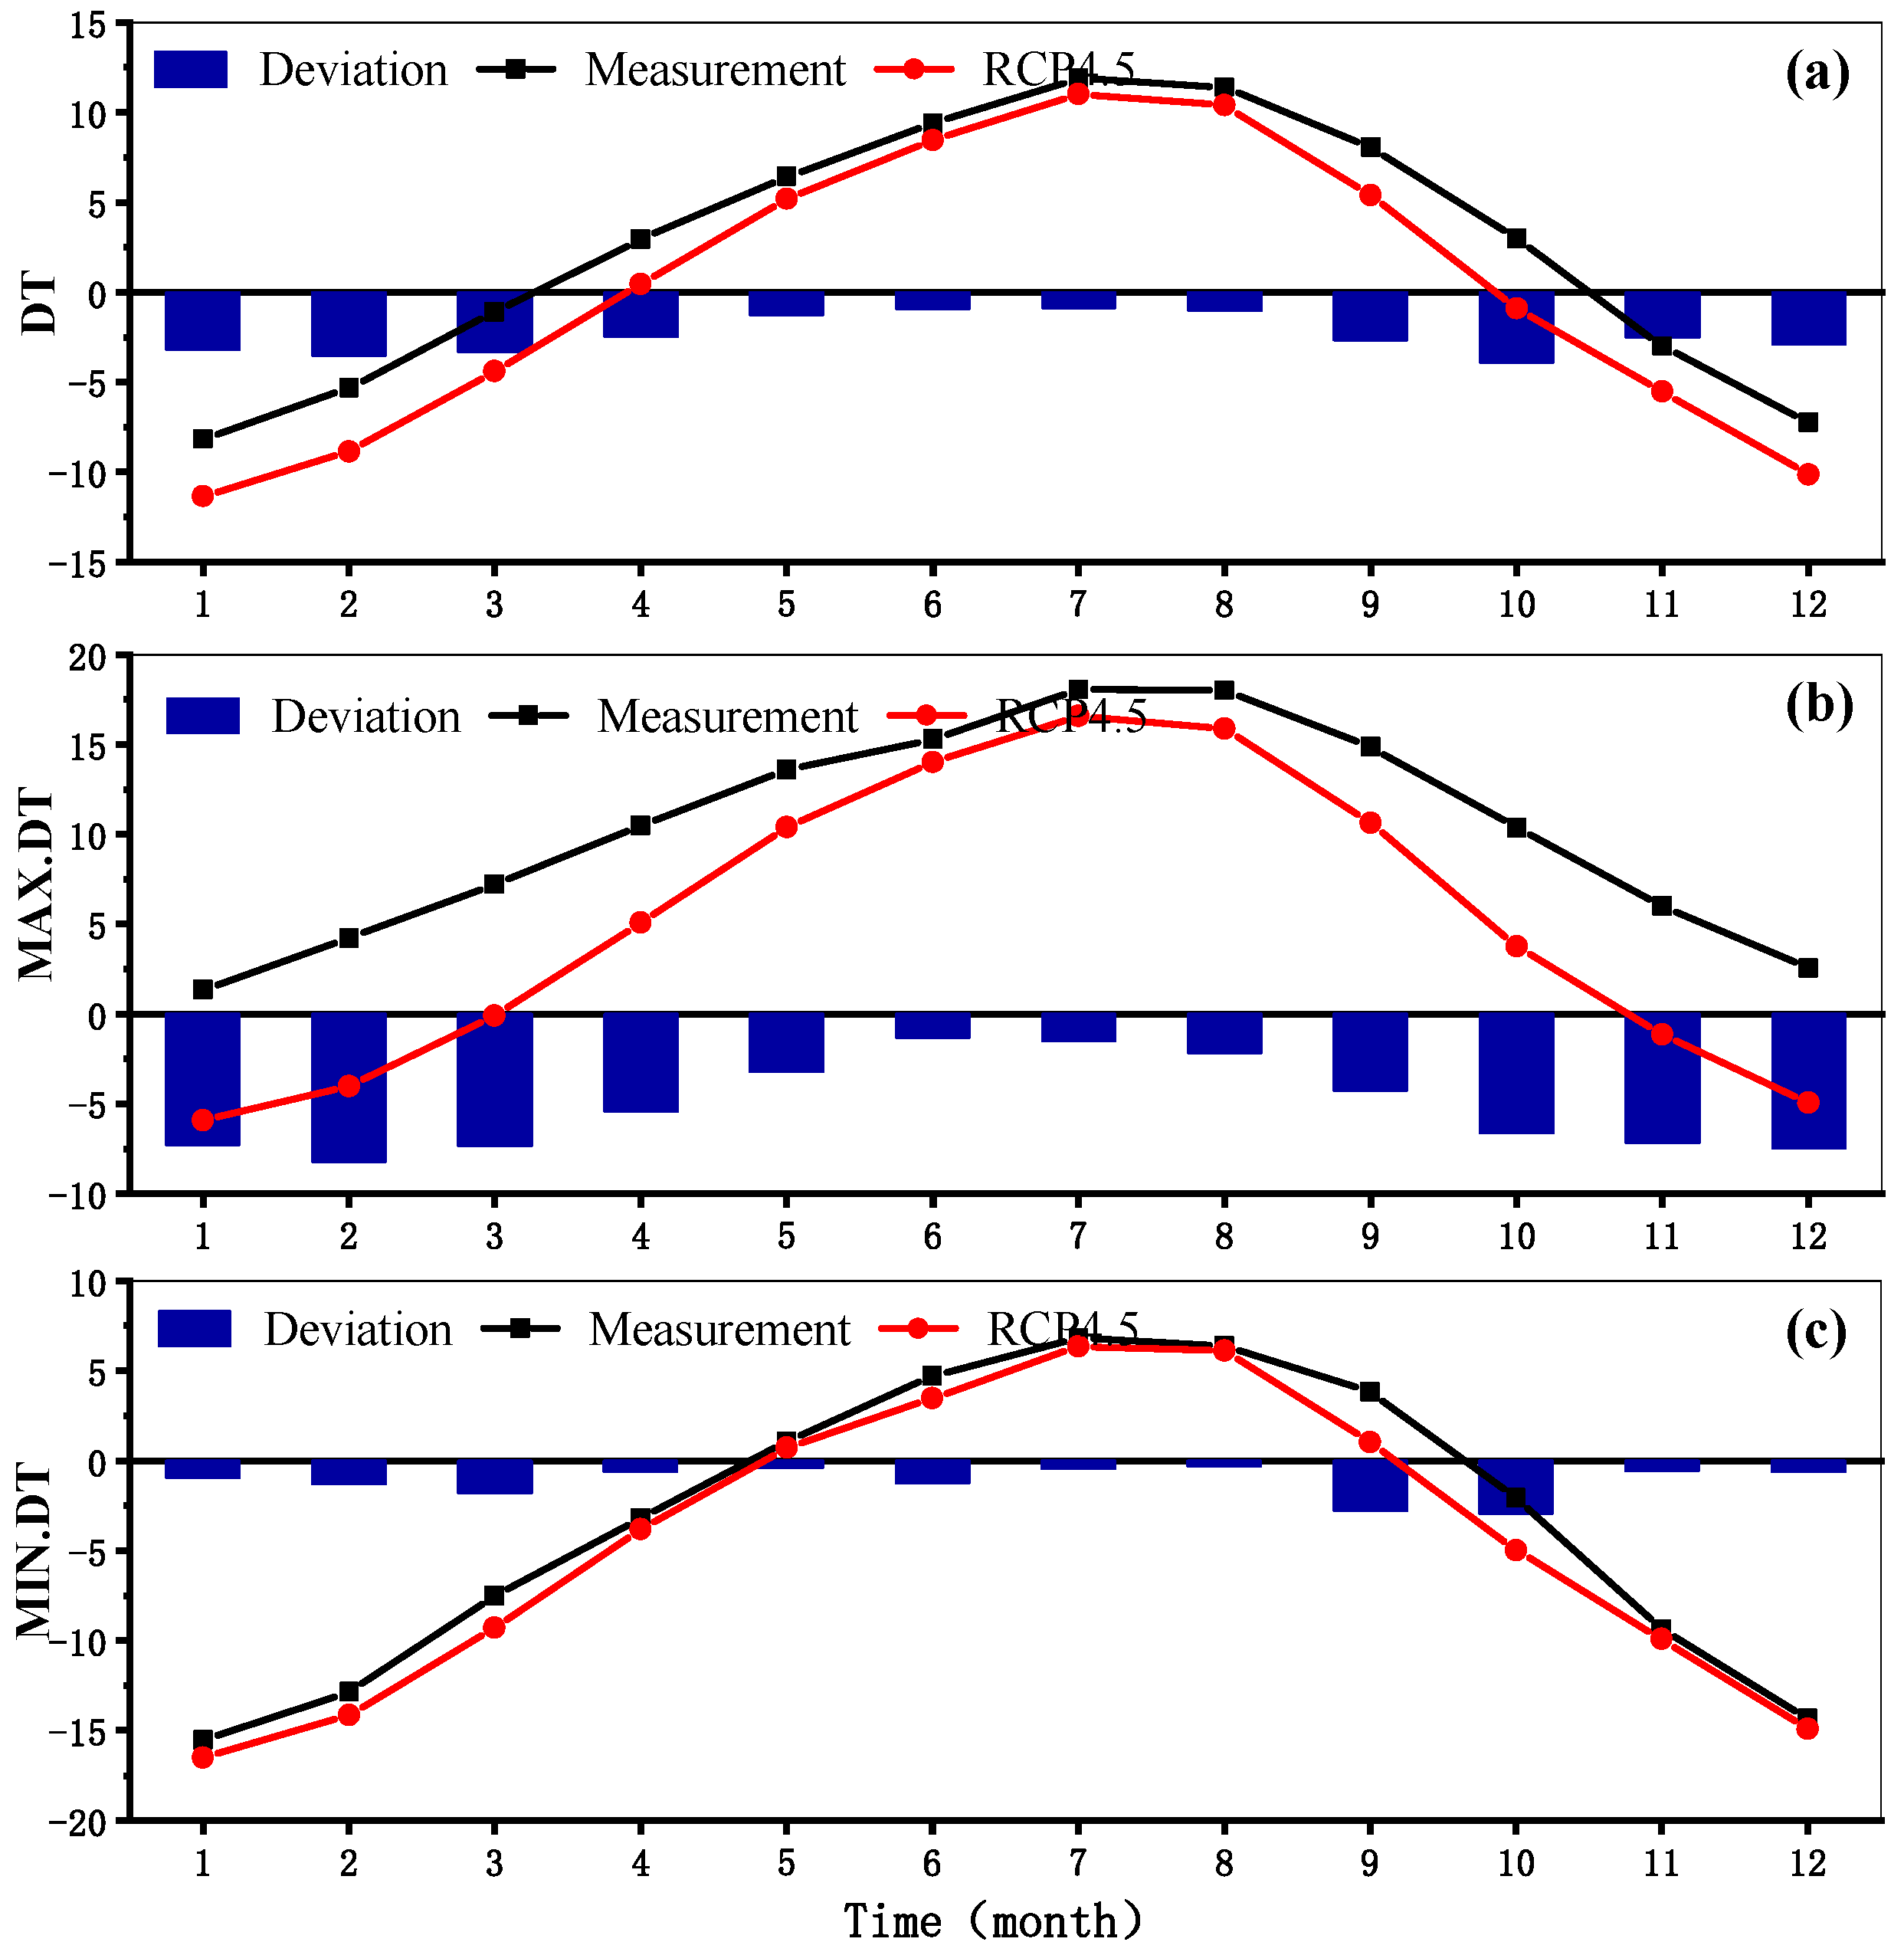
4.1.1. Evaluation and Correction of Climate Model Output
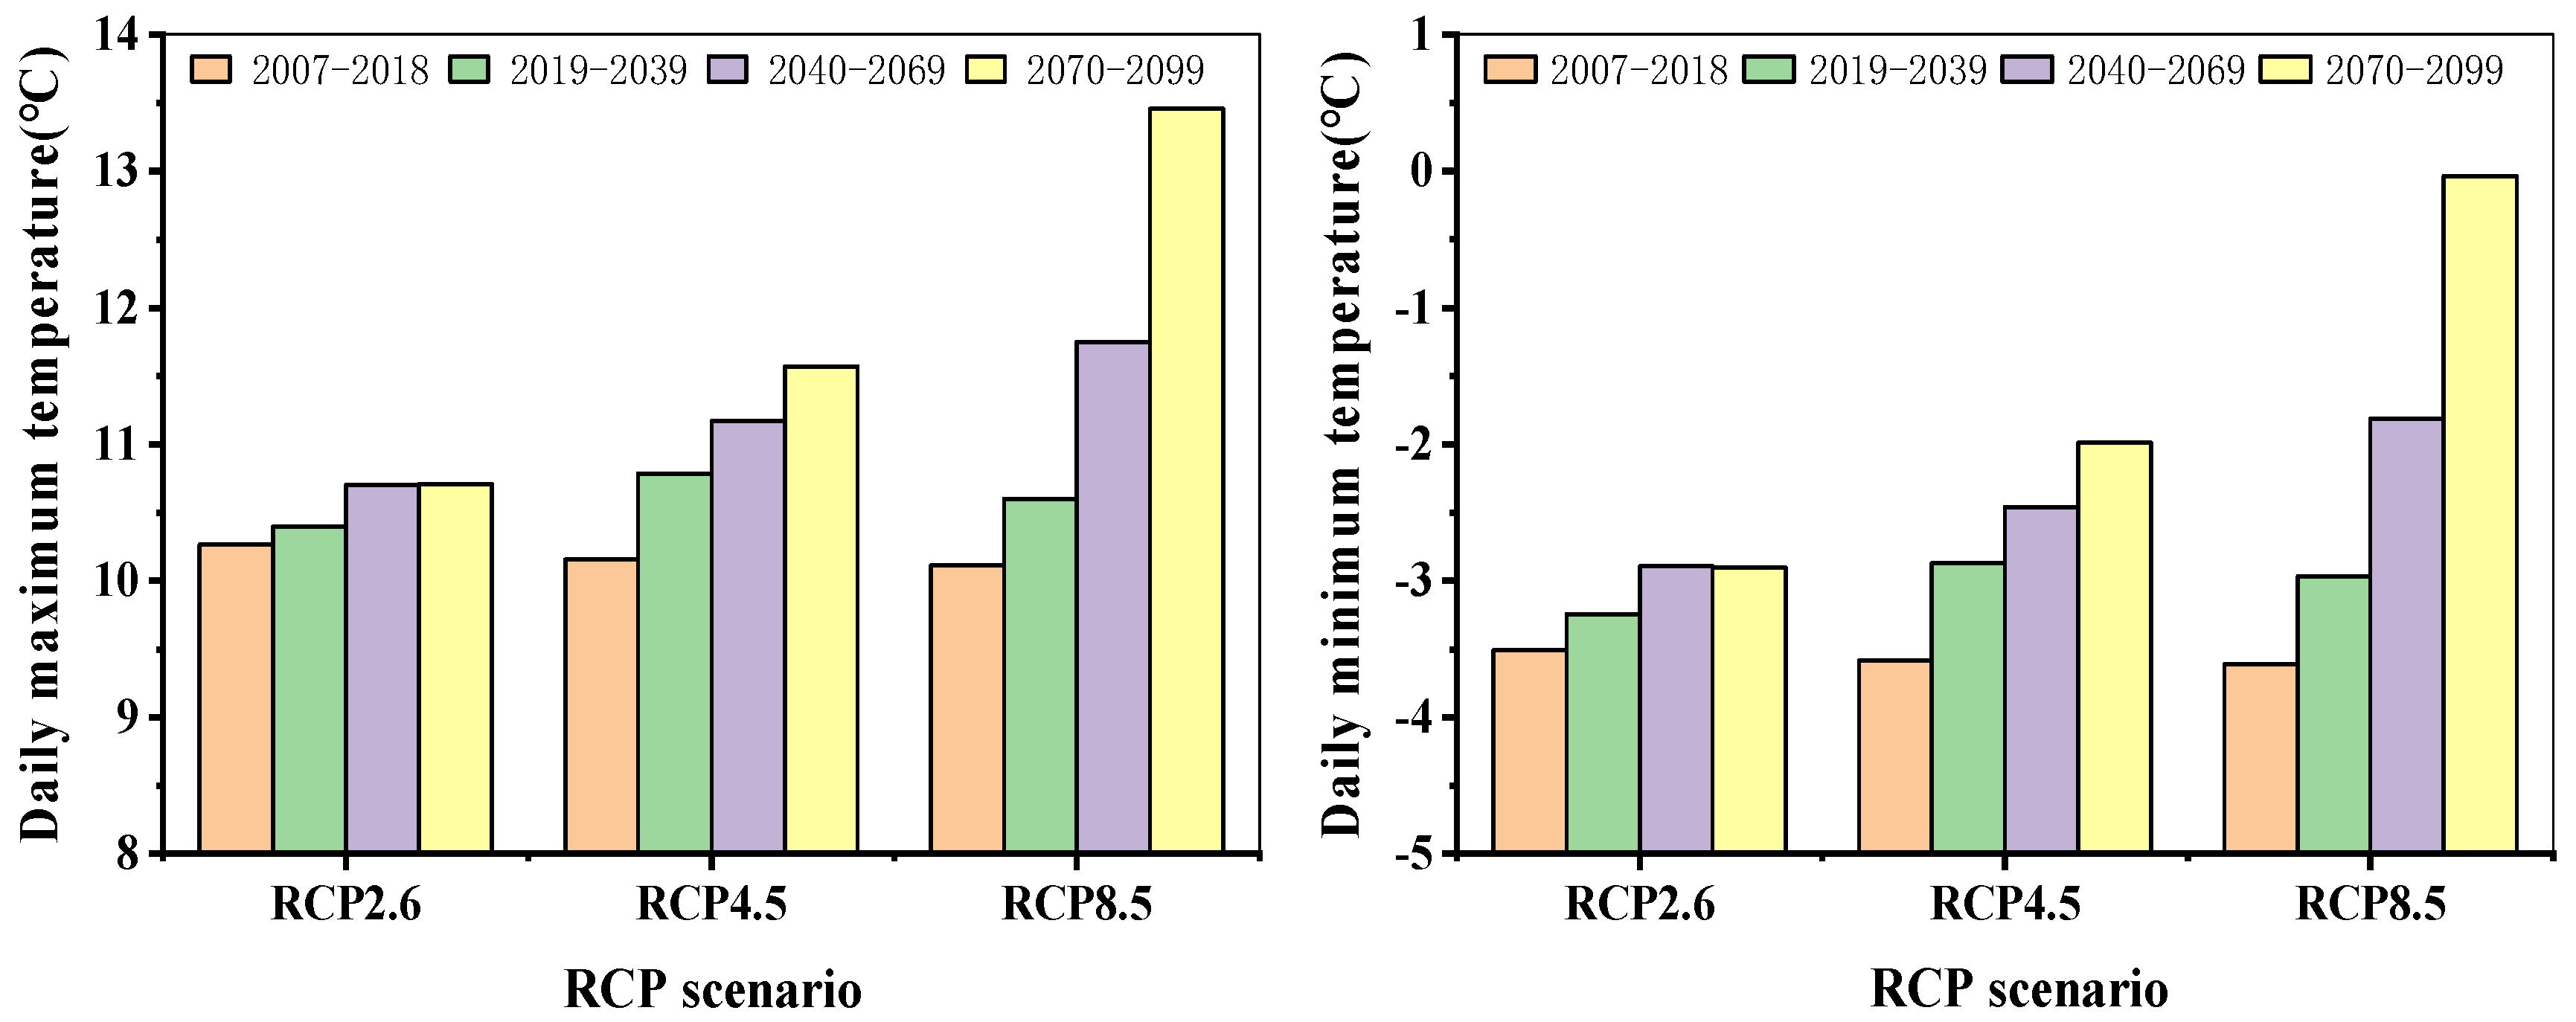
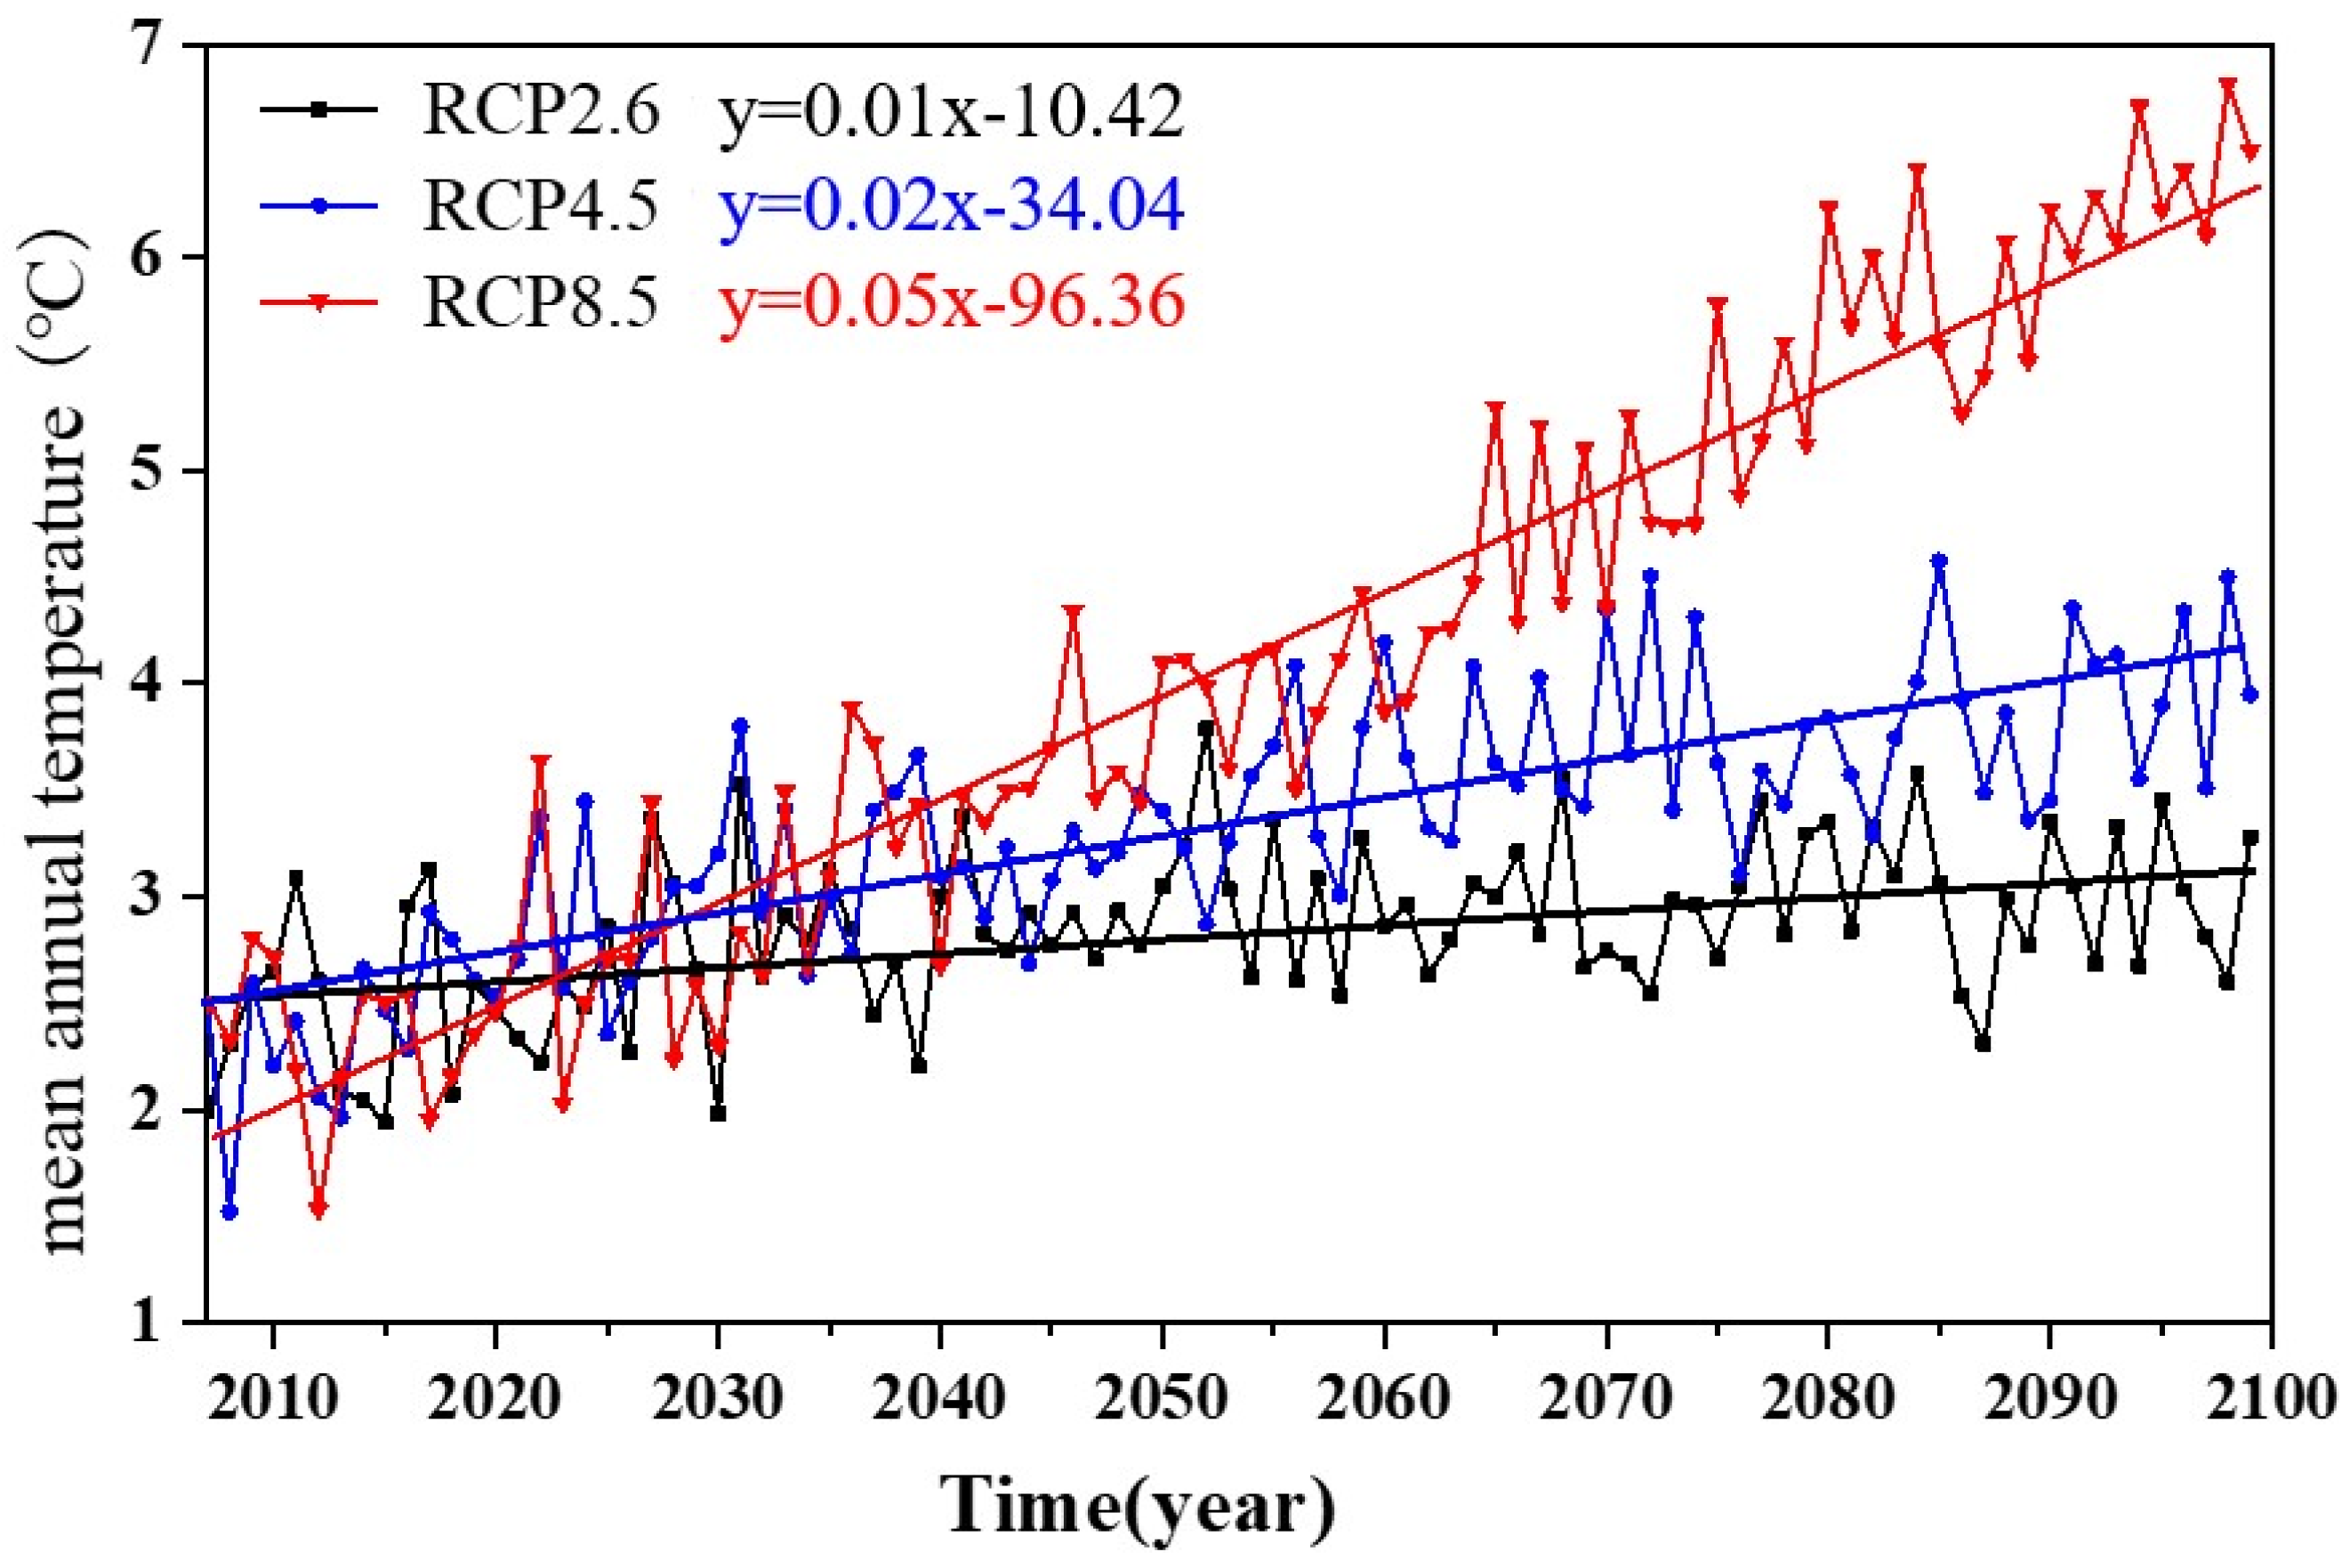
4.1.2. Projection of Future Temperature Change in Upper Taohe River Basin
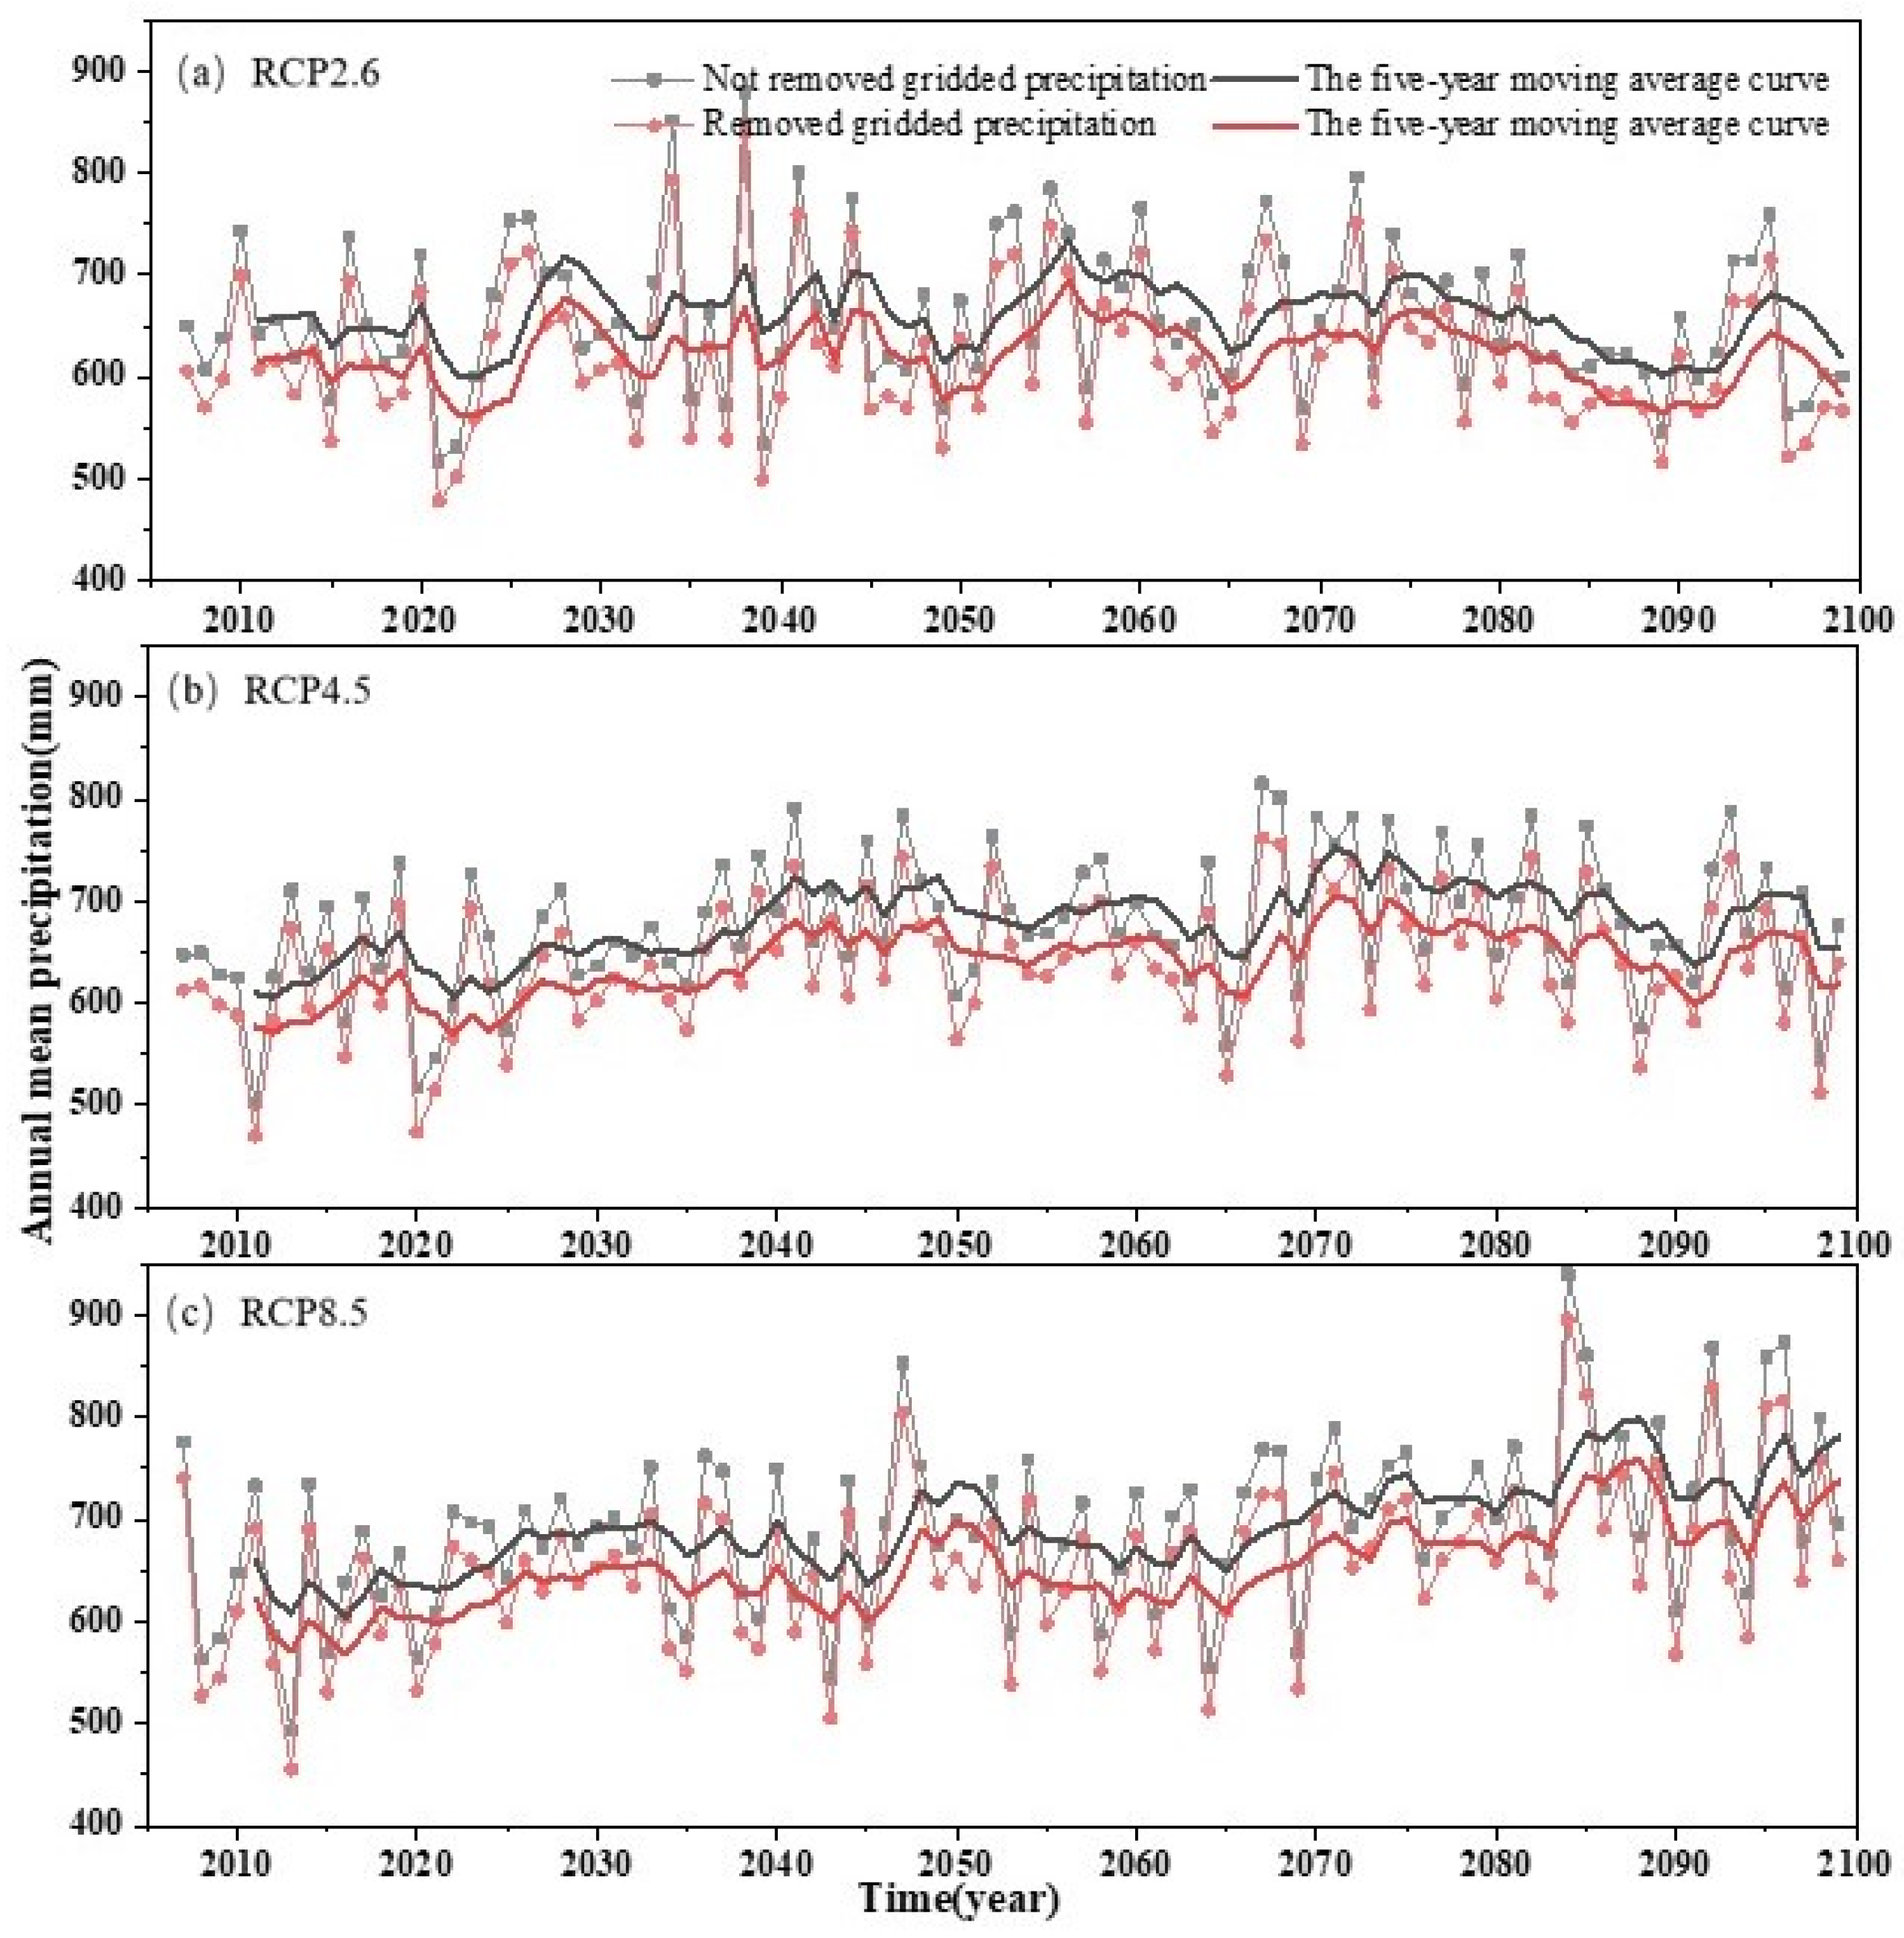
4.1.3. Projection of Future Precipitation Change in Upper Taohe River Basin
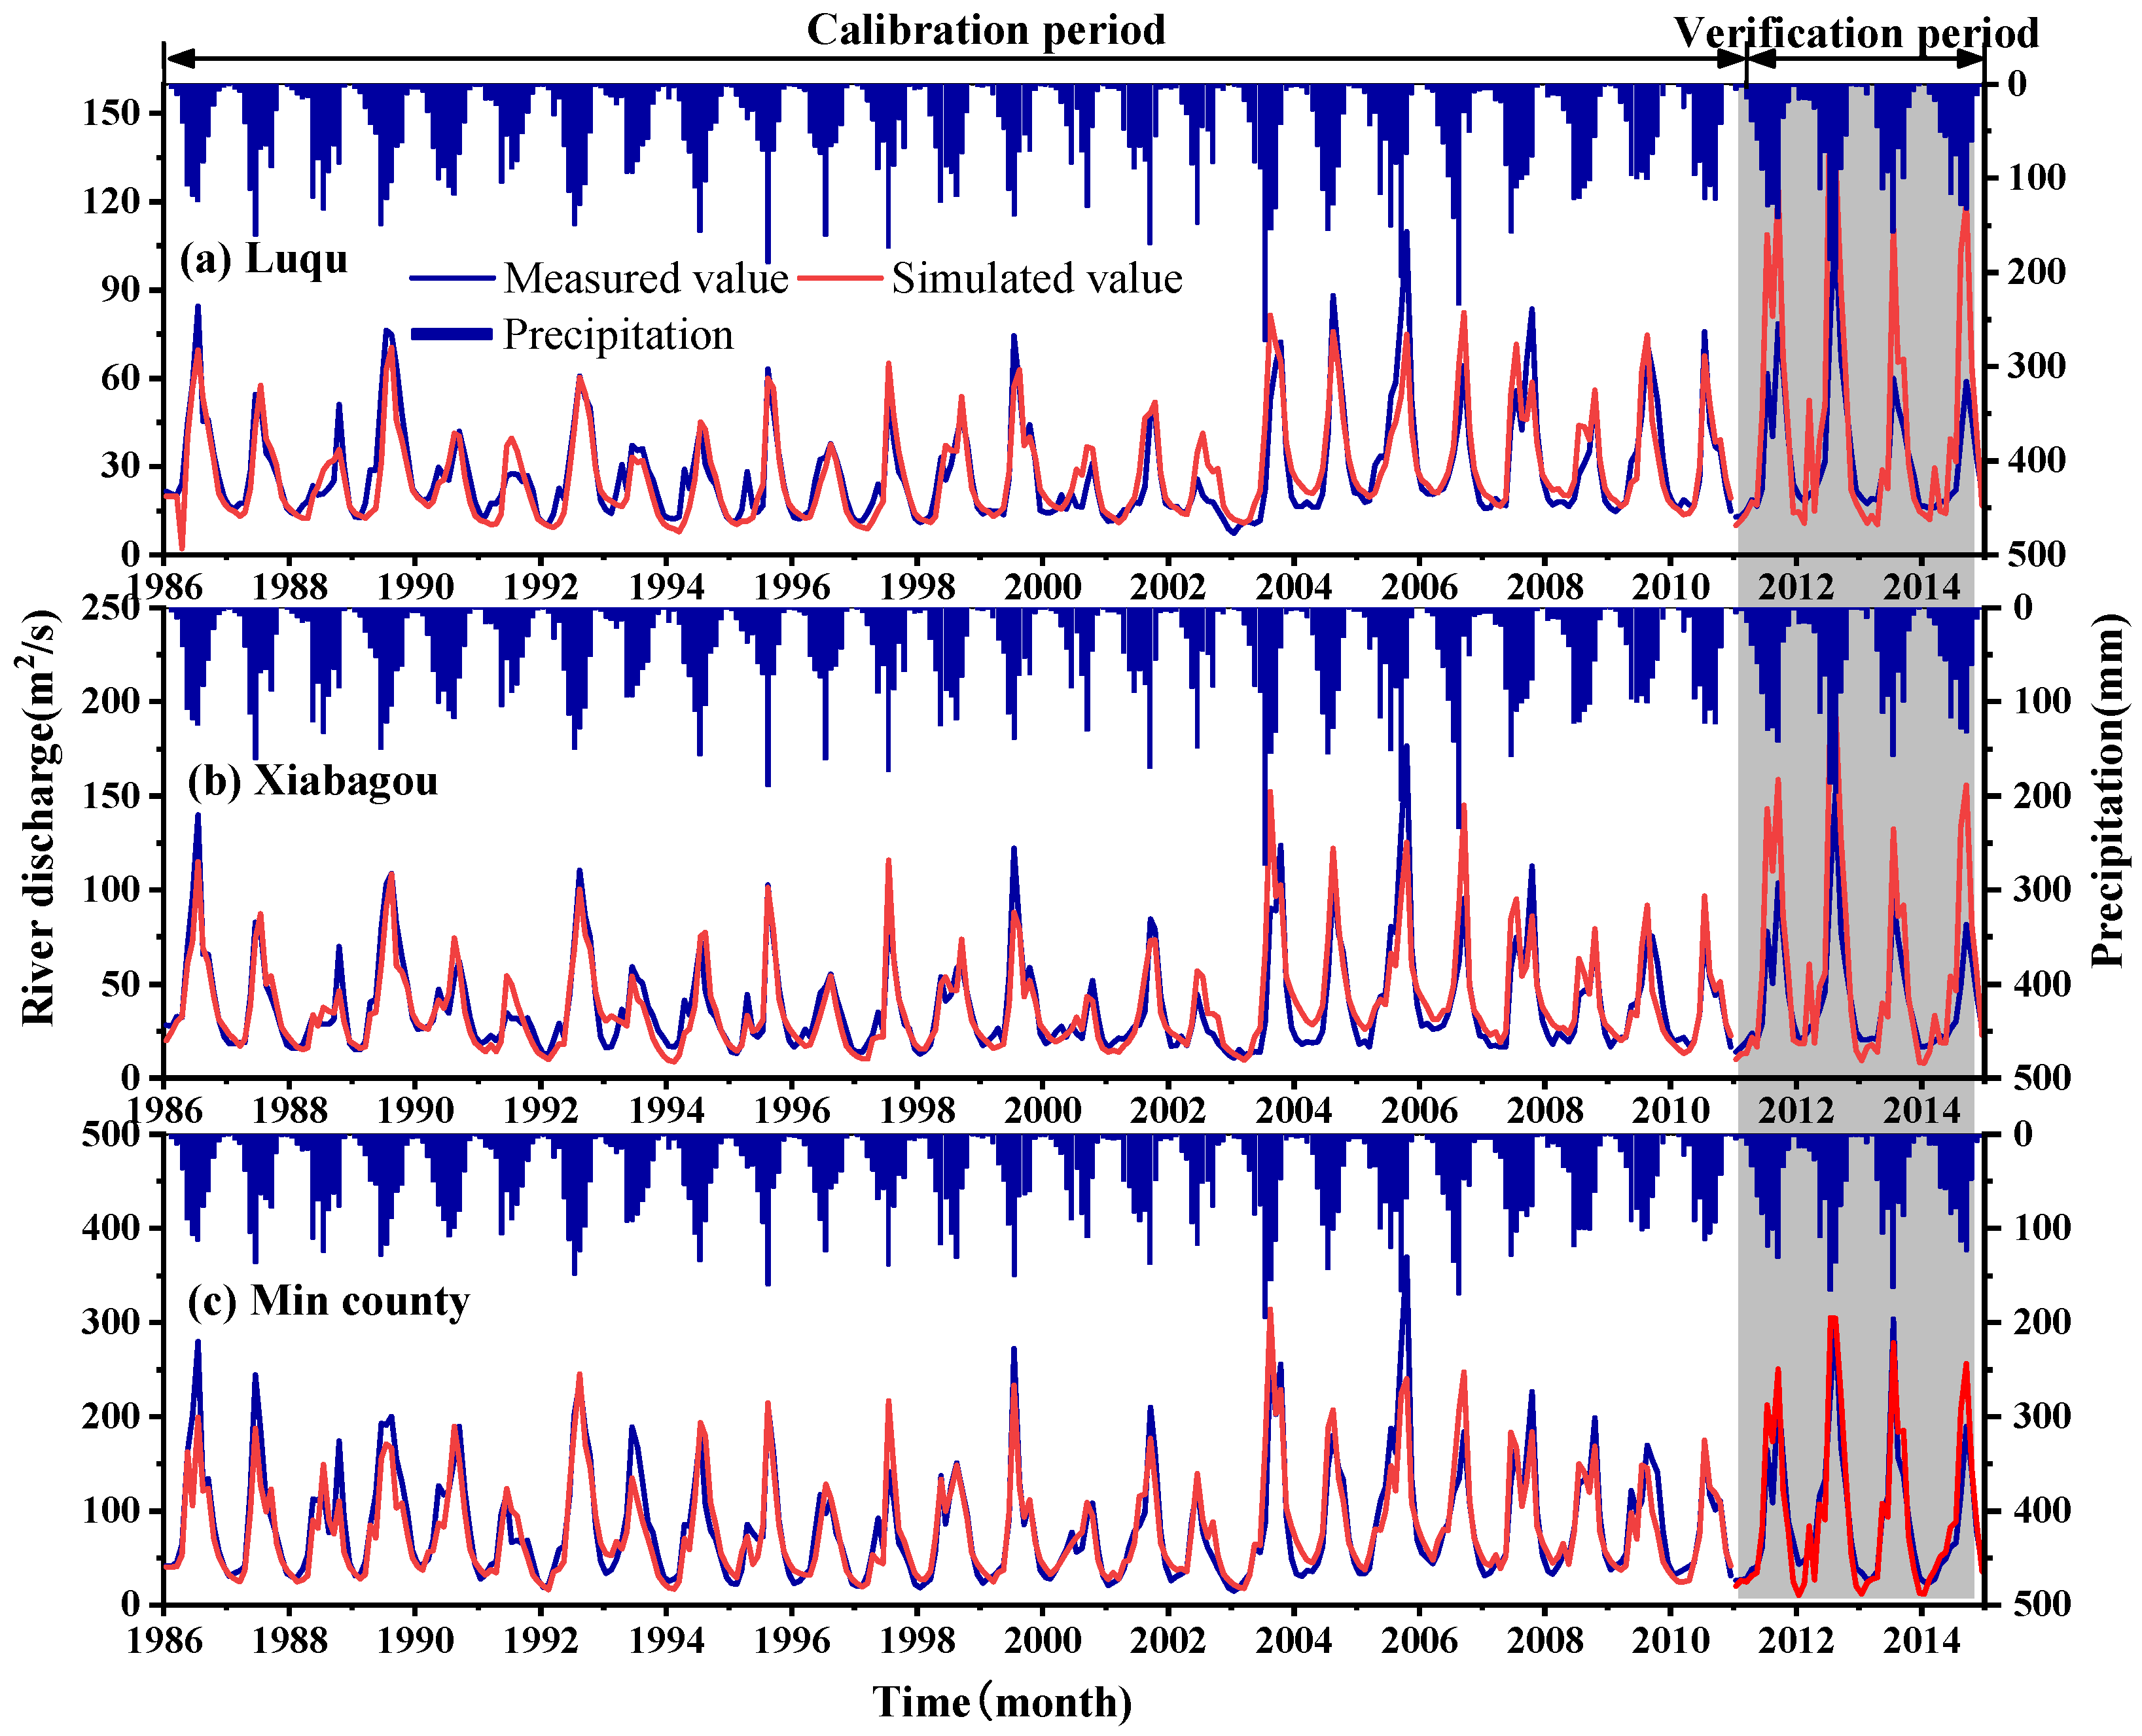
4.2. Applicability Evaluation of SWAT Model
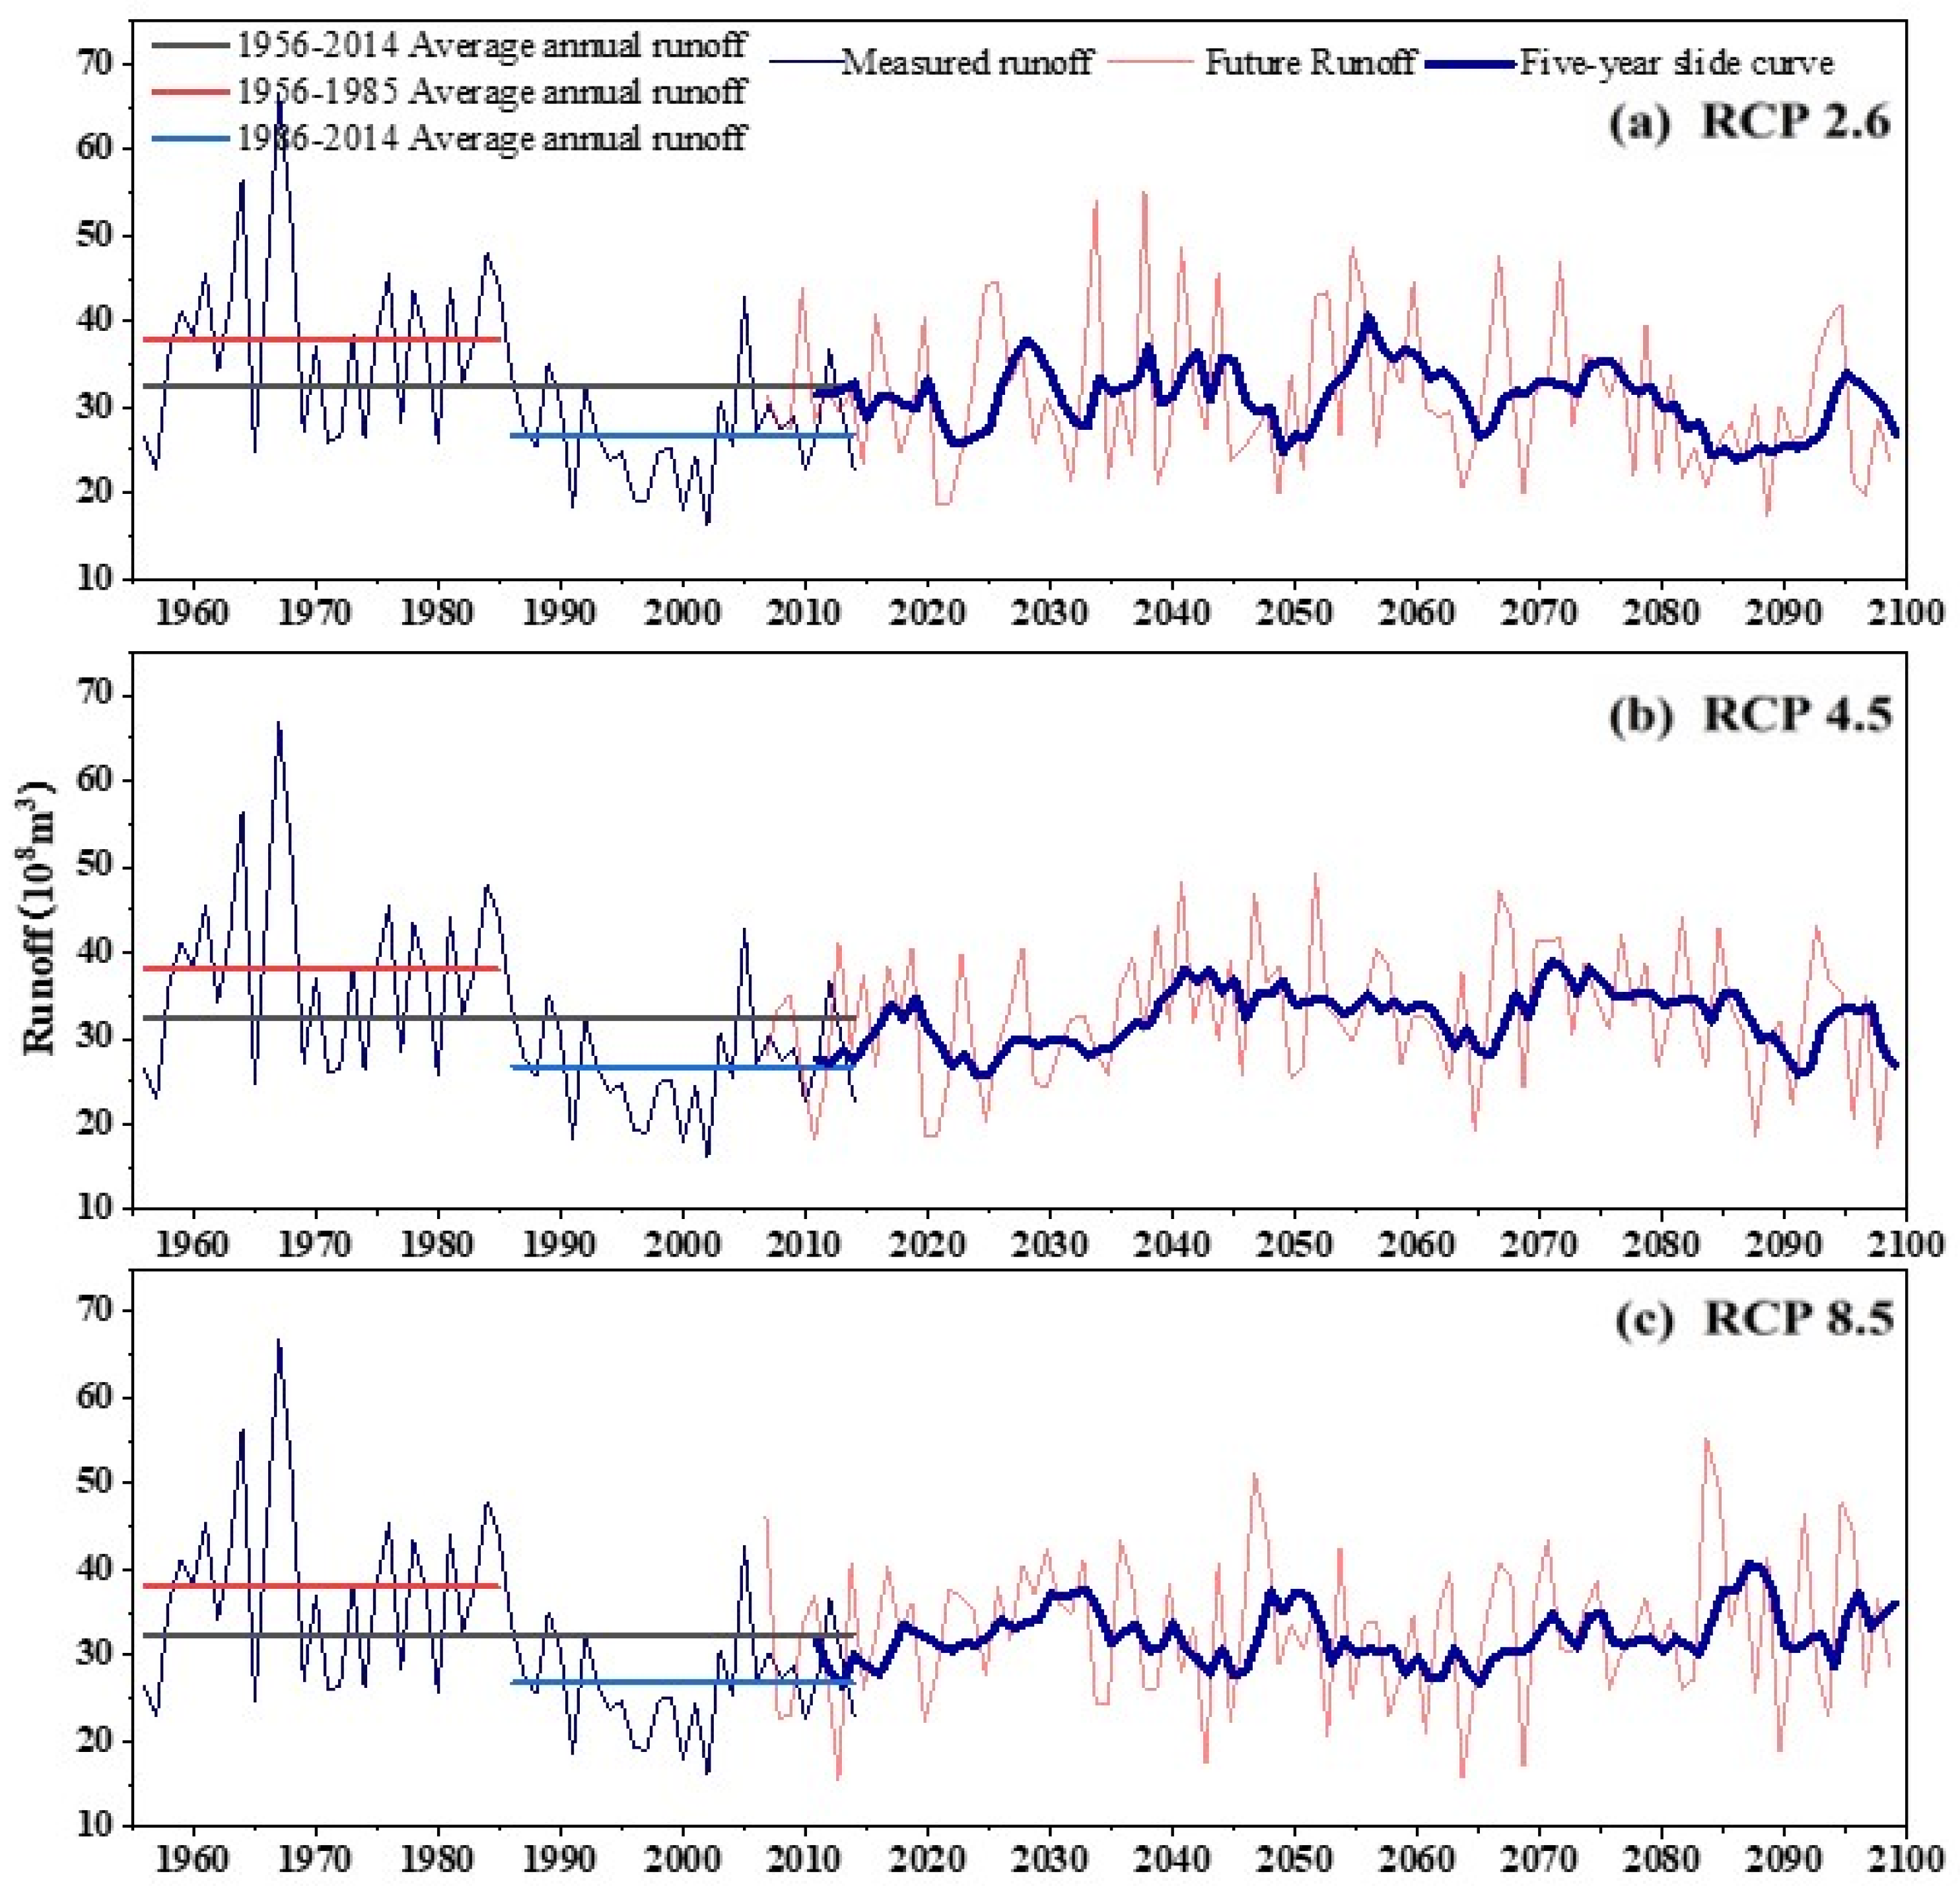
4.3. Projection of Future Runoff Change in the Middle and Upper Reaches of the Tao River
5. Discussion
5.1. Uncertainty Analysis of SWAT Model
5.2. Uncertainty Analysis of Future Climate Change Scenarios
6. Research Limitation and Implication
7. Conclusions
Author Contributions
Funding
Institutional Review Board Statement
Informed Consent Statement
Data Availability Statement
Conflicts of Interest
References
- Bahrami, E.; Salarijazi, M.; Mohammadrezapour, O.; Jou, P.H. Evaluation of SCS model for flood characteristic prediction in an ungauged catchment considering effects of excess rainfall and base flow separation. J. Earth Syst. Sci. 2022, 131, 11. [Google Scholar] [CrossRef]
- Kousali, M.; Salarijazi, M.; Ghorbani, K. Estimation of non-stationary behavior in annual and seasonal surface freshwater volume discharged into the Gorgan Bay, Iran. Nat. Resour. Res. 2022, 31, 835–847. [Google Scholar] [CrossRef]
- Wang, H.; Qiu, Y.; Jia, Y. Development course and tendency of water resources assessment. J. Beijing Norm. Univ. (Nat. Sci.) 2010, 46, 274–277. [Google Scholar]
- Liu, C.; Li, D.; Tian, Y.; Hao, F.; Yang, G. An application study of DEM based distributed hydrological model on macroscale watershed. Prog. Geogr. 2003, 22, 437–445. [Google Scholar]
- Muhammad, S.; Li, J.; Steiner, J.F.; Shrestha, F.; Shah, G.M.; Berthier, E.; Guo, L.; Wu, L.X.; Tian, L. A holistic view of Shisper Glacier surge and outburst floods: From physical processes to downstream impacts. Geomat. Nat. Hazards Risk 2021, 12, 2755–2775. [Google Scholar] [CrossRef]
- Song, H.S.; Chung, E.S.; Shiru, M.S. Uncertainty analysis of monthly precipitation in gcms using multiple bias correction methods under different RCPs. Sustainability 2020, 12, 7508. [Google Scholar] [CrossRef]
- Mo, X.G.; Hu, S.; Lin, Z.H.; Liu, S.X.; Xia, J. Impacts of climate change on agricultural water resources and adaptation on the North China Plain. Adv. Clim. Chang. Res. 2017, 8, 93–98. [Google Scholar] [CrossRef]
- Ge, Q.S.; Wang, F.; Wang, S.W.; Cheng, B.B. Certainty and Uncertainty in Global Warming Studies. China Popul. Resour. Environ. 2014, 24, 1–8. [Google Scholar]
- Aich, V.; Liersch, S.; Vetter, T.; Fournet, S.; Andersson, J.C.M.; Calmanti, S.; van Weert, F.H.A.; Hattermann, F.F.; Paton, E.N. Flood projections within the niger river basin under future land use and climate change. Sci. Total Environ. 2016, 562, 666–677. [Google Scholar] [CrossRef]
- Lindner, M.; Maroschek, M.; Netherer, S.; Kremer, A.; Barbati, A.; Garcia-Gonzalo, J.; Seidl, R.; Delzon, S.; Corona, P.; Kolström, M.; et al. Climate change impacts, adaptive capacity, and vulnerability of European forest ecosystems. For. Ecol. Manag. 2010, 259, 698–709. [Google Scholar] [CrossRef]
- Piao, S.; Ciais, P.; Huang, Y.; Shen, Z.; Peng, S.; Li, J.; Zhou, L.; Liu, H.; Ma, Y.; Ding, Y.; et al. The impacts of climate change on water resources and agriculture in China. Nature 2010, 467, 43–51. [Google Scholar] [CrossRef] [PubMed]
- Bahrami, E.; Salarijazi, M.; Nejatian, S. Estimation of flood hydrographs in the ungauged mountainous watershed with Gray synthetic unit hydrograph model. Arab. J. Geosci. 2022, 15, 761. [Google Scholar] [CrossRef]
- Gupta, H.V.; Kling, H.; Yilmaz, K.K.; Martinez, G.F. Decomposition of the mean squared error and NSE performance criteria: Implications for improving hydrological modelling. J. Hydrol. 2009, 377, 80–91. [Google Scholar] [CrossRef] [Green Version]
- Moss, R.; Babiker, W.; Brinkman, S.; Calvo, E.; Carter, t.; Edmonds, J.; Elgizouli, I.; Emori, S. Towards New Scenarios for the Analysis of Emissions: Climate Change, Impacts and Response Strategies. Environ. Policy Collect. 2008, 5, 399–406. [Google Scholar]
- IPCC. The physical science basis. In Contribution of Working Group I to the Fifth Assessment Report of the Intergovernmental Panel on Climate Change; Cambridge University Press: Cambridge, UK, 2013. [Google Scholar]
- Kawase, H.; Nagashima, T.; Sudo, K.; Nozawa, T. Future changes in tropospheric ozone under Representative Concentration Pathways (RCPs). Geophys. Res. Lett. 2011, 38, L05801. [Google Scholar] [CrossRef]
- Kim, S.; Kim, B.; Jun, H.; Kim, H. The Evaluation of Climate Change Impacts on the Water Scarcity of the Han River Basin in South Korea Using High Resolution RCM Data. J. Korea Water Resour. Assoc. 2010, 43, 295–308. [Google Scholar] [CrossRef] [Green Version]
- Giorgi, F.; Brodeur, C.; Bates, G. Regional climate change scenarios over the United States produced with a nested regional climate model. J. Clim. 1994, 7, 375–399. [Google Scholar] [CrossRef] [Green Version]
- Wang, X.; Chen, D.; Pang, G.; Gou, X.; Yang, M. Historical and future climates over the upper and middle reaches of the Yellow River Basin simulated by a regional climate model in CORDEX. Clim. Dyn. 2021, 56, 2749–2771. [Google Scholar] [CrossRef]
- Latif, Y.; Ma, Y.; Ma, W.; Muhammad, S.; Muhammad, Y. Snowmelt Runoff Simulation During Early 21st Century Using Hydrological Modelling in the Snow-Fed Terrain of Gilgit River Basin (Pakistan). In Advances in Sustainable and Environmental Hydrology, Hydrogeology, Hydrochemistry and Water Resource; Chaminé, H.I., Barbieri, M., Kisi, O., Chen, M., Merkel, B.J., Eds.; Advances in Science, Technology & Innovation; Springer International Publishing: Cham, Switzerland, 2019. [Google Scholar] [CrossRef]
- Latif, Y.; Ma, Y.; Ma, W.; Muhammad, S. Differentiating Snow and Glacier Melt Contribution to Runoff in the Gilgit River Basin via Degree-Day Modelling Approach. Atmosphere 2020, 11, 1023. [Google Scholar] [CrossRef]
- Arnold, J.G.; Moriasi, D.N.; Gassman, P.W.; Abbaspour, K.C.; Jha, M.K. SWAT: Model Use, Calibration, and Validation. Trans. ASABE 2012, 55, 1345–1352. [Google Scholar] [CrossRef]
- Srinivasan, R.; Arnold, J.G.; Jones, C.A. Hydrologic Modelling of the United States with the Soil and Water Assessment Tool. Int. J. Water Resour. Dev. 1998, 14, 315–325. [Google Scholar] [CrossRef]
- Zhang, Y.; You, Q.; Chen, C.; Ge, J. Impacts of climate change on stream flows under RCP scenarios: A case study in Xin River Basin, China. Atmos. Res. 2016, 178, 521–534. [Google Scholar] [CrossRef]
- Zhou, J.; He, D.; Xie, Y.; Liu, Y.; Yang, Y.; Sheng, H.; Guo, H.; Zhao, L.; Zou, R. Integrated SWAT model and statistical downscaling for estimating streamflow response to climate change in the Lake Dianchi watershed, China. Stoch. Environ. Res. Risk Assess. 2015, 29, 1193–1210. [Google Scholar] [CrossRef]
- Gao, G.; Zeng, X.; Su, B.; Wen, Y.; Jin, Z.; Wu, B. Proiected Stream Flow in the Huaihe River in 2010–2100. Adv. Clim. Change Res. 2010, 6, 15–21. [Google Scholar]
- Wang, H.; Sun, F.; Xia, J.; Liu, W. Impact of LUCC on streamflow based on the SWAT model over the Wei River basin on the Loess Plateau in China. Hydrol. Earth Syst. Sci. 2017, 21, 1929–1945. [Google Scholar] [CrossRef] [Green Version]
- Zubaida, M.; Shi, Q.; Polat, M.; Zhang, R. Land use and climate change effects on runoff in the upper Urumqi River watershed: A SWAT model-based analysis. Acta Ecol. Sin. 2018, 38, 5149–5157. [Google Scholar]
- Wang, S.; Liu, X. Runoff Response of Zamu River Basin to IPCC Climate Change Scenarios in Northwest China. Commun. Comput. Inf. Sci. 2013, 399, 223–231. [Google Scholar]
- Jin, J.; Wang, G.; Liu, C.; Bao, Z. Future Evolution Trends of Water Resources in Haihe River Basin under the Climate Change. J. North China Univ. Water Resour. Electr. Power 2016, 37, 1. [Google Scholar]
- Cheng, L.; Yang, M.; Wang, X.; Wan, G. Spatial and Temporal Variations of Terrestrial Evapotranspiration in the Upper Taohe River Basin from 2001 to 2018 Based on MOD16 ET Data. Adv. Meteorol. 2020, 2020, 3721414. [Google Scholar] [CrossRef]
- Qi, G.; Zhang, K. Effectiveness and Problems of Forest Protection and Utilization in Qiaohe Forest Region. China Agric. Inf. 2015, 11, 69–76. [Google Scholar]
- Zhang, H. Water Resources Optimal Operation and Allocation in the Taohe River Basin; Xi’an University of Technology: Xi’an, China, 2006. [Google Scholar]
- Ma, L. Analysis on Hydrological Characteristics of Minxian Hydrological Station in Taohe River. Gansu Water Conserv. Hydropower Technol. 2009, 45, 9–13. [Google Scholar]
- Pan, X.; Zhang, L.; Huang, C. Future Climate Projection in Northwest China with RegCM4.6. Earth Space Sci. 2020, 7, e2019EA000819. [Google Scholar] [CrossRef]
- Akoko, G.; Tu, H.L.; Gomi, T.; Kato, T. A Review of SWAT Model Application in Africa. Water 2021, 13, 1313. [Google Scholar] [CrossRef]
- Xiao, J. Non-Point Source Pollution Model: SWAT User Application Guide; Geological Publishing House: Beijing, China, 2010. [Google Scholar]
- Cheng, L.; Ma, L.; Yang, M.; Wan, G.; Wang, X. Changes of temperature and precipitation and their impacts on runoff in the upper Taohe River in northwest China from 1956 to 2014. Environ. Earth Sci. 2019, 78, 423. [Google Scholar] [CrossRef]
- Wang, Z.; Liu, C.; Huang, Y. The Theory of SWAT Model and its Application in Heihe Basin. Prog. Geogr. 2003, 22, 79–86. [Google Scholar]
- Rui, X.; Zhu, Q. Some Problems in Research of Distributed Watershed Hydrological Model. Adv. Sci. Technol. Water Resour. 2002, 22, 56–58. [Google Scholar]
- Yang, J.; Gao, X.; Li, Q.; Chen, Q.; Feng, S. SWAT Model Construction and Parameter Uncertainty Analysis in Huangshui Basin. Res. Soil Water Conscrvation 2013, 20, 82–88. [Google Scholar]
- Wang, H.; Wu, Y.; Cui, Y. Evaluating the progress of the CMIP and Its Application Prospect in China. Adv. Earth Sci. 2009, 24, 461–468. [Google Scholar]
- Duan, Q.; Xia, J.; Miao, C.; Sun, Q. The uncertainty in climate change projections by global climate models. Chin. J. Nat. 2016, 38, 182–188. [Google Scholar]
- New, M.G.; Hulme, M. Representing uncertainty in climate change scenarios: A Monte-Carlo approach. Integr. Assess. 2000, 1, 203–213. [Google Scholar] [CrossRef]


| Station Number | Station Name | Latitude (°) | Longitude (°) | Altitude (m) |
|---|---|---|---|---|
| 56,065 | Henan | 34.73 | 101.60 | 3500.00 |
| 56,071 | Luqu | 34.60 | 102.50 | 3191.00 |
| 56,074 | Maqu | 34.00 | 102.08 | 3471.00 |
| 56,080 | Hezuo | 35.00 | 102.90 | 2910.00 |
| 56,081 | Lintan | 34.70 | 103.35 | 2810.00 |
| 56,082 | Zhuoni | 34.58 | 103.50 | 2592.00 |
| 56,093 | Minxian | 34.43 | 104.02 | 2315.00 |
| 52,978 | Xiahe | 35.18 | 102.5 | 2948.00 |
| Station Number | Latitude | Longitude | Catchment Area (km2) | Data Range (Year) |
|---|---|---|---|---|
| Luqu | 34°35′ | 102°27′ | 5043 | 1986.1~2014.12 |
| Xiabagou | 34°41′ | 103°00′ | 7311 | 1986.1~2014.12 |
| Minxian | 34°26′ | 104°02′ | 14,912 | 1986.1~2014.12 |
| Number | Type | SAWT Code | Number | Type | SWAT Code |
|---|---|---|---|---|---|
| 12 | Dry land | AGRL | 43 | Reservoirs, Ponds | WATR |
| 21 | Dry land | FRST | 46 | Beach land | WATR |
| 22 | Shrub forest | FRST | 51 | Towns | URHD |
| 23 | Sparse woodland | FRST | 52 | Rural settlements | URLD |
| 24 | Other woodlands | FRST | 53 | Construction land | UIDU |
| 31 | High coverage grassland | PAST | 64 | Marshland | WETL |
| 32 | Medium coverage grassland | PAST | 65 | Naked land | BARR |
| 33 | Low-coverage grassland | PAST | 66 | Bare rock gravel land | BARR |
| 41 | Canal | WATR | 67 | Other unused land | BARR |
| 42 | Lakes | WATR |
| Parameter Name | Type | Physical Meaning | Adjusting Range |
|---|---|---|---|
| r_CN2 | .mgt | SCS runoff curve number; related to regional topography and land cover | (−0.2, 0.2) |
| v_ALPHA_BF | .gw | ALPHA factor (day) indicating the recharge of groundwater and soil water to runoff; directly affects the flood peak and its decline rate | (0,1) |
| v_CH_N2 | .rte | Manning coefficient of main channel that is inversely proportional to confluence velocity | (0,0.3) |
| v_CH_K2 | .rte | The main river diversion coefficient, default 0, indicates the loss of river transportation | (5, 130) |
| v_GW_DELAY | .gw | Groundwater lag coefficient (day) used to calculate the amount of recharge per day into the groundwater layer and is related to the depth of the horizontal plane and the characteristics of groundwater force | (30, 450) |
| v_GWQMN | gw. | Invasion depth of shallow aquifer required for reflux | (0, 2) |
| v_GW_REVAP | .gw | Correlation coefficient of groundwater reevaporation | (0.02, 0.2) |
| v_REVAPMN | .gw | The depth of shallow aquifer intrusion required for ’reevaporation’ occurs, and reevaporation only occurs when the water content of shallow aquifers exceeds the threshold value | (0,57) |
| r_SOL_K | .sol | Saturated hydraulic conductivity of the soil layer indicating the size of the resulting interflow | (−0.5, 0.5) |
| r_SOL_AWC | .sol | Available water content in the soil layer indicates soil water storage capacity | (−0.5, 0.5) |
| v_ESCO | .hru | Compensation coefficient of soil evaporation | (0, 1) |
| v_EPCO | .hru | Vegetation transpiration compensation coefficient | (0, 1) |
| v_SURLAG | .bsn | Surface runoff lag coefficient | (0.05, 24) |
| v_SFTMP | .bsn | Snowfall base temperature | (−5, 5) |
| v_SMTFP | .bsn | Snowmelt base temperature | (−5, 5) |
| v_SMFMX | .bsn | Maximum snowmelt coefficient (occurs in summer solstice) | (1, 8) |
| v_SMFMN | .bsn | Minimum snowmelt coefficient (occurs in winter solstice) | (1, 8) |
| v_CANMX | .hru | Maximum interception flow of vegetation canopy | (0, 1) |
| v_TIMP | .bsn | Temperature lag coefficient after icing | (0, 1) |
| v_TLAPS | .sub | Vertical lapse rate of temperature | (−8, 50) |
| v_BIOMIX | .mgt | Biomixing efficiency parameters | (0, 1) |
| v_RCHRG_DP | .gw | The permeability coefficient of underground aquifers indicates the proportion of return irrigation flowing into the deep groundwater layer | (0, 1) |
| r_SLSUBBSN | .hru | Average slope length | (−0.2, 0.2) |
| Period | R2 | NSE | Re | P-Facor | R-Facor | |
|---|---|---|---|---|---|---|
| Luqu | Calibration | 0.891 | 0.793 | 2.394 | 0.81 | 0.75 |
| Validation | 0.952 | 0.895 | −8.991 | |||
| Xiabagou | Calibration | 0.888 | 0.779 | −3.868 | 0.93 | 1.6 |
| Validation | 0.947 | 0.890 | −5.073 | |||
| Min county | Calibration | 0.914 | 0.833 | −14.615 | 0.80 | 0.71 |
| Validation | 0.944 | 0.875 | −8.66 |
| Time Period | Spring | Summer | Autumn | Winter | |
|---|---|---|---|---|---|
| RCP2.6 | 2020~2039 | 3.43 | 15.05 | 11.69 | 1.61 |
| 2040~2069 | 3.42 | 14.78 | 12.33 | 1.66 | |
| 2070~2099 | 3.22 | 12.69 | 11.63 | 1.60 | |
| RCP4.5 | 2020~2039 | 2.65 | 14.19 | 11.17 | 1.48 |
| 2040~2069 | 3.18 | 15.07 | 13.46 | 1.95 | |
| 2070~2099 | 3.02 | 14.58 | 13.27 | 1.78 | |
| RCP8.5 | 2020~2039 | 3.81 | 15.82 | 11.88 | 1.37 |
| 2040~2069 | 3.09 | 13.56 | 12.28 | 1.89 | |
| 2070~2099 | 3.29 | 14.72 | 13.99 | 1.81 |
Publisher’s Note: MDPI stays neutral with regard to jurisdictional claims in published maps and institutional affiliations. |
© 2022 by the authors. Licensee MDPI, Basel, Switzerland. This article is an open access article distributed under the terms and conditions of the Creative Commons Attribution (CC BY) license (https://creativecommons.org/licenses/by/4.0/).
Share and Cite
Cheng, L.; Wan, G.; Yang, M.; Wang, X.; Li, Y. The Runoff in the Upper Taohe River Basin and Its Responses to Climate Change. Water 2022, 14, 2094. https://doi.org/10.3390/w14132094
Cheng L, Wan G, Yang M, Wang X, Li Y. The Runoff in the Upper Taohe River Basin and Its Responses to Climate Change. Water. 2022; 14(13):2094. https://doi.org/10.3390/w14132094
Chicago/Turabian StyleCheng, Lizhen, Guoning Wan, Meixue Yang, Xuejia Wang, and Yongshan Li. 2022. "The Runoff in the Upper Taohe River Basin and Its Responses to Climate Change" Water 14, no. 13: 2094. https://doi.org/10.3390/w14132094
APA StyleCheng, L., Wan, G., Yang, M., Wang, X., & Li, Y. (2022). The Runoff in the Upper Taohe River Basin and Its Responses to Climate Change. Water, 14(13), 2094. https://doi.org/10.3390/w14132094