Abstract
This study establishes that processed zero valent iron can be pelletised and used to desalinate water. The pellets desalinate water using a zero-order reaction, where: product water salinity = −[a][Reaction Time] + Feed Water Salinity. Desalination using the pellets requires no onsite energy, no onsite infrastructure, and produces no reject brine. Potential applications for the pellets, include desalination of saline impoundments, desalination of agricultural water, desalination of irrigation water, desalination of irrigated salinized soils, and aquifer desalination. The examples demonstrate 30% to 60% desalination for saline feed water within the salinity range of 4 to 10 g L−1. The product water has a low outcome variability for a specific pellet charge. The achievable desalination increases as the pellet weight: water volume ratio increases. The pellets can also be used for water purification, wastewater desalination, treatment of domestic wastewater, treatment of industrial wastewater, treatment of livestock feed water, treatment of oil field and mining wastewater, water purification to allow reuse, and the treatment of polluted soils. This study addresses the manufacture of the pellets, their effectiveness in desalinating water, and the outcome variability associated with desalination.
1. Introduction
In 2013, it was discovered (UK Patent GB2520775A) that zero valent iron (ZVI), which had been exposed to a synthesis gas, formed a high-porosity solid product, which could be pelletised. The solid product was vuggy and contained a high proportion of dead-end pores. These pellets, when placed in a static body of saline water, resulted in a gradual desalination of the water over time [1]. They operate by adsorbing Na+ and Cl− ions from the water and concentrating these ions within the porosity within the pellets [2].
This discovery was academically interesting, but had limited practical application, unless: (i) a method of volume production for the pellets could be established; (ii) a means of predicting the amount of desalination that was likely to arise from a specific application of the pellets could be developed; and (iii) a means of predicting the variability associated with the desalination that was likely to arise from a specific application of the pellets could be developed. This paper specifically addresses the resolution to these three problems.
1.1. Other Applications for the Pellets
While the primary application for the pellets is the desalination of water, they will also remove [1] the following ions from water: (i) anions: Cl−, F−, NO3−, NO2−, SO42−, PO42− and (ii) cations, and associated anions of (As, B, Ba, Ca, Cd, Co, Cu, Cr, Fe, K, Mg, Mn, Mo, Na, Ni, P, S, Si, Sr, Zn). They therefore have a wide potential application for the passive treatment of contaminated and polluted water bodies. The pellets can be used for water purification, wastewater desalination, treatment of domestic wastewater, treatment of industrial wastewater, treatment of livestock feed water, treatment of oil field and mining wastewater, water purification to allow reuse, and the treatment of polluted soils. These applications are not expanded on in this study, as the study focuses on the removal of Na+ and Cl− ions from water. Future studies may consider their effectiveness in removing a variety of other organic and inorganic pollutants.
1.2. Potential Markets
The focus in this study, is to develop the pellets to assist in addressing the largest global water remediation and water purification market. Currently about 66% of the global population lives under conditions of water stress [3]. The global area used as agricultural land is about 5 billion ha, of which about 1.24 billion ha is arable land [4]. Irrigation accounts for about 70% of anthropogenic water usage [5,6,7,8,9] and 90% of global consumptive water usage [5,7]. Global water demand is currently between 5500 and 6000 km3 a−1 [9].
The potential markets for the desalination pellets includes: the desalination of the 1 billion hectares of salinized soil [10], the desalination of 15% to 20% of global anthropogenic water usage, where crops are irrigated with saline water [10,11], the desalination of saline aquifers [2,12], the desalination of aquifers impacted by seawater incursion [13], the desalination of saline water, and seawater to form potable water [14,15,16,17], the desalination of reject brine from conventional desalination plants, which is currently discharged into the environment [18,19,20,21], the desalination of saline livestock feed water [22,23,24], the desalination of associated water produced by shale gas and oil shale wells [25,26], and the desalination of saline mining impoundments [27].
The principal conventional options for addressing these issues include reverse osmosis, thermal desalination methods and electro-coagulation. These approaches are energy intensive and require substantial economies of scale and extensive water distribution infrastructure to be cost effective.
1.3. Zero Valent Iron Desalination
Zero valent iron (ZVI, Fe0) desalination was first documented in the academic literature in 2010 [1,28], and in the patent literature in 2008 (US Patent US8636906B2). Since 2008, the ZVI technology has evolved along four different, but related, routes.
1.3.1. Continuous Flow, Flow line, Contact Flow Approach
This approach adds n-Fe0 (nano zero valent iron) to a continuous flow of saline water (e.g., seawater), in a concentration of about 20 g L−1. After a residence time of about 10 min, the dilute slurry is passed into a magnetic separator, which recovers the n-Fe0 + NaCl, to leave a partially desalinated/desalinated water product. The recovered n-Fe0 is washed to recover the NaCl, and allow the n-Fe0 to be reused. This technology is described in [US Patent US8636906B2 (2008); French patent FR2983191A1 (2011); Spanish Patent ES2,598,032 (2015)]. No results from this technology have been placed in the academic literature.
1.3.2. Batch Flow Emulsified n-Fe0, Approach
This approach adds emulsified n-Fe0 (<10 g L−1) and an air, or CO2 gas flow, to a batch of saline water (e.g., flowback water, or mine impoundment water, or drilling cuttings saline wash water), in a bubble column reactor. The reactor operates with a continuous flow of gas, and a batch flow of water. A residence time of about 30 min is required to remove >50% of the Cl− ions. This technology is designed to target the remediation of saline impoundments, and will remove a suite of other organic, and inorganic, contaminants from the water. This technology is described in the 2015/2018 US Patents US9624113B2; US9828258B2; US2018/0009678A. No results from this technology have been placed in the academic literature.
1.3.3. Fluidised Bed n-Fe0, Approach
This approach adds about 20 g L−1 of n-Fe0 to saline water in a fluidised bed reactor. The patent specification indicates that a residence time of >8 h is required to achieve about 60% desalination. This technology is designed to target the remediation of reject brine from conventional desalination plants, and the remediation of saline impoundments. This technology is described in the 2018/2021 US Patent US10919784B2. No results from this technology have been placed in the academic literature.
1.3.4. Batch Flow, Diffusion Bed n-Fe0, m-Fe0, Fe0 Approach
This approach places a static bed of Fe0 (zero valent iron, ZVI) in a saline water body. The water body interacts with the ZVI bed by diffusion. This technology is described in the 2013 UK patent GB2520775A. The preliminary desalination results using this diffusion technology have been described in the academic literature as follows:
- The discovery and proof of concept studies for the diffusion reactors are provided in six academic book chapters, and six academic papers, e.g., [1,2]. They consider the desalination of water, in [13]: (i) static water, static bed reactors, using n-Fe0, m-Fe0, Fe0 and processed ZVI; (ii) a batch flow, circulating water, static bed diffusion reactor. The ZVI body is static and is located outside of the path of the circulating water. The water circulation is driven by either, thermal convection or pumped flow; (iii) A batch flow, bubble column, static bed diffusion reactor. The gas is bubbled through the water body but not through the ZVI. (iv) A batch flow, bubble column, static bed, recirculating, diffusion reactor. The gas is bubbled through the water body, but not through the ZVI. The water is continually recirculated between the bubble column and a storage tank. The circulating water does not flow through the ZVI.
- A proto-type commercial scale, desalination reactor train (0.24 m3), capable of processing up to 1.9 m3 d−1, using a steel wool charge, has been constructed and tested [13]. It produced a 24.5% average desalination over 70 sequential water batches [13]. This reactor train uses a catalytic, rapid-pressure-swing-adsorption–desorption/separation process, to achieve the observed desalination. The reactor train is designed to provide a solution to the desalination of saline irrigation water, and the desalination of saline aquifers, over the product delivery range 1 to 2000 m3 d−1. The reactor used was a batch flow, bubble column, static bed diffusion reactor [13]. The reactor train demonstrated that 1 t Fe0 had the potential to partially desalinate >42,000 m3 of saline water [13].
The diffusion desalination technology described in UK patent GB2520775A has been further developed in three areas, which have not currently been published:
- Approach A: Proto-type commercial scale, desalination reactor train (0.86 m3), capable of processing up to 24 m3 d−1, using a n-Fe0 charge, and producing a 40% average desalination over 50 sequential water batches (an a single Fe0 charge). This reactor uses a catalytic, rapid-pressure-swing-adsorption–desorption/separation process, to achieve the observed desalination. This technology is designed to provide a cost-effective solution to the desalination of saline irrigation water, the desalination of reject brine from conventional desalination plants and the desalination of saline aquifers, over the product delivery range 1 to 2000 m3 d−1. The reactor used in this trial series was a batch flow, bubble column, static bed, recirculating, diffusion reactor.
- Approach B: Proto-type engineering scale, reactor designed to commercially manufacture desalination pellets, which when placed in a saline water body gradually desalinate the water body. Unlike all previous desalination technologies, the pellets produced by this approach require no onsite energy, or infrastructure to undertake the desalination, and produce no reject brine. They are suitable for the desalination of saline impoundments, salinized soil and salinized groundwater. This desalination technology forms the focus of this paper. This study builds on the initial discovery documented in 2015, in reference [1]. The reactor type used in this study to desalinate water is a static water, static bed, diffusion reactor.
- Approach C: Proto-type continuous flow, contact flow reactors, where a 10 to 70% desalination is achieved within 10 min of the diffusion desalination catalyst being added to the water. This technology is being developed to provide a rapid, low cost, low technology, zero energy solution for saline irrigation water, capable of delivering 20 to 2000 m3 d−1 of partially desalinated water.
This study addresses the desalination results associated with Approach B. The desalination results associated with Approach A and Approach C may be addressed in future publications.
In 2013/2015/2018 (UK patent GB2520775A [1,2]), the controls on the manufacture of the desalination pellets were unknown. This study establishes that they are manufactured using an aqueous, catalytic, rapid-pressure-swing-adsorption–desorption/separation process [29,30,31], which requires a gas feed containing CO and CH4. The separation process produces n-C0 (which is retained in the ZVI bed), H2 gas and CO2 gas. The gas production is used to create a high porosity ZVI product.
The product produced by the manufacturing process used in this study, results in a linear decline in water salinity with time. This is associated with a relatively low degree of outcome variability. These are major technical innovations, which affect the potential commercial usage of this material.
2. Methodology, Materials and Equipment Used
2.1. Data
The quantitative data generated by this study are provided in the Supplementary Information file (Figures S1 to S11; Tables S1 to S5). The measured data were collated and processed, in accordance with the methodology defined in Reference [32]. Regression trend lines and associated statistics were calculated in MS Excel 2019.
Interpretation of R2
The coefficient of determination, R2, is the square of the Pearson Correlation Coefficient (PCC). This coefficient (calculated automatically by Excel 2019 and displayed as R2 using its trendline function) is used to give an indication of the strength of the statistical correlation between two variables, associated with a specific regression trend line [33,34]. By definition, R2 falls within the range 1 and 0, and PCC falls between +1 and −1 [33,34]. The following interpretations are made [33,34]:
- PCC = 0.9 to 1.0 (R2 = 0.81 to 1.00): Interpretation—very strong correlation
- PCC = 0.7 to 0.89 (R2 = 0.49 to 0.79): Interpretation—strong correlation
- PCC = 0.4 to 0.69 (R2 = 0.16 to 0.47): Interpretation—moderate correlation
- PCC = 0.1 to 0.39 (R2 = 0.01 to 0.15): Interpretation—weak correlation
- PCC = 0.0 to 0.10 (R2 = 0.00 to 0.01): Interpretation—negligible correlation
The PCC is affected by the presence of outliers [35]. For example, Supplementary Information Figure S1, shows a R2 of 0.99 for a linear relationship between CO and CH4, where few outliers exist. The other three relationships in Supplementary Information Figure S1, CO:CO2, CO:H2, and CO:C2+ show a pattern of decreasing R2 as the number, and range, of the outliers increases. In the Supplementary Information file, cross-plot graphs, where a linear correlation is not shown, have a R2 value of <0.5.
In order to create kinetically meaningful linear correlations of salinity vs. time, the data in the graphs in the text (Figure 1), Supplementary information files (Figures S10 and S11) have been terminated at the point when effective desalination ceases.
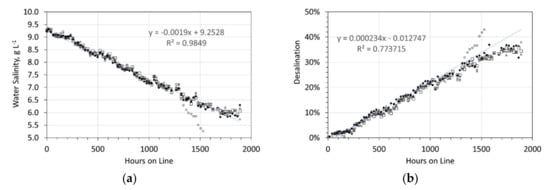
Figure 1.
Desalination associated with the ZVI Pellets. Feed water salinity = 9.24 g NaCl L−1. Five 1 L, static water bodies, 8 cm water depth, with an air-water contact. Each water body, contained 5 × 15 mm O.D. Cu0 pellets produced using 8.8 g NaCl L−1 in the ZVI Reactor. The pellets contained about 25 g L−1 of ZVI Pellet Material + about 25 g L−1 of Cu0 sheathing. (a) Salinity vs. hours on line; (b) Desalination vs. hours on line.
2.2. Gases
The reactor train (Figure 2) contains two reactors, a Halite Reactor and a ZVI Reactor. The Halite Reactor receives a gas feed. The product gas from the Halite Reactor is passed to a downstream ZVI Reactor.
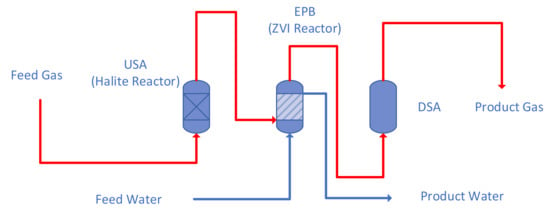
Figure 2.
Conceptual Process Design Reactor Train Framework used to construct the desalination pellets.
A dry, synthetic gas was constructed by BOC/Linde, Glasgow, UK (46.03% N2, 16.88% H2, 8.33% CO2, 11.97% CO, and 16.79% CH4. This feed gas was delivered to the Halite Reactor at a pressure of 0.3 MPa, and at ambient temperatures (270 K to 300 K). The gas composition used, was based on the gas composition, from a Maclaurin internally heated carbonization retort (Retort number 4, Grangemouth, UK) [36].
This gas composition was chosen, because it was unclear from the initial investigation [1], which gases (selected from CO, CO2, CH4 and H2) reacted with the ZVI to produce the solid desalination product. The presence of the inert gas N2 in the feed gas, allows the interaction of the other gas components with the ZVI to be investigated.
2.3. Gas Measurement Equipment
A thermal conductivity detector (TCD) gas chromatograph (GC), manufactured by SRI Instruments Inc. (Torrance, Ca., USA) was used to analyse the gases. The GC was calibrated using standards purchased from BOC/Linde. Samples for GC gas analysis were extracted using a syringe, through a Shimadzu BTO septum. Syringe gas sample size = 0.7 cm3. Carrier gas = He. Operating conditions: Start temperature: 283 K; Ramp temperature: 20 K/min; Stable temperature: 523 K; Run time: 40 min to obtain molar concentrations of: H2, N2, CO, CO2, CH4, C2Hx, C3Hx, C4Hx, C5Hx, C6Hx.
The hydrogen concentration, was determined as:
Hydrogen, % = 100 − N2 − CO − CO2 − CH4 − CxHy
2.4. Adjusting for Gas Contraction within a Reactor
The N2 in the feed gas is assumed to act as an inert. Therefore, the number of moles of N2 entering the reaction environment, equals the number of moles of N2 leaving the reaction environment. This allows the normalised gas species, Gs, concentration, in the product gas, relative to the feed gas, CN, to be determined as:
CN, moles = CA(Nf/Np)
CA = Observed molar concentration of Gs in the product gas. Nf = molar concentration of N2 in the feed gas; Np = molar concentration of N2 in the product gas.
2.5. Chemicals
The m-NaCl powders and SiO2 granules (1–10 mm), used in the experiments, were purchased from a variety of commercial industrial and agricultural sources. The halite used, was a natural geological product, and contained, varying concentrations of: hydrated NaCl, CaCl2, KCl, CaSO4, CaCO3, MgSO4, MgCO3, FeOOH, Fe(OH)x and FexOy. The halite granules (0.5–5 mm) were purchased from Wickes Ltd., Perth, UK.
The zero valent metals (m-Fe0, m-Al0, m-Cu0) were purchased from MB Fiberglass. Newtownabbey, UK. Powders had a particle size within the range 0.002 to 0.08 mm.
The fresh water used in experiments was natural spring water emanating from fractured andesites belonging to the Devonian, Old Red Sandstone Volcanic Series (Source National Grid Reference: NO 02,817 14399; 56°18′43″ N, 003°34′21″ W).
2.6. Reactors
The pellet manufacturing process requires two reactors to be placed in series (Figure 2). They are termed a Halite Reactor and a ZVI Reactor. The halite bed within the Halite Reactor was constructed using particulate halite. Details of the halite bed construction constraints are provided in UK patent GB2463878B. The reactor process configuration used (Figure 2) was constructed for pressure oscillation operation. The design requirements are provided in UK patent GB2470764B, and are summarised in Appendix A, Appendix A.1.
Patent GB2470764B requires the process plant train to contain three key elements (Figure 2). These are termed, in the patent specification, the USA, EPB and DSA. The USA is an upstream gas storage area, or volume, or plenum. It can contain catalyst or particulate material. In this study, the USA contains particulate halite + ZVI, and is termed a Halite Reactor (Figure 2). The EPB, is termed an elastic permeable barrier. Its function is to vary, automatically, the flow of the fluid (gas) from the USA to the DSA, where the flow rate is cyclically varied between low and higher values (Figure 2). In this study, the EPB is constructed from a liquid (water), and is termed the ZVI Reactor.
Gas can only flow from the USA to the DSA, when the fluid pressure in the USA is sufficient to displace the water column in the EPB. The DSA is a volume of the reaction environment, which is designed to receive the gas discharged from the EPB. It is a downstream storage area or downstream plenum. The more detailed fluid flow construction issues associated with this process train (Figure 2) are documented in Appendix A, Appendix A.1. The design and operation of the ZVI Reactor is in accordance with the construction and operation requirements of UK Patent GB2520775A. This specification requires the ZVI to be placed outside the pathway of any flowing or circulating fluids, while remaining in contact with the water body. The ZVI body interacts with the water body by diffusion.
The reactor train (Figure 2) was constructed from standard Cu0 tubular conduit material. This approach was adopted, as it allows a compact multi-train reactor to be placed in a bunded subsurface location (borehole, or trench), in accordance with the design and construction requirements of UK Patent GB2475479B.
2.6.1. Basic Reactor Operating Principles
The reactor train (Figure 2) is operated as a catalytic-rapid-pressure-swing-adsorption–desorption reactor [29,30,31]. This type of reactor train configuration has been used very intermittently over the last 50 years, as they can be difficult to construct and operate. They are designed for operations where:
- A reactant is physically adsorbed onto a catalytic site and is then desorbed as a product;
- The rapid pressure swing is designed to reduce the incidence of site blocking, and increase the availability of sites for adsorption to occur;
- The rate constant increases with decreasing space velocity;
- The adsorbed species is less voluminous than the reactant species;
- The adsorption rate constant increases with increasing pressure;
- The desorption rate constant increases with decreasing pressure.
Adsorption is associated with increases in pressure. Desorption is associated with decreases in pressure [13,29,30,31]. The rate of adsorption and desorption is controlled by the construction of a pressure wave (e.g., Appendix A, Appendix A.1), where the pressure wavelength, amplitude, and frequency are controlled by reactor and process design (e.g., Appendix A, Appendix A.1).
This type of process is known as a rapid-pressure-swing-adsorption–desorption (separation) process (RPSAD), or a catalytic-rapid-pressure-swing-adsorption–desorption (separation) process (CPSAD). Its advantage over a conventional (constant flow, constant pressure) reaction environment is that it can enhance the reaction rate for a specific reaction by several orders of magnitude [13,29,30,31].
2.6.2. Reactor Construction
The Halite Reactor and ZVI Reactor (Figure 2), were constructed using 4 mm, 6 mm, 8 mm, 10 mm, 15 mm and 22 mm Cu0 copper tubing, and associated, gas quality, brass fittings and valves purchased from Wickes Ltd. Perth, UK; Screwfix Ltd. Perth, UK; and Cole Parmer, Saint Neots, UK. Pressure gauges, regulators, flow meters, flow controllers, and valves were purchased from Cole Parmer and BOC/Linde. Their process flow diagram is provided by Figure 3.
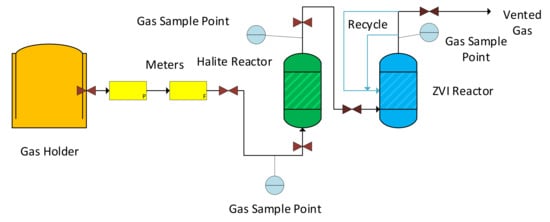
Figure 3.
Process flow diagram for the manufacture of ZVI desalination pellets: P = pressure; F = flow rate. Black flow lines are gas. Blue flow lines are recycled water, which was abstracted from the product gas. The Halite Reactor is a fixed bed/packed bed reactor, containing granular halite, which can be supplemented with ZVI. The ZVI Reactor is an aqueous bubble column reactor, containing a static ZVI bed located below the gas distributor.
2.6.3. Reactor Train
The Halite Reactor (Figure 3) was constructed from 15 mm O.D. Cu0 conduits. The ZVI Reactor was constructed from a 22 mm O.D. Cu0, conduit. The DSA was constructed from 22 mm O.D Cu0 tubing. The halite and ZVI compositional fill are provided in Table 1. The gas filled porosity of the halite bed was about 50%. The ZVI was held in a cartridge attached to the ZVI Reactor.

Table 1.
Halite and ZVI composition used. All amounts are in grams. Halite Reactor column length = 6 m, 15 mm O.D. ZVI Reactor water column length above the gas distributer = 8.3 m, 22 mm O.D.; Fe0 = zero valent iron; Al0 = zero valent aluminium; Cu0 = zero valent copper.
The reactor train (Figure 2 and Figure 3) was operated at ambient temperatures (283 K to 293 K), with the feed gas delivered at 0.3 MPa. The average feed gas flow rate was 30 mL m−1, for 83.3 days
The gas entered the ZVI Reactor at an elevation, which was located 10 cm above the ZVI-water contact. The reactor contained 2.65 L water, above the gas distributor, in an 8.3 m column. The gas bubble diameter, at the point of discharge, in the gas distributor, was 3 mm. Gas was only bubbled through the ZVI Reactor, when the pressure differential (potential) between the USA and DSA (Figure 2) exceeded 0.083 MPa. The reactor was placed on continuous operation. Saline make-up, fresh water (+8.8 g NaCl L−1) was supplied to this reactor, during the reaction period. This structuring (Figure 2 and Figure 3) resulted in a continuous pressure oscillation within the two reactors.
2.6.4. The Halite Rector
The Halite Reactor was constructed for easy maintenance and easy removal/addition of granular halite (Figure 4). Recrystallization of the halite bed, can occur within the Halite Reactor, during prolonged periods of operation. While this recrystallization does not noticeably impede the flow of gas, it may require the use of water dissolution of halite, to empty the reactor.
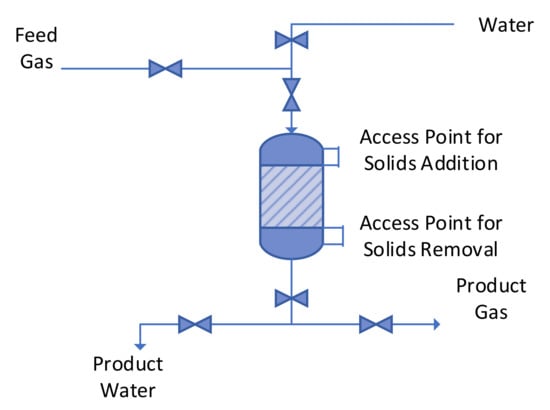
Figure 4.
Halite Reactor showing access points for solids addition and removal, and access points for water used to wash and clean the reactor.
2.6.5. The ZVI Reactor
The ZVI Reactor was constructed for easy maintenance and easy removal/addition of the ZVI (Figure 5). The conduit containing the ZVI, was structured as a demountable cartridge, and was attached to a manifold. The manifold was structured, to be able to allow a ZVI cartridge, to be added to the reactor, or to be removed from the reactor, without requiring the reactor to be taken off line. Further details of the manifold structuring arrangements and options, together with further cartridge design details, are provided in UK Patent GB2520775A.
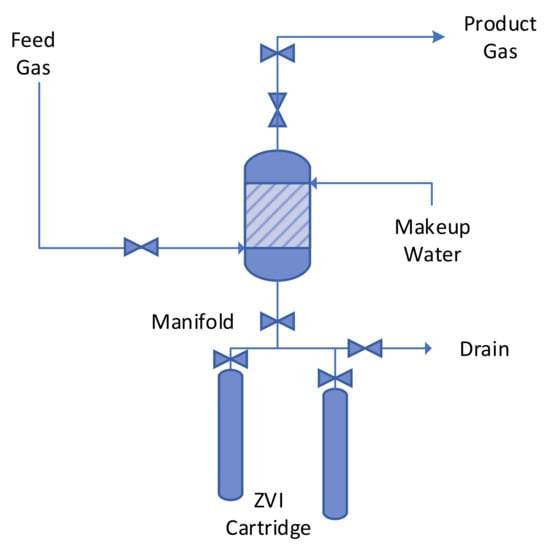
Figure 5.
ZVI Reactor Process Flow Structure.
The removed ZVI cartridges, contained the finished ZVI water treatment product. The removed cartridges were then drained and allowed to dry at ambient temperatures. They were then cut to form finished Cu0 encased pellets about 2.5 cm long (Figure 6).
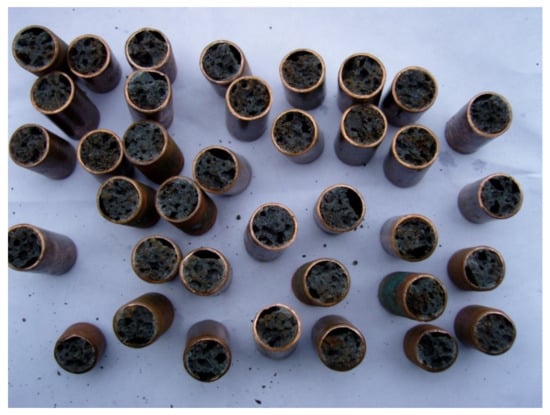
Figure 6.
Example set of desalination pellets.
3. Results
The operating results associated with the Halite Reactor and the ZVI Reactor are detailed in the Supplementary Information file, Figures S1–S9, and in Appendix A, Appendix A.2, Table A1 and Table A2. The reactor train (Figure 3) produced two products: (i) a hydrogen enriched fuel gas and (ii) desalination pellets. The nature of the gaseous products produced by the Halite Reactor and the ZVI Reactor is addressed in Appendix A.
3.1. Desalination Pellets: Characterisation
Fe hydroxyoxides have traditionally been characterised in terms of the Eh and pH of their formation environment [37], and as the minerals white rust (Fe(OH)2) [38], green rust (Fe(OH)(2<n<3)) [38] (e.g., formate green rust [39], chloride green rust [40,41], sulphate green rust [42,43] and carbonate green rust [44,45]); red rust (Fe(OH)3; FeOOH species and ferrates. While this approach is useful for mineral characterisation, it is not particularly meaningful when it comes to analysing Fe-polymers [46,47]. The chemical characterisation of Fe-polymers is in its infancy, but they effectively occupy the mineralogical space (and redox space [37]), currently filled by the Fe2+ to Fe3+ minerals (e.g., Akaganeite (FeOOH), Green rust formate; Green rust chloride; Green rust sulphate; green rust carbonate).
Fen+ ions hydrolyse to form different ion polymers (e.g., Japanese patent JP6017768B2; Chinese patent CN111606464A). These polymers include mono-nuclear hydroxyl complexes, e.g., Fe3+, Fe(OH)2+, Fe(OH)2+, Fe(OH)3 (molecule), Fe(OH)4− (Fe2(OH)24+ and Fe3(OH)45+), some small polymers, and instantaneous reaction products (termed Fe(a)) [48,49]; polynuclear hydroxyl complexes, with medium and high molecular mass (e.g., Fe(OH)24+; Fe(O2H6)3+; Fe3(OH)45+; Fe5(OH)96+), termed Fe(b) [48,49] (e.g., Chinese patent CN113880208A; CN210261456U; CN210261453U; CN210261454U; CN113197151A); and larger polymer or colloidal species which include inert macro-molecular coagulation (termed Fe(c)) [48,49].
Fe(b) has a high flocculation activity and the flocculates grow by aggregation and accretion [48,49]. This polymer (Fe(b)) is an effective pollutant scavenger and is the target polymer in the desalination pellet construction. The polymers present will comprise a mixture of Fe(a), Fe(b) and Fe(c).
3.1.1. Fe(b) Polymers
The type of Fe(b) structure produced is a function of water pH and the anions used to template the structure. In this study, the Fe(b) is created in pH neutral to alkaline conditions, where the templating is undertaken by Cl− ions and HxCO3(2−x) ions to produce a [n-Fe(b)]p@[n-C0]3a polymer. Operating in acid to neutral conditions (pH = 1 to 6) templating can be undertaken using one or more of Cl−, SO42−, or NO3− ions, R-OH, and R-COOH species. Polymer formation typically requires the pH to be shifted from acidic (or neutral) to alkali conditions. The term @ is used to indicate that the species is physically (or ionically) adsorbed on the base polymer.
Examples of a nano-desalination catalyst polymer ([n-Fe(b)]p@[n-organic]a polymer). have been produced with phenols, substituted phenols, enols, ketoacids, ketones, some alkaloids, some sugars, amides, some carboxylic acids, amino acids, urea, and polyphenols. Effective polymers have been constructed using polyphenols, phenols, pyrocatechol, resorcinol, hydroquinone, pyrogallol, phloroglucinol, o-cresol, m-cresol, p-cresol, nitro-phenol, salicylic acid, naphthol, orcin, histidine, urea, leucine, isoleucine, methionine, norvaline, phenylalanine, tryptophan, tyrosine, valine, tannic acid, ketoisocaproic acid, ketomethylthiobutyric acid, phenylpyruvic acid, indole-pyruvic acid, hydroxyphenylpyruvic acid, ketoisovaleric acid, gallic acid.
The polymer catalyst can be supported, or unsupported. This study focuses on producing a catalyst which is supported. The support used can be m-Fe0, or m-Cu0, or m-Al0, as in this study. Both Fe0 and SiO2 can form effective supports for a polymer (e.g., Figure 7).
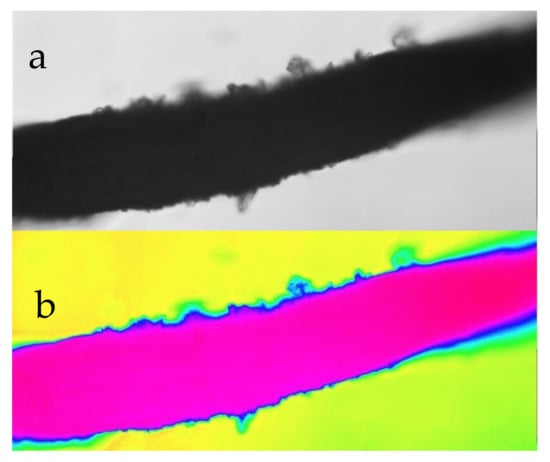
Figure 7.
Detail of an iron fibre-coated with a [n-Fe(b)]p@[n-urea]a polymer catalyst. (a) transmitted light; (b) false colour. Field of view 0.4 mm.
An example of an effective rapid operation [n-Fe(b)]p@[n-urea]a polymer desalination catalyst supported on iron fibres is shown in Figure 7. The polymer forms a very thin coating on the outer surface of the metal support (highlighted in blue in Figure 7). This example, shows a polymer which operates [13] as follows:
- Under constant oxygen partial pressure conditions
- ◦
- The polymer sites show rapid physical adsorption and extremely slow product desorption, i.e., no effective desalination. Any physical desorption of ions is into the water body.
- Under oscillating oxygen partial pressure conditions
- ◦
- The polymer sites show rapid physical adsorption and rapid product desorption;
- ◦
- The rate of ion removal decreases rapidly with time as the proportion of sites blocked with competing ions, e.g., OH−, increases. The effective desalinating operating life of this catalyst type in a batch of water is 3 to 35 h. Switching to a new, lower pH, batch of water results in OH- desorption from the sites and allows the desalination process to be repeated. The desalination products have not been fully elucidated from this process, but will include HClO, ClOxn−, NaClO, etc.
In the example, in Figure 7, the polymer is in contact with a support (Fe0) and an open pore which is in contact with the water body.
The desalination pellets are constructed to contain a mixture of both open pores (which are in contact with the water body) and dead-end pores (which are not in direct contact with the water body). They are encased by polymer. The polymers form a continuous surface, which is in contact with both the open pores and the dead-end pores.
This structuring creates a situation where:
- Under constant oxygen partial pressure conditions
- ◦
- The polymer sites show rapid physical adsorption and extremely slow product production and desorption.
- ◦
- The physically adsorbed ions are desorbed into the dead-end pores, without change (resulting in an observed desalination), or the open pores (resulting in no change to the water salinity).
- The salinity of the water will remain unchanged over time, if the pellets contain no accessible dead-end pores.
- The salinity of the water will change over time, if the pellets contain accessible dead-end pores.
- Once the salinity in the dead-end pores reaches an equilibrium level, no further movement of saline ions from the open pores to the dead-end pores occurs and the desalination process effectively ceases.
3.1.2. Fe(b) Polymer Construction
The ZVI Reactor was designed to coat the ZVI particles with a n-Fe(b)-polymer@n-C0, where the carbon was derived from the gas feed, i.e.,
Fe-[n-Fe(b)]p + 2aCO + aCH4 = Fe-[n-Fe(b)]p@[n-C0]3a + 2aH2O,
The Fe-[n-Fe(b)]p@[n-C0]3a polymers change composition to reflect changes in the Eh and pH of the surrounding water environment, within the ZVI cartridge during formation.
3.1.3. Pellet Operation
The underlying desalination reaction associated with a Fe-[n-Fe(b)]p@[n-C0]3a polymer is an aqueous, redox, electrochemical reaction. The pellet acts as a natural hydrogen-iron battery (e.g., [50]), using a sodium hydroxide electrolyte, where the sodium (or potassium) hydroxide is produced by the pellet from the water. Fe0 (and associated polymers), when placed in saline water, concentrate NaOH around the ZVI [51].
The pellet design uses a tripolar cell containing Fe0, Al0, and Cu0 (Table 1). In a hydrogen-nickel cell Zircar is often used as a separator for cells as it is relatively incompressible, is chemically stable, and holds the electrolyte in relatively large pores [52]. This structuring is the primary control on the effectiveness of a cell of this type. Characterisation, therefore focuses on the construction of a structurally sound, rigid framework encompassing a porosity, which will not collapse during prolonged exposure to water.
Hydrogen generation within the ZVI Reactor, is used to create a strong porous framework, where the pores (and metals) are coated with a n-Fe-polymer@n-C0. An example is illustrated in Figure 8. During pellet manufacture, the redox environment within the ZVI bed is designed to be within Hydrogen Stability Zone 2 (as defined in Reference [53]). The water body within the ZVI Reactor is maintained in Hydrogen Stability Zone 1 (as defined in reference [53]).
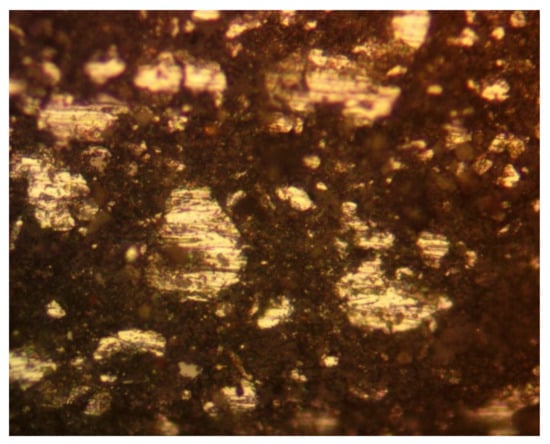
Figure 8.
Photomicrograph of a freshly manufactured pellet. Polished surface, reflected light. Field of view = 0.1 mm. White areas are polished Fe0 metal. Brown/black areas show porosity coated in n-Fe-polymer@n-C0 polymer. The cross-sectional porosity is about 80%.
The assumed electro-chemical operating model for the pellets, within the polymer, is summarised in Figure 9. The polymers are positively charged and will preferentially remove Cl− ions from the water, leaving a residual Na+ ion (NaOH) concentration in the pores. As a simplification, to illustrate the basic principles, Figure 9, shows the end points as Fe(OH)2, Fe(OH)3, and FeOOH.
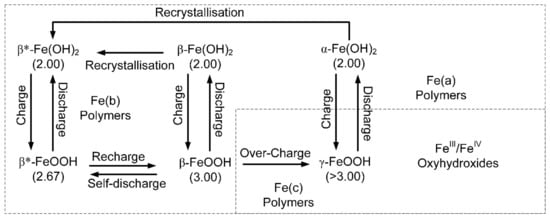
Figure 9.
Simplified, electrochemical model associated with the Fe-polymers. Charge indicates directions, where the change is an increase in the oxidation number of the iron. The terminology and charge relationships shown are for a natural Hydrogen-Iron Battery. The β* notation indicates that the polymer has an oxidation number and ion charge, which can vary in response to changing environmental conditions. The electrochemical terminology used here follows the recommendations of Reference [52].
NaCl Removal
It is assumed that the Fe-polymers are in a dynamic, but oscillatory, relationship with their environment, and provide a link between the open water body and dead-end pores within the pellet. This relationship can be used to provide a transport mechanism for the Cl− ions and Na+ ions, from the water body to the dead-end pores. The internal movement of these ions [13] within the polymers is associated with Schottky defects (e.g., [54]) and Frenkel defects (e.g., [55]). A simplified example of how this movement of ions through the polymer, may operate is summarised in Figure 10.
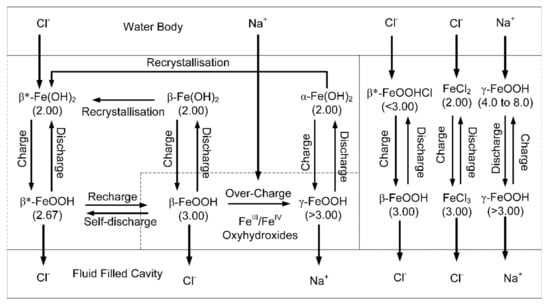
Figure 10.
Simplified electrochemical model showing how the Fe-polymers transport Na+ and Cl− ions from the water body into dead-end pores. The β* notation indicates that the polymer has an oxidation number and ion charge, which can vary in response to changing environmental conditions.
Confirmation, that the NaCl removal mechanism includes sequestration of NaCl in dead end pores, was obtained by extracting pellets from the water following desalination. The pellets were dried in air, and then examined in polished cross sections in reflected light (Figure 11).
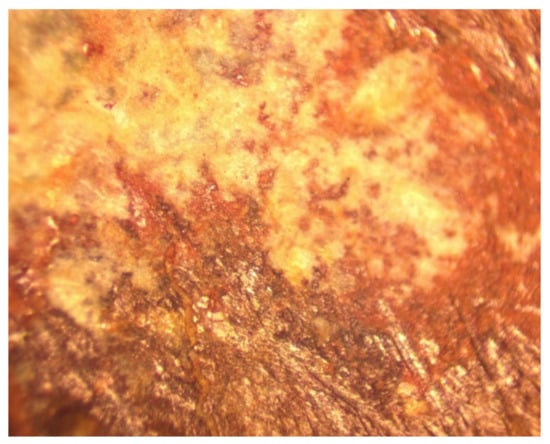
Figure 11.
Example reflected light, polished cross section through a desalination pellet following operation. Dead-end porosity is infilled with NaCl (white). Field of view = 1 mm.
This removal mechanism, indicates that one of the controls on the NaCl removal is the availability of dead-end storage porosity of the pellets. NaCl has an anhydrous density of 2.167 g cm−3. A 2.5 cm pellet, with an internal diameter of 2 cm has an internal volume of 7.8 cm−3. A 2.5 cm pellet, with an internal diameter of 1.3 cm has an internal volume of 3.3 cm−3. If a water body contains 9 g NaCl L−1, removal of 3 g NaCl L−1 will require >1.5 cm3 of dead-end pore storage in the pellets. Removal by this mechanism will not occur if the NaCl is deposited from the polymer into an open pore, which is in contact with the water body.
Reuse Significance
The design constraint for the pellets, is not on the total porosity of the pellets, but is a function of the proportion of dead-end pores in the pellet, which have access to NaCl contained in adjoining open pores.
Cl− Ions Removed on Each Cycle
Conventional electrochemical desalination (EDI) technology coupled with conversion materials, such as Ag/AgCl and Bi/BiOCl couples, can selectively capture Cl− ions over a short time span (e.g., <20 min) and have achieved Cl− removals of 30 to 120 mg Cl− g−1 Bi cycle−1 [56]. They have been tested for up to 200 charge, discharge cycles, and have achieved toral removals of up to 12 g Cl− g−1 Bi [56]. This compares with around 140 mg Cl− removed g−1 Fe (including support) cycle−1 by the desalination pellets in this study. EDI technology is perhaps the technically closest actively managed redox desalination technology. It is energy intensive, requires substantial onsite infrastructure, and obtains a rapid desalination result.
3.2. Desalination Pellets: Desalination Results
5 pellets to 10 pellets, of the ZVI product (Figure 6), were placed in open vessels containing 1 L of static, saline water The vessels were then left at ambient, external, temperatures for a period of 170 days. The salinity of each vessel was measured through this period (e.g., Figure 12, Supplementary Information, Figures S10 and S11). Each vessel demonstrated a linear decline in salinity, until a critical basal salinity was achieved (Figure 12). At this point all further desalination effectively ceased. To assist with the kinetic statistical analysis, only the data associated with the period when desalination occurred are shown in Supplementary Information, Figures S10 and S11.
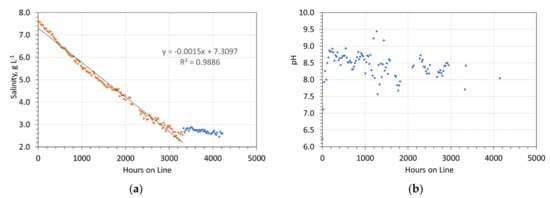
Figure 12.
Example of desalination using a desalination pellet. Note a linear reduction in salinity with time (brown dots) followed by a period with no salinity change (blue dots). Reaction Details: 5 pellets containing 27.12 g desalination catalyst, produced using 40 g NaCl L−1 in the ZVI Reactor; Feed water salinity = 7.6 g NaCl L−1; Reactor size 1 L; temperature range during operation = 0 to 14 °C. (a) Salinity vs. Hours on line; (b) pH vs. Hours on line.
Repeat Analyses
Repeat analyses (Figure 1) demonstrated a high degree of repeatability, with a low outcome variation. The basic reaction is:
Na+ + Cl− in open pore = Na+ + Cl− ion transfer through the polymer = Na+ + Cl− in dead-end pore
3.3. Desalination Pellet: Reaction Kinetics
A zero-order reaction is described by the relationship [57,58,59]:
Ct = n = −kt + Ct = 0
Where Ct = n = ion concentration at time t = n; k = rate constant; t = time, Ct = 0 = initial ion concentration.
A first-order reaction is described by the relationship [57,58,59]:
Ln(Ct = n) = −kt + Ln(Ct = 0)
A second-order reaction is described by the relationship [57,58,59]:
1/(Ct = n) = −kt + 1/(Ct = 0)
The linear relationship in Figure 1 and Figure 11, and Supplementary Information, Figures S10 and S11, between Ct = n and t, indicates that the desalination reaction is a zero-order reaction, or a pseudo-zero-order reaction [57,58,59].
A pseudo-zero-order reaction can occur if a rapid adsorption reaction is followed by a relatively slow desorption reaction, [60,61]: i.e.,
Cl−aq(open porosity) = Cl−ads(on polymer) (Equilibrium)
Cl−ads(on polymer) = Cl−desorbed(dead−end porosity) (Slow)
Langmuir–Hinshelwood (LH) kinetics indicates that the kinetics of a heterogeneous catalytic systems is given by [60,61]:
r = −dC/t = (kKC)/(1+KC)
r = the rate of reaction. This can change with time. C = concentration; k (rate constant) and K (adsorption equilibrium constant) are a function of C [60]. For a pseudo-zero-order reaction KC>>1 [60,61], and (kKC)/(1+KC) = k0 at time t = 0 [60].
Characteristics of zero-order reactions [62,63,64] are that:
- The reaction rate is independent of ion concentration in the open pellet porosity. The associated kinetic controls in this type of environment are provided in reference [65]
- The observed reaction rate is constant and is independent of the concentration of the reactants [66].
- The desalination rate does not increase, or decrease, if the concentration of the ZVI treatment product is altered (compare Supplementary Information Figure S10 with Figure S11). This is a confirmatory characteristic of a zero-order reaction [61,66].
- The reaction rate at high substrate concentration is independent on its availability [61].
- The ion removal ceases abruptly after a period of ion removal (e.g., Figure 12).
3.3.1. Impact of Changing Temperature
No specific, constant temperature, experiments have been undertaken to determine the impact of changing temperature on the desalination rate constant. Consequently, the activation energies associated with the desalination reaction have not been determined.
3.3.2. Impact of Changing Pressure
No specific, constant temperature, constant pressure, experiments have been undertaken to determine the impact of changing temperature and pressure, on the desalination rate constant. Consequently, the activation energies associated with the desalination reaction under conditions of elevated temperature, elevated pressure, and both elevated temperature and pressure have not been determined.
3.4. Predicting Desalination as a Function of Reaction Time
The examples in Figure 1; Supplementary Information Figures S10 and S11, indicate that over a period of time, the achievable desalination may fall within the range 30−70%. The product water salinity (Pws), for a specific water batch, can be described by the linear zero-order equation [62,63,64]:
where [a] = a constant; [Tr] = reaction time, hours; Fw = feed water salinity, g L−1. Examples of these regression equations are provided in Figure 1; Supplementary Information Figures S10 and S11.
Pws, g L−1 = a[Tr] + Fw
There is a linear regression relationship between [a] and Fw, for the data set in Supplementary Information Figures S10 and S11, where:
Mean [a] = −0.0002149[Fw] + 0.000005
R2 = 77.47%; PCC = 0.880, indicating a strong statistical correlation [34,35]. The standard deviation of [a] varies with [Fw], where:
Standard Deviation [a] = 0.000008[Fw] + 0.000046
R2 = 86.45%; PCC = 0.929 indicating a very strong statistical correlation [34,35]. These relationships, appear to hold for between 1500-h and 4000-h reaction time, for ZVI pellets created using a water salinity of 8.8 g NaCl L−1 in the ZVI Reactor. The shorter time period relates to a ZVI product concentration, of about 25 g L−1 (Supplementary Information, Figure S10). The longer time period relates to a ZVI product concentration of about 50 g L−1 (Supplementary Information Figure S11). At the end of the time period, desalination effectively ceases (e.g., Figure 12). The observed desalination period relationship, (for ZVI pellets created using a water salinity of 8.8 g NaCl L−1) in the ZVI Reactor approximates to:
Active desalination period, hours = 80.263[ZVIw] − 39.474
R2 = 98.83%.; PCC = 0.994 indicating a very strong statistical correlation [34,35]. [ZVIw] = weight of ZVI product in the water, g L−1. Figure 13 provides an illustrative relationship between the desalination period and the amount of desalination achieved. A [ZVIw] of 25 g L−1, will require 1 t of ZVI product for each 40 m3 processed.
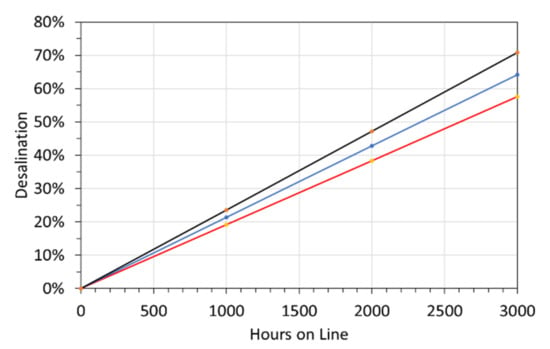
Figure 13.
Example relationship for the expected desalination as a function of time. Determined for feed water with a salinity of 5 g L−1. Red line = 90% probability of a greater desalination. Blue line = mean outcome; black line = 10% probability of a greater desalination. Water containing 20–30 g ZVI treatment product L−1 is expected to cease desalinating after 1500–2000 h. Water containing 50–60 g ZVI treatment product L−1 is expected to cease desalinating after 2500–4000 h.
Controls on the Desalination Rate
Desalination is a two/three-stage process (Equations (8) and (9); Figure 10), where an initial adsorption, is followed by transportation through the polymer and desorption into the dead-end pore. Transport through the polymer is by one or more of diffusion and ionic transport. At time t = 0, the salinity of the dead-end pore is < salinity of the water. At time t = n, the salinity of the dead-end pore >salinity of the water. This implies that the ion movement is not solely in response to the NaCl potential difference, between the water and the dead-end pore. It implies that the Na+ and Cl− ions are desorbed as either a product, or by ion exchange. The redox environment within the dead-end pores (and open pores), will result in the disassociation of water to H+ and OH− [37], and ion exchange between the pores and the water body results, in the pH of the water body increasing (Figure 12).
Movement of an OH− ion from a dead-end pore can create appropriate Schottky and Frenkel defects [13] to allow a countermovement of OH− ions to the water body, and Cl− ions to the dead-end pore. Similarly, a countermovement of H+ ions to the water body, and Na+ ions to the dead-end pore, would result in a net concentration of Na+ ions and Cl− ions in the dead-end pores. The principal control on chemical potential controlling this this fluid movement is the pH (and Eh) of the water body.
Analyses of the water Eh, pH, and NaCl, have established (e.g., Figure 14):
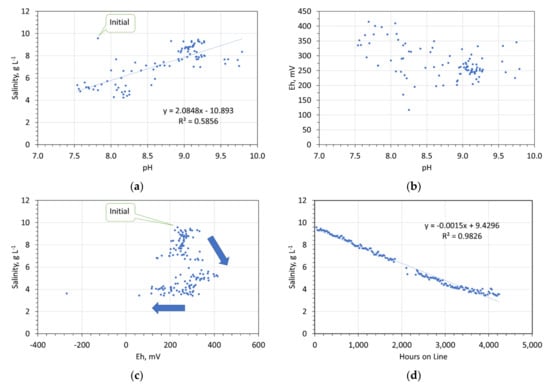
Figure 14.
Redox controls on desalination. 47.5 g desalination pellet L−1. (a) Salinity vs. pH; (b) Eh vs. pH; (c) Salinity vs. Eh; (d) salinity vs. hours on line.
- The pellets initially increase water pH. The subsequent decline in water pH is associated with a decline in water salinity. Desalination effectively ceases when the water pH drops below about 8.2.
- Desalination is associated with a general increase in Eh within the range 200 to 450 mV. Cessation of desalination is associated with a drop in Eh towards −400 mV.
3.5. Pellet Construction: ZVI Reactor Water Salinity
This study used m-Fe0 to construct the desalination pellets and a feed water salinity of 8.8 g L−1, within the ZVI Reactor. Increasing the feed water salinity in the ZVI Reactor increases the desalination rate constant k and increases the NaCl storage capacity of a pellet. This observation applies to water salinities in the ZVI Reactor, within the range 8 to 200 g NaCl. Increasing the NaCl content of the water increases the hydrogen production rate in the ZVI Reactor.
An example relationship between NaCl removal and time, is shown in Figure 15, for a desalination pellet manufactured using a water salinity of 40 g NaCl L−1. This pellet is a more effective desalination agent than the pellets manufactured using a water salinity of 8.8 g L−1. 18 g of this pellet (Figure 15), is able to remove the same amount of NaCl as 50 g of pellets created using a feed water with a salinity of 8.8 g NaCl L−1 (Supplementary Information, Figure S11).
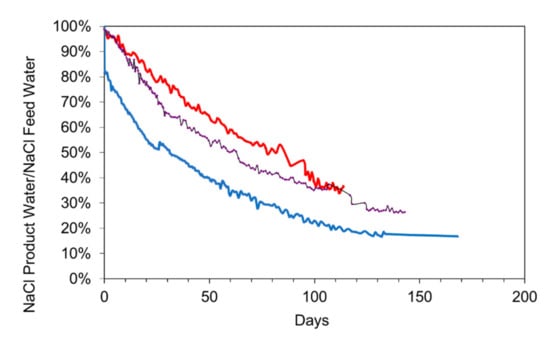
Figure 15.
Comparison of three different materials for the desalination of static saline water: EC (electrical conductivity) = 15.2 mScm−1; Salinity = 7.52 g L−1 for the desalination pellet; EC (electrical conductivity) = 24.9 mScm−1; Salinity = 13.44 g L−1 for the n-Fe0; Temperature = 0.2 to 14 °C; water volume = 1 L). Red = Desalination pellet, 18 g L−1; black = 1 g L−1 n-Fe0; Blue = 25 g L−1 n-Fe0. The 25 g L−1 n-Fe0 displayed a 20% instantaneous desalination associated with the formation of Fe polymers.
Comparison of Desalination Using a Pellet with Desalination Using n-Fe0
Figure 15 shows the relationship between desalination and time for two concentrations of n-Fe0 (50 nm particle size; coated with tetraethyl orthosilicate (TEOS); surface area = 20 m2 g−1) powders. The desalination pellets ceased desalinating the water after 100 days. The n-Fe0 ceased effective desalination of the water after 130 days. The pH changes associated with the three different desalination approaches are shown in Figure 16. Specific points are:
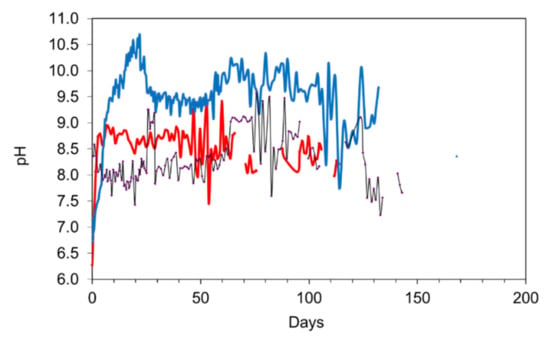
Figure 16.
Comparison of three different materials for the desalination of saline water: Salinity = 7.52 g L−1; Temperature over the reaction period = 0.2 to 14 °C; water volume = 1 L. Red = Desalination pellet, 18 g L−1; black = 1 g L−1 n-Fe0; Blue = 25 g L−1 n-Fe0.
- All three approaches increase the pH of the product water, by increasing the availability of OH− ions, i.e., desalination is associated with an increase in water salinity;
- The desalination pellets typically produce a product water with a pH in the range 7.5 to 8.5. This compares with n-Fe0, which typically produces a product water in the pH range 8 to 11.
The n-Fe0 and desalination pellets operates according to different kinetic models. The different kinetic models can be summarised as:
- Zero order reaction [62,63,64]: Desalination pellet
Ct = n = −0.047t + Ct = 0
R2 = 0.979; PCC = 0.988. This is a very strong statistical relationship [34,35]. The n-Fe0 (Figure 15) does not have a relationship between Ct = n and Ct = 0 which is linear. A different order reaction is in operation in the n-Fe0.
- First order reaction [62,63,64]: n-Fe0 (25 g L−1)
Ln(Ct = n) = −0.0116t + ln(Ct = 0)
R2 = 0.9786; PCC = 0.989. This is a very strong statistical relationship [34,35], and indicates that the n-Fe0 operates using a first-order desalination reaction [62,63,64]. The NaCl or NaCl products are not recoverable from n-Fe0. The products produced by n-Fe0 desalination have not been specifically identified. Figure 15 demonstrates that 1 g n-Fe0 can remove 9.4 g NaCl.
3.6. Pellet Construction: Polymer Type
This study has demonstrated manufacture of a Fe0:Fe(b)-polymer@n-C0 desalination catalyst. Switching the carbon source to a phenolic acid, or carboxylic acid, or a carbonyl, results in the formation of a Fe0:n-Fe(b)-polymer@n-R-CxHyOz polymer.
Examples of entrained n-Fe(b)-polymer@n-R-CxHyOz polymer were trialled using seawater (Figure 17). Initial trials, indicate that this construction results in a very rapid initial desalination, with all desalination effectively ceasing after 0.1 to 5 days (Figure 17). The n-Fe-polymer@n-R-CxHyOz polymer desalination powders represent a future product development route.
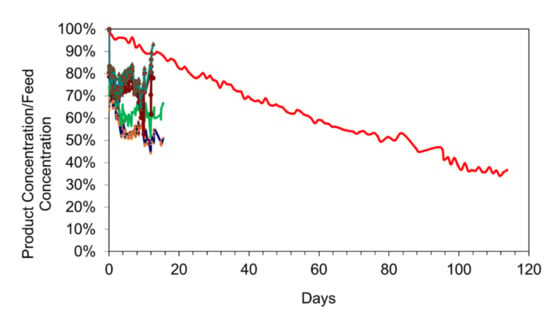
Figure 17.
Comparison of different materials for the desalination pellet construction: Salinity = 7.52 g L−1; Temperature = 0.2 to 14 °C; water volume = 1 L. Red = Desalination pellet, m-Fe0: n-Fe-polymer@n-C0, 18 g L−1; Salinity = 7.52 g L−1; Other colours: desalination pellet: unsupported n-Fe-polymer@n-R-CxHyOz polymer (four different polymer combinations; Blue, green, brown, buff = different n-Fe-polymer@n-gallic acid polymers; light blue: n-Fe-polymer@n-urea polymers); Each polymer contains 2 g Fe L−1; Feed water seawater salinity for the organic polymers = 32 g L−1. These polymer examples, show an almost instantaneous, 20% to 35% desalination after the polymer is added to the water.
3.7. Pellet Reuse
Following partial desalination of a batch of water, the pellets can be transferred to a fresh batch of saline water. In some, but not all, instances the pellets will partially desalinate the new batch of water.
Once the pellets have ceased to operate as effective desalination agents, three options are available:
- Option 1: the pellets are dried and reduced to powder. They are then washed in warm water, to remove the NaCl, and returned to the ZVI Reactor to be reconstituted (with ZVI makeup), as a new ZVI desalination pellet, or
- Option 2: the pellets are dried and reduced to powder. They are then washed in warm water, to remove the NaCl, and returned to the ZVI Reactor to be reconstituted (with ZVI makeup or n-Fe-polymer makeup); dried and then powdered, for use as a new n-Fe-polymer powder. Alternatively (Option 2a): the pellets are dried and reduced to powder. They are then washed in warm water, to remove the NaCl, and are then mixed with and reconstituted (with ZVI makeup, or n-Fe-polymer makeup); dried and then powdered, for use as a new n-Fe-polymer powder, or
- Option 3: the pellets are placed in warm fresh water under low Eh conditions (hydrogen stability zone 1 or hydrogen stability zone 2) to reverse the desalination storage reaction. The warm fresh water will become saline during this process.
When Option 2 or Option 2a is used the Fe-polymers, are produced as particles within the size range 1 to 2000 nm and are operated as a contact catalyst (e.g., Equation (10)). Figure 18 provides a process flow diagram for a desalination plant using unsupported entrained n-Fe-polymers.
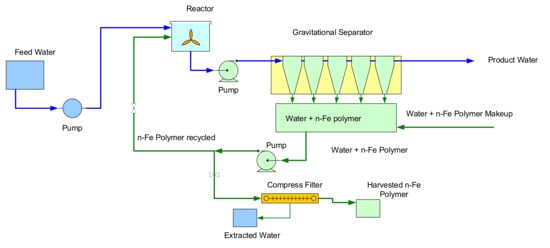
Figure 18.
Process flow diagram for a desalination plant using entrained, unsupported, n-Fe-polymer catalyst.
3.7.1. Option 2: Example Pellet Reuse
Following desalination, the Fe0:Fe(b)@n-C0 polymer was powdered, washed and dried. It was then reconstituted by mixing with a composite n-Fe(b)@polymer. Operating examples from 9 different trial combinations, using the process flow defined in Figure 18, are provided in Table 2. These trials demonstrate a high selectivity for Cl- removal, and a variable selectivity for Na+ removal. Individual catalysts batches remained active for up to 30 days. The removed Na+ and Cl- ions are not retained in the catalyst particles. Discussion of the products associated with this type of desalination is provided elsewhere [13].

Table 2.
Continuous flow trials decontaminating water containing Cl− ions and Na+ ions. Reactor volume = 1.5 L; Flow rate: Trials 1, 3 = 0.25 L m−1; Trial 4 = 0.2 L m−1; Trial 5 to 9 = 0.4 L m−1; Temperature = <20 °C; Product analysis was made following the processing of the initial 45 L of feed water. Reactor: 3 m long conduit (4 cm O.D.). Product + 24 hrs indicates the product water composition following 24 h in storage. Polymer details: (i) 1 g L−1 of reconstituted: Fe0: plus (ii) Fe(b)@n-C0 polymer + n-Fe(b)@polymer. Trial 1: 0.3 g L−1 n-Fe(b)-S-gallic acid polymer; Trial 2: 0.2 g L−1 n-Fe(b)-S-gallic acid polymer; Trial 3: 0.7 g L−1 n-Fe(b)@Ca(b) polymer; Trial 4: 1.5 g L−1 n-Fe(b)@Ca(b)@K(b) polymer; Trial 5: 0.7 g L−1 n-Fe(b)@Ca(b); Trial 5: 0.7 g L−1 n-Fe(b)@Ca(b); Trial 6: 1.2 g L−1 n-Fe(b)@Ca(b)@K(b) polymer; Trial 7: 1.2 g L−1 n-Fe(b)@Ca(b)@K(b)@organic polymer; Trial 8: 1.8 g L−1 n-Fe(b)@Ca(b)@K(b)@Mn@Zn@organic polymer; Trial 9: 1.8 g L−1 n-Fe(b)@Ca(b)@K(b)@Mn@Zn@organic polymer; Ion concentrations were measured using ion selective Na+ and Cl− electrodes.
3.7.2. Potential Applications for Option 2a
One of the potential markets for n-Fe0 desalination (Figure 15), is the desalination of reject brine from a conventional desalination plant. This market was first identified in 2016 [67] as a possible way of achieving a zero-waste discharge from a large scale conventional reverse osmosis desalination plant (Figure 19). In the example shown in Figure 19, the plant receives 222,400 m3 d−1 saline water to produce 100,000 m3 d−1 of potable water plus 122,400 m3 d−1 of reject brine, which is discharged in to the environment. This environmental discharge could be removed, by recycling the water, following ZVI desalination to the reverse osmosis plant (Figure 19). This is not a suitable application for the desalination pellets (Figure 15) due to the long reaction time. The n-Fe0 operates using a first order reaction (Figure 15). It may therefore be possible, to accelerate its desalination reaction rate, by adjusting one or more of kins (intrinsic or normalised rate constant) as (surface area), or Pw (Fe0 concentration), to allow n-Fe0 to potentially economically process this reject brine.
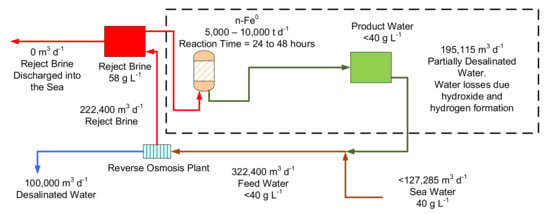
Figure 19.
Conceptual design for a zero-waste discharge conventional desalination plant based on 2016 technology, where the n-Fe0 was not reusable. n-Fe0 requirements are reduced, if the n-Fe0 can be reused over a prolonged period. n-Fe0 reaction profile as shown in Figure 14, requiring a 24-to-48-h reaction time, and ZVI reactors containing 222,400 to 444,800 m3 of water.
An example, Option 2a catalyst constructed from a weight ratio of 1 g used desalination pellet mixed with 6 gm n-Fe(b)@Ca@K@COx@SOx@malic acid polymer, has been trialled using the process flow configuration in Figure 18. At a concentration of 4 g n-polymer L−1 the catalyst has been able to reduce the salinity of seawater by 60.5%, over a reactor residence period of 6 min from [22.11 g Cl− L−1 + 14.43 g Na+ L−1 ] to [6.61 g Cl− L−1 + 7.84 g Na+ L−1 ] (operating conditions: temperature = 4.6 °C; Feed water pH = 8.69; Product water pH = 6.91). This experimental outcome indicates that it may, in the future (following more extensive trialling), be possible to reconstruct the used desalination pellets, to rapidly process reject brine from a large scale conventional reverse osmosis desalination plant (Figure 20).
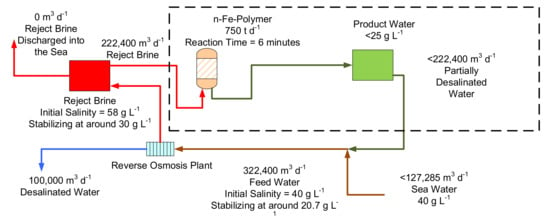
Figure 20.
Conceptual design for a zero-waste discharge conventional desalination plant based on 2022 technology, using a recycled n-Fe-polymer to process the reject brine. The required n-Fe-polymer reactor size is around 1000 m3. This figure illustrates what might be possible if the experimental results can be transferred into a commercial environment at a future date.
This is an important potential future desalination market (and direction of research) for the reconstituted desalination pellets. This highlighted potential future application addresses the environmental impact, which can result from reject brine discharge into the environment [68].
3.8. Finished Product
The manufacturing process (Figure 2 and Figure 3) allows the pellets to be created in a central manufacturing facility, before being sold and transported to a location, where they can be used. It is envisaged that the pellets would be sold in bulk, 1 tonne, permeable bags (about 0.9 × 0.9 × 0.9 m) to allow easy transportation for delivery to site, and easy on-site movement (and insertion into the water body) using a JCB, Manitou, or equivalent vehicle. The zero-order nature of the process, indicates that no exact calculations of the amount of ZVI are required to effect treatment. This robustness, will allow the application of the pellets to individual agricultural units, or to individual impoundments, to be made using rule of thumb guidelines, e.g., An application of 1 t 40 m−3 will give the potential for 30% desalination, while an application of 1 t 20 m−3 will give the potential for 60% desalination.
4. Applications
4.1. Pellet Applications
The pellets when placed in a static water body, will result in its gradual desalination. They do not require any site infrastructure, or site energy supply, to operate. They require no external energy source, and require no manned operation during the desalination period. They only produce partially desalinated water and produce no reject brine.
The pellets operate over a long time period, and are therefore only suitable for applications where an instant desalination is not required. Three categories of potential application meet these criteria. They are: (i) the desalination of saline, anthropogenic, impoundments [1]; (ii) the desalination of salinized soil; and (iii) the desalination of some saline aquifers [2].
The performance information contained in Supplementary Information Figures S10 and S11 indicates that a typical impoundment containing 2000 m3 of saline water, will require 60 t of ZVI pellets to achieve 30% desalination and 120 t ZVI pellets to achieve 60% desalination. A slight change to the water salinity in the ZVI Reactor (Figure 14), during manufacture, could allow 43 t of ZVI pellets to achieve 60% desalination.
4.2. Pellet Markets
The slow desalination associated with these pellets, will allow them to be used to address three specific markets. These are:
- Partial desalination of livestock feed water;
- Partial desalination of irrigation water;
- Partial desalination of salinized soils to allow arable usage.
Each of these approaches is discussed in the next sections.
4.2.1. Partial Desalination of Saline Livestock Feed Water
About 25% of the global land area is used to rear livestock [11]. Many of these areas are not suitable for arable crops and are located in arid areas, or areas which are prone to drought (e.g., much of northern and southern Africa, most of Australia, central south America, much of central Asia, parts of China, India, and Pakistan).
Different animals have different degrees of tolerance to different water salinities (Figure 20) [1]. Their tolerance to water salinity can be split into three categories [1,69,70,71,72]: (i) safe, where they are tolerant to the salinity and gain weight; (ii) suitable, where they can tolerate the salinity, but will only gain weight at a slow rate; (iii) poor, where the high salinity will result in weight loss. The salinity ranges associated with these categories varies with animal type and variety. The boundaries associated with each of these categories will vary with regulatory authority, geographical region, livestock type, soil conditions, available feed type and environmental conditions [69,70,71,72]. The regulatory boundaries used in this study are published by the governments of New South Wales, South Australia and Western Australia [69,70,71,72]. Figure 21 demonstrates that application of the desalination pellets to saline water, may convert a water body, which is classified as being unsuitable for livestock drinking water, to water that is safe for livestock to drink.
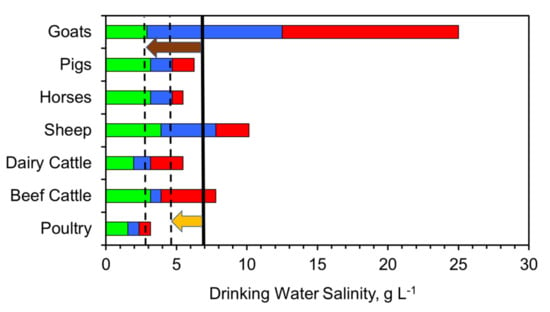
Figure 21.
Tolerance of livestock to salinity. Green = safe; blue = suitable; green = poor. Black line = average saline water salinity of 6.9 g L−1; Dashed black line = average partially desalinated water salinity with 30% desalination, and 60% desalination; Orange arrow indicates the salinity removed by 30% partial desalination. Brown arrow indicates the salinity removed by 60% partial desalination.
This example demonstrates, that in the event of drought, or another environmental event, which results in salinization of livestock feed water, it will be possible to plan to reduce the salinity of the associated livestock feedwater pools and impoundments, by up to 60%, by the addition of ZVI desalination pellets.
4.2.2. Impact of Desalination on Crop Yield
Approximately 1000 km3 a−1 of saline water is used each year to irrigate arable land. This water is either held in impoundments, or abstracted from saline aquifers. The desalination pellets provide an opportunity to reduce the salinity of the saline irrigation water held in impoundments (prior to use), by perhaps 30 to 60%.
Saline irrigation water has a negative impact on crop yield and crop value, when compared with irrigation using freshwater [73]. However, irrigation, with saline water, may give a higher crop yield, than no irrigation. The number of crop varieties that can be grown, decreases with increasing irrigation water salinity, and increasing soil salinity [73].
Saline irrigation results in a gradual salinization of the soil. This is associated with a decrease in the soil’s vertical permeability, and confines the principal throughflow to the topsoil, or the upper part of the subsoil. As a rough guide, the pore water salinity of the soil, will be 20 to 30% higher than the salinity of the irrigation water [73]. An example relationship between soil water salinity and crop yield is shown in Figure 22. The relationships shown are based on the UN parameters defined in reference [73]. This example demonstrates that a 30 to 60% decrease in irrigation water salinity will have a major impact on the sales revenue received for a specific crop. In this example, the impact of the desalination pellets could increase the yield of wheat grass hay, or silage, by a factor of 5, and could allow new crops such as barley to be grown on the land.
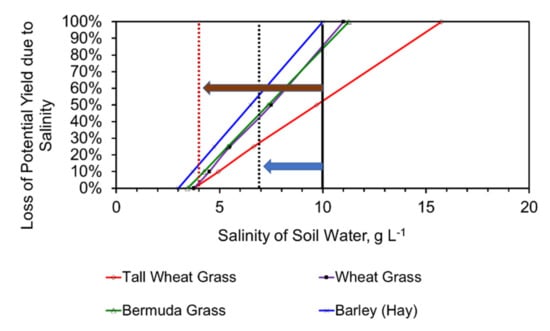
Figure 22.
Salinity tolerance of four livestock grass crops. Solid black line = Expected soil salinity if it is irrigated with saline irrigation; Dotted black line = Expected soil salinity if it is irrigated with partially desalinated water; Blue arrow indicates the change associated with 30% desalination; Dotted brown line = Expected soil salinity if it is irrigated with partially desalinated water, Brown arrow indicates the change associated with 60% desalination.
Crop yield is a function of many parameters, of which irrigation water salinity, is an important factor. Other factors such as climate, soil type, and agricultural practice can have a major impact on yield. As a rough indicative guide, the expected crop yield, Ye, can be defined [1,73] as:
Ye = Ys (1 − (a(1 + c)S − b)),
Ys = expected crop yield when irrigated with fresh water (t ha−1, or another yield unit). S = Irrigation water salinity. [a], [b] and [c] are constants; The values of these constants used in this study are derived from the graphs in [1] and the tables in [73]; (1 + c)S = soil water salinity. Supplementary Information, Table S3, provides an indication of indicative crop yield versus irrigation water salinity for a variety of crops.
This study, indicates that an average of 30% to 60% desalination, may be possible. This changes the indicative crop yield equation to:
Yd = Ys (1 − (a(1 + c)(1 − e)S − b)),
Where [e] is the expected desalination. Yd = the expected crop yield using partially desalinated water. Desalination increases the expected yield of a crop. This is demonstrated in Supplementary Information, Table S4.
Irrigation with partially desalinated water will not be an economic solution for all crops, which are currently irrigated with saline water. The expected increase in crop yield due to irrigation with desalinated water can be assessed as:
Increase in crop yield due to desalination =Yd − Ye,
Supplementary Information, Table S5 provides an indication of the expected increase in crop yield associated with desalination for a variety of crop types, expressed as a proportion of the crop yield, when the crop is irrigated with fresh water.
These observations indicate that the desalination pellets could potentially be used to increase crop yields by either partially desalinating the saline impoundments, feeding an irrigation system, or by directly desalinating the shallow groundwater, within the fields, to reduce the soil water salinity.
4.2.3. Desalination of Salinized Soils
Salinized soils account for >1 billion hectares globally. Salinization results in reduced crop yield (e.g., Figure 22), and may render agricultural ground unsuitable for arable or livestock farming. The pellets can be used to desalinise, or reduce the rate of salinization, in salinized soils. While the exact approach is site specific, and will require an understanding of the local hydrology. The basic approach requires the pellets to be placed in the soil, or in ditches intersecting the soil at an elevation, which is below the phreatic surface.
The current trend in some salinized soil areas to use raised field irrigation methods, creates an opportunity to insert a layer of pellets within the raised field (Figure 23). While the hydrology of this type of scheme is complex [74,75], it is possible to draw a number of conclusions.
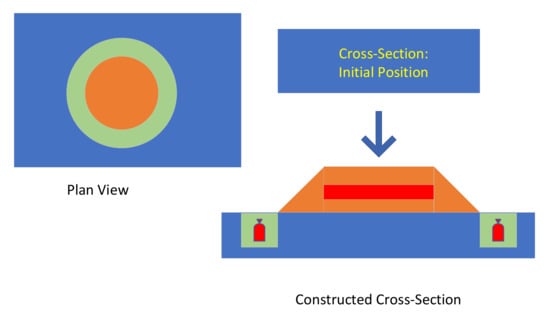
Figure 23.
Raised Field Irrigation Scheme. A raised mound is created (brown), surrounded by a ditch (green). ZVI desalination pellet placement locations are shown in red.
- With no irrigation, the soil water salinity will increase sharply with increasing soil depth [74];
- With fresh water irrigation the overland flow runoff and shallow throughflow will accumulate in the ditch surrounding the raised field (Figure 23). The soil water salinity will increase with soil depth. Lateral infiltration from the ditch will create a fresh water influx under the base of the raised field [74];
- With saline water irrigation, the soil salinity will increase with depth, but the soil will be less saline (Figure 24), than the situation where no irrigation occurs [74];
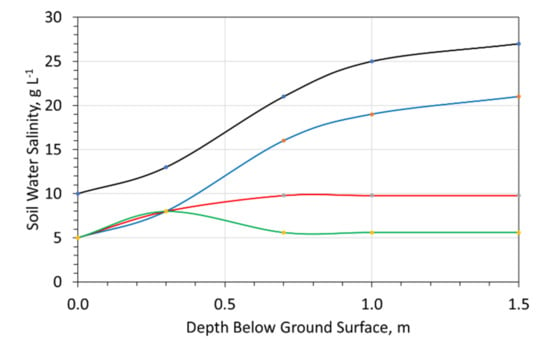 Figure 24. Raised Field Irrigation Scheme-Soil Water Salinity vs. depth below ground surface. Black line = no irrigation; Blue line is irrigation with 14 g NaCl L−1; Red and Green lines are the expected soil salinity range following irrigation with 14 g NaCl L−1, where the ZVI desalination treatment product placed at about 0.7 m depth within the raised field.
 - Constructing the raised field, with the ZVI desalination pellets, placed within the mound and the ditch (Figure 23), may allow the raised field to be irrigated with saline water, and the water recovered from the associated ditch (Figure 23). This is expected to reduce the groundwater salinity within the raised field (Figure 24).
5. Commercial Manufacture of the Desalination Pellets
This study has demonstrated production of about 1 kg of ZVI desalination pellet material over 84 days. The manufacturing process required 3.6 m3 of feed gas. A manufacturing plant receiving 14 m3 m−1 of feed gas (from an internally heated, Maclaurin carbonization reactor [36]) would expect to produce around 1700 t a−1 of desalination pellets. This pellet weight would be suitable for the desalination of between 34,000 and 68,000 m3 of saline water.
The single pass gas analysis, demonstrated in this study (Figure 2 and Figure 3; Appendix A) is not particularly efficient, and results in a high proportion of the carbon (CO, CH4) in the feed gas being discharged as a waste product or fuel gas.
Two options to improve the utilization of the feed gas, are available. They are: (i) to place a number of ZVI Reactors operating in series [76,77,78]; (ii) to incorporate a recycle loop within the ZVI reactor to achieve a maximum utilization of the product gas [76,77,78]. Both manufacturing options increase the weight of desalination pellets produced and increase the hydrogen content of the product gas while decreasing the amount CO and CH4 in the product gas.
5.1. Manufacturing the Desalination Pellets Using ZVI Reactors Placed in Series
Table 3 indicates that a plant complex comprising nine ZVI Reactors, arranged in series, receiving 14 m3 m−1 of feed gas, would be able to produce about 9850 t a−1 of desalination pellets with the potential to desalinate >390,000 m3 a−1, by about 30%.

Table 3.
Expected Product Gas Composition, pellets manufactured and desalination water potential of the manufactured pellets. Assumptions: ZVI Reactors are placed in series where the product gas from one reactor is passed directly into the next downstream reactor. Manufactured volumes are based on a feed gas flow rate of 14 m3 m−1. The product gas volume from 9 reactors placed in series is 23.69 m3 m−1.
5.2. Manufacturing the Desalination Pellets Using a Single ZVI Reactor with Product Gas Recycle
The ZVI Reactor, resulted in a significant removal, of CO and CH4, with desorption of both CO2 and H2. These observations allow the product gas to be recycled to the ZVI reactor, with a high recycle ratio to produce a hydrogen rich product gas.
The use of recycle loops in catalytic reactors, is common [76,77,78]. The assumptions used in designing the recycle loop are:
- New feed gas flow rate = JF
- Recycle gas flow rate = JR
- Gas feed flow rate entering the reactor, GF = JF + JR
- The gas product flow rate leaving the reactor = GP
- The recycle gas flow rate, JR = aGP
- The product gas flow rate leaving the reactor, JP = GP − JR
a = the recycle ratio; 0 < a < 1. The recycle ratio is defined as the proportion of the product gas, leaving the ZVI Reactor, which is recycled as feed gas. The recycle process flow is summarised in Figure 25.
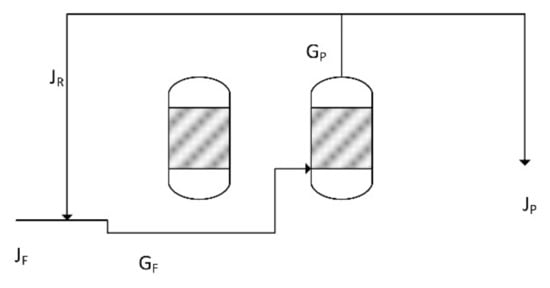
Figure 25.
Summary of the reactor recycle process flow. Two reactors are shown, a Halite Reactor and a ZVI Reactor. The product gas from the ZVI Reactor is recycled.
On each cycle, 9.1% of the CO + 12.86% of the CH4, are converted to n-C0. Each mole of n-C0 produced, is associated with the formation of 4.26 moles H2 + 0.124 moles C2H2 + 0.41 moles CO2. Recycling a proportion of the product gas to the reactor results (Table 4) in the formation of a product gas dominated by hydrogen, with removal of CO, CH4, and the production of some CO2. The associated expected pellet production volumes, combined with the anticipated water volumes the pellets could potentially desalinate are provided in Table 5 as a function of recycle ratio.

Table 4.
Impact of recycle ratio on the stable average gas product output. Part of the gas product (recycle gas) is recycled from the ZVI Reactor to the ZVI Reactor (Figure 24). Recycle Period = 480 min. All gas flow rates are standardised to the feed gas supplied from a Maclaurin retort, processing 20 t coal d−1. The bulk of the removed carbon is retained in ZVI desalination pellets. Recycle ratio is the proportion of product gas which is recycled to the ZVI Reactor.

Table 5.
Expected Pellets manufactured and desalination water potential of the manufactured pellets. Assumptions: A proportion of the product gas is recycled to the ZVI Reactor; Manufactured volumes are based on a feed gas flow rate of 14 m3 m−1 (Table 4).
5.3. Manufacturing Costs and Economics
The cost of manufacturing the pellets is a function of commodity prices for the gas feedstock, and Fe0, Al0, and Cu0 costs, and government regulation. These costs and associated regulations vary with time and with geographic region. Currently the cost of manufacturing the desalination pellets in an economy with proximity to the source materials and a low net zero regulatory environment is perhaps 10 to 40% of the cost of manufacturing the same pellets in a UK or EU location which has a high net zero regulatory environment.
A small simple Maclaurin carbonisation reactor train [36] producing around 16,000 t Fe0-Fe(b)polymer@n-C0 desalination pellet a−1 (suitable for desalinating about 600,000 m3 a−1) could have the process structure indicated in Figure 26. An indication of costs is provided as follows:
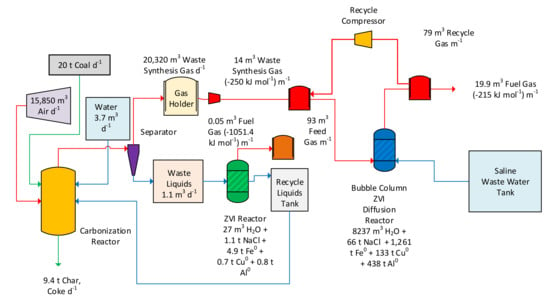
Figure 26.
Example process flow diagram for a plant manufacturing 16,000 t a−1 of desalination pellets.
- Solids
- ◦
- 20 t coal d−1 (at USD360 t−1) = USD2,628,000 a−1: Purchase Cost
- ◦
- 9.4 t coke d−1 (at USD600 to 720 t−1) = USD2,058,600 to 2,470,320 a−1: Sale Price
- ▪
- Net Loss: USD157,680 to 569,000 a−1;
- Liquids converted to fuel gas
- ◦
- Fuel gas: 72 m3 d−1 (1051.4 kJ mol−1) = USD500 MWh = USD171,322 a−1 sale price;
- Synthesis gas sold as fuel gas
- ◦
- Fuel Gas: 20,164 m3 d−1 (250 kJ mol−1) = USD500 MWh = USD11,406,250 a−1: sale price.
- Net revenue (profit) if the synthesis gas is sold as a carbon rich fuel gas = USD11,008,570 a−1 to USD11,419,970 a−1.
- This study converts this synthesis gas to a hydrogen rich fuel gas. The appropriate cashflow adjustments are:
- Synthesis gas converted to a hydrogen rich fuel gas:
- ◦
- Fuel Gas: 28,658 m3 d−1 (215 kJ mol−1) = USD500 MWh = USD13,943,325 a−1: sale price.
- ◦
- ZVI: Around 8000 t a−1 = USD1000 t−1 = USD8,000,00 a−1; purchase cost
- Net revenue (profit) if the synthesis gas is sold as a hydrogen rich fuel gas
- ◦
- Net revenue: if the ZVI pellet sale price is USD0 t−1 = USD5,545,645 a−1 to USD5,957,046 a−1. The desalination pellet sale price will be a function of local market conditions.
- ◦
- Net revenue: if the ZVI used is completely recycled following use as a desalination pellet = USD13,545,645 a−1 to USD13,957,046 a−1. Selling, or lending, the pellets to a customer for $0 t−1, coupled with an automatic return of the used pellets to the plant will allow the Year 3 onwards profit from the plant to be closer to USD13,545,645 a−1 to USD13,957,046 a−1.
In August 2022, energy was selling in the EU at spot prices of around USD500 MWh. Commodity prices were based on the FOB ranges provided by www.alibaba.com in August 2022. Energy prices and commodity prices are very volatile and vary greatly through the year and between regional markets. The rough revenue and sales economic analysis provided here indicates that it may be possible to operate the process at a profit. This profit will be subject to energy costs for air, other operating costs, taxes, regulatory costs, financing costs, and depreciated capital costs, all of which are regionally specific. A detailed economic evaluation of this process is outside the scope of this study.
The Option2a recycle application option for the pellets illustrated in Figure 20, raises the possibility of the pellets:
- Initially being used to process around 40 m3 t−1 pellets for irrigation;
- Reconstitution of the pellets to process reject brine from a desalination plant where about 2000 m3 of reject brine are processed by 1 t of reconstituted desalination pellet (Figure 20).
The economics of this strategy has not been fully elucidated at this stage, but it has the potential to create a revenue stream from 16,000 t a−1 of pellets, of >USD32 million.
5.4. Improving the Desalination Efficiency of the Desalination Pellets
The desalination efficiency of the ZVI pellets is directly related to the amount of n-C0 produced and retained in the reactor (within the ZVI cartridge) during their manufacture. The amount of carbon retained in the reactor increases with an increasing recycle ratio.
Desalination is a zero-order reaction, where the rate constant, kobs, is determined [57] as:
kobs = −((Ct = n)−(Ct = 0))/t
Ct = n = salinity (or ion concentration, at time t = n; Ct = 0 = initial salinity or ion concentration; t = time interval between t = n and t = 0, in seconds. The removal of ions from water using n-Fe0 is a function of kins (the normalised rate constant); surface area, as, (m2 g−1) and weight, or amount of catalyst (Pw) (Figure 14) [1,57]:
kobs = kins as Pw
Reactor trials pellet trials have established that, when the gas in the ZVI Reactor (Figure 2 and Figure 3) is N2, or CO2, or O2, then kobs = 0. In the desalination reaction involving the desalination pellets, Pw is directly proportional to the fraction of carbon removed from the feed gas in the ZVI Reactor. This removed fraction increases, with increasing recycling. This decreases the time required to achieve a specific level of desalination, with a specific dosage of pellets, where:
Pws, g L−1 = ac[Tr] + Fw
[c] is a function of the ratio of the carbon removed at the selected recycle ratio relative to the carbon removed with no recycle. The significance of the recycle ratio in the ZVI reactor on the potential desalination efficiency of the desalination pellets is illustrated in Figure 27. This demonstrates that by increasing the proportion of n-C0 in the ZVI desalination pellets, it may be possible to decrease the time taken to achieve a 60% desalination from around 4000 h to less than 500 h.
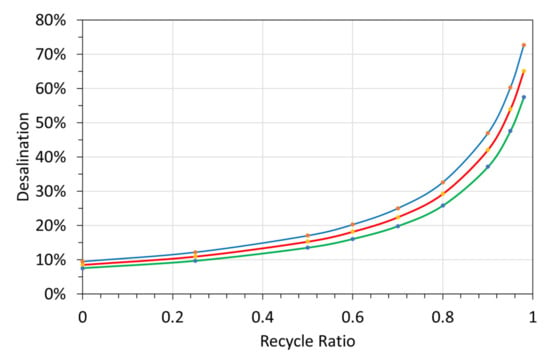
Figure 27.
Impact of recycle ratio in the ZVI reactor, on the desalination associated with the ZVI pellets, 50 g L−1. The n-C0 content of the ZVI pellets, may increase with increasing recycle ratio. The graph shows the results for a feed water with a salinity of 5 g L−1, and a reaction time of 500 h. Red = median outcome: Blue = upper quartile; green = lower quartile.
6. Novelty
The key issues that contribute to the advancement of knowledge in saline water purification using desalination pellets can be summarised as follows:
- Prior ZVI desalination studies have established that ZVI can partially desalinate water. The desalination rates are very variable and tend to represent a first order, or second order, removal reaction. The desalination products from these ZVI processes remain unknown.
- The desalination pellets are unusual in that they operate with a zero-order reaction, and sequester the removed NaCl to dead-end porosity within the pellets.
- ◦
- A zero-order reaction produces a desalination rate, which is independent of the feed water salinity;
- ◦
- Desalination ceases after a pre-determined (and predictable) amount of time;
- ◦
- The rate constant for the pellets zero-order desalination reaction, is set in the manufacturing process within the ZVI Reactor. It predictably changes, with increasing feed water salinity, within the ZVI reactor during the manufacturing process.
- ◦
- The standard deviation associated with the pellets desalination rate constant is demonstrated in this study to be small. These observations, mean that it is possible to use the pellets to predictably desalinate water with a high of degree of statistical confidence in the expected desalination outcome range.
- Table 6 Compares the pellet desalination outcomes with other published studies.
 Table 6. Comparison of ZVI desalination pellet performance with the desalination performance of 50 nm Fe0 (PVP (polyvinylpyrrolidone) coated) and steel wool (Fe0:Fe(b)@ureapolymer); as = particle surface area; Pw = ZVI concentration. * = steel wool (Figure 7), which is operated in a catalytic pressure-swing-adsorption-desorption diffusion reactor.
7. Conclusions
This study established that a reducing gas feed containing CO and CH4 was required to manufacture the desalination pellets. A by-product of the manufacturing process was the production of significant quantities of hydrogen.
The pellets desalinate water using a zero-order reaction process. This means that the amount of desalination achieved is primarily a function of the available reaction time. The amount of desalination pellets placed in the water (above a critical level), will not control the desalination rate, but will control the total amount of desalination that could occur. The statistical analysis established that the amount of desalination, associated with a specific pellet batch, was statistically predictable.
The next stage in the development of this process is the construction of an integrated engineering/pilot scale desalination pellet manufacturing plant processing a live feed gas from a synthesis gas source, combined with field tests using impoundments and tanks (100–5000 m3) containing saline water, to confirm that the desalination observed in 1 L containers can also be observed in field scale tanks and impoundments. This set of testing would then allow field trials to commence targeting the desalination of impoundments for irrigation water use and the desalination of salinized irrigated soils.
Supplementary Materials
The following supporting information can be downloaded at: https://www.mdpi.com/article/10.3390/w14172639/s1. Figure S1: Halite Reactor. Carbon Monoxide Relationships; Figure S2: Halite Reactor. Carbon Dioxide Relationships; Figure S3: Halite Reactor. Methane and Hydrogen Relationships; Figure S4: ZVI Reactor. Carbon Monoxide Relationships; Figure S5: ZVI Reactor. Carbon Dioxide Relationships; Figure S6: ZVI Reactor. Methane and Hydrogen Relationships; Figure S7: Halite Reactor: Hydrocarbon Compositions; Figure S8: ZVI Reactor: Hydrocarbon Compositions; Figure S9: Hydrocarbon product compositions from the ZVI Reactor; Figure S10: Water salinity decline with time. 25 g ZVI pellet L−1. Figure S11: Water salinity decline with time. 50 g ZVI pellet L−1. Table S1: Zero valent iron reactions in redox hydrogen Stability Zone 2. Table S2: Hydrogen producing reactions within the two-reactor system. Table S3. Indicative crop yields as a function of salinity. Table S4. Indicative crop yields (following desalination) as a function of the salinity of the water entering the impoundment (prior to desalination); Table S5. Indicative crop yield value created by desalination
Funding
This research received no external funding.
Institutional Review Board Statement
Not applicable.
Informed Consent Statement
Not applicable.
Data Availability Statement
The data used in this study are placed in the figures and tables contained within the paper, and the Appendices.
Acknowledgments
The editorial team, and the four reviewers are thanked for their incisive constructive comments and suggestions.
Conflicts of Interest
The author declares no conflict of interest.
Appendix A. Reactor Design Issues and Results
Appendix A.1. Reactor Fluid Flow Design
The feed gas, JF, is discharged from a reactor, as a product gas, at a rate, JP (Figure 2). The time spent between entering the reaction environment and leaving the reaction environment (the residence time) is tr. In a conventional continuous flow, fixed/packed bed reactor, or fluidised bed reactor, the flow rate through the reaction environment is constant, and the space velocity, SV (m3 gas h−1 m−3 catalyst), is constant. For most reactions, the observed rate constant, kobs increases, as the space velocity decreases. The relationship between kobs and SV, for most reactions is not constant. For most reactions, a decrease in SV will result in a disproportionate increase in kobs. Therefore, creating a situation, where not all the gas molecules spend the same length of time in the reaction environment, will result in an increased value for kobs, e.g.,
Ct = n/Ct = 0 = Σ exponent(−(kins as Pw tr)),
The summation is for gas molecules 1 to n. kins = intrinsic (normalised) rate constant; as = particle surface area; Pw = particle concentration.
It follows, that if a feed gas enters the reactor at a rate x, and a product gas leaves the reaction environment at a rate x − y, that the magnitude of y is a function of the space velocity. Oscillating the pressure (or gas flow rate) within these constraints will result in y being a function of the magnitude and frequency of the pressure oscillation. These objectives are met when fluids are processed in a reactor, where the reactor contains one or more elastic permeable barriers (EPB) and fluid flow, Q, through each permeable barrier varies cyclically, where (UK Patent GB2470764B):
- each EPB separates an Upstream Storage Area (USA, e.g., an upstream plenum) from a Downstream Storage Area (DSA, e.g., a downstream plenum), and
- each EPB is constructed from one or more of a fluid, membrane, particulate material, reactant, inert material, and catalyst, and
- each EPB has a permeability, k, which changes in response to changes in driving force, ΔP, where ΔP = PU − PD − PL, and PL = pressure losses (Pa) associated with the fluid flow, Q, across the EPB; PU = pressure (Pa) in the area located immediately upstream of the EPB; PD = pressure (Pa) in the area located immediately downstream of the EPB; k = permeability of the EPB (m3m−2s−1Pa−1), and
- the permeability, k, of each EPB increases as ΔP increases, and
- the permeability, k, of each EPB decreases as ΔP decreases, and
- the changes in permeability, k, of each EPB, can be gradual, or abrupt, or a combination, and
- ΔP associated with each EPB cyclically increases and decreases with time, and
- ΔP, PU, and PD are in a constant state of flux, and
- PU, and PD cyclically increase and decrease with time, and
- PL changes with time or remains constant, and
- fluid flow, Q, through each EPB is: Q = k ΔP, or Q = k (ΔP−Δχ), where Δχ = correction for fugacity; Q = fluid flow through each EPB (m3 m−2 s−1), and
- fluid flow, Q, through each EPB decreases as k ΔP decreases, or k (ΔP−Δχ) decreases, and
- fluid flow, Q, through each EPB increases as k ΔP increases, or k (ΔP−Δχ) increases, and
- the reactor contains one or more USA, and the reactor contains one or more DSA, and
- each USA is associated with one or more EPB, and
- each DSA is associated with one or more EPB, and
- each USA is associated with one or more DSA, and
- each DSA is associated with one or more USA, and
- each USA contains a volume of fluid, and
- each DSA contains a volume of fluid, and
- the volume of fluid in each USA associated with a specific EPB cyclically increases and decreases with time, and
- the volume of fluid in each DSA associated with a specific EPB cyclically increases and decreases with time, and
- cyclic decreases in the volume of fluid in a USA correspond to cyclic increases in the volume of fluid in the associated DSA, and
- cyclic increases in the volume of fluid in a USA correspond to cyclic decreases in the volume of fluid in the associated DSA, and
- each USA has a pressure, PU, which cyclically increases and decreases with time, and
- ΔP decreases and PU decreases, as the volume of fluid in each USA associated with a specific EPB decreases, and
- ΔP increases and PU increases, as the volume of fluid in each USA associated with a specific EPB increases, and
- each DSA has a pressure, PD, which cyclically increases and decreases with time, and
- ΔP decreases and PD increases, as the volume of fluid in each DSA associated with a specific EPB increases, and
- ΔP increases and PD decreases, as the volume of fluid in each DSA associated with a specific EPB decreases, and
- at any instant in time, the pressure, PU, in each USA is greater than, or equal to, the pressure, PD, in the associated DSA, and
- the reactor is used to undertake catalytic reactions, and
- catalyst is present in one or more parts of the reactor, and
- the catalyst is a solid, or a fluid, or a combination thereof, and
- the reactor processes one or more fluids, and
- reactants include one or more fluids, and products include one or more fluids, and
- fluids enter the reactor through one or more upstream conduits, which are attached to each USA, and
- the maximum fluid flow through each EPB is greater than the average fluid flow entering the associated USA through one or more upstream conduits, and
- the minimum fluid flow through the EPB is less than the average fluid flow entering the associated USA through one or more upstream conduits, and
- fluids entering the reactor through one or more upstream conduits are either reactants, or are reactants and non-reactants, and
- fluids are removed from the reactor through one or more downstream conduits, which are attached to each DSA, and
- fluids leaving the reactor through one or more downstream conduits are either products and residual reactants, or are products, residual reactants, and non-reactants, and
- conduits which allow fluids to enter the reactor and fluids to leave the reactor are controlled by valves, and
- fluids entering each USA through one or more upstream conduits are liquids or gases, and
- liquid fluid flow into each USA is independent of PU, ΔP, the volume of fluid in the USA, fluid flow, Q, through the associated EPB, and the permeability, k, of the associated EPB, and
- gaseous fluid flow into each USA cyclically increases and decreases with time, where decreases in gaseous fluid flow into the USA are associated with increases in PU, and increases in gaseous fluid flow into the USA are associated with decreases in PU, and the pressure in the upstream conduits is always greater than PU.
Appendix A.2. ZVI Pellet Manufacturing Reactor Train
The operating results associated with the Halite Reactor and ZVI Reactor (Figure 2 and Figure 3) are graphically detailed in the Supplementary Information file, Figures S1–S9.
Appendix A.2.1. Halite Reactor
The average product gas composition, normalised to the feed gas, is provided in Table A1. The average product gas flow rate = 24.471 mL m−1. The quantitative data results are provided in the Supplementary Information File Figures S1–S3, and S7. C2+ compositions are provided in Figure S7. The positive regression correlations between CO:CH4, CO:CO2 and CO2:CH4 in these figures are consistent with a rapid-pressure-swing-adsorption–desorption process [13,29,30,31].
The net adsorption reaction is:
15.99H2 + 3.89 CH4 + 1.21CO = [5.1C0] + 1.21H2O + 29.56 H2(ads)
The net desorption reaction is:
[2.74C0] + 5.16H2O = 0.08C2H2 + 2.58 CO2 + 5.08 H2(ads)
The excess n-C0 is either retained in the halite bed, or is entrained in the product gas and transported to the ZVI Reactor.
Statistical linear relationships (Supplementary Information Figures S1, S2 and S3) exist between the different data sets:
- CO:CH4; R2 = 0.9981; PCC = 0.999; Very strong positive linear statistical relationship containing a data clump, where CO = >12%. This results from CO desorption, which is associated with low rates of CH4 adsorption. Where CO = <12%, both CH4 and CO adsorption have occurred.
- CO:CO2; R2 = 0.9733; PCC = 0.9865; Very strong positive linear statistical relationship containing a data clump, where CO = >12% and CO2 >8.33%, indicating desorption of both CO and CO2. The relationship contains outliers which could be interpreted as indicating CO2 adsorption associated with CO desorption. This linear correlation, and the linear correlation between CO and CH4, are interpreted as indicating a common intermediary adsorbed product of C0. This concept was first demonstrated in 1905 in French Patent 355,900.
- CO:H2; R2 = 0.908; PCC = 0.952; Very strong positive linear statistical relationship containing a data clump, where CO = >12% and H2 outliers. The data could be interpreted as indicating that H2 desorption is associated with CO desorption, e.g.,
nCO + [C0] + H2O = (n+1) CO + H2
- CO:C2+; R2 = 0.078; PCC = 0.279; Weak positive linear statistical relationship containing a data clump, where CO = >12% and C2+ outliers are >0.5%. The data could be interpreted as indicating that C2+ and H2 desorption is associated with CO desorption, e.g.,
nCO + [4C0] + 2H2O = (n+2) CO + C2H4
Under this model, periods of CO adsorption will be correlated with lower levels of C2+ formation, e.g.,
2CO + 4H2 = [2C0] + 2H2O + 2H2 = C2H4 + 2H2O
- CO2:CH4; R2 = 0.9749; PCC = 0.987; Strong positive linear statistical relationship containing a data clump, where CO2 = >8.33%. The data could be interpreted as indicating that CH4 adsorption is associated with both CO2 adsorption and CO2 desorption, through the provision of C0 for desorption, and hydrogen for adsorption, e.g.,
[C0] + 2H2O = CO2 + 2H2
CH4 = [C0] + 2H2
- CO2:H2; R2 = 0.9749; PCC = 0.987; Strong positive linear statistical relationship containing a data clump, where CO2 = >8.33% and H2 >0.5%.
- CO2:C2+; R2 = 0.0763; PCC = 0.276; Weak positive linear statistical relationship containing a data clump, where CO2 = 8.33% and C2+ outliers are >0.5%. This relationship indicates that the C2+ outliers may result from a desorption reaction of the form:
[5C0] + 2H2O = CO2 + C2H4
- CH4:H2; R2 = 0.9127; PCC = 0.955; Strong positive linear statistical relationship containing a data clump, where CH4 = >12% and H2 >0.5%. This is interpreted as indicating that H2 desorption occurs during periods when low levels of CH4 adsorption occur. The primary interpreted process associated with CH4 adsorption is interpreted as:
CH4 + 2CO = [3C0] + 2H2O
- CH4:C2+; R2 = 0.077; PCC = 0.277; Weak positive linear statistical relationship containing a data clump, where CH4 = >12% and some C2+ = >0.5%. This is consistent with the primary role of the CH4 being to provide a source of C0.
- H2:C2+; R2 = 0.1423; PCC = 0.377; Weak positive linear statistical relationship containing a data clump, where H2 = <1.5% and C2+ = <0.5%. The data could be interpreted using a polynomial expression, where C2+ = 39.129[H2]2 − 0.6058[H2] + 0.0028. This gives a R2 = 0.3184; PCC = 0.564; representing a moderate positive statistical correlation where C2+ increases with the availability of H2.
- CH4: Product Gas volume: R2 = 0.9646; PCC = 0.982; Strong positive linear statistical relationship, indicating that product gas volumes are always less than the feed gas volumes.

Table A1.
Product gas composition from the Halite Reactor. Product gas compositions are normalised to the feed gas composition.
Table A1.
Product gas composition from the Halite Reactor. Product gas compositions are normalised to the feed gas composition.
| H2 | N2 | CO | CO2 | CH4 | C2+ | |
|---|---|---|---|---|---|---|
| Feed | 16.88% | 46.03% | 11.97% | 8.33% | 16.79% | 0.00% |
| Product | ||||||
| Mean | 0.89% | 46.03% | 10.75% | 10.91% | 12.90% | 0.08% |
| Standard Deviation | 0.30% | 0.00% | 3.14% | 3.76% | 3.55% | 0.28% |
| Minimum | 0.09% | 46.03% | 0.00% | 0.02% | 0.00% | 0.00% |
| 1st Quartile | 0.75% | 46.03% | 10.18% | 9.21% | 12.24% | 0.01% |
| Median | 0.89% | 46.03% | 12.29% | 12.33% | 14.50% | 0.03% |
| 3rd Quartile | 1.02% | 46.03% | 12.71% | 13.62% | 15.12% | 0.07% |
| Maximum | 3.41% | 46.03% | 14.77% | 15.48% | 16.14% | 4.43% |
Appendix A.2.2. ZVI Reactor
The average product gas composition, normalised to the feed gas, is summarised in Table A2. The average product gas flow rate = 27.44 mL m−1. The quantitative data results are provided in the Supplementary Information File Figures S4–S6, S8 and S9. The hydrocarbon product compositions are provided in Figures S8 and S9. The average generated gas composition was: 89.4% H2 + 8.6%CO2 + 2.0%C2+. The positive regression correlations between CO:CH4, CO:CO2 and CO2:CH4 in these figures are consistent with a rapid-pressure-swing-adsorption–desorption process (RPSAD) [13,29,30,31].
The net adsorption reaction is:
1.66 CH4 + CO = 2.66 C0 + H2O + 2.32 H2
The net desorption reaction is:
1.09 C0 + 2.18H2O = 1.09CO2 + 2.18H2
The net hydrogen balance reaction, from other processes is:
[Fe0@1.57C0] + 13.72H2O + 13.72e− = [Fe0@1.57C0] + 13.72OH− + 6.86H2
Equations A11 to A13 indicate that, based on the average outcome, all the required n-C0, is generated within the ZVI Reactor. This allows the manufacturing process design to be simplified, such that the Halite Reactor is omitted. Detailed discussion of the adsorption and desorption process is outside the scope of this study. However, the hydrocarbon and hydrogen production routes present in the reaction environment within the ZVI bed are summarised in Supplementary Information, Tables S1 and S2.
Statistical linear relationships (Supplementary Information Figures S4, S5 and S6) exist between the different data sets:
- CO:CH4; R2 = 0.9449; PCC = 0.972; Very strong positive linear statistical relationship containing outliers, where CO = >10%.
- CO:CO2; R2 = 0.5679; PCC = 0.7535; Strong positive linear statistical relationship containing a data, where CO = >10.75% and CO2 >10.9%, indicating desorption of both CO and CO2 can occur.
- CO:H2; positive linear statistical relationship where substantial H2 discharges are associated with CO discharges.
- CO:C2+; Negligible positive linear statistical relationship where high levels of CO desorption are associated with C2+ outliers of >0.5%.
- CO2:CH4; Negligible linear statistical relationship containing a data clump, between CH4 = 5% to 15% where CO2 outliers can exceed 50%.
- CO2:H2; Positive linear statistical relationship indicated by outliers where CO2 = >8.33% and H2 >20%.
- CO2:C2+; Weak positive linear statistical relationship where C2+ outliers are >0.5%.
- CH4:H2; No obvious statistical relationship between these two parameters, suggesting that the H2 is not produced directly from the CH4.
- CH4:C2+; No obvious statistical relationship between these two parameters, suggesting that the C2+ is not produced directly from the CH4.
- H2:C2+; No obvious statistical relationship between these two parameters, suggesting that the C2+ is not produced by the same process as the H2.
- CH4: Product Gas volume: Positive linear statistical relationship, with high volume outliers resulting from hydrogen production.

Table A2.
Product gas composition from the ZVI Reactor. Product gas compositions are normalised to the feed gas composition. FBR = Halite Reactor. The table demonstrates CO + CH4 adsorption and H2 + CO2 + C2+ desorption.
Table A2.
Product gas composition from the ZVI Reactor. Product gas compositions are normalised to the feed gas composition. FBR = Halite Reactor. The table demonstrates CO + CH4 adsorption and H2 + CO2 + C2+ desorption.
| H2 | N2 | CO | CO2 | CH4 | C2+ | |
|---|---|---|---|---|---|---|
| Feed from FBR | 0.89% | 46.03% | 10.75% | 10.91% | 12.90% | 0.08% |
| Product | ||||||
| Mean | 12.25% | 46.03% | 9.76% | 12.01% | 11.25% | 0.18% |
| Standard Deviation | 31.46% | 0.00% | 4.05% | 13.09% | 4.12% | 0.64% |
| Minimum | 0.07% | 46.03% | 0.00% | 0.00% | 0.01% | 0.00% |
| 1st Quartile | 0.92% | 46.03% | 7.74% | 6.02% | 9.25% | 0.02% |
| Median | 1.29% | 46.03% | 10.78% | 10.90% | 12.74% | 0.04% |
| 3rd Quartile | 6.12% | 46.03% | 12.19% | 13.27% | 14.42% | 0.12% |
| Maximum | 365.22% | 46.03% | 38.68% | 211.93% | 20.63% | 9.90% |
References
- Antia, D.D.J. Desalination of Water Using ZVI (Fe0). Water 2015, 7, 3671–3831. [Google Scholar] [CrossRef]
- Antia, D.D.J. Provision of Desalinated Irrigation Water by the Desalination of Groundwater within a Saline Aquifer. Hydrology 2016, 4, 1. [Google Scholar] [CrossRef]
- Jehan, S.; Iqbal, M.; Samreen, T.; Liaquat, M.; Kanwal, S.; Naseem, M. Effect of Deficit Irrigation Practice on Nitrogen Mineralization and Nitrate Nitrogen Leaching under Semi-Arid Conditions. J. Water Resour. Prot. 2022, 14, 385–394. [Google Scholar] [CrossRef]
- Potapov, P.; Turubanova, S.; Hansen, M.C.; Tyukavina, A.; Zalles, V.; Khan, A.; Song, X.-P.; Pickens, A.; Shen, Q.; Cortez, J. Global maps of cropland extent and change show accelerated cropland expansion in the twenty-first century. Nat. Food 2021, 3, 19–28. [Google Scholar] [CrossRef]
- Siebert, S.; Burke, J.; Faures, J.-M.; Frenken, K.; Hoogeveen, J.; Döll, P.; Portmann, F.T. Groundwater use for irrigation—A global inventory. Hydrol. Earth Syst. Sci. 2010, 14, 1863–1880. [Google Scholar] [CrossRef]
- Zhao, H.; Di, L.; Sun, Z. WaterSmart-GIS: A Web Application of a Data Assimilation Model to Support Irrigation Research and Decision Making. ISPRS Int. J. Geo-Inf. 2022, 11, 271. [Google Scholar] [CrossRef]
- Arboleda, P.; Ducharne, A.; Yin, Z.; Ciais, P. Tuning an improved irrigation scheme inside ORCHIDEE land surface model and assessing its sensitivity over land surface hydrology and energy budget. In Proceedings of the EGU General Assembly 2022, Vienna, Austria, 23–27 May 2022. EGU22-1984. [Google Scholar] [CrossRef]
- Amundson, R. Soil biogeochemistry and the global agricultural footprint. Soil Secur. 2021, 6, 100022. [Google Scholar] [CrossRef]
- Boretti, A.; Rosa, L. Reassessing the projections of the World Water Development Report. npj Clean Water 2019, 2, 15. [Google Scholar] [CrossRef]
- Negacz, K.; Malek, Z.; de Vos, A.; Vellinga, P. Saline soils worldwide: Identifying the most promising areas for saline agriculture. J. Arid Environ. 2022, 203, 104775. [Google Scholar] [CrossRef]
- Liu, S.; Wang, Y.; Zhang, G.J.; Wei, L.; Bin Wang, B.; Le Yu, L. Contrasting influences of biogeophysical and biogeochemical impacts of historical land use on global economic inequality. Nat. Commun. 2022, 13, 1–14. [Google Scholar] [CrossRef]
- Shi, M.; Gao, Z.; Wan, L.; Guo, H.; Zhang, H.; Liu, J. Desalination of saline groundwater by a weakly permeable clay stratum: A case study in the North China Plain. Environ. Earth Sci. 2019, 78, 547. [Google Scholar] [CrossRef]
- Antia, D.D.J. Provision of Desalinated Irrigation Water by the Desalination of Groundwater Abstracted from a Saline Aquifer. Hydrology 2022, 9, 128. [Google Scholar] [CrossRef]
- Aende, A.; Gardy, J.; Hassanpour, A. Seawater Desalination: A Review of Forward Osmosis Technique, Its Challenges, and Future Prospects. Processes 2020, 8, 901. [Google Scholar] [CrossRef]
- Zapata-Sierra, A.; Cascajares, M.; Alcayde, A.; Manzano-Agugliaro, F. Worldwide research trends on desalination. Desalination 2021, 519, 115305. [Google Scholar] [CrossRef]
- Lim, Y.J.; Goh, K.; Kurihara, M.; Wang, R. Seawater desalination by reverse osmosis: Current development and future challenges in membrane fabrication—A review. J. Membr. Sci. 2021, 629, 119292. [Google Scholar] [CrossRef]
- Lin, S.; Zhao, H.; Zhu, L.; He, T.; Chen, S.; Gao, C.; Zhang, L. Seawater desalination technology and engineering in China: A review. Desalination 2020, 498, 114728. [Google Scholar] [CrossRef]
- Bello, A.S.; Zouari, N.; Da’Ana, D.A.; Hahladakis, J.N.; Al-Ghouti, M.A. An overview of brine management: Emerging desalination technologies, life cycle assessment, and metal recovery methodologies. J. Environ. Manag. 2021, 288, 112358. [Google Scholar] [CrossRef]
- Ghalavand, A.; Hatamipour, M.S.; Ghalavand, Y. Clean treatment of rejected brine by zero liquid discharge thermal desalination in Persian Gulf countries. Clean Technol. Environ. Policy 2021, 23, 2683–2696. [Google Scholar] [CrossRef]
- Dindi, A.; Quang, D.V.; AlNashef, I.; Abu-Zahra, M.R. A process for combined CO2 utilization and treatment of desalination reject brine. Desalination 2018, 442, 62–74. [Google Scholar] [CrossRef]
- Shrivastava, I.; Adams, E.E. Pre-dilution of desalination reject brine: Impact on outfall dilution in different water depths. J. Hydro-Environ. Res. 2018, 24, 28–35. [Google Scholar] [CrossRef]
- Al-Obaidi, M.A.; Rasn, K.H.; Aladwani, S.; Kadhom, M.; Mujtaba, I. Flexible design and operation of multi-stage reverse osmosis desalination process for producing different grades of water with maintenance and cleaning opportunity. Chem. Eng. Res. Des. 2022, 182, 525–543. [Google Scholar] [CrossRef]
- Du, J.R.; Zhang, X.; Feng, X.; Wu, Y.; Cheng, F.; Ali, M.E. Desalination of high salinity brackish water by an NF-RO hybrid system. Desalination 2020, 491, 114445. [Google Scholar] [CrossRef]
- Abdelsattar, M.; Hussein, A.; El-Ati, M.A.; Saleem, A. Impacts of saline water stress on livestock production: A review. SVU-Int. J. Agric. Sci. 2020, 2, 1–12. [Google Scholar] [CrossRef]
- Xie, W.; Tang, P.; Wu, Q.; Chen, C.; Song, Z.; Li, T.; Bai, Y.; Lin, S.; Tiraferri, A.; Liu, B. Solar-driven desalination and resource recovery of shale gas wastewater by on-site interfacial evaporation. Chem. Eng. J. 2021, 428, 132624. [Google Scholar] [CrossRef]
- Chang, H.; Liu, B.; Wang, H.; Zhang, S.-Y.; Chen, S.; Tiraferri, A.; Tang, Y.-Q. Evaluating the performance of gravity-driven membrane filtration as desalination pretreatment of shale gas flowback and produced water. J. Membr. Sci. 2019, 587, 117187. [Google Scholar] [CrossRef]
- Shah, K.M.; Billinge, I.H.; Chen, X.; Fan, H.; Huang, Y.; Winton, R.K.; Yip, N.Y. Drivers, challenges, and emerging technologies for desalination of high-salinity brines: A critical review. Desalination 2022, 538, 115827. [Google Scholar] [CrossRef]
- Fronczyk, J.; Pawluk, K.; Michniak, M. Application of permeable reactive barriers near roads for chloride ions removal. Ann. Wars. Univ. Life Sci.-SGGW. Land Reclam. 2010, 42, 249–259. [Google Scholar] [CrossRef]
- Terreni, J.; Trottmann, M.; Franken, T.; Heel, A.; Borgschulte, A. Sorption-Enhanced Methanol Synthesis. Energy Technol. 2019, 7, 1801093. [Google Scholar] [CrossRef]
- Chatsiriwech, D.; Alpay, E.; Kershenbaum, L.; Hull, C.; Kirkby, N. Enhancement of catalytic reaction by pressure swing adsorption. Catal. Today 1994, 20, 351–366. [Google Scholar] [CrossRef]
- Cheng, Y.; Alpay, E.; Kershenbaum, L. Simulation and optimisation of a rapid pressure swing reactor. Comput. Chem. Eng. 1998, 22, S45–S52. [Google Scholar] [CrossRef]
- British Standards Institute. Quality management systems, BSI Handbook. In Statistical Interpretation of Data; British Standards Institute: London, UK, 1985; p. 318. ISBN 0580150712. [Google Scholar]
- Schober, P.; Boer, C.; Schwarte, L.A. Correlation Coefficients: Appropriate Use and Interpretation. Anesth. Analg. 2018, 126, 1763–1768. [Google Scholar] [CrossRef] [PubMed]
- Taylor, R. Interpretation of the Correlation Coefficient: A Basic Review. J. Diagn. Med. Sonogr. 1990, 6, 35–39. [Google Scholar] [CrossRef]
- Goodwin, L.D.; Leech, N.L. Understanding Correlation: Factors That Affect the Size of r. J. Exp. Educ. 2006, 74, 249–266. [Google Scholar] [CrossRef]
- Wellington, S.N.; Cooper, W.R. Low Temperature Carbonisation; Charles Griffin and Company Ltd.: London, UK, 1924; p. 238. [Google Scholar]
- Pourbaix, M. Atlas of Electrochemical Equilibria in Aqueous Solutions; NACE International: Houston, TX, USA, 1974; p. 644. [Google Scholar]
- Génin, J.-M.R.; Ruby, C.; Géhin, A.; Refait, P. Synthesis of green rusts by oxidation of Fe(OH)2, their products of oxidation and reduction of ferric oxyhydroxides; Eh–pH Pourbaix diagrams. Comptes Rendus Geosci. 2006, 338, 433–446. [Google Scholar] [CrossRef]
- Refait, P.; Abdelmoula, M.; Génin, J.-M.R.; Jeannin, M. Synthesis and characterisation of the Fe(II–III) hydroxy-formate green rust. In ICAME 2005; Springer: Berlin/Heidelberg, Germany, 2006; pp. 717–722. [Google Scholar] [CrossRef]
- Rémazeilles, C.; Refait, P. Formation, fast oxidation and thermodynamic data of Fe(II) hydroxychlorides. Corros. Sci. 2008, 50, 856–864. [Google Scholar] [CrossRef]
- Refait, P.; Abdelmoula, M.; Génin, J.-M. Mechanisms of formation and structure of green rust one in aqueous corrosion of iron in the presence of chloride ions. Corros. Sci. 1998, 40, 1547–1560. [Google Scholar] [CrossRef]
- Simon, L.; François, M.; Refait, P.; Renaudin, G.; Lelaurain, M.; Génin, J.-M.R. Structure of the Fe(II-III) layered double hydroxysulphate green rust two from Rietveld analysis. Solid State Sci. 2003, 5, 327–334. [Google Scholar] [CrossRef]
- Christiansen, B.; Balic-Zunic, T.; Petit, P.-O.; Frandsen, C.; Mørup, S.; Geckeis, H.; Katerinopoulou, A.; Stipp, S.S. Composition and structure of an iron-bearing, layered double hydroxide (LDH)—Green rust sodium sulphate. Geochim. Cosmochim. Acta 2009, 73, 3579–3592. [Google Scholar] [CrossRef]
- Legrand, L.; Abdelmoula, M.; Géhin, A.; Chaussé, A.; Génin, J.-M. Electrochemical formation of a new Fe(II)Fe(III) hydroxy-carbonate green rust: Characterisation and morphology. Electrochimica Acta 2001, 46, 1815–1822. [Google Scholar] [CrossRef]
- Génin, J.-M.R.; Aïssa, R.; Géhin, A.; Abdelmoula, M.; Benali, O.; Ernstsen, V.; Ona-Nguema, G.; Upadhyay, C.; Ruby, C. Fougerite and FeII–III hydroxycarbonate green rust; ordering, deprotonation and/or cation substitution; structure of hydrotalcite-like compounds and mythic ferrosic hydroxide Fe(OH)(2+x). Solid State Sci. 2005, 7, 545–572. [Google Scholar] [CrossRef]
- Bottero, J.Y.; Manceau, A.; Villieras, F.; Tchoubar, D. Structure and mechanisms of formation of iron oxide hydroxide (chloride) polymers. Langmuir 1994, 10, 316–319. [Google Scholar] [CrossRef]
- Spiro, T.G.; Allerton, S.E.; Renner, J.; Terzis, A.; Bils, R.; Saltman, P. The Hydrolytic Polymerization of Iron(III). J. Am. Chem. Soc. 1966, 88, 2721–2726. [Google Scholar] [CrossRef]
- Dong, H.; Gao, B.; Yue, Q.; Sun, S.; Wang, Y.; Li, Q. Floc properties and membrane fouling of different monomer and polymer Fe coagulants in coagulation–ultrafiltration process: The role of Fe (III) species. Chem. Eng. J. 2014, 258, 442–449. [Google Scholar] [CrossRef]
- Chen, D.-W.; Liu, C.; Lu, J.; Mehmood, T.; Ren, Y.-Y. Enhanced phycocyanin and DON removal by the synergism of H2O2 and micro-sized ZVI: Optimization, performance, and mechanisms. Sci. Total Environ. 2020, 738, 140134. [Google Scholar] [CrossRef] [PubMed]
- Zhu, Z.; Meng, Y.; Wang, M.; Yin, Y.; Chen, W. A high-performance aqueous iron–hydrogen gas battery. Mater. Today Energy 2020, 19, 100603. [Google Scholar] [CrossRef]
- Antia, D.D.J. ZVI (Fe0) Desalination: Stability of Product Water. Resources 2016, 5, 15. [Google Scholar] [CrossRef]
- Zimmerman, A. Nickel-Hydrogen Batteries: Principles and Practice; Aerospace Press: Hampshire, UK, 2009. [Google Scholar] [CrossRef]
- Antia, D.D.J. Remediation of Saline Wastewater Producing a Fuel Gas Containing Alkanes and Hydrogen Using Zero Valent Iron (Fe0). Water 2022, 14, 1926. [Google Scholar] [CrossRef]
- Guisbiers, G. Schottky Defects in Nanoparticles. J. Phys. Chem. C 2011, 115, 2616–2621. [Google Scholar] [CrossRef]
- Schilling, W. Properties of Frenkel defects. J. Nucl. Mater. 1994, 216, 45–48. [Google Scholar] [CrossRef]
- Wang, H.; Gang, H.; Wei, D.; He, Y.; Alhassan, S.I.; Yan, L.; Wu, B.; Cao, Y.; Jin, L.; Huang, L. Bismuth−titanium alloy nanoparticle@porous carbon composite as efficient and stable Cl-storage electrode for electrochemical desalination. Sep. Purif. Technol. 2022, 296, 121375. [Google Scholar] [CrossRef]
- Ebbing, D.D.; Gammon, S.D. General Chemistry, 8th ed.; Houghton Mifflin Company: New York, NY, USA, 2005; ISBN 0618399429. [Google Scholar]
- Pilling, M.J.; Seakins, P.W. Reaction Kinetics; Oxford Science Publications; Oxford University Press: Oxford, UK, 1995; p. 305. ISBN 019855527X. [Google Scholar]
- Castellan, G.W. Physical Chemistry, 3rd ed.; Addison Wesley: Boston, MA, USA; ISBN 0201103850.
- Kumar, K.V.; Porkodi, K.; Rocha, F. Langmuir–Hinshelwood kinetics—A theoretical study. Catal. Commun. 2008, 9, 82–84. [Google Scholar] [CrossRef]
- Murzin, D.Y. On Langmuir kinetics and zero order reactions. Catal. Commun. 2008, 9, 1815–1816. [Google Scholar] [CrossRef]
- Jayaraman, V. Effectiveness of biporous catalysts for zero-order reactions. J. Catal. 1992, 133, 260–262. [Google Scholar] [CrossRef]
- Eykholt, G.R. Analytical solution for networks of irreversible first-order reactions. Water Res. 1999, 33, 814–826. [Google Scholar] [CrossRef]
- Smidsrød, O.; Haug, A.; Larsen, B.; Gronowitz, S.; Hoffman, R.A.; Westerdahl, A. Kinetic Studies on the Degradation of Alginic Acid by Hydrogen Peroxide in the Presence of Iron Salts. Acta Chem. Scand. 1965, 19, 143–152. [Google Scholar] [CrossRef]
- Ferreira, R.M.Q.; Rodrigues, A.E. Diffusion and catalytic zero-order reaction in a macroreticular ion exchange resin. Chem. Eng. Sci. 1993, 48, 2927–2950. [Google Scholar] [CrossRef]
- Bain, K.; Rodriguez, J.-M.G.; Towns, M.H. Zero-Order Chemical Kinetics as a Context To Investigate Student Understanding of Catalysts and Half-Life. J. Chem. Educ. 2018, 95, 716–725. [Google Scholar] [CrossRef]
- Antia, D.D.J. CHAPTER 28: Desalination of Irrigation Water, Livestock Water, and Reject Brine Using n-ZVM (Fe0, Al0, Cu0). In Advanced Environmental Analysis: Applications of Nanomaterials; The Royal Society of Chemistry: London, UK, 2016; Volume 2, pp. 235–272. [Google Scholar] [CrossRef]
- Panagopoulos, A.; Haralambous, K.-J. Environmental impacts of desalination and brine treatment—Challenges and mitigation measures. Mar. Pollut. Bull. 2020, 161, 111773. [Google Scholar] [CrossRef]
- Curran, G. Water for Livestock: Interpreting Water Quality Tests; Primefact No. 533; New South Wales Department of Primary Industry: Orange, Australia, 2007. Available online: https://www.dpi.nsw.gov.au/__data/assets/pdf_file/0018/111348/water-for-livestock-interpreting-water-quality-tests.pdf (accessed on 30 July 2022).
- Masters, D.G.; Benes, S.E.; Norman, H.C. Biosaline agriculture for forage and livestock production. Agric. Ecosyst. Environ. 2007, 119, 234–248. [Google Scholar] [CrossRef]
- Glauert, S. Livestock and Water Salinity; Farm Note: 249; Government of Western Australia, Department of Agriculture and Food: Perth, Australia, 2007; Available online: https://futurebeef.com.au/wp-content/uploads/2011/09/Livestock_and_water_salinity_DAFWA.pdf (accessed on 30 July 2022).
- New South Wales Government, Department of Primary Industries (NSW DPI). Water Requirements for Sheep and Cattle; Prime Facts 326; NSW DPI: Sydney, Australia, 2014. Available online: https://www.dpi.nsw.gov.au/__data/assets/pdf_file/0009/96273/Water-requirements-for-sheep-and-cattle.pdf (accessed on 30 July 2022).
- Ayers, R.S.; Westcot, D.W. Water Quality for Agriculture; Irrigation and Drainage Paper No. 29, Rev. 1, Reprinted 1989, 1994; Food and Agriculture Organization of the United Nations: Rome, Italy, 1994. [Google Scholar]
- Hu, Q.; Zhao, Y.; Hu, X.; Qi, J.; Suo, L.; Pan, Y.; Song, B.; Chen, X. Effect of saline land reclamation by constructing the “Raised Field -Shallow Trench” pattern on agroecosystems in Yellow River Delta. Agric. Water Manag. 2021, 261, 107345. [Google Scholar] [CrossRef]
- Ghane, E.; Feizi, M.; Mostafazadeh-Fard, B.; Landi, E. Water productivity of winter wheat in different irrigation/planting methods with the use of saline irrigation water. Int. J. Agric. Biol. 2009, 11, 131–137. [Google Scholar]
- Carberry, J.J. Chemical Catalysis and Reaction Engineering; Dover Publications Inc.: New York, NY, USA, 1976; 642p, ISBN 0-486-41736-0. [Google Scholar]
- Field, R. Chemical Engineering; Macmillan: London, UK, 1988; 180p, ISBN 0-333-45249-6. [Google Scholar]
- Green, D.W.; Perry, R.H. Perry’s Chemical Engineers Handbook, 8th ed.; McGraw Hill: New York, NY, USA, 2007; ISBN 978-0-07-142294-9. [Google Scholar]
- Antia, D.D. Irrigation Water Desalination Using PVP (Polyvinylpyrrolidone) Coated n-Fe0 (ZVI, Zero Valent Iron). 2018, pp. 541–600. Available online: https://www.sciencedirect.com/science/article/pii/B9780128110331000226 (accessed on 29 July 2022).
Publisher’s Note: MDPI stays neutral with regard to jurisdictional claims in published maps and institutional affiliations. |
© 2022 by the author. Licensee MDPI, Basel, Switzerland. This article is an open access article distributed under the terms and conditions of the Creative Commons Attribution (CC BY) license (https://creativecommons.org/licenses/by/4.0/).