Rainstorms Inducing Shifts of River Hydrochemistry during a Winter Season in the Central Appalachian Region
Abstract
:1. Introduction
2. Materials and Methods
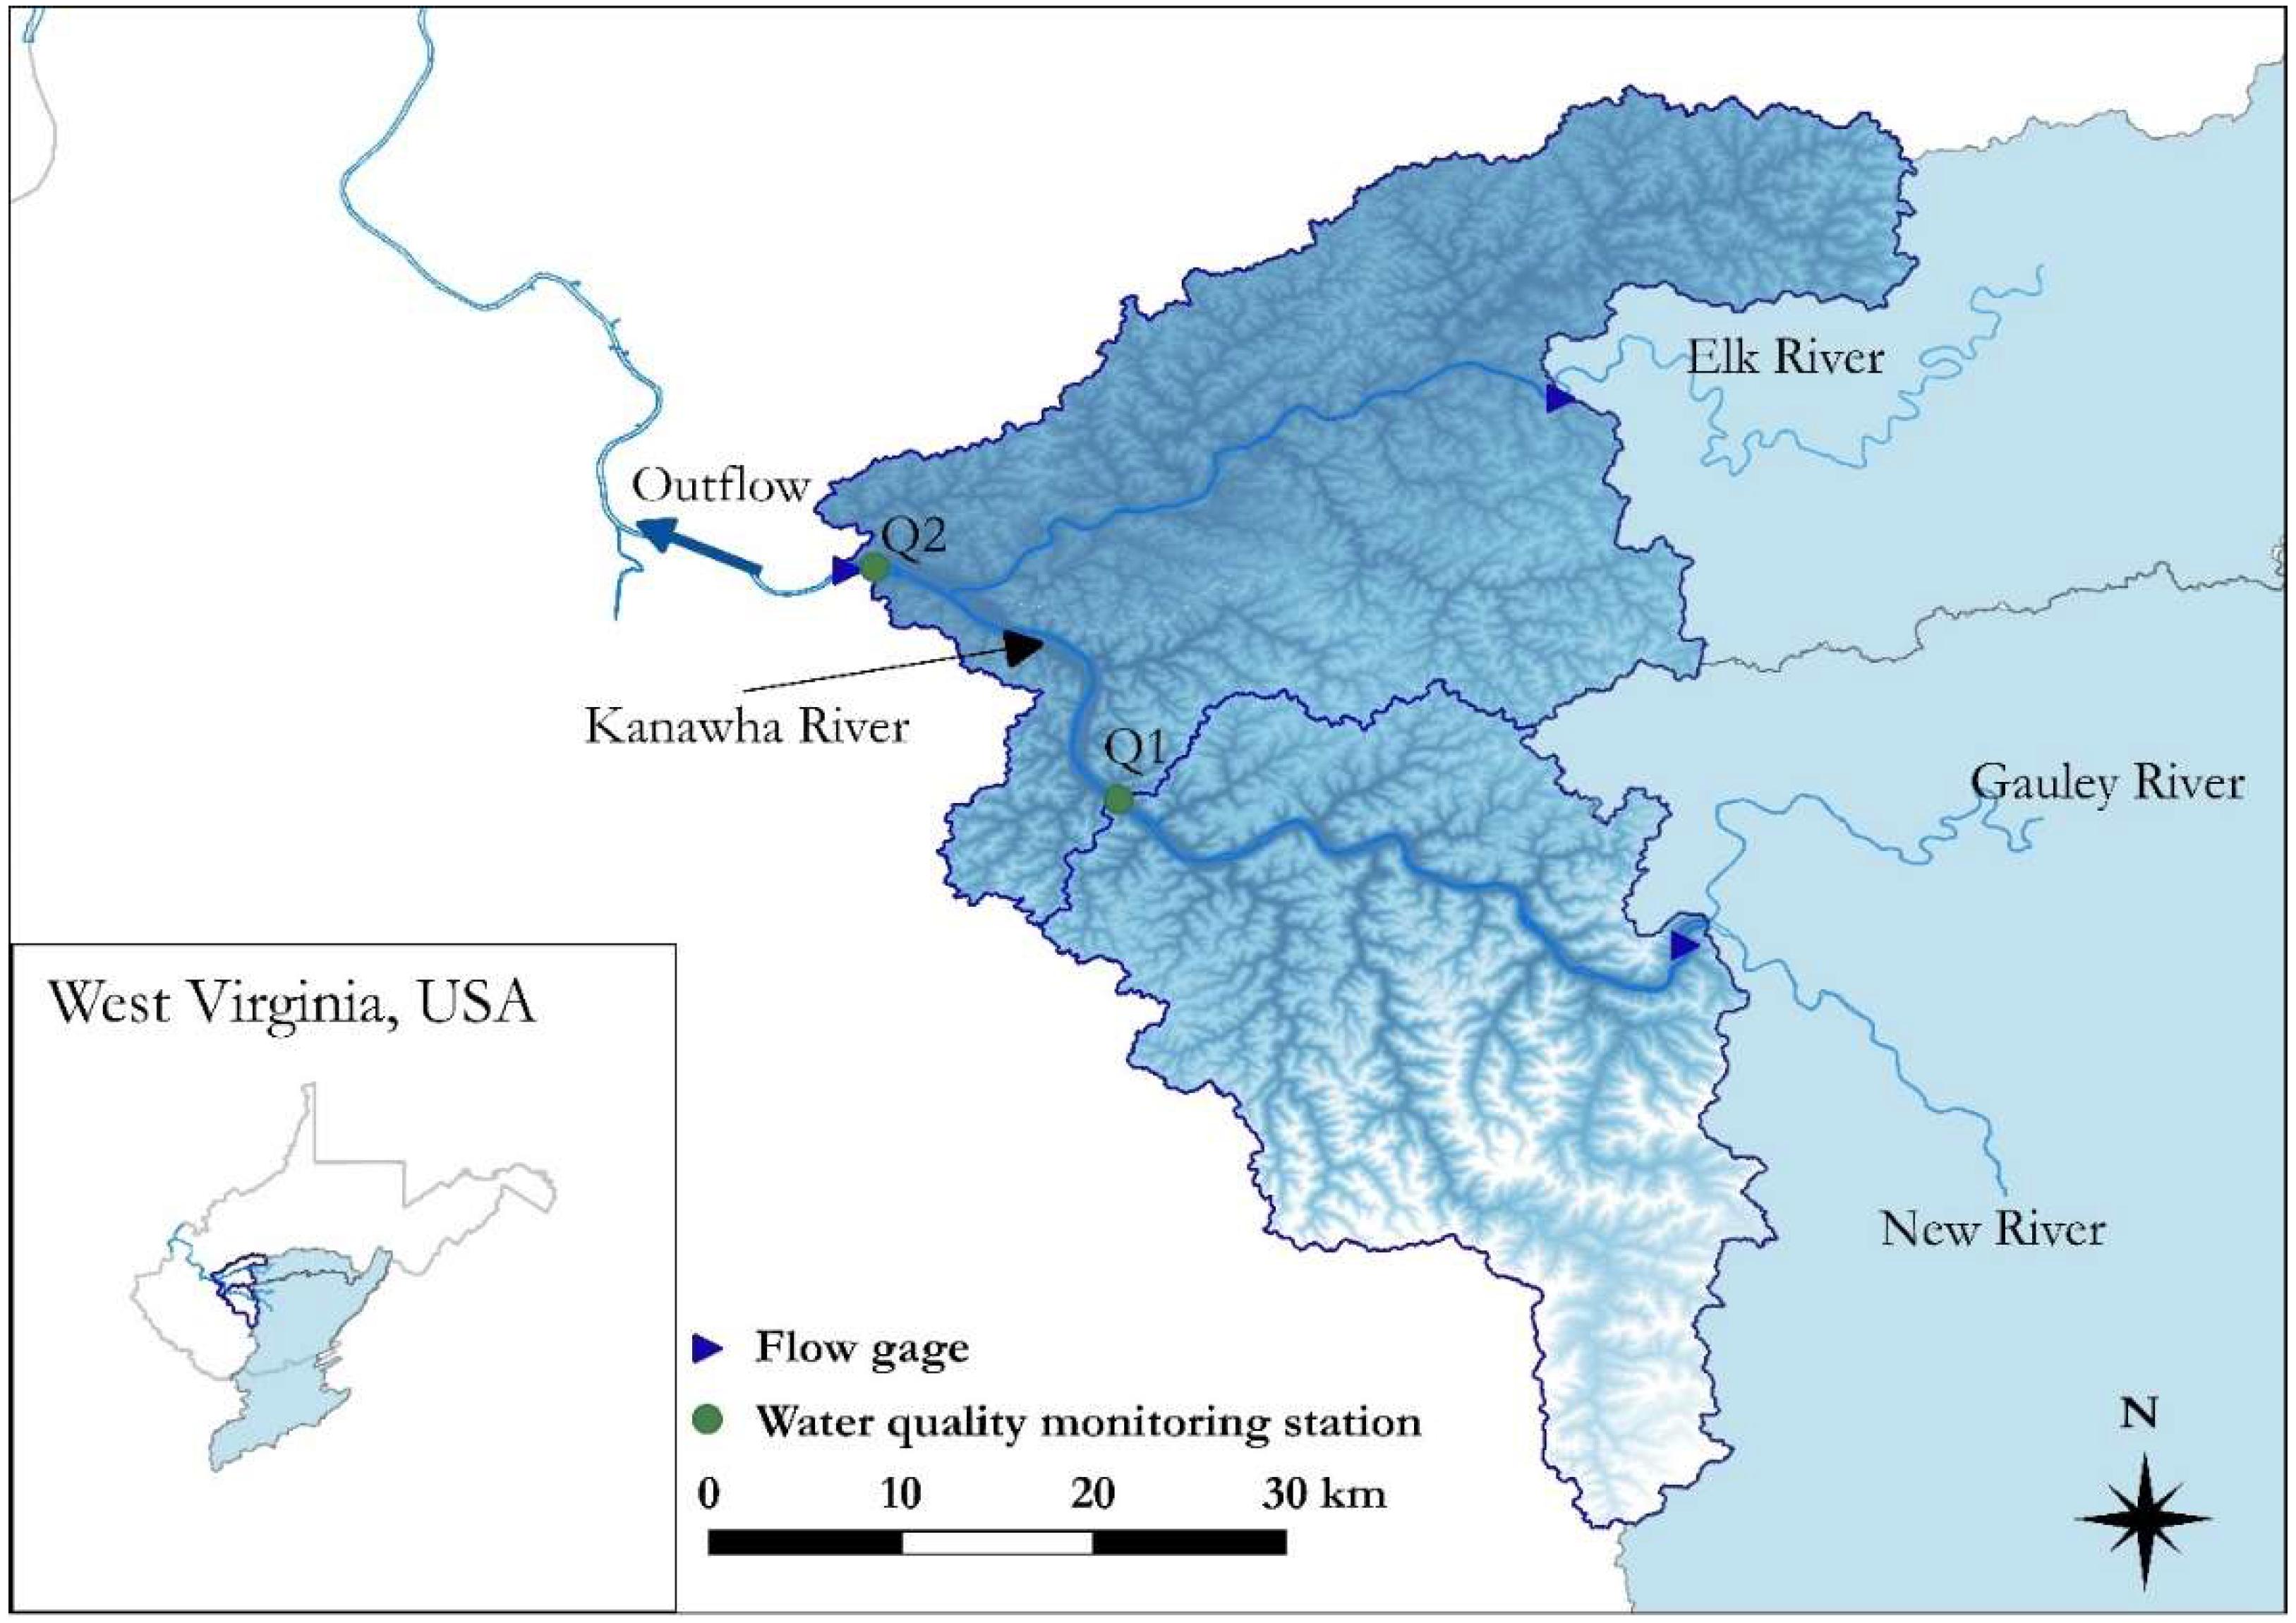
2.1. Description of the Study Area
2.2. Chemical Analysis of Grab Water Samples
Estimation of HCO3−
2.3. High-Frequency Data of a Hydrologic Model and Water Quality Monitoring Stations
2.4. Soil Moisture
2.5. Hysteresis Index (HI)
2.6. Total Suspended Solids (TSS)
3. Results and Discussion
3.1. Hydrochemistry of Water Samples
3.2. Hydrochemical Facies and Origin of Dissolved Solids
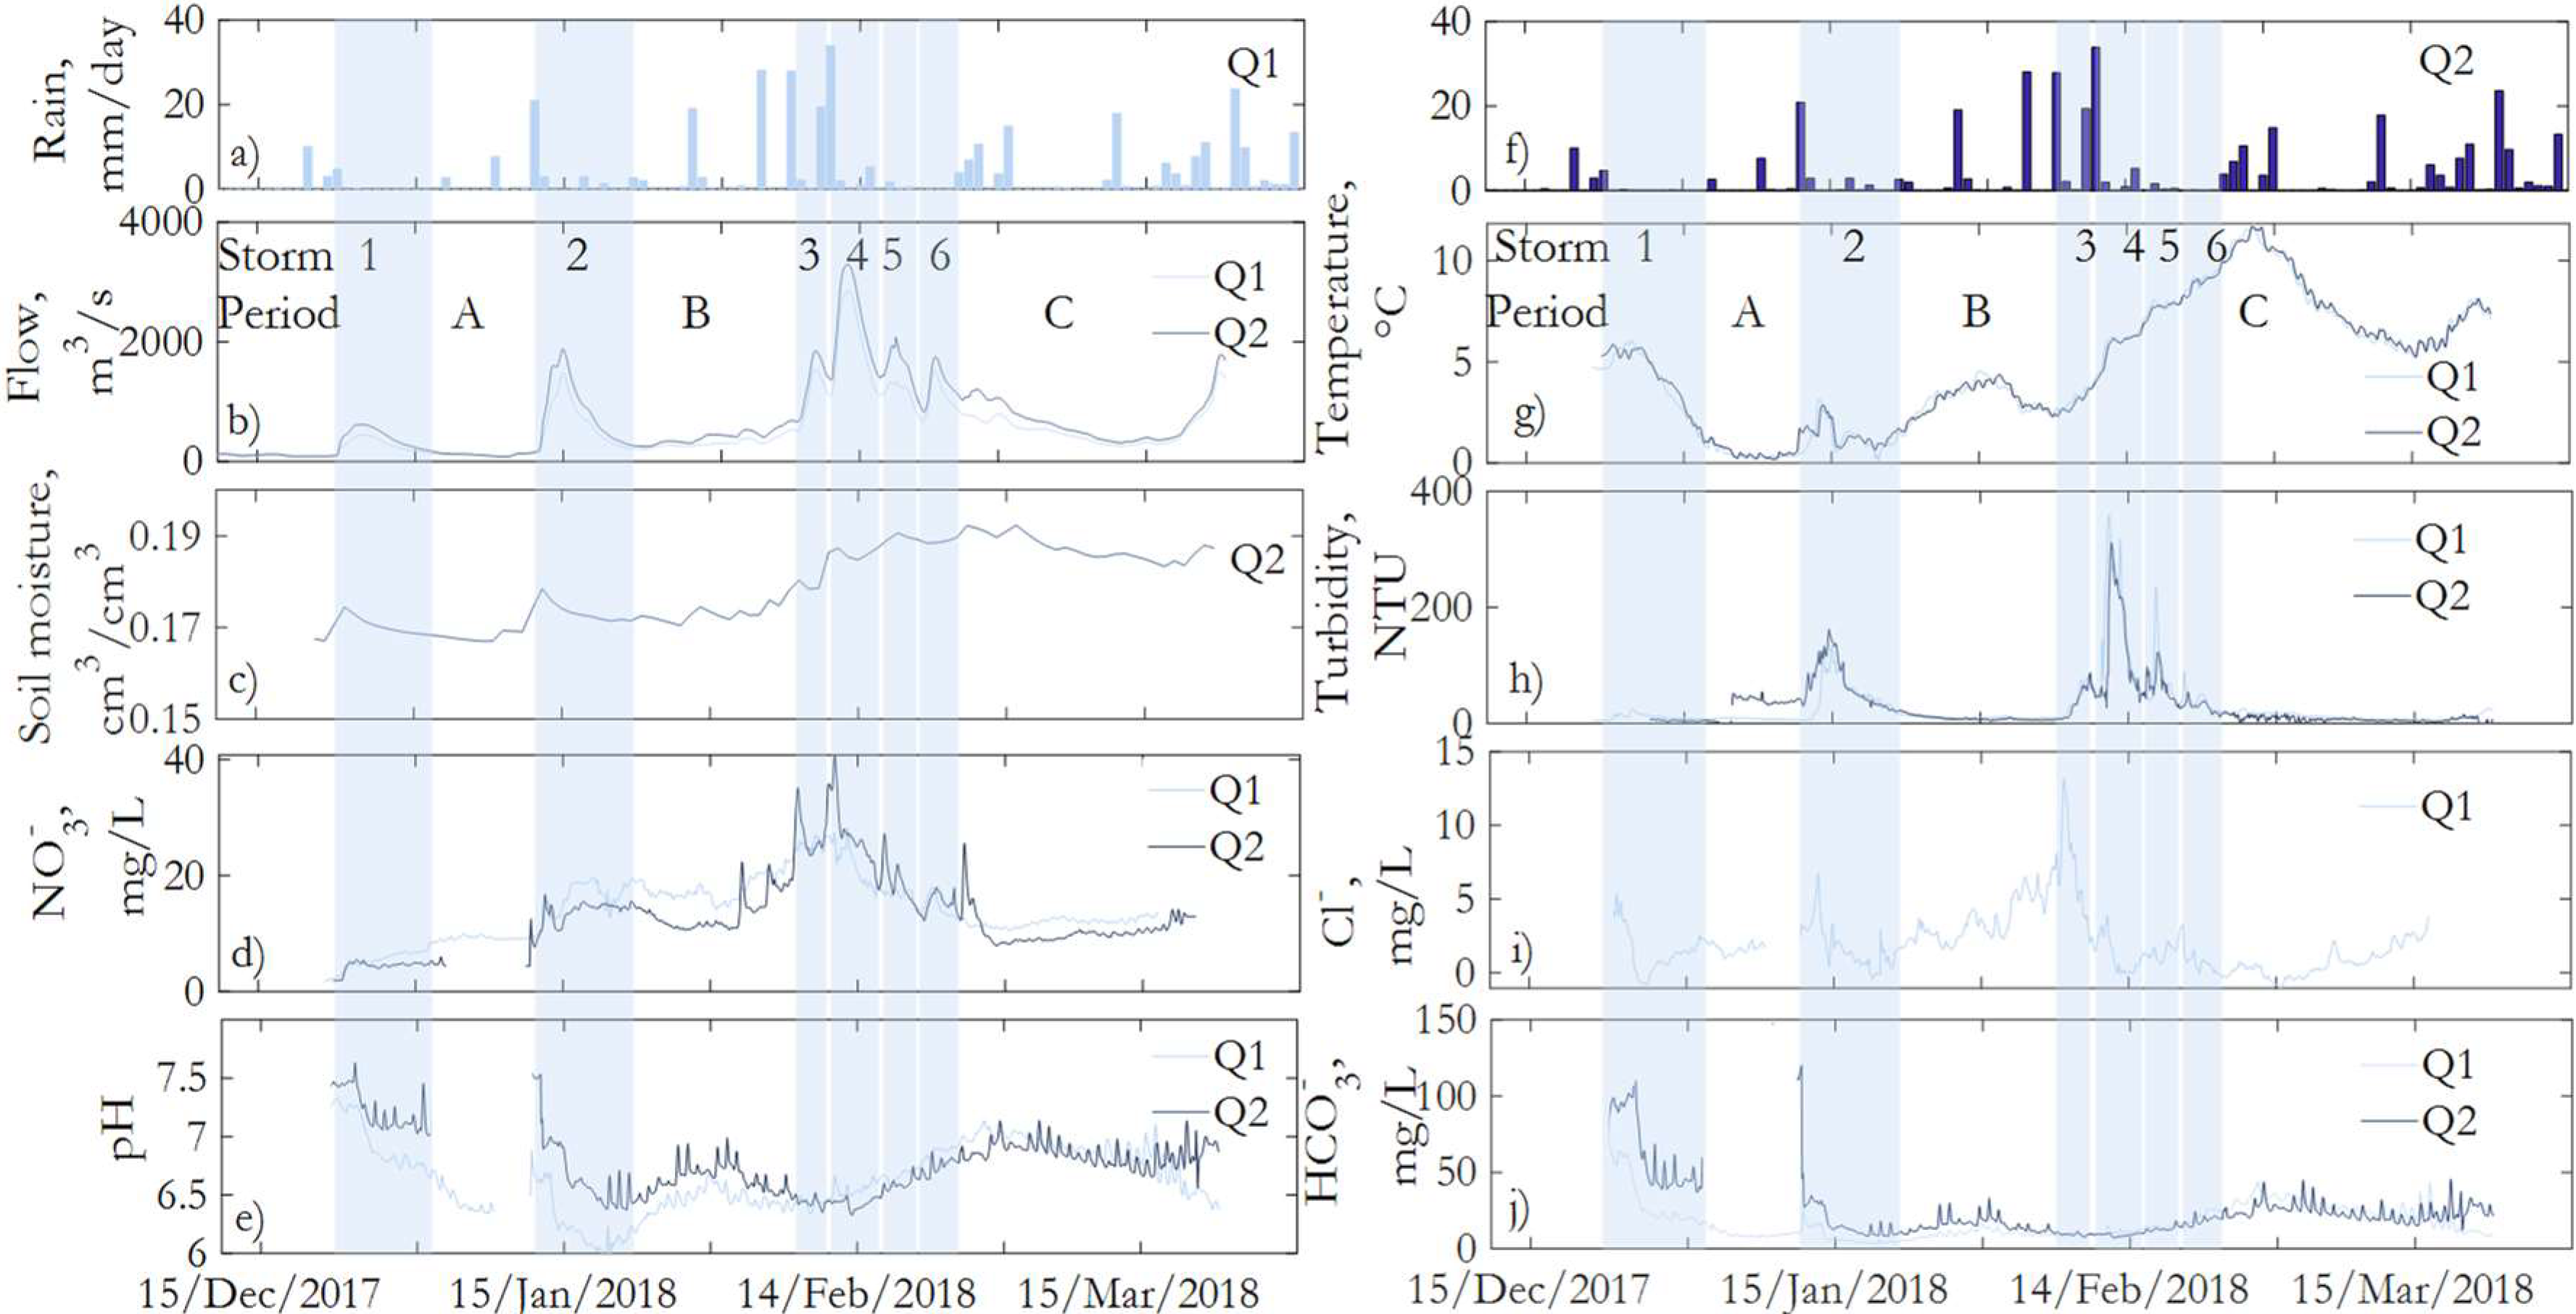
3.3. Hydrochemistry under High-Frequency Data
Comparison between Water Samples and Continuous Monitoring
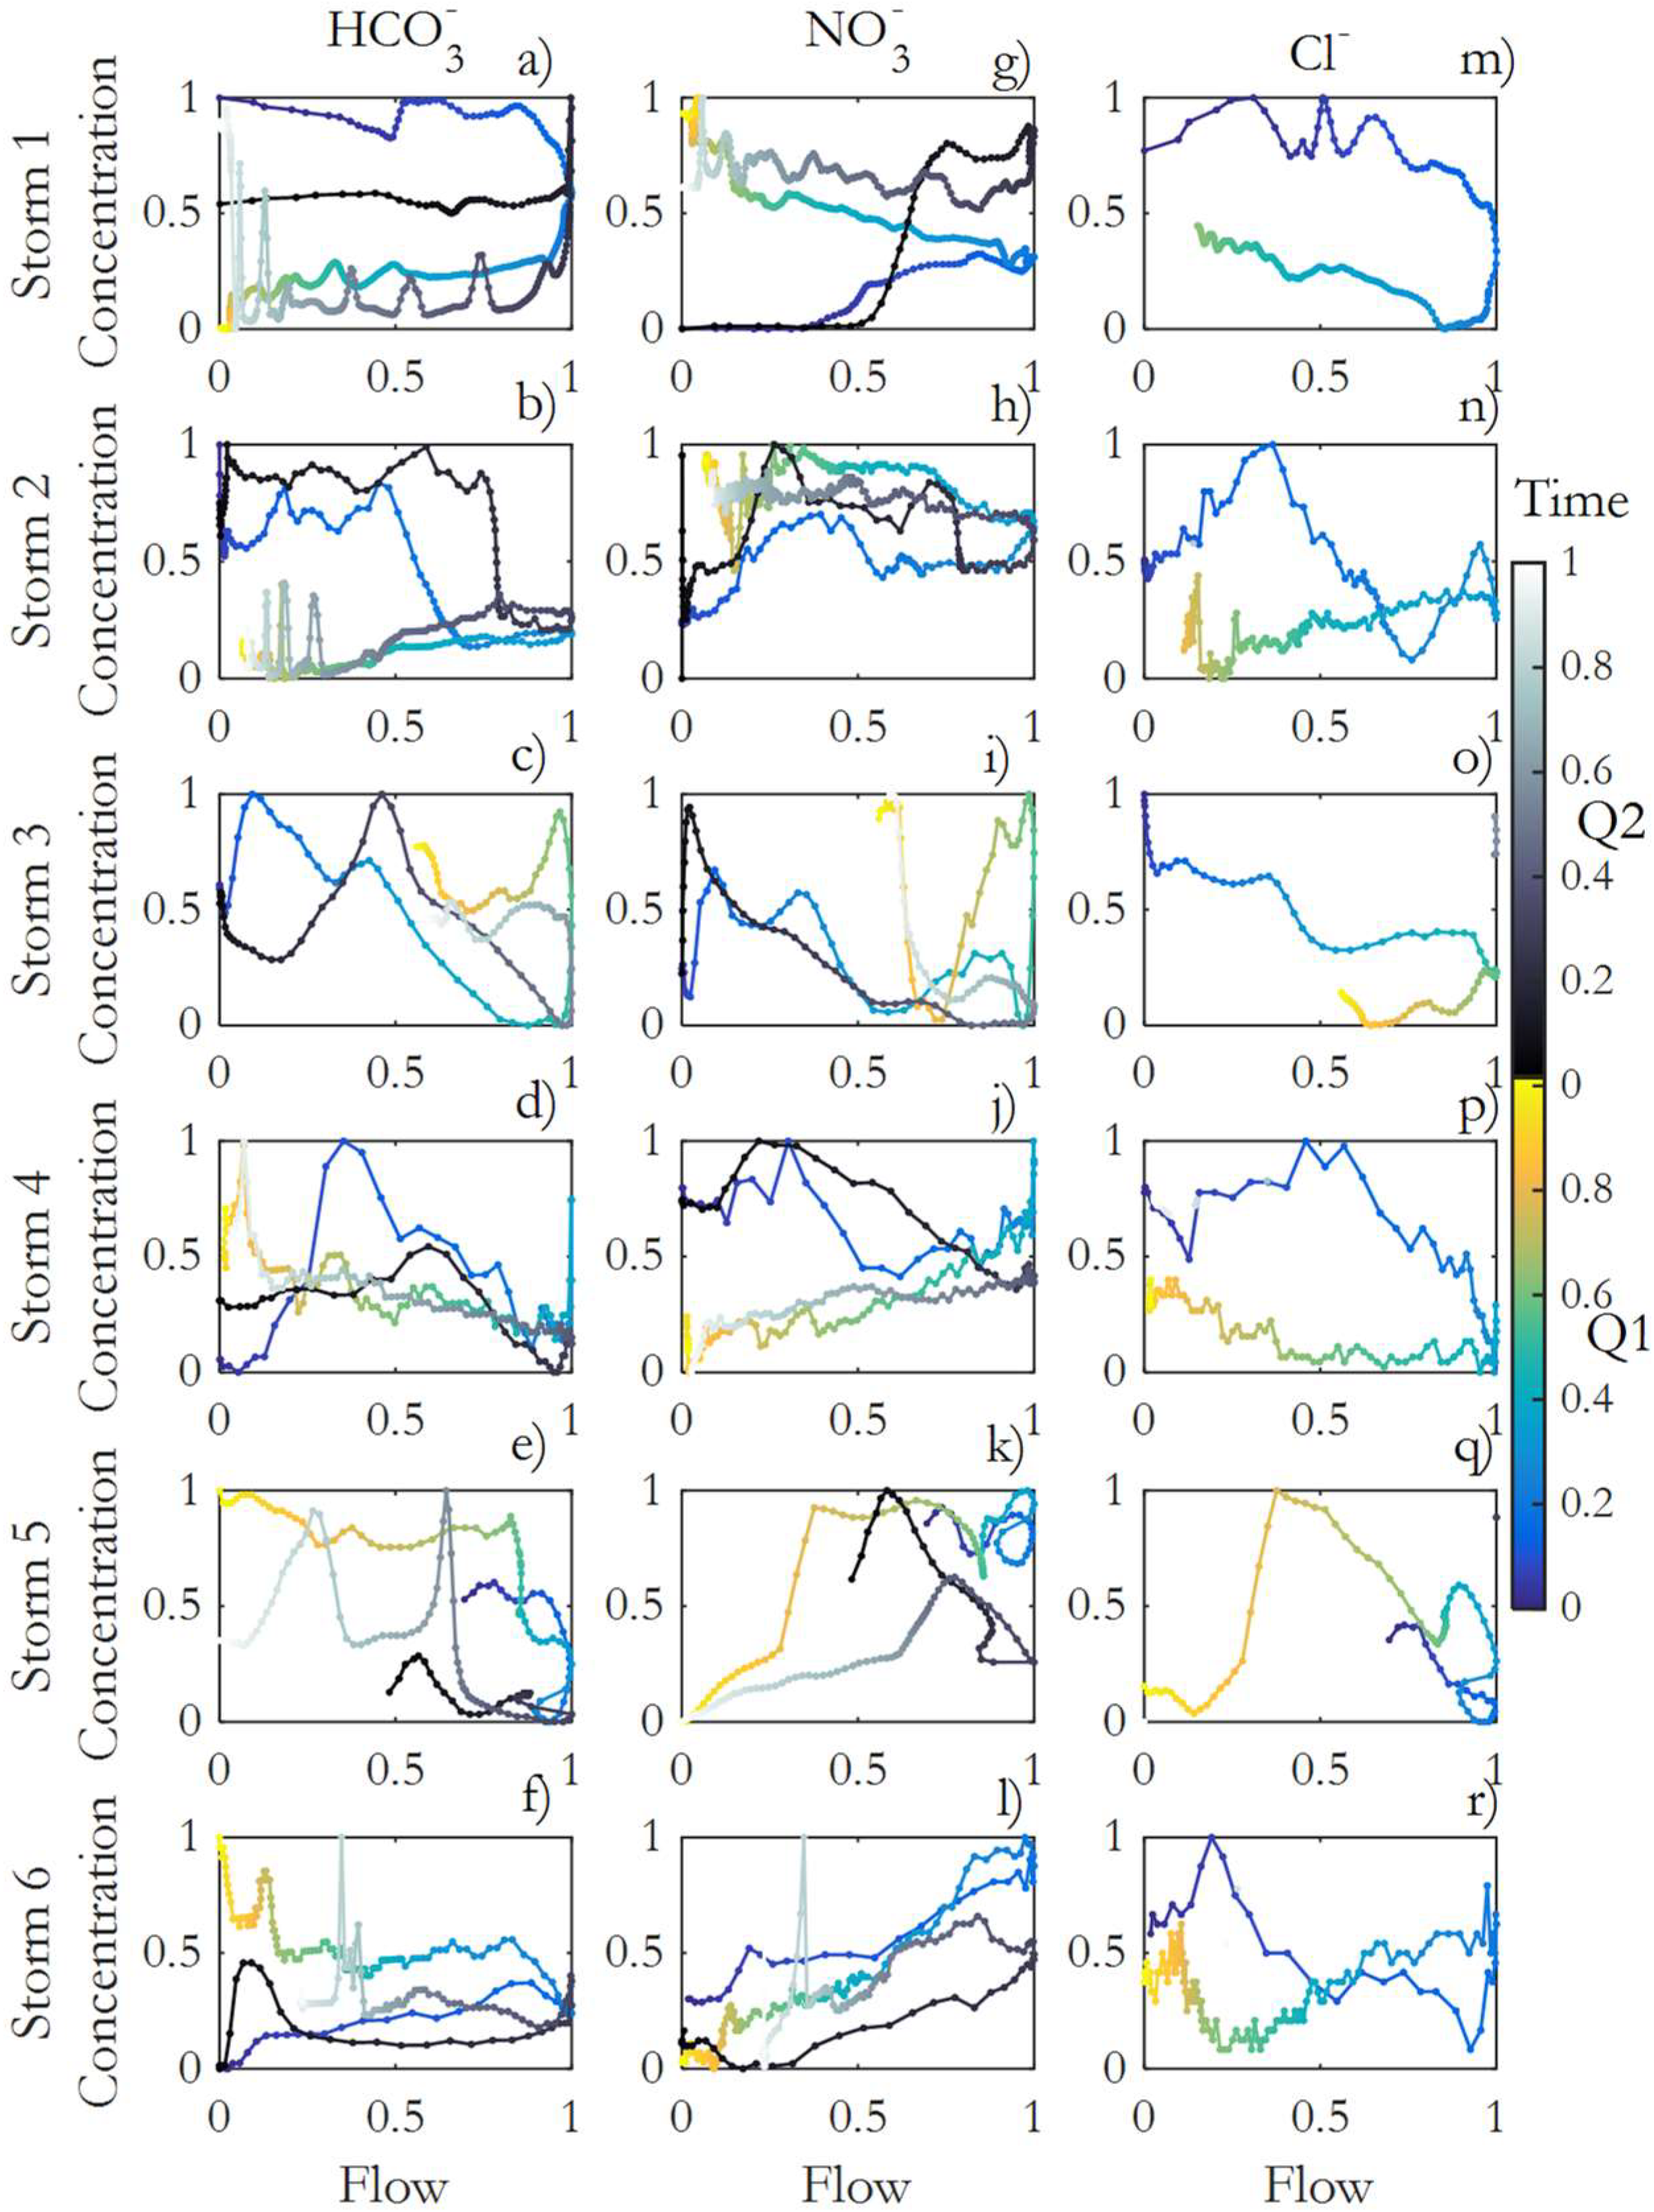
3.4. Hysteresis of Anions
3.5. Soil Moisture and Hysteresis Index (HI) Relationship
3.6. Anions and TSS
4. Conclusions
Supplementary Materials
Author Contributions
Funding
Institutional Review Board Statement
Informed Consent Statement
Data Availability Statement
Acknowledgments
Conflicts of Interest
References
- Qin, C.; Li, S.L.; Waldron, S.; Yue, F.J.; Wang, Z.J.; Zhong, J.; Ding, H.; Liu, C.Q. High-frequency monitoring reveals how hydrochemistry and dissolved carbon respond to rainstorms at a karstic critical zone, Southwestern China. Sci. Total Environ. 2020, 714, 136833. [Google Scholar] [CrossRef] [PubMed]
- Palmer, M.; Ruhi, A. Linkages between flow regime, biota, and ecosystem processes: Implications for river restoration. Science 2019, 365, eaaw2087. [Google Scholar] [CrossRef] [PubMed]
- Burns, D.A.; Pellerin, B.A.; Miller, M.P.; Capel, P.D.; Tesoriero, A.J.; Duncan, J.M. Monitoring the riverine pulse: Applying high-frequency nitrate data to advance integrative understanding of biogeochemical and hydrological processes. Wiley Interdiscip. Rev. Water 2019, 6, e1348. [Google Scholar] [CrossRef]
- Griffith, M.B.; Norton, S.B.; Alexander, L.C.; Pollard, A.I.; LeDuc, S.D. The effects of mountaintop mines and valley fills on the physicochemical quality of stream ecosystems in the central Appalachians: A review. Sci. Total Environ. 2012, 417–418, 1–12. [Google Scholar] [CrossRef] [PubMed]
- Mari, I.; Myron, J.M.; Charles, T.D. Spatial patterns of precipitation quantity and chemistry and air temperatures in the Adirondack region of New York. Atmos. Environ. 2002, 36, 1051–1062. [Google Scholar]
- Anderson, J.B.; Baumgardner, R.E.; Mohnen, V.A.; Bowser, J.J. Cloud chemistry in the eastern United States, as sampled from three high-elevation sites along the Appalachian Mountains. Atmos. Environ. 1999, 33, 5105–5114. [Google Scholar] [CrossRef]
- Butler, B.A.; Ford, R.G. Evaluating relationships between total dissolved solids (TDS) and total suspended solids (TSS) in a mining-influenced watershed. Mine Water Environ. 2018, 37, 18–30. [Google Scholar] [CrossRef]
- Aguilera, R.; Melack, J.M. Concentration-Discharge Responses to Storm Events in Coastal California Watersheds. Water Resour. Res. 2018, 54, 407–424. [Google Scholar] [CrossRef]
- Musolff, A.; Schmidt, C.; Selle, B.; Fleckenstein, J.H. Catchment controls on solute export. Adv. Water Resour. 2015, 86, 133–146. [Google Scholar] [CrossRef]
- Jonnalagadda, S.B.; Mhere, G. Water quality of the odzi river in the Eastern Highlands of Zimbabwe. Water Res. 2001, 35, 2371–2376. [Google Scholar] [CrossRef]
- Piper, A.M. A graphic procedure in the geochemical interpretation of water-analyses. Eos Trans. Am. Geophys. Union 1944, 25, 914–928. [Google Scholar] [CrossRef]
- Gibbs, R.J. Mechanisms Controlling World Water Chemistry. Science 1970, 170, 1088–1090. [Google Scholar] [CrossRef] [PubMed]
- Moatar, F.; Abbott, B.W.; Minaudo, C.; Curie, F.; Pinay, G. Elemental properties, hydrology, and biology interact to shape concentration-discharge curves for carbon, nutrients, sediment, and major ions. Water Resour. Res. 2017, 53, 1270–1287. [Google Scholar] [CrossRef]
- Rose, L.A.; Karwan, D.L.; Godsey, S.E. Concentration–discharge relationships describe solute and sediment mobilization, reaction, and transport at event and longer timescales. Hydrol. Process. 2018, 32, 2829–2844. [Google Scholar] [CrossRef]
- Knapp, J.L.A.; von Freyberg, J.; Studer, B.; Kiewiet, L.; Kirchner, J.W. Concentration-discharge relationships vary among hydrological events, reflecting differences in event characteristics. Hydrol. Earth Syst. Sci. 2020, 24, 2561–2576. [Google Scholar] [CrossRef]
- Rozemeijer, J.C.; Van Der Velde, Y.; Van Geer, F.C.; De Rooij, G.H.; Torfs, P.J.J.F.; Broers, H.P. Improving load estimates for NO3 and P in surface waters by characterizing the concentration response to rainfall events. Environ. Sci. Technol. 2010, 44, 6305–6312. [Google Scholar] [CrossRef]
- Beaudoing, H.; Rodell, M. GLDAS Noah Land Surface Model L4 3 Hourly 0.25 × 0.25 Degree V2.0; Goddard Earth Sciences Data and Information Services Center (GES DISC): Greenbelt, MD, USA, 2020. [Google Scholar]
- Beaudoing, H.; Rodell, M. GLDAS Noah Land Surface Model L4 3 Hourly 0.25 × 0.25 Degree V2.1; Goddard Earth Sciences Data and Information Services Center (GES DISC): Greenbelt, MD, USA, 2020. [Google Scholar]
- Fedora, M.A.; Beschta, R.L. Storm runoff simulation using an antecedent precipitation index (API) model. J. Hydrol. 1989, 112, 121–133. [Google Scholar] [CrossRef]
- Petty, J.T.; Fulton, J.B.; Strager, M.P.; Merovich, G.T.; Stiles, J.M.; Ziemkiewicz, P.F. Landscape indicators and thresholds of stream ecological impairment in an intensively mined Appalachian watershed. J. N. Am. Benthol. Soc. 2010, 29, 1292–1309. [Google Scholar] [CrossRef]
- Evans, C.; Davies, T.D. Causes of concentration/discharge hysteresis and its potential as a tool for analysis of episode hydrochemistry. Water Resour. Res. 1998, 34, 129–137. [Google Scholar] [CrossRef]
- Orndorff, Z.W.; Daniels, W.L.; Zipper, C.E.; Eick, M.; Beck, M. A column evaluation of Appalachian coal mine spoils’ temporal leaching behavior. Environ. Pollut. 2015, 204, 39–47. [Google Scholar] [CrossRef]
- Rojano, F.; Huber, D.H.; Ugwuanyi, I.R.; Lhilhi Noundou, V.; Kemajou-Tchamba, A.L.; Chavarria-Palma, J.E. Net Ecosystem Production of a River Relying on Hydrology, Hydrodynamics and Water Quality Monitoring Stations. Water 2020, 12, 783. [Google Scholar] [CrossRef] [Green Version]
- U.S. Geological Survey (USGS). National Water Information System Data (NWIS). Available online: http://waterdata.usgs.gov/nwis/ (accessed on 22 February 2022).
- Muti-Resolution Land Characteristics (MRLC). National Land Cover Database (NLCD). Available online: https://www.mrlc.gov/ (accessed on 1 November 2021).
- Natural Resources Conservation Service (NRCS). United States Department of Agriculture, (USDA). Web Soil Survey, (WSS). Available online: https://websoilsurvey.sc.egov.usda.gov (accessed on 23 January 2022).
- WV Geology West Virginia Geological and Economic Survey (WVGES). Available online: http://www.wvgs.wvnet.edu (accessed on 28 July 2020).
- Schulte, P.; van Geldern, R.; Freitag, H.; Karim, A.; Négrel, P.; Petelet-Giraud, E.; Probst, A.; Probst, J.L.; Telmer, K.; Veizer, J.; et al. Applications of stable water and carbon isotopes in watershed research: Weathering, carbon cycling, and water balances. Earth-Sci. Rev. 2011, 109, 20–31. [Google Scholar] [CrossRef]
- Lewis, E.R.; Wallace, D.W.R. Program Developed for CO2 System Calculations, ORNL/CDIAC-105; Carbon Dioxide Information Analysis Center (CDIAC), Oak Ridge National Laboratory: Oak Ridge, TN, USA, 1998. [Google Scholar]
- Liu, S.; Raymond, P.A. Hydrologic controls on pCO2 and CO2 efflux in US streams and rivers. Limnol. Oceanogr. Lett. 2018, 3, 428–435. [Google Scholar] [CrossRef]
- Ran, L.; Lu, X.X.; Liu, S. Dynamics of riverine CO2 in the Yangtze River fluvial network and their implications for carbon evasion. Biogeosciences 2017, 14, 2183–2198. [Google Scholar] [CrossRef]
- Li, S.; Luo, J.; Wu, D.; Jun Xu, Y. Carbon and nutrients as indictors of daily fluctuations of pCO2 and CO2 flux in a river draining a rapidly urbanizing area. Ecol. Indic. 2020, 109, 105821. [Google Scholar] [CrossRef]
- Hotchkiss, E.R.; Hall, R.O.; Sponseller, R.A.; Butman, D.; Klaminder, J.; Laudon, H.; Rosvall, M.; Karlsson, J. Sources of and processes controlling CO2emissions change with the size of streams and rivers. Nat. Geosci. 2015, 8, 696–699. [Google Scholar] [CrossRef]
- National Aeronautics and Space Administration (NASA). Global Land Data Assimilation System (GLDAS). Catchment Land Surface Model (CLSM). Available online: https://giovanni.gsfc.nasa.gov (accessed on 14 July 2022).
- Knapp, J.L.A.; Osenbrück, K.; Brennwald, M.S.; Cirpka, O.A. In-situ mass spectrometry improves the estimation of stream reaeration from gas-tracer tests. Sci. Total Environ. 2019, 655, 1062–1070. [Google Scholar] [CrossRef]
- Moatar, F.; Floury, M.; Gold, A.J.; Meybeck, M.; Renard, B.; Ferréol, M.; Chandesris, A.; Minaudo, C.; Addy, K.; Piffady, J.; et al. Stream Solutes and Particulates Export Regimes: A New Framework to Optimize Their Monitoring. Front. Ecol. Evol. 2020, 7, 516. [Google Scholar] [CrossRef]
- Lloyd, C.E.M.; Freer, J.E.; Johnes, P.J.; Collins, A.L. Technical Note: Testing an improved index for analysing storm discharge-concentration hysteresis. Hydrol. Earth Syst. Sci. 2016, 20, 625–632. [Google Scholar] [CrossRef]
- Eder, A.; Strauss, P.; Krueger, T.; Quinton, J.N. Comparative calculation of suspended sediment loads with respect to hysteresis effects (in the Petzenkirchen catchment, Austria). J. Hydrol. 2010, 389, 168–176. [Google Scholar] [CrossRef]
- 2540 Solids; Standard Methods for the Examination of Water and Wastewater. Lipps, W.C.; Baxter, T.E.; Braun-Howland, E. (Eds.) American Public Health Association Press: Washington, DC, USA, 2017.
- Huffman, G.J.; Bolvin, D.T.; Nelkin, E.J.; Adler, R.F. TRMM (TMPA) Precipitation L3 1 Day 0.25 Degree × 0.25 Degree V7; Savtchenko, A., Ed.; Goddard Earth Sciences Data and Information Services Center (GES DISC): Greenbelt, MD, USA, 2020. [Google Scholar]
- Ludwikowski, J.J.; Peterson, E.W. Transport and fate of chloride from road salt within a mixed urban and agricultural watershed in Illinois (USA): Assessing the influence of chloride application rates. Hydrogeol. J. 2018, 26, 1123–1135. [Google Scholar] [CrossRef]
- Haake, D.M.; Knouft, J.H. Comparison of Contributions to Chloride in Urban Stormwater from Winter Brine and Rock Salt Application. Environ. Sci. Technol. 2019, 53, 11888–11895. [Google Scholar] [CrossRef] [PubMed]
- Misset, C.; Recking, A.; Legout, C.; Poirel, A.; Cazilhac, M.; Esteves, M.; Bertrand, M. An attempt to link suspended load hysteresis patterns and sediment sources configuration in alpine catchments. J. Hydrol. 2019, 576, 72–84. [Google Scholar] [CrossRef]
- Lechuga-Crespo, J.L.; Ruiz-Romera, E.; Probst, J.L.; Unda-Calvo, J.; Cuervo-Fuentes, Z.C.; Sánchez-Pérez, J.M. Combining punctual and high frequency data for the spatiotemporal assessment of main geochemical processes and dissolved exports in an urban river catchment. Sci. Total Environ. 2020, 727, 138644. [Google Scholar] [CrossRef] [PubMed]
- Camacho Suarez, V.V.; Saraiva Okello, A.M.L.; Wenninger, J.W.; Uhlenbrook, S. Understanding runoff processes in a semi-arid environment through isotope and hydrochemical hydrograph separations. Hydrol. Earth Syst. Sci. 2015, 19, 4183–4199. [Google Scholar] [CrossRef]
- Koskelo, A.I.; Fisher, T.R.; Sutton, A.J.; Gustafson, A.B. Biogeochemical storm response in agricultural watersheds of the Choptank River Basin, Delmarva Peninsula, USA. Biogeochemistry 2018, 139, 215–239. [Google Scholar] [CrossRef]
- Baker, E.B.; Showers, W.J. Hysteresis analysis of nitrate dynamics in the Neuse River, NC. Sci. Total Environ. 2019, 652, 889–899. [Google Scholar] [CrossRef]
- Ustaoğlu, F.; Tepe, Y. Water quality and sediment contamination assessment of Pazarsuyu Stream, Turkey using multivariate statistical methods and pollution indicators. Int. Soil Water Conserv. Res. 2019, 7, 47–56. [Google Scholar] [CrossRef]
- Stets, E.G.; Sprague, L.A.; Oelsner, G.P.; Johnson, H.M.; Murphy, J.C.; Ryberg, K.; Vecchia, A.V.; Zuellig, R.E.; Falcone, J.A.; Riskin, M.L. Landscape Drivers of Dynamic Change in Water Quality of U.S. Rivers. Environ. Sci. Technol. 2020, 54, 4336–4343. [Google Scholar] [CrossRef]
- Marescaux, A.; Thieu, V.; Borges, A.V.; Garnier, J. Seasonal and spatial variability of the partial pressure of carbon dioxide in the human-impacted Seine River in France. Sci. Rep. 2018, 8, 13961. [Google Scholar] [CrossRef]
- Ran, L.; Lu, X.X.; Richey, J.E.; Sun, H.; Han, J.; Yu, R.; Liao, S.; Yi, Q. Long-term spatial and temporal variation of CO2 partial pressure in the Yellow River, China. Biogeosciences 2015, 12, 921–932. [Google Scholar] [CrossRef] [Green Version]


| K+ | Mg2+ | Ca2+ | Na+ | Cl− | SO42− | NO3− | HCO3− | |
|---|---|---|---|---|---|---|---|---|
| Mean | 2.18 (±1.69) | 7.22 (±2.35) | 20.14 (±2.72) | 6.40 (±1.45) | 6.85 (±2.07) | 34.33 (±9.00) | 2.17 (±0.71) | 12.34 (±1.49) |
| Min | 1.26 | 1.30 | 14.65 | 4.06 | 3.75 | 22.57 | 1.15 | 9.97 |
| Max | 6.89 | 10.19 | 23.74 | 9.75 | 10.48 | 50.30 | 3.11 | 15.66 |
| Location | Storm | Starting Flow (m3/s) | Maximum Flow (m3/s) | Ending Flow (m3/s) | Time to Reach Maximum Flow (h) | Event Duration (h) |
|---|---|---|---|---|---|---|
| Q1 | 1 | 132 | 449 | 100 | 59 | 339 |
| 2 | 128 | 1395 | 213 | 62 | 240 | |
| 3 | 515 | 1542 | 1090 | 46 | 84 | |
| 4 | 1065 | 2825 | 1089 | 41 | 118 | |
| 5 | 1129 | 1335 | 659 | 30 | 93 | |
| 6 | 643 | 1518 | 748 | 32 | 108 | |
| Q2 | 1 | 157 | 617 | 107 | 61 | 339 |
| 2 | 146 | 1729 | 268 | 83 | 270 | |
| 3 | 662 | 1849 | 1363 | 48 | 86 | |
| 4 | 1310 | 3231 | 1362 | 40 | 118 | |
| 5 | 1444 | 2083 | 849 | 28 | 94 | |
| 6 | 816 | 1764 | 1036 | 31 | 108 |
| HCO3−, mg/L | NO3−, mg/L | Cl−, mg/L | |||
|---|---|---|---|---|---|
| Q1 | Q2 | Q1 | Q2 | Q1 | |
| Storm 1 | 23.4 (±15.4) | 61.6 (±7.1) | 6.9 (±1.8) | 4.5 (±0.6) | 6.5 (±1.2) |
| Period A | 8.9 (±3.1) | - | 9.4 (±0.2) | 4.4 (±0.1) | 7.2 (±0.6) |
| Storm 2 | 6.4 (±3.7) | 19.2 (±16.5) | 16.3 (±2.7) | 13.1 (±2.5) | 6.6 (±1.4) |
| Period B | 5.6 (±1.6) | 11.7 (±3.3) | 17.9 (±2.2) | 13.6 (±3.1) | 9 (±2.1) |
| Storm 3 | 9.4 (±0.8) | 9.4 (±0.7) | 25.3 (±0.9) | 27.5 (±3.7) | 9.9 (±2.9) |
| Storm 4 | 12.2 (±1.6) | 9.6 (±1.4) | 21.5 (±3.4) | 26.4 (±5.5) | 6 (±1.1) |
| Storm 5 | 15.5 (±1.6) | 14.1 (±1.6) | 16.3 (±1.4) | 18.4 (±3.5) | 6.5 (±0.7) |
| Storm 6 | 25.2 (±3.7) | 20.5 (±2.4) | 14.1 (±1.8) | 15.8 (±2.8) | 5.3 (±0.4) |
| Period C | 18.8 (±6.4) | 18.3 (±4.2) | 11.9 (±0.7) | 10.5 (±1.8) | 5.8 (±0.4) |
| HCO3−, mg/L | NO3−, mg/L | Mean Soil Moisture, cm3/cm3 | Mean Flow, m3/s | |||
|---|---|---|---|---|---|---|
| Q1 | Q2 | Q1 | Q2 | |||
| Water Samples * | - | 12.36 (±1.48) | - | 2.15 (±0.71) | 0.180 (±0.01) | 239.3 (±74) |
| Monitoring stations | 13.91 (±9.52) | 20.63 (±19.99) | 14.05 (±5.47) | 12.45 (±6.68) | 0.185 (±0.007) | 696.7 (±608) |
| HCO3− | NO3− | Cl− | |||
|---|---|---|---|---|---|
| Storm | Q1 | Q2 | Q1 | Q2 | Q1 |
| 1 | 0.71 (±0.06) | 0.38 (±0.18) | −0.35 (±0.21) | −0.30 (±0.25) | 0.61 (±0.06) |
| 2 | 0.52 (±0.37) | 0.14 (±0.06) | −0.44 (±0.11) | −0.12 (±0.16) | 0.33 (±0.35) |
| 3 | −0.44 (±0.13) | −0.07 (±0.17) | −0.29 (±0.37) | −0.26 (±0.29) | 0.32 (±0.04) |
| 4 | 0.16 (±0.33) | 0.03 (±0.16) | 0.35 (±0.26) | 0.47 (±0.16) | 0.60 (±0.21) |
| 5 | −0.16 (±0.20) | −0.16 (±0.29) | −0.04 (±0.06) | 0.24 (±0.31) | −0.21 (±0.13) |
| 6 | −0.30 (±0.24) | −0.21 (±0.21) | 0.09 (±0.14) | −0.34 (±0.27) | 0.15 (±0.36) |
Publisher’s Note: MDPI stays neutral with regard to jurisdictional claims in published maps and institutional affiliations. |
© 2022 by the authors. Licensee MDPI, Basel, Switzerland. This article is an open access article distributed under the terms and conditions of the Creative Commons Attribution (CC BY) license (https://creativecommons.org/licenses/by/4.0/).
Share and Cite
Rojano, F.; Huber, D.H.; Ugwuanyi, I.R.; Kemajou-Tchamba, A.L.; Hass, A. Rainstorms Inducing Shifts of River Hydrochemistry during a Winter Season in the Central Appalachian Region. Water 2022, 14, 2687. https://doi.org/10.3390/w14172687
Rojano F, Huber DH, Ugwuanyi IR, Kemajou-Tchamba AL, Hass A. Rainstorms Inducing Shifts of River Hydrochemistry during a Winter Season in the Central Appalachian Region. Water. 2022; 14(17):2687. https://doi.org/10.3390/w14172687
Chicago/Turabian StyleRojano, Fernando, David H. Huber, Ifeoma R. Ugwuanyi, Andrielle Larissa Kemajou-Tchamba, and Amir Hass. 2022. "Rainstorms Inducing Shifts of River Hydrochemistry during a Winter Season in the Central Appalachian Region" Water 14, no. 17: 2687. https://doi.org/10.3390/w14172687
APA StyleRojano, F., Huber, D. H., Ugwuanyi, I. R., Kemajou-Tchamba, A. L., & Hass, A. (2022). Rainstorms Inducing Shifts of River Hydrochemistry during a Winter Season in the Central Appalachian Region. Water, 14(17), 2687. https://doi.org/10.3390/w14172687


