
Optimizing Urban Green Space Layouts for Stormwater Runoff Treatment in Residential Areas: A Case Study in Tianjin, China

Abstract
:1. Introduction
2. Materials and Methods
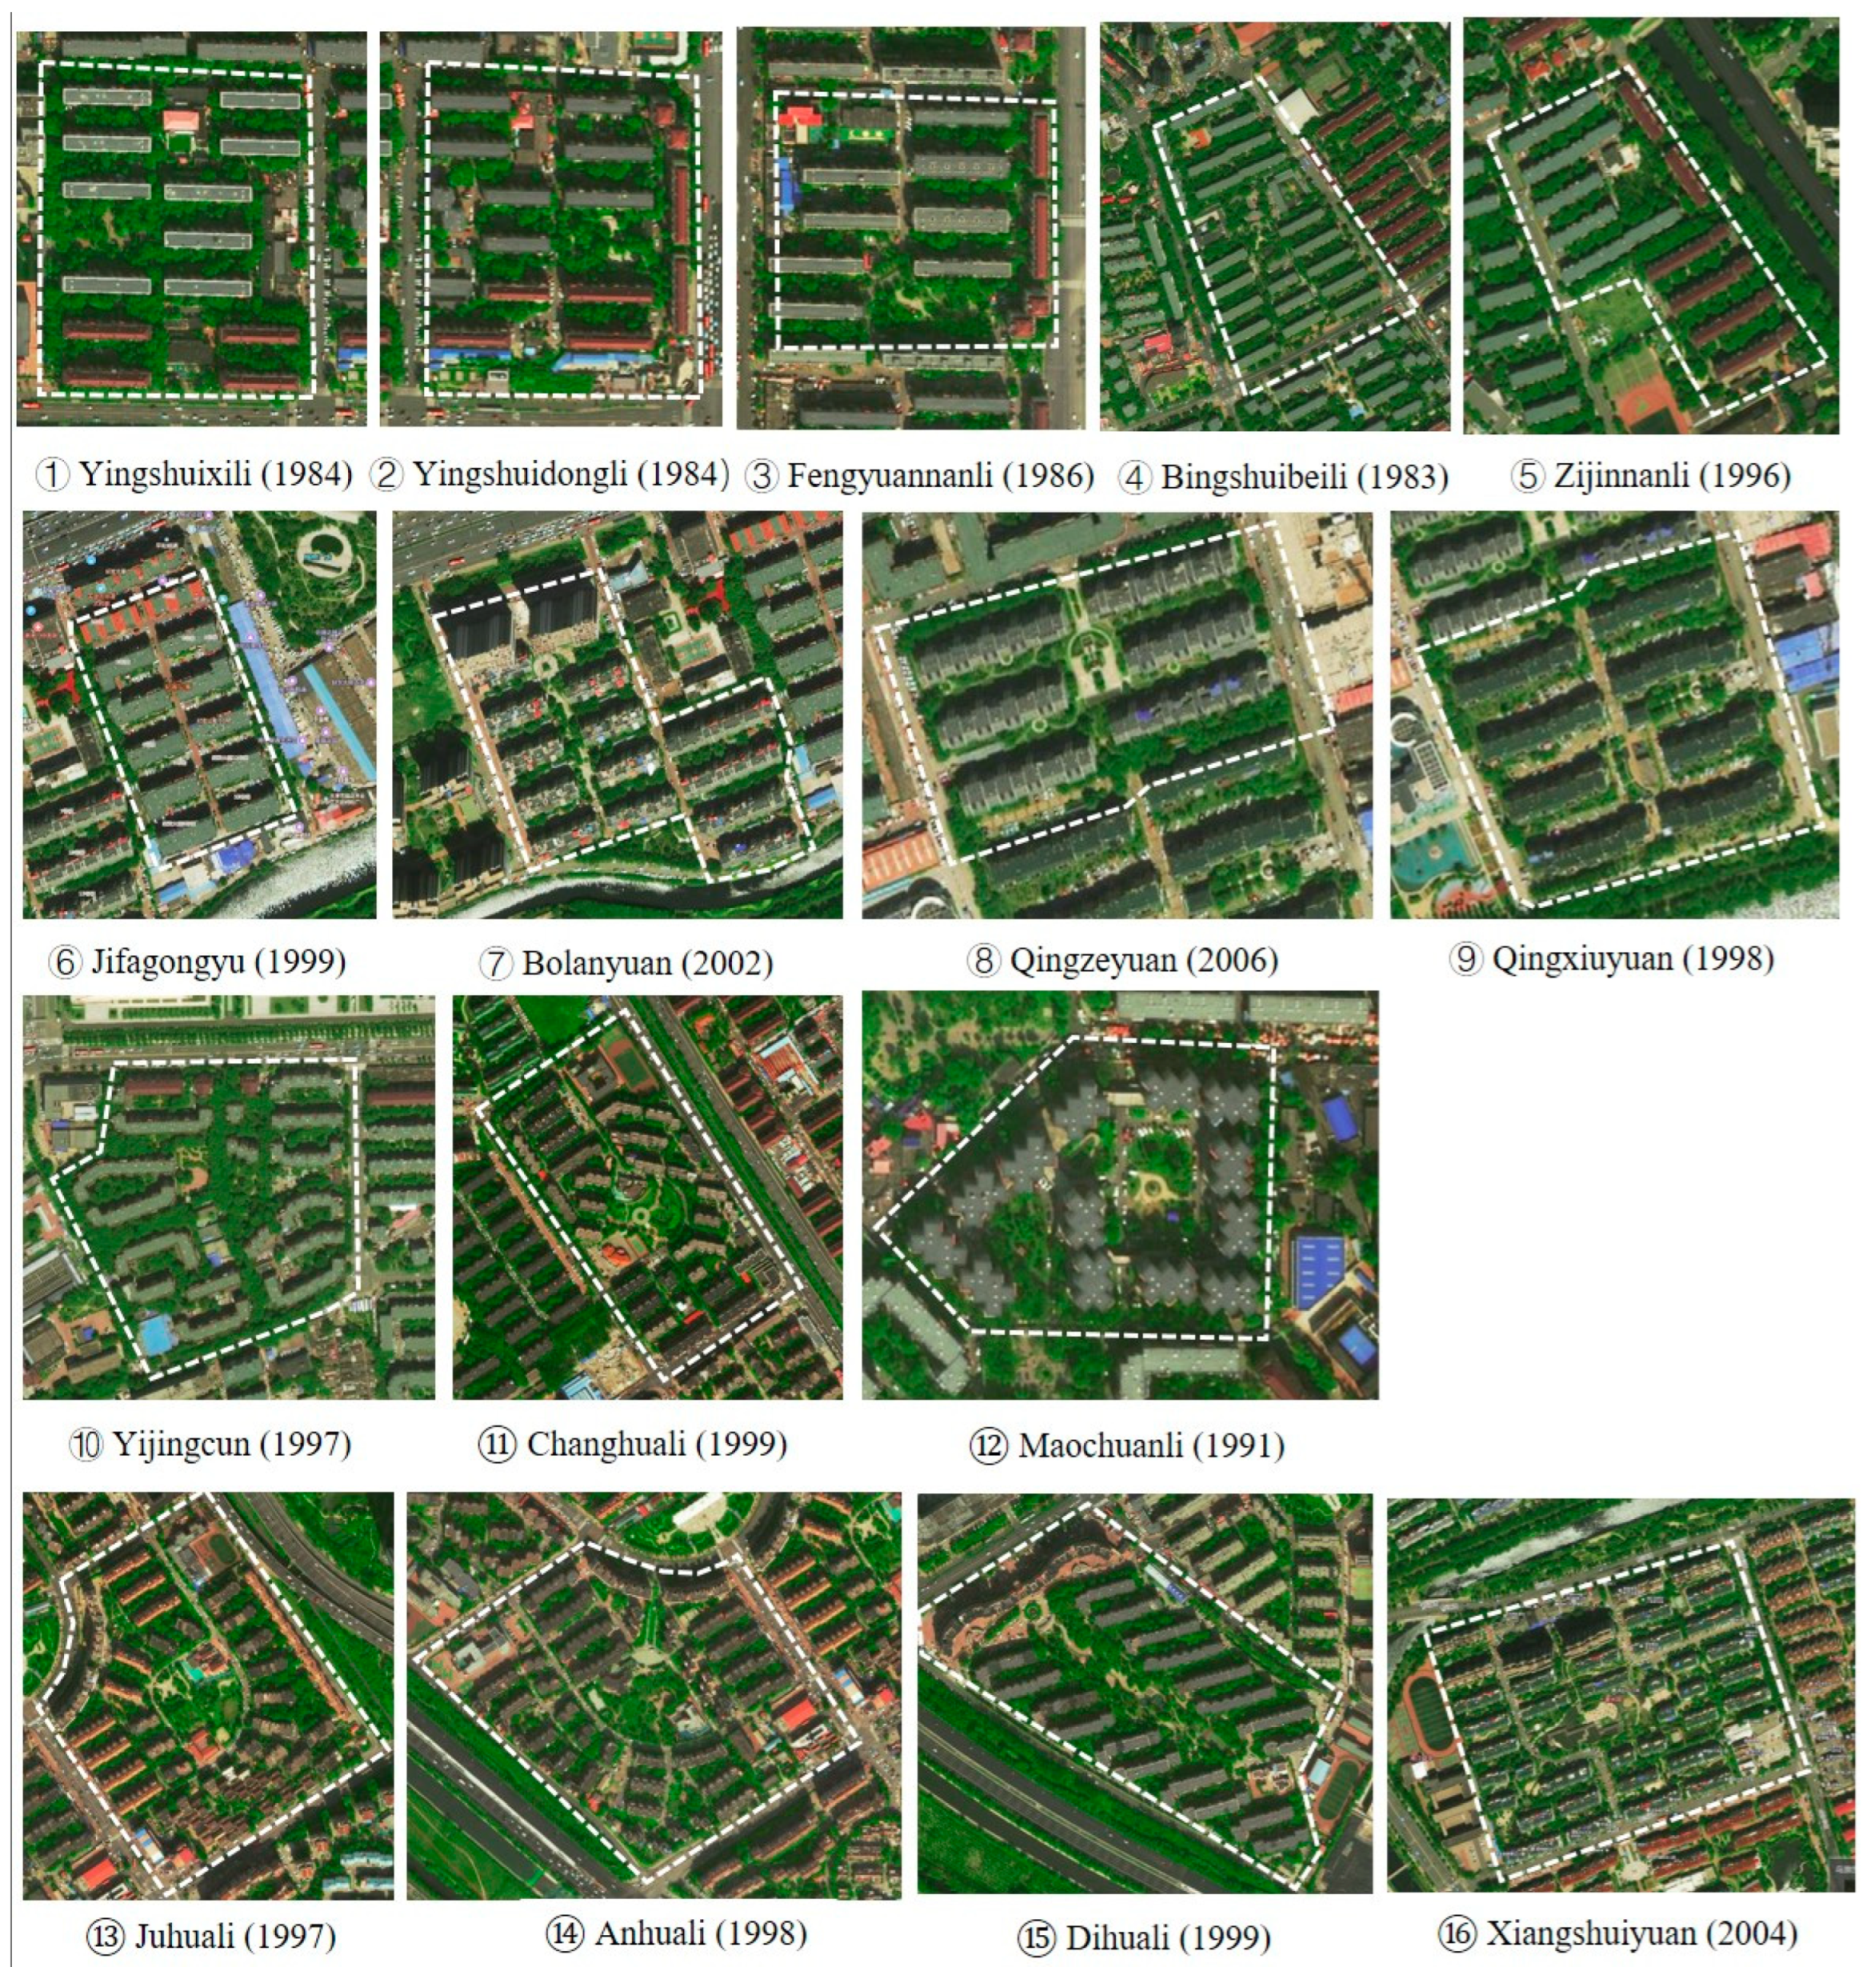
2.1. Study Area Description
2.2. Storm Rainfall Design
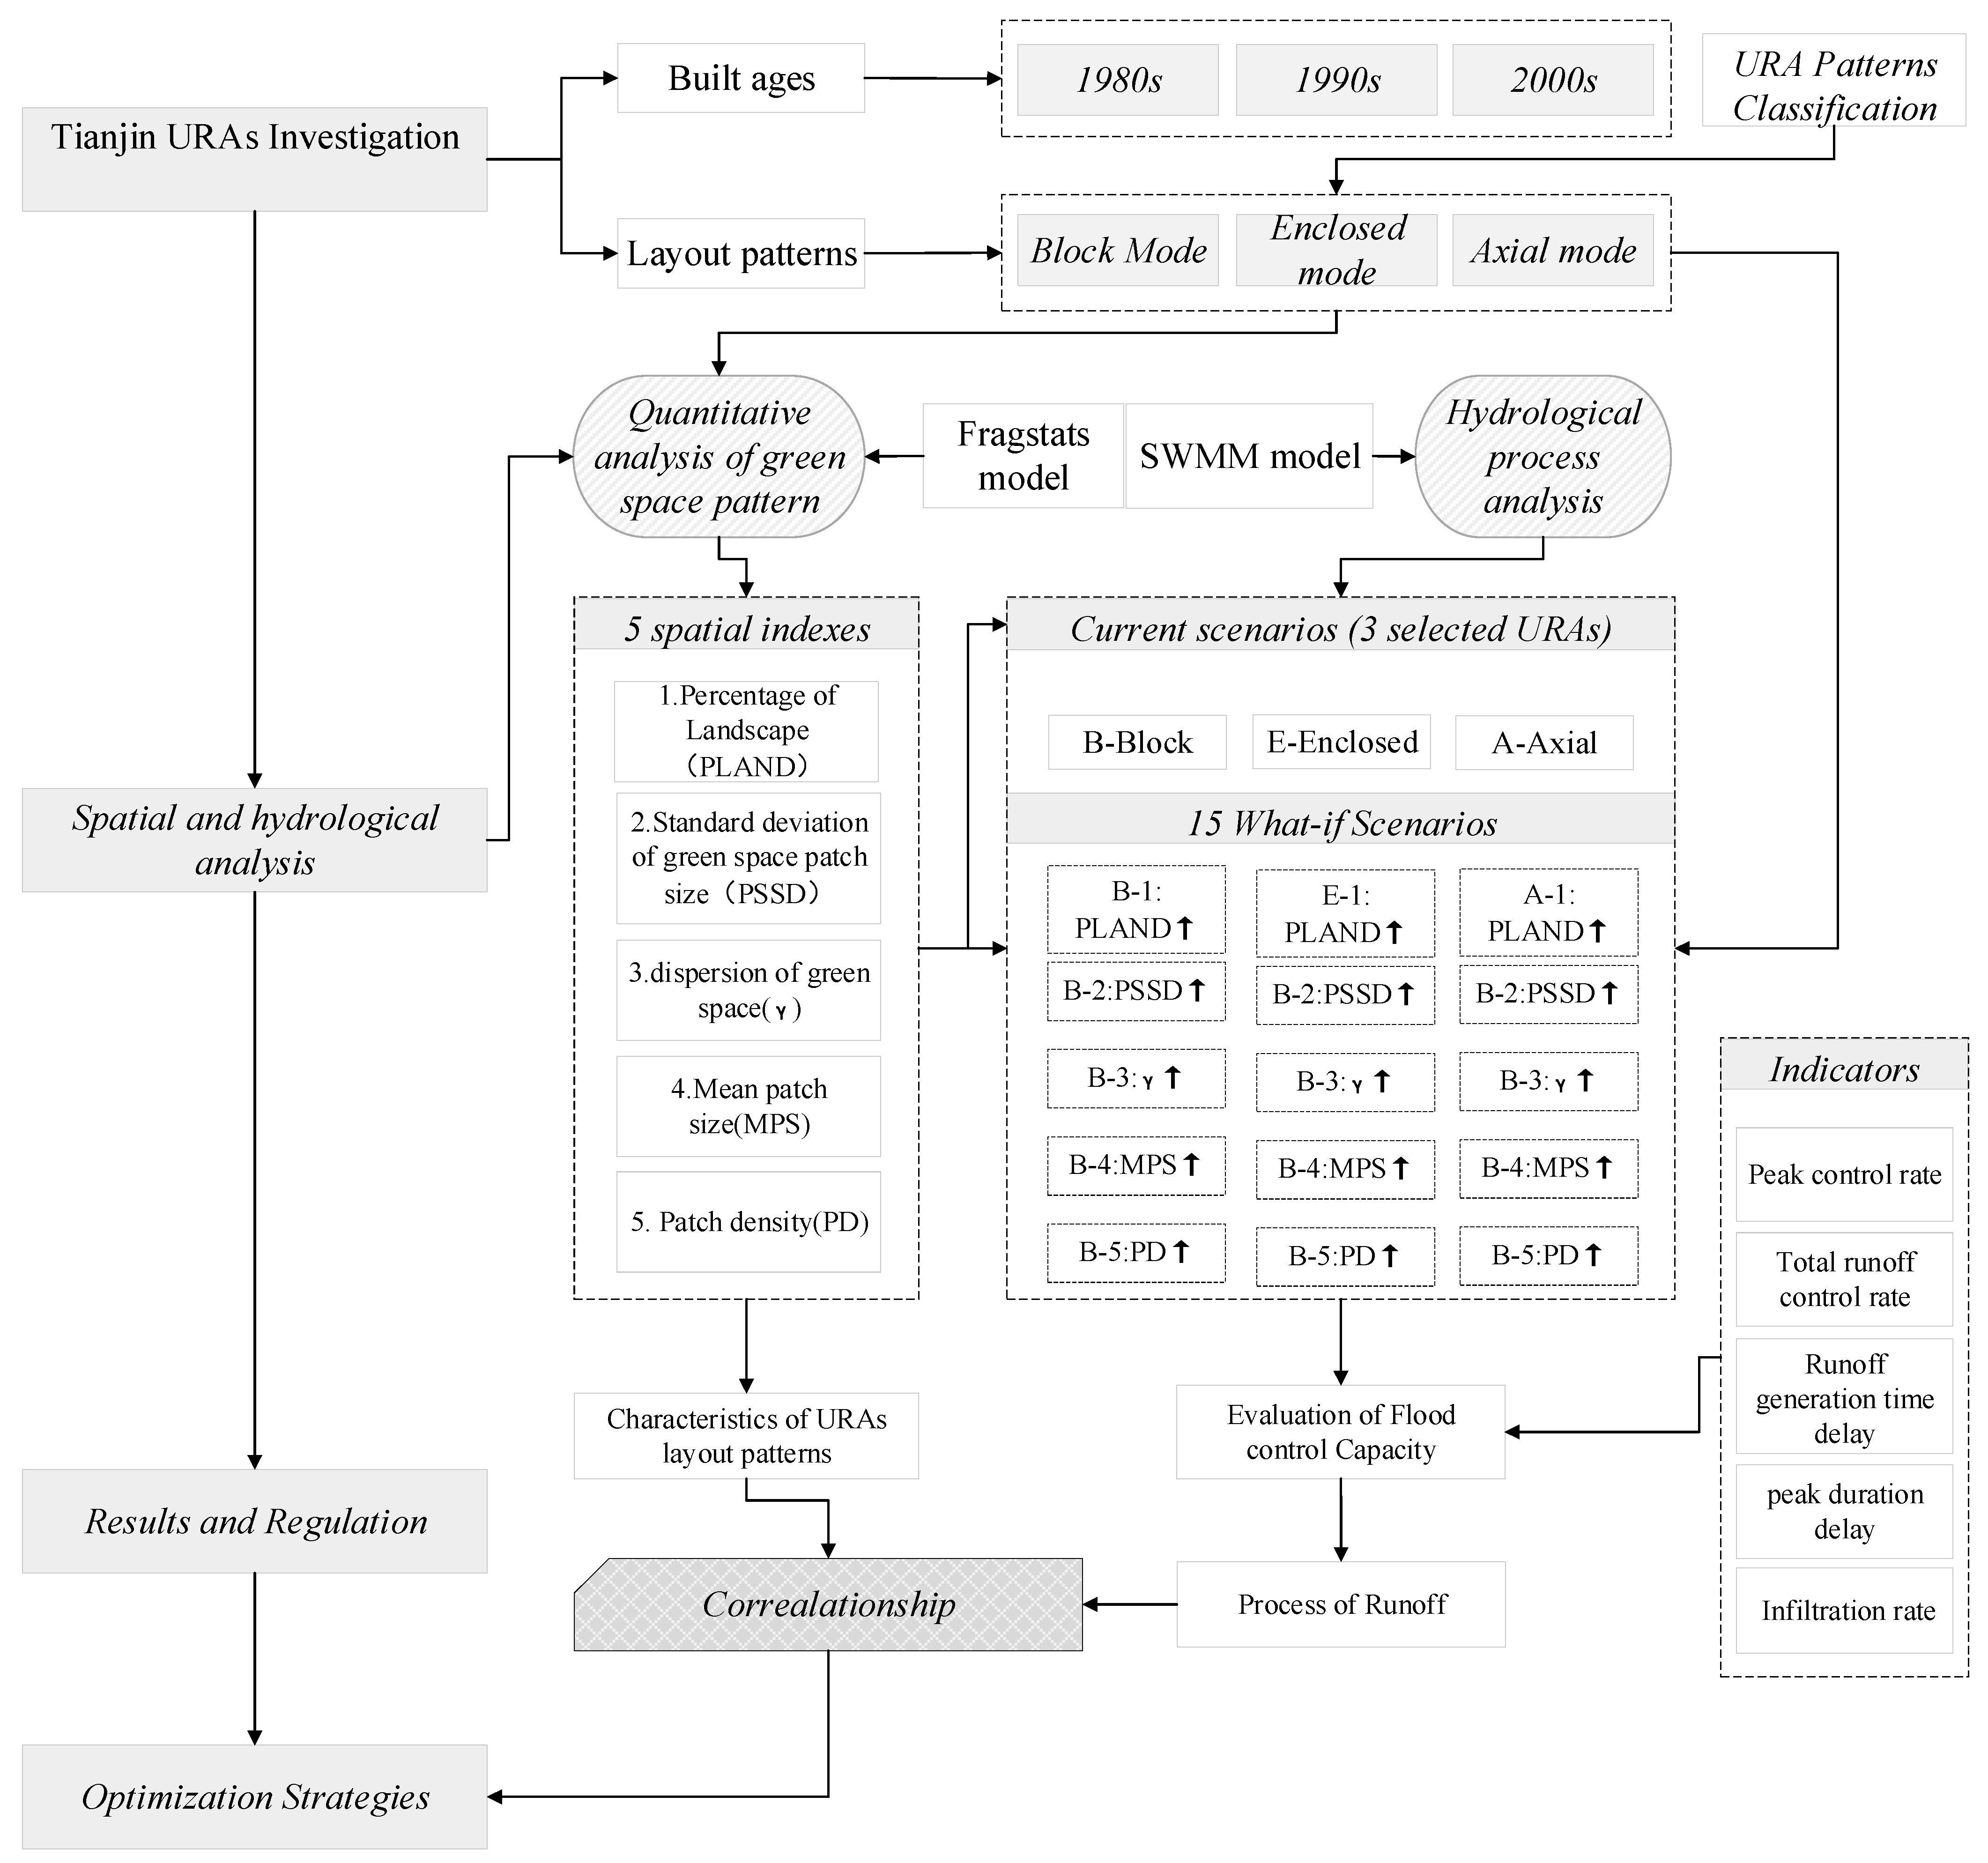
2.3. Workflow
2.4. Models
2.4.1. Fragstats
2.4.2. SWMM
2.5. Scenario Design
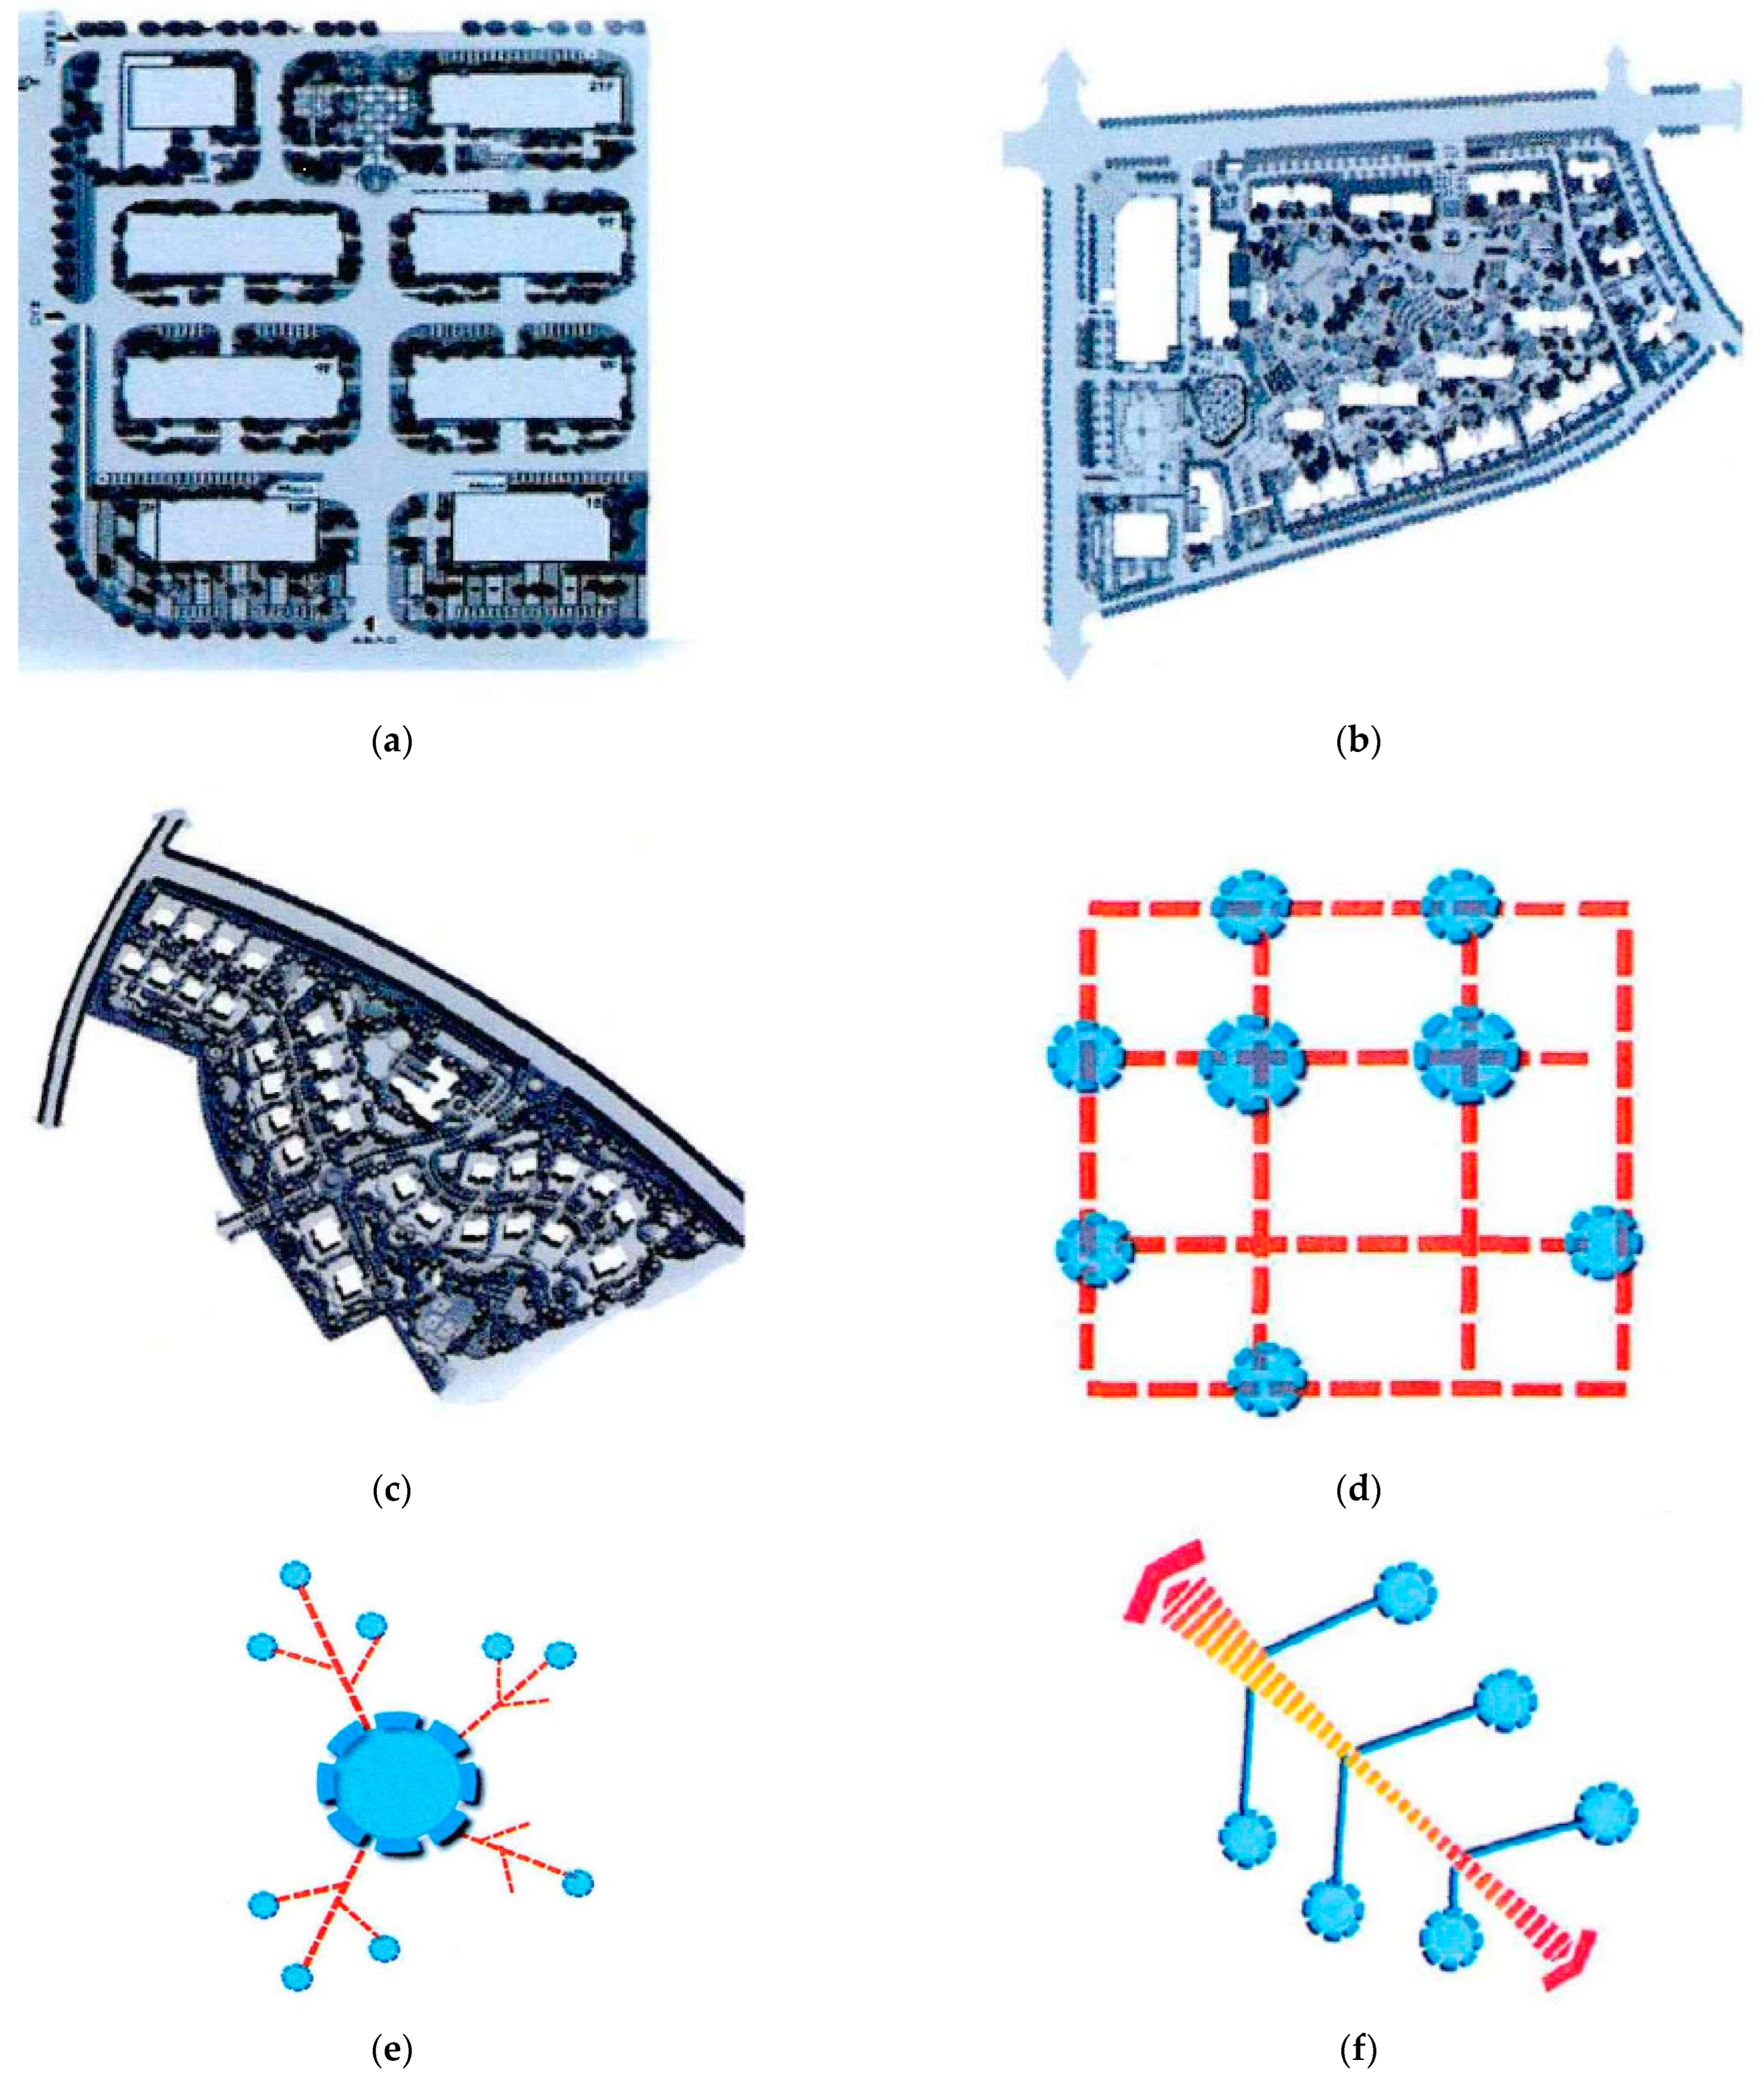
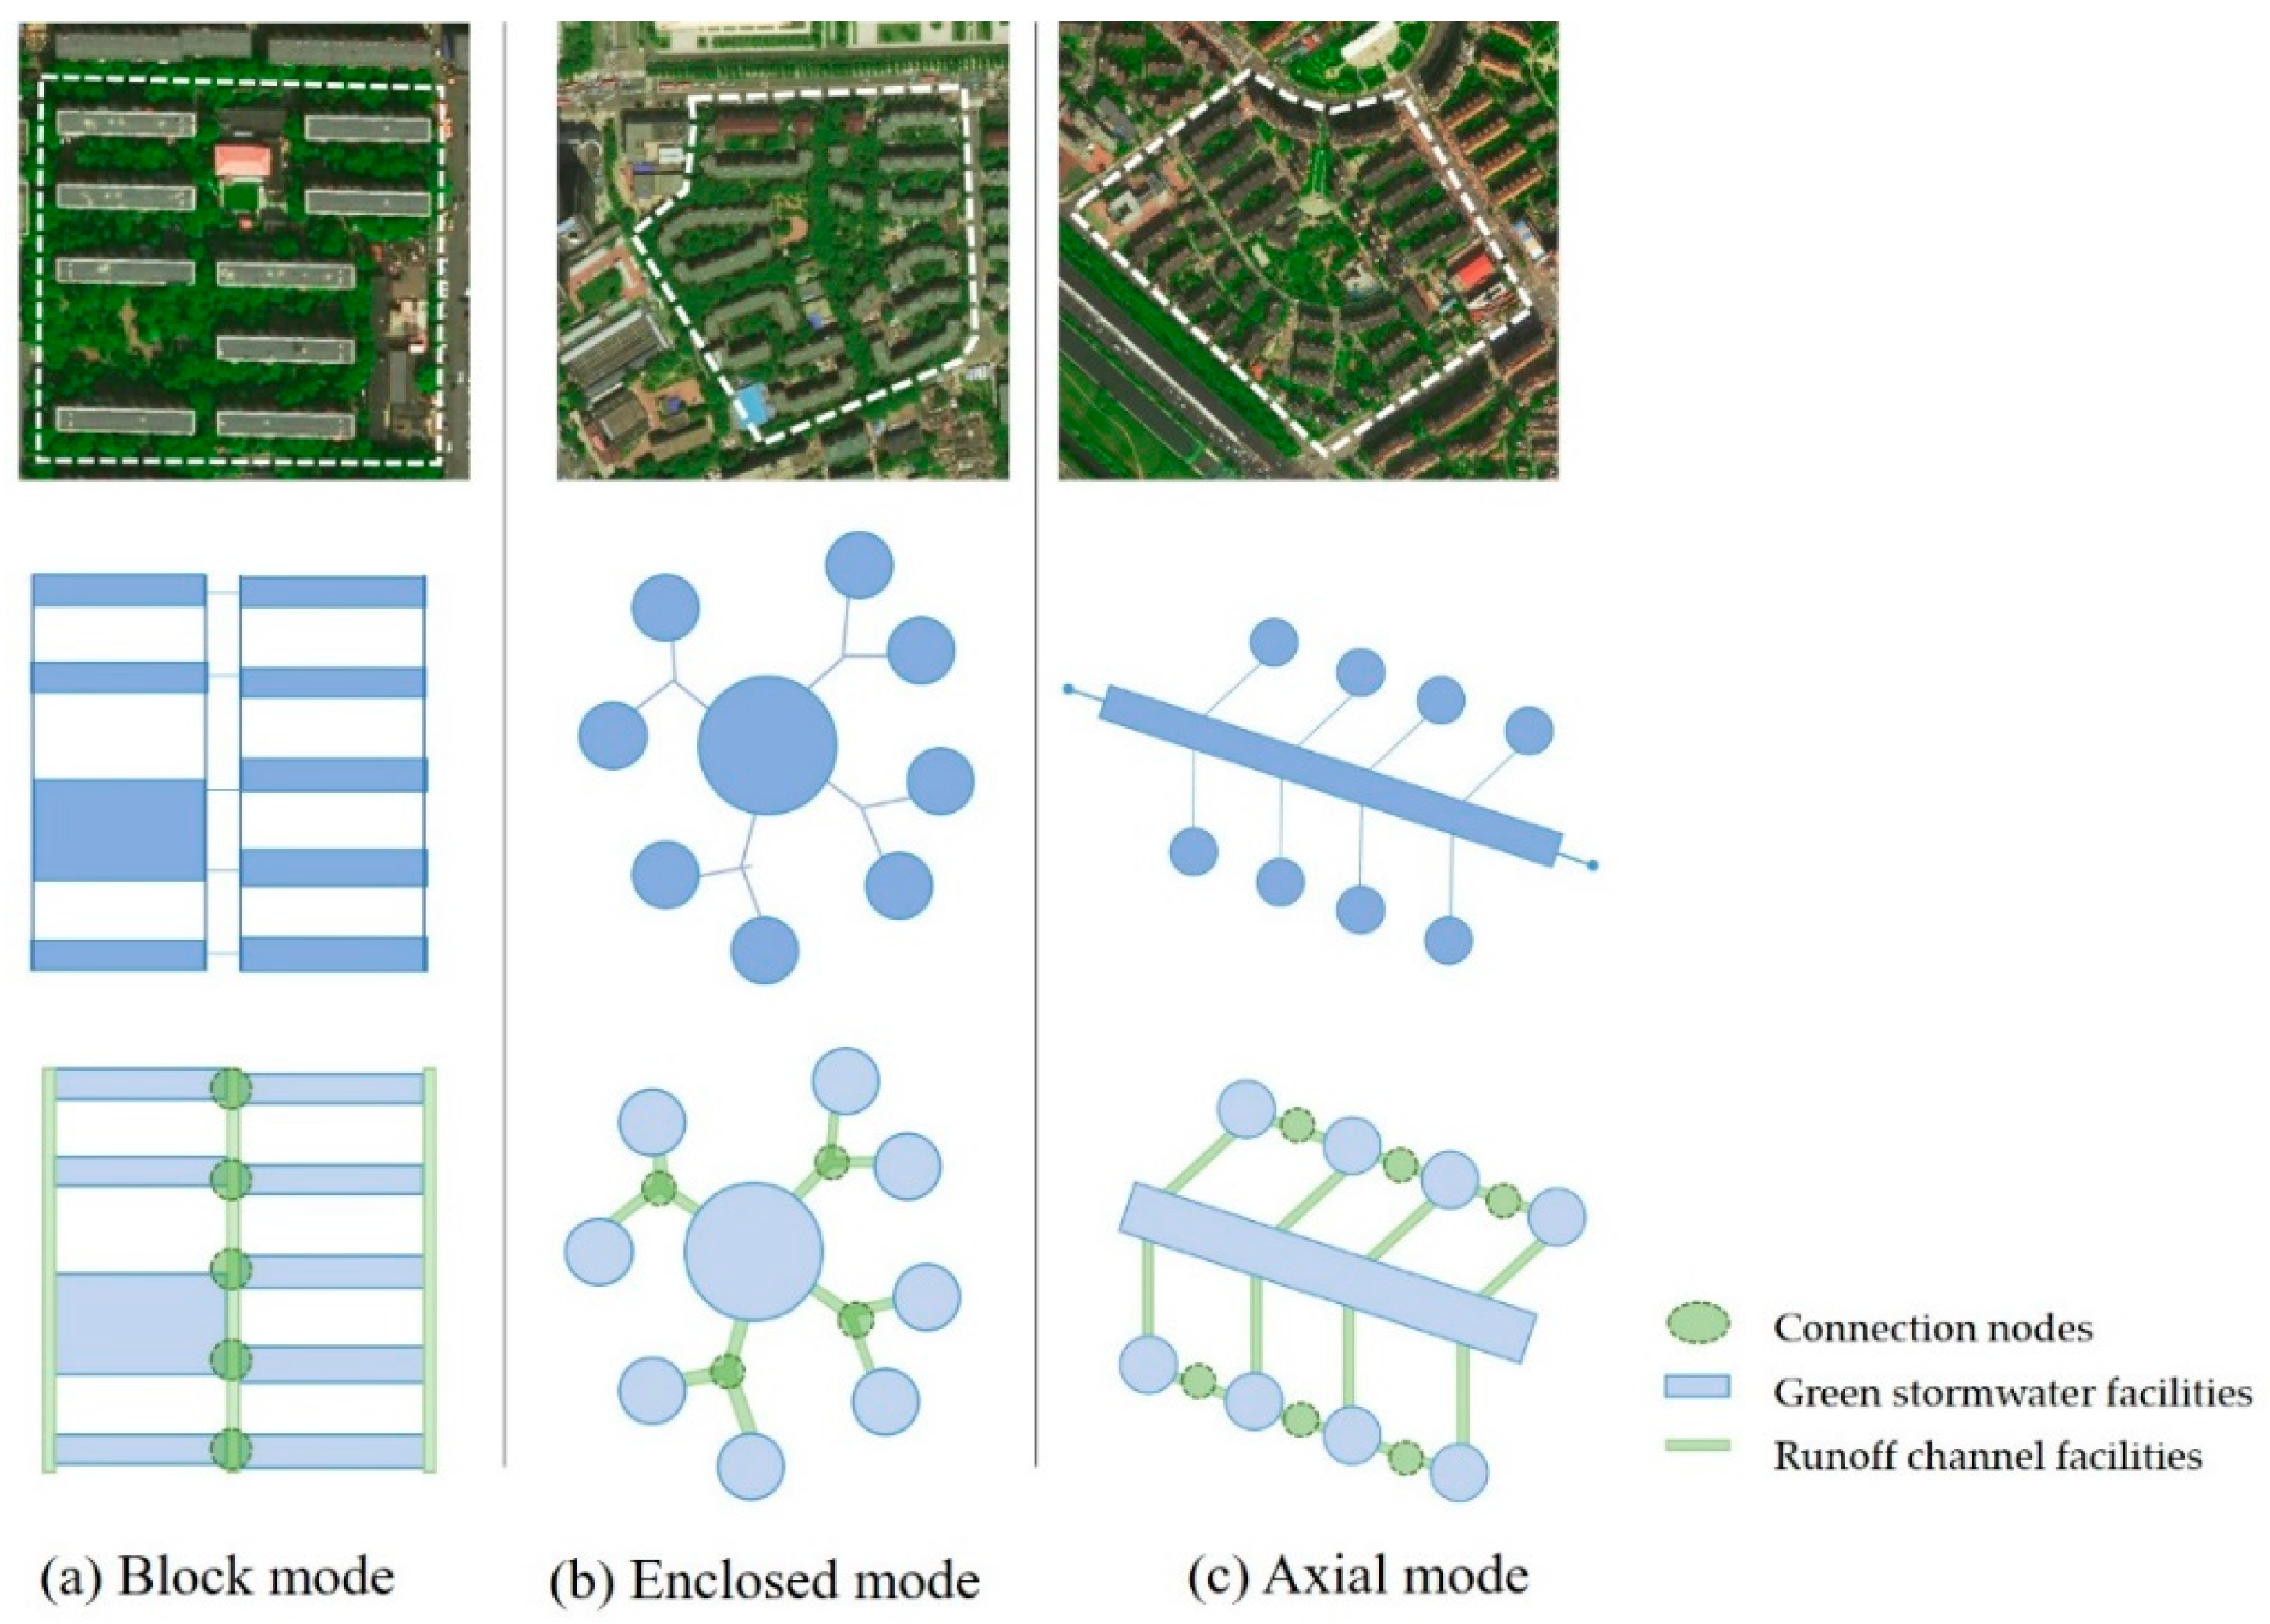
2.5.1. Impact of the UGS Layout
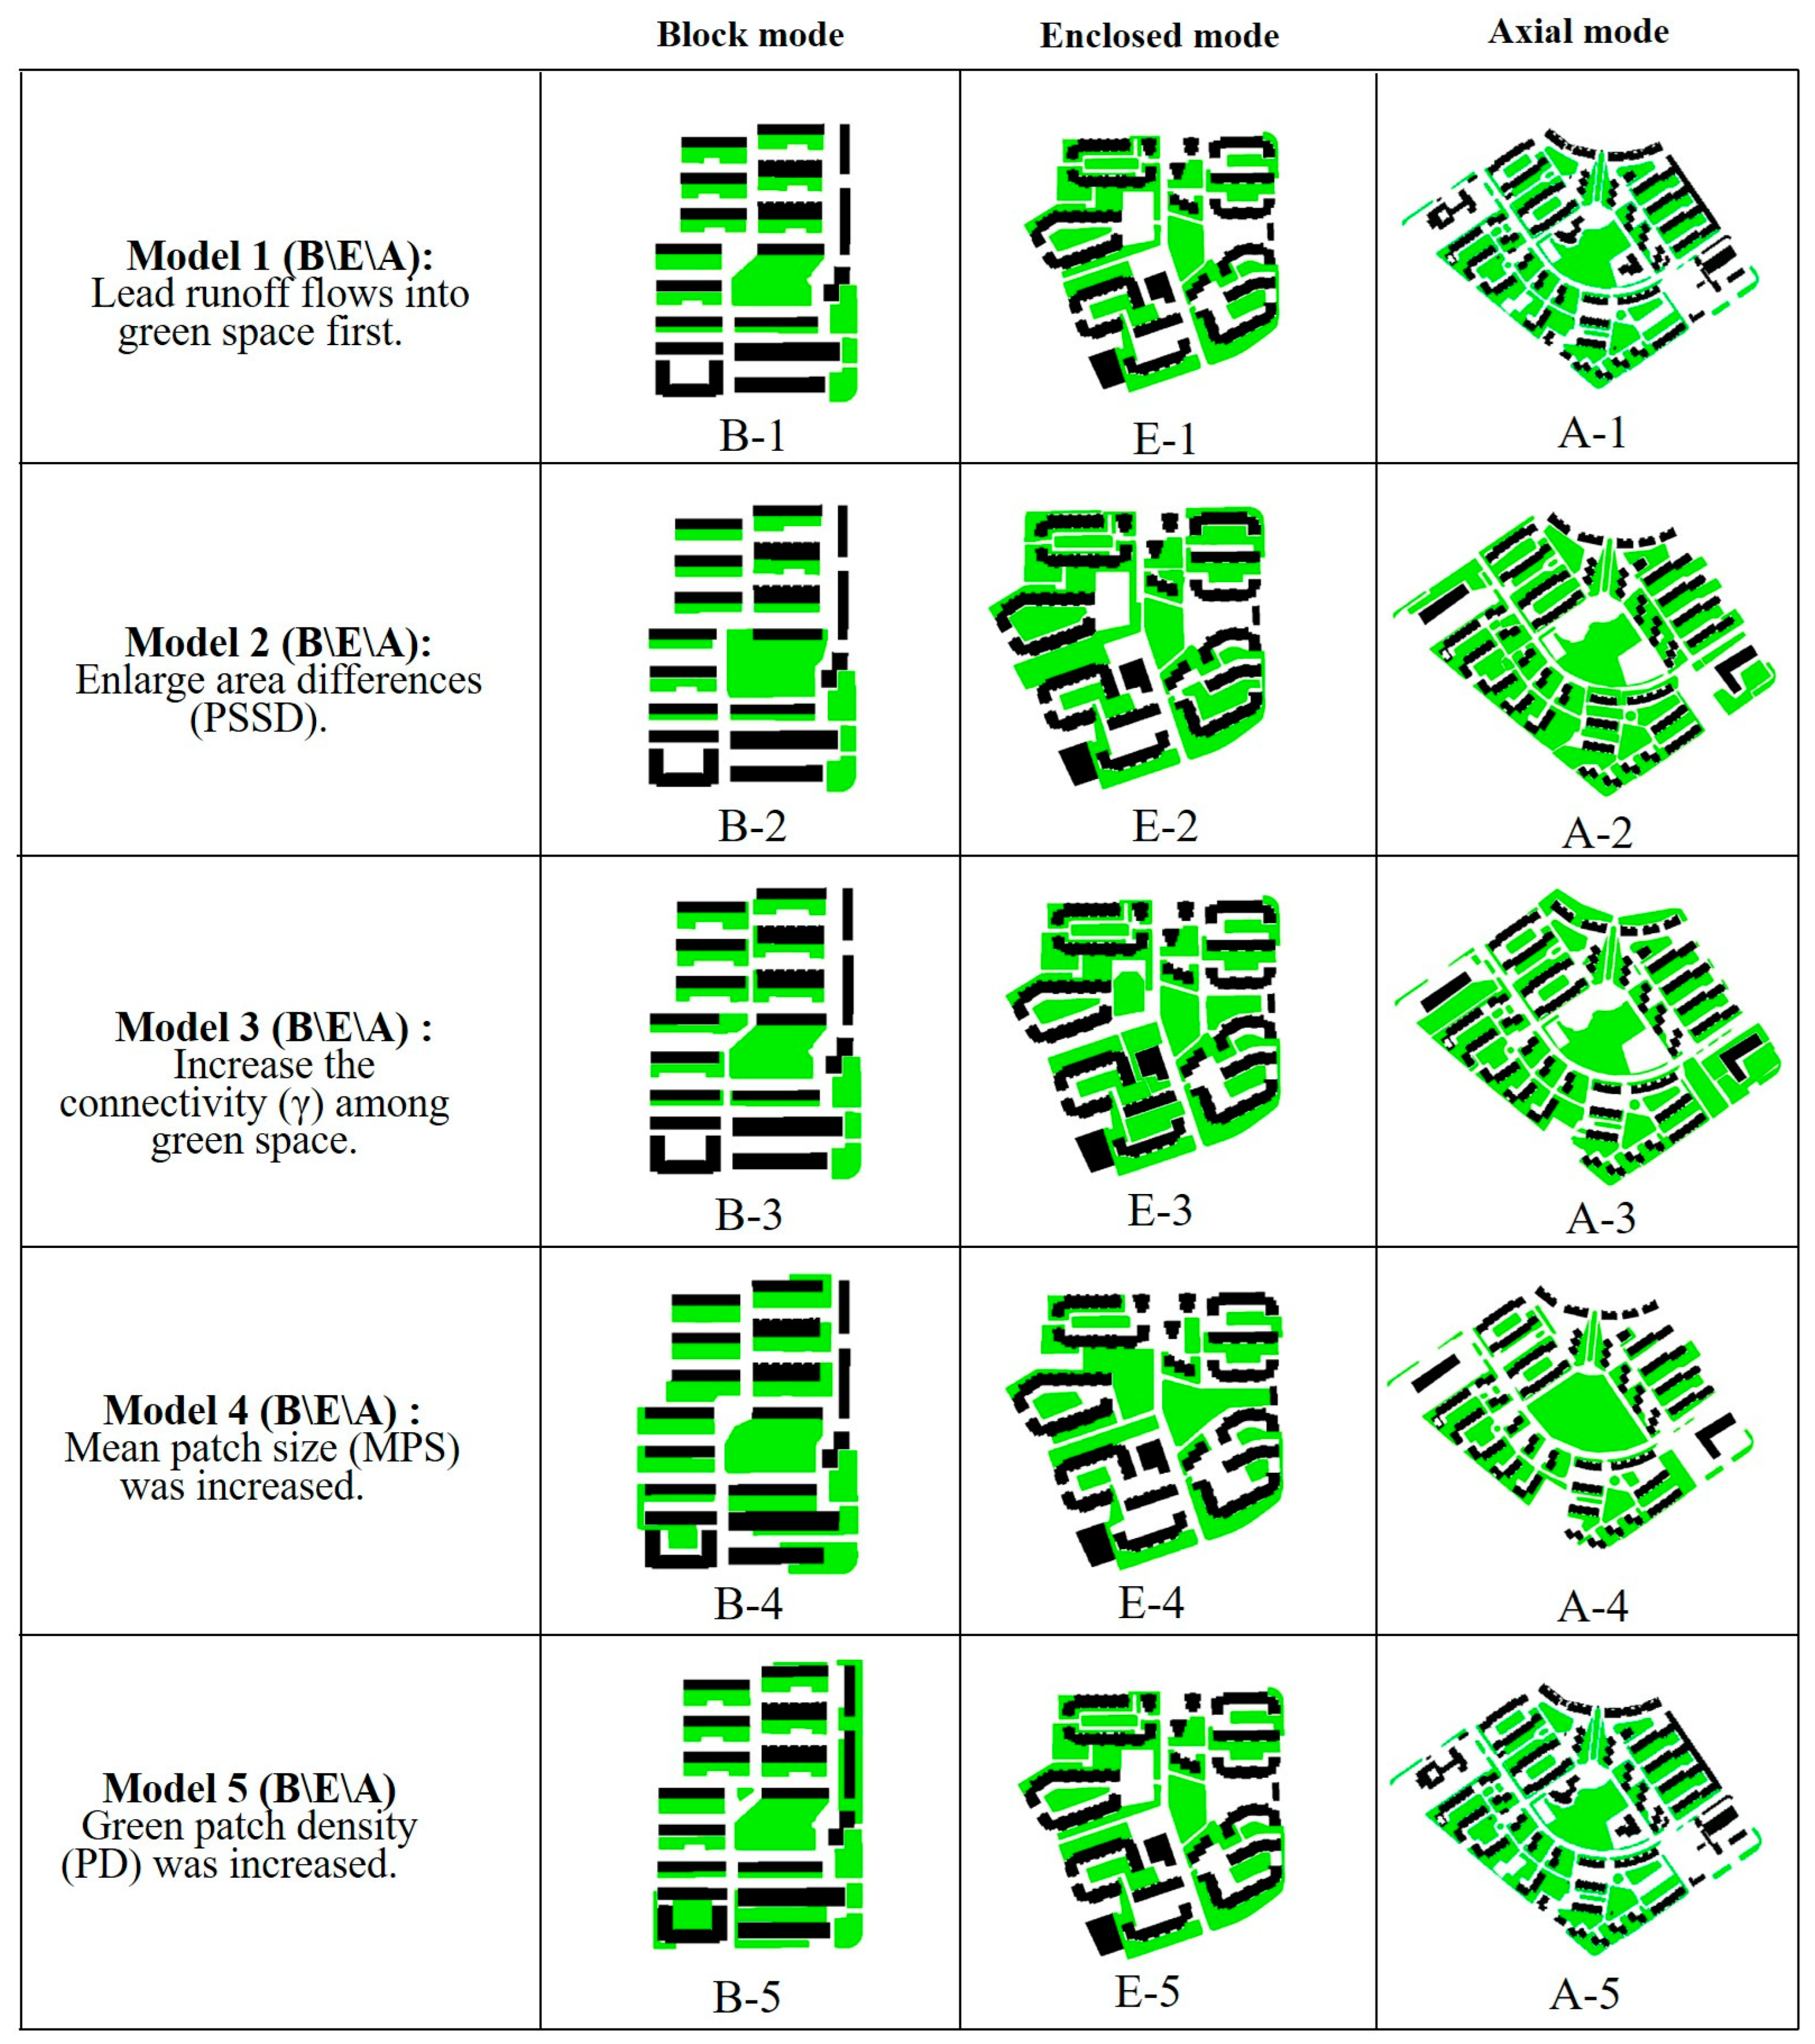
2.5.2. Simulation Scenario Design
3. Results
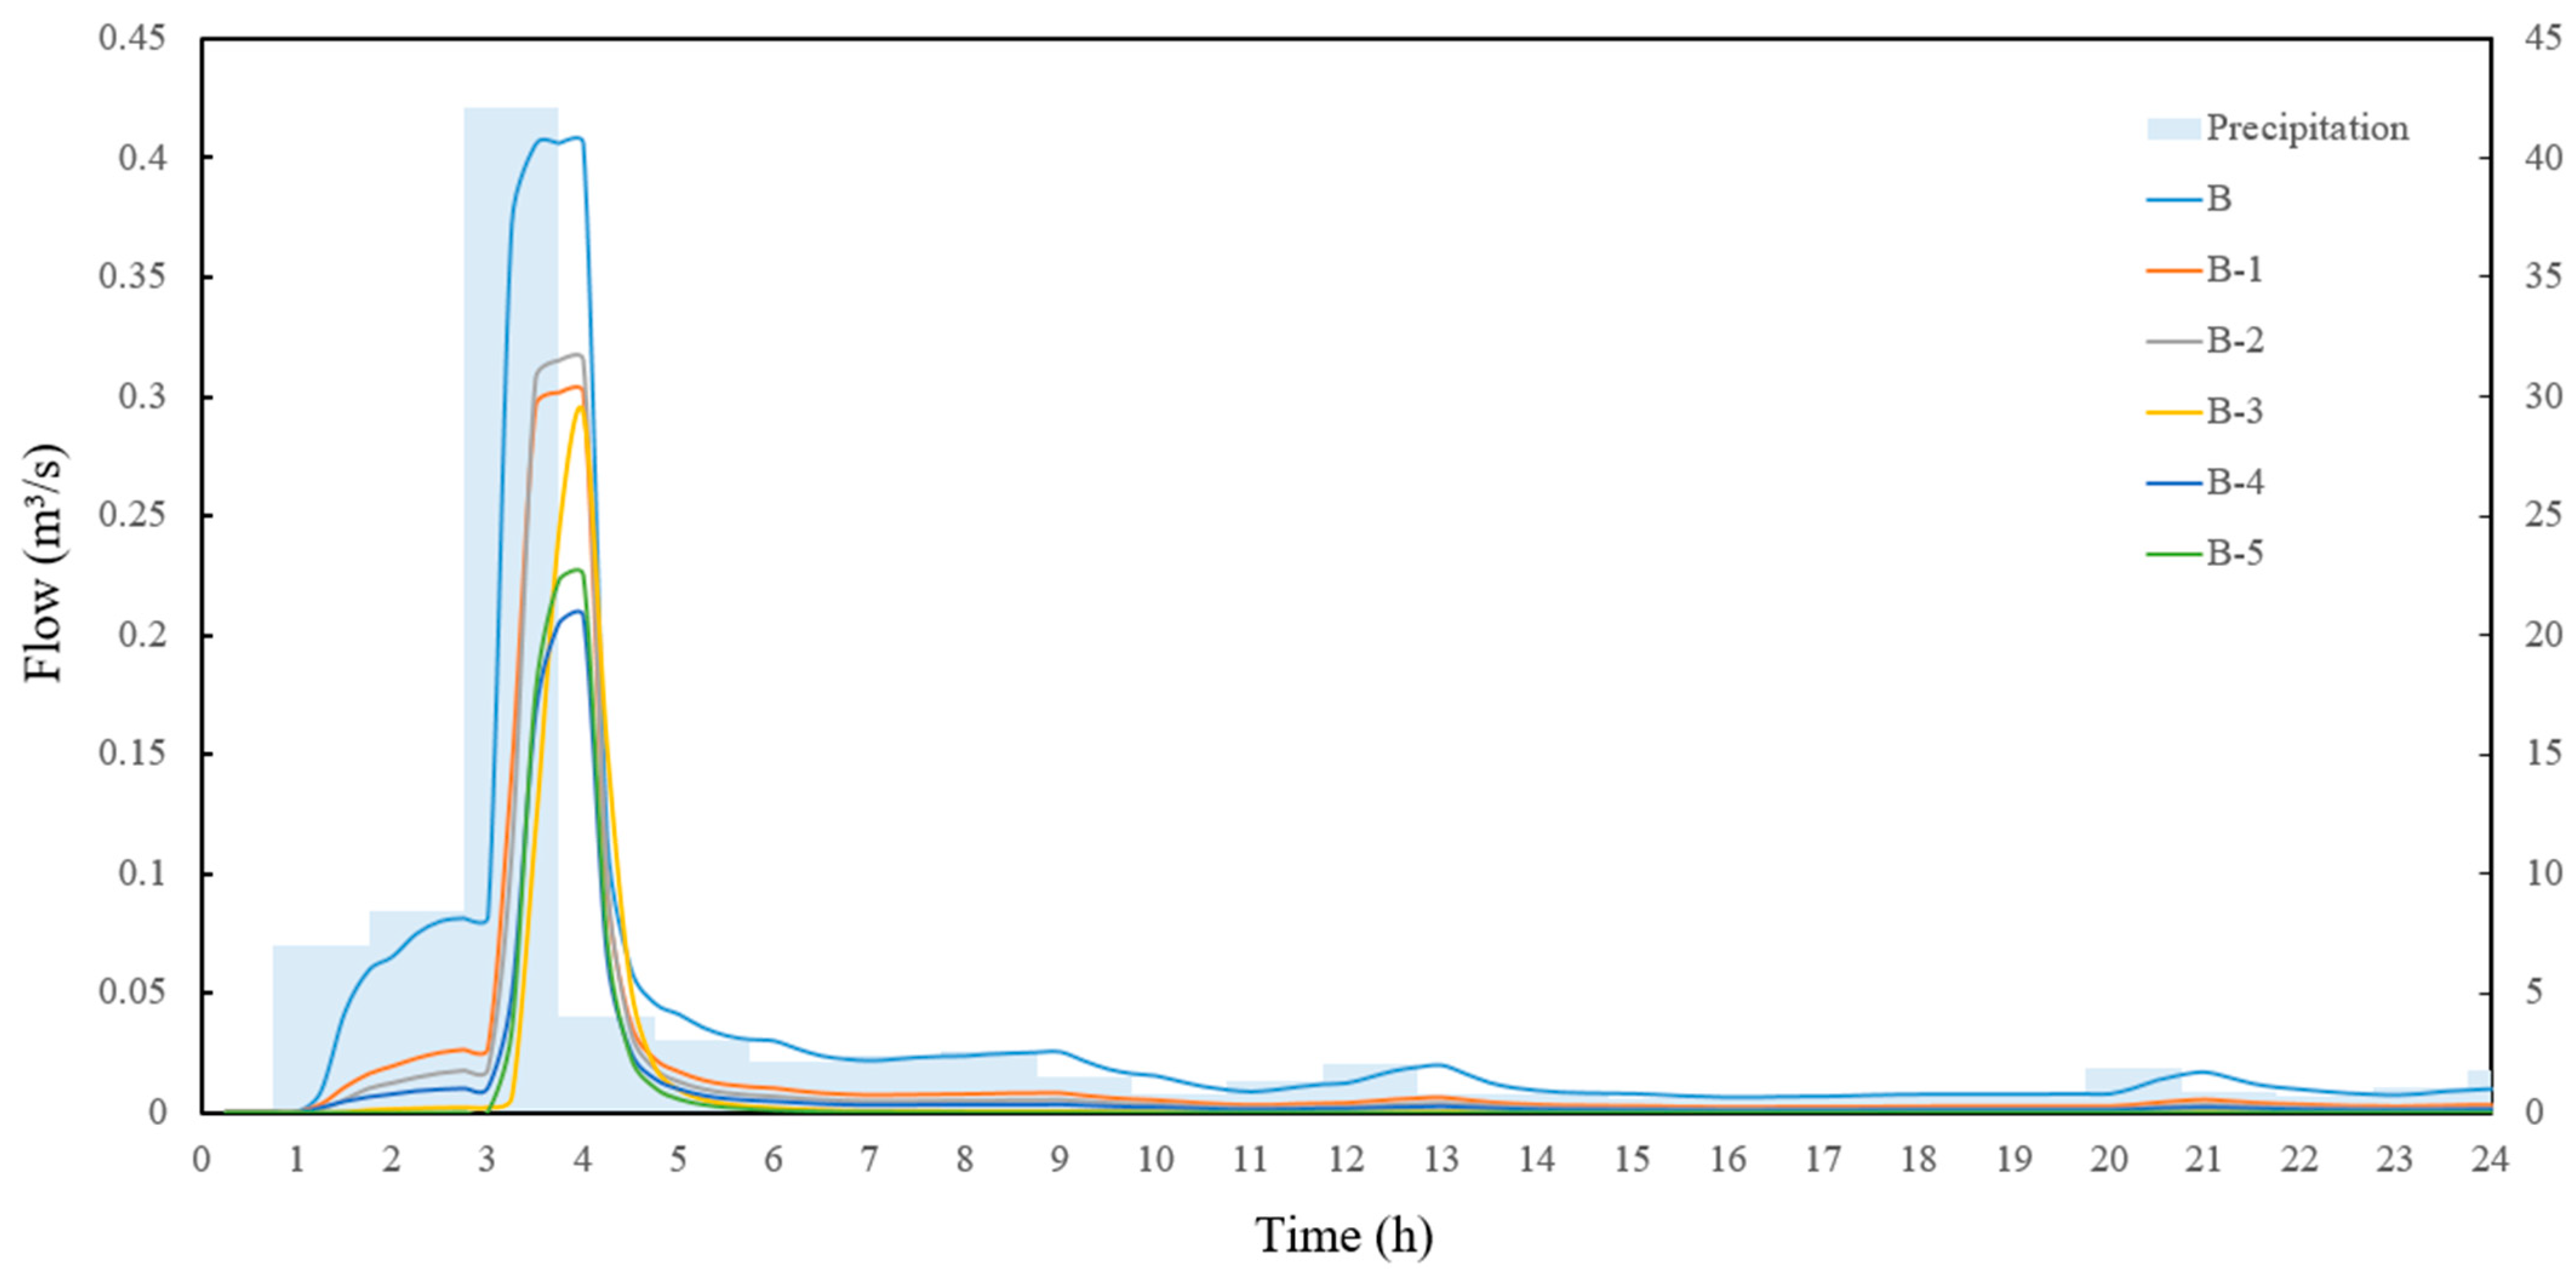
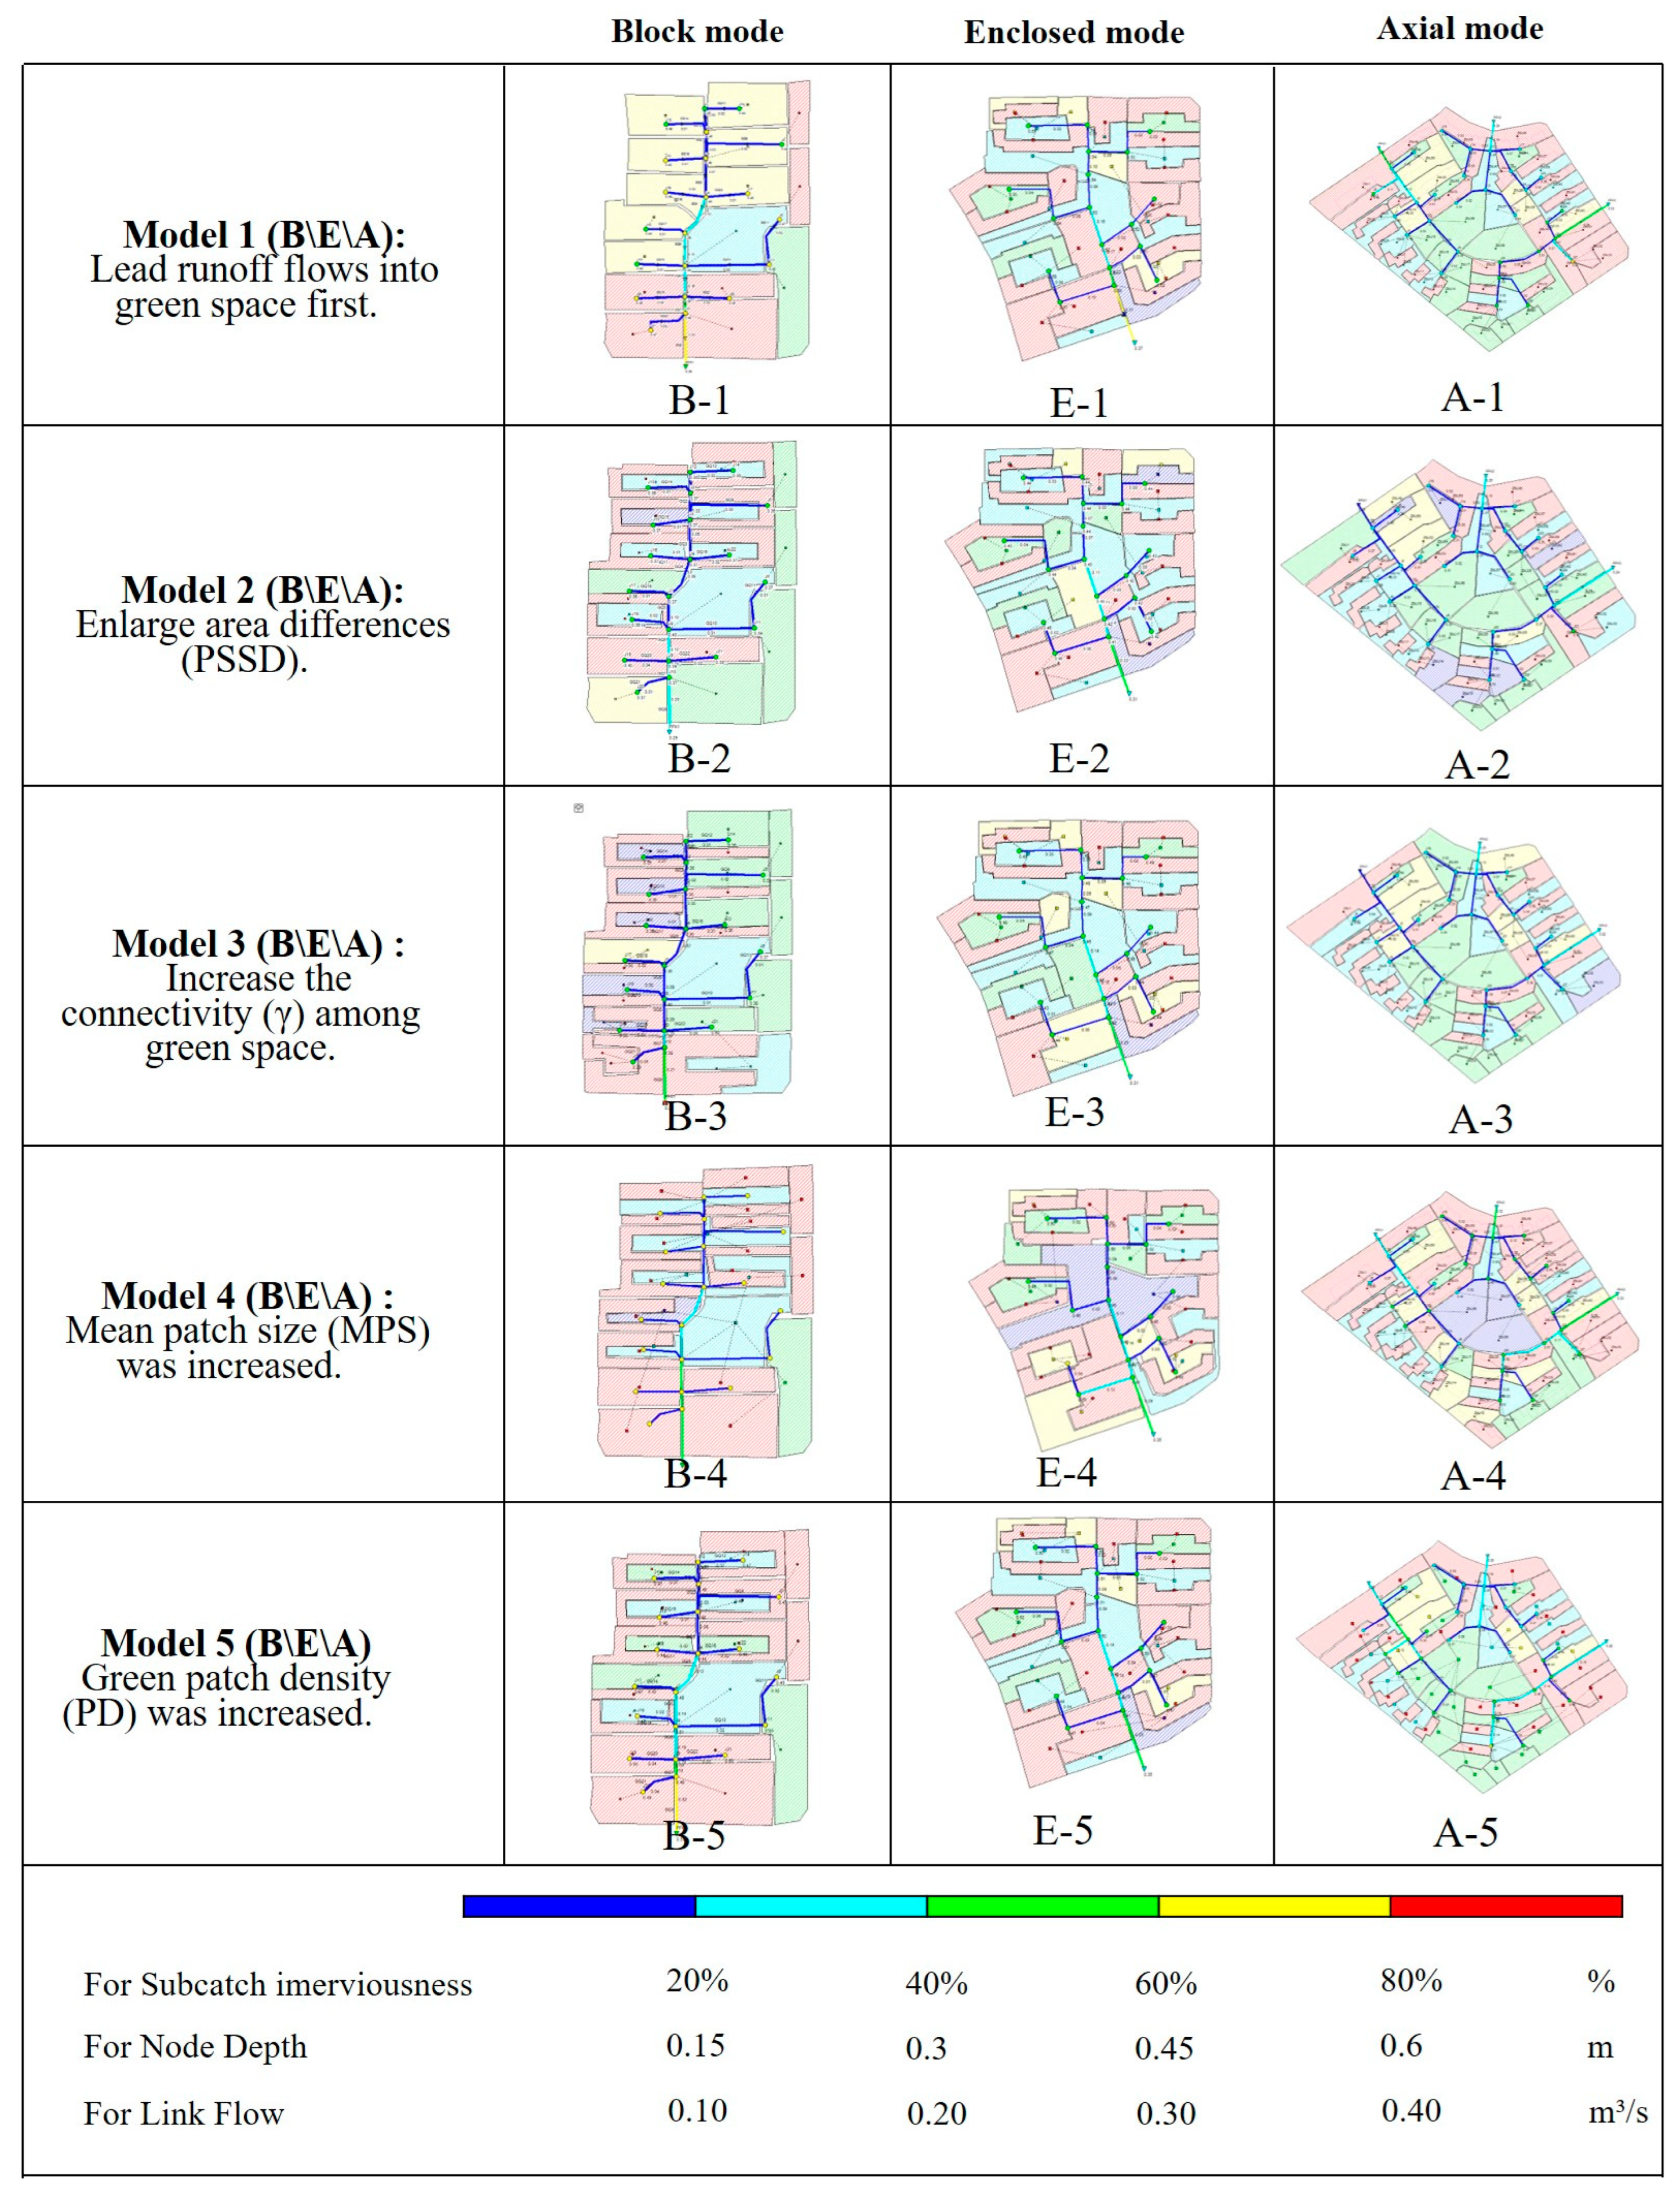
3.1. Impact of Green Space System Layout on Hydrological Process in Block Mode URAs
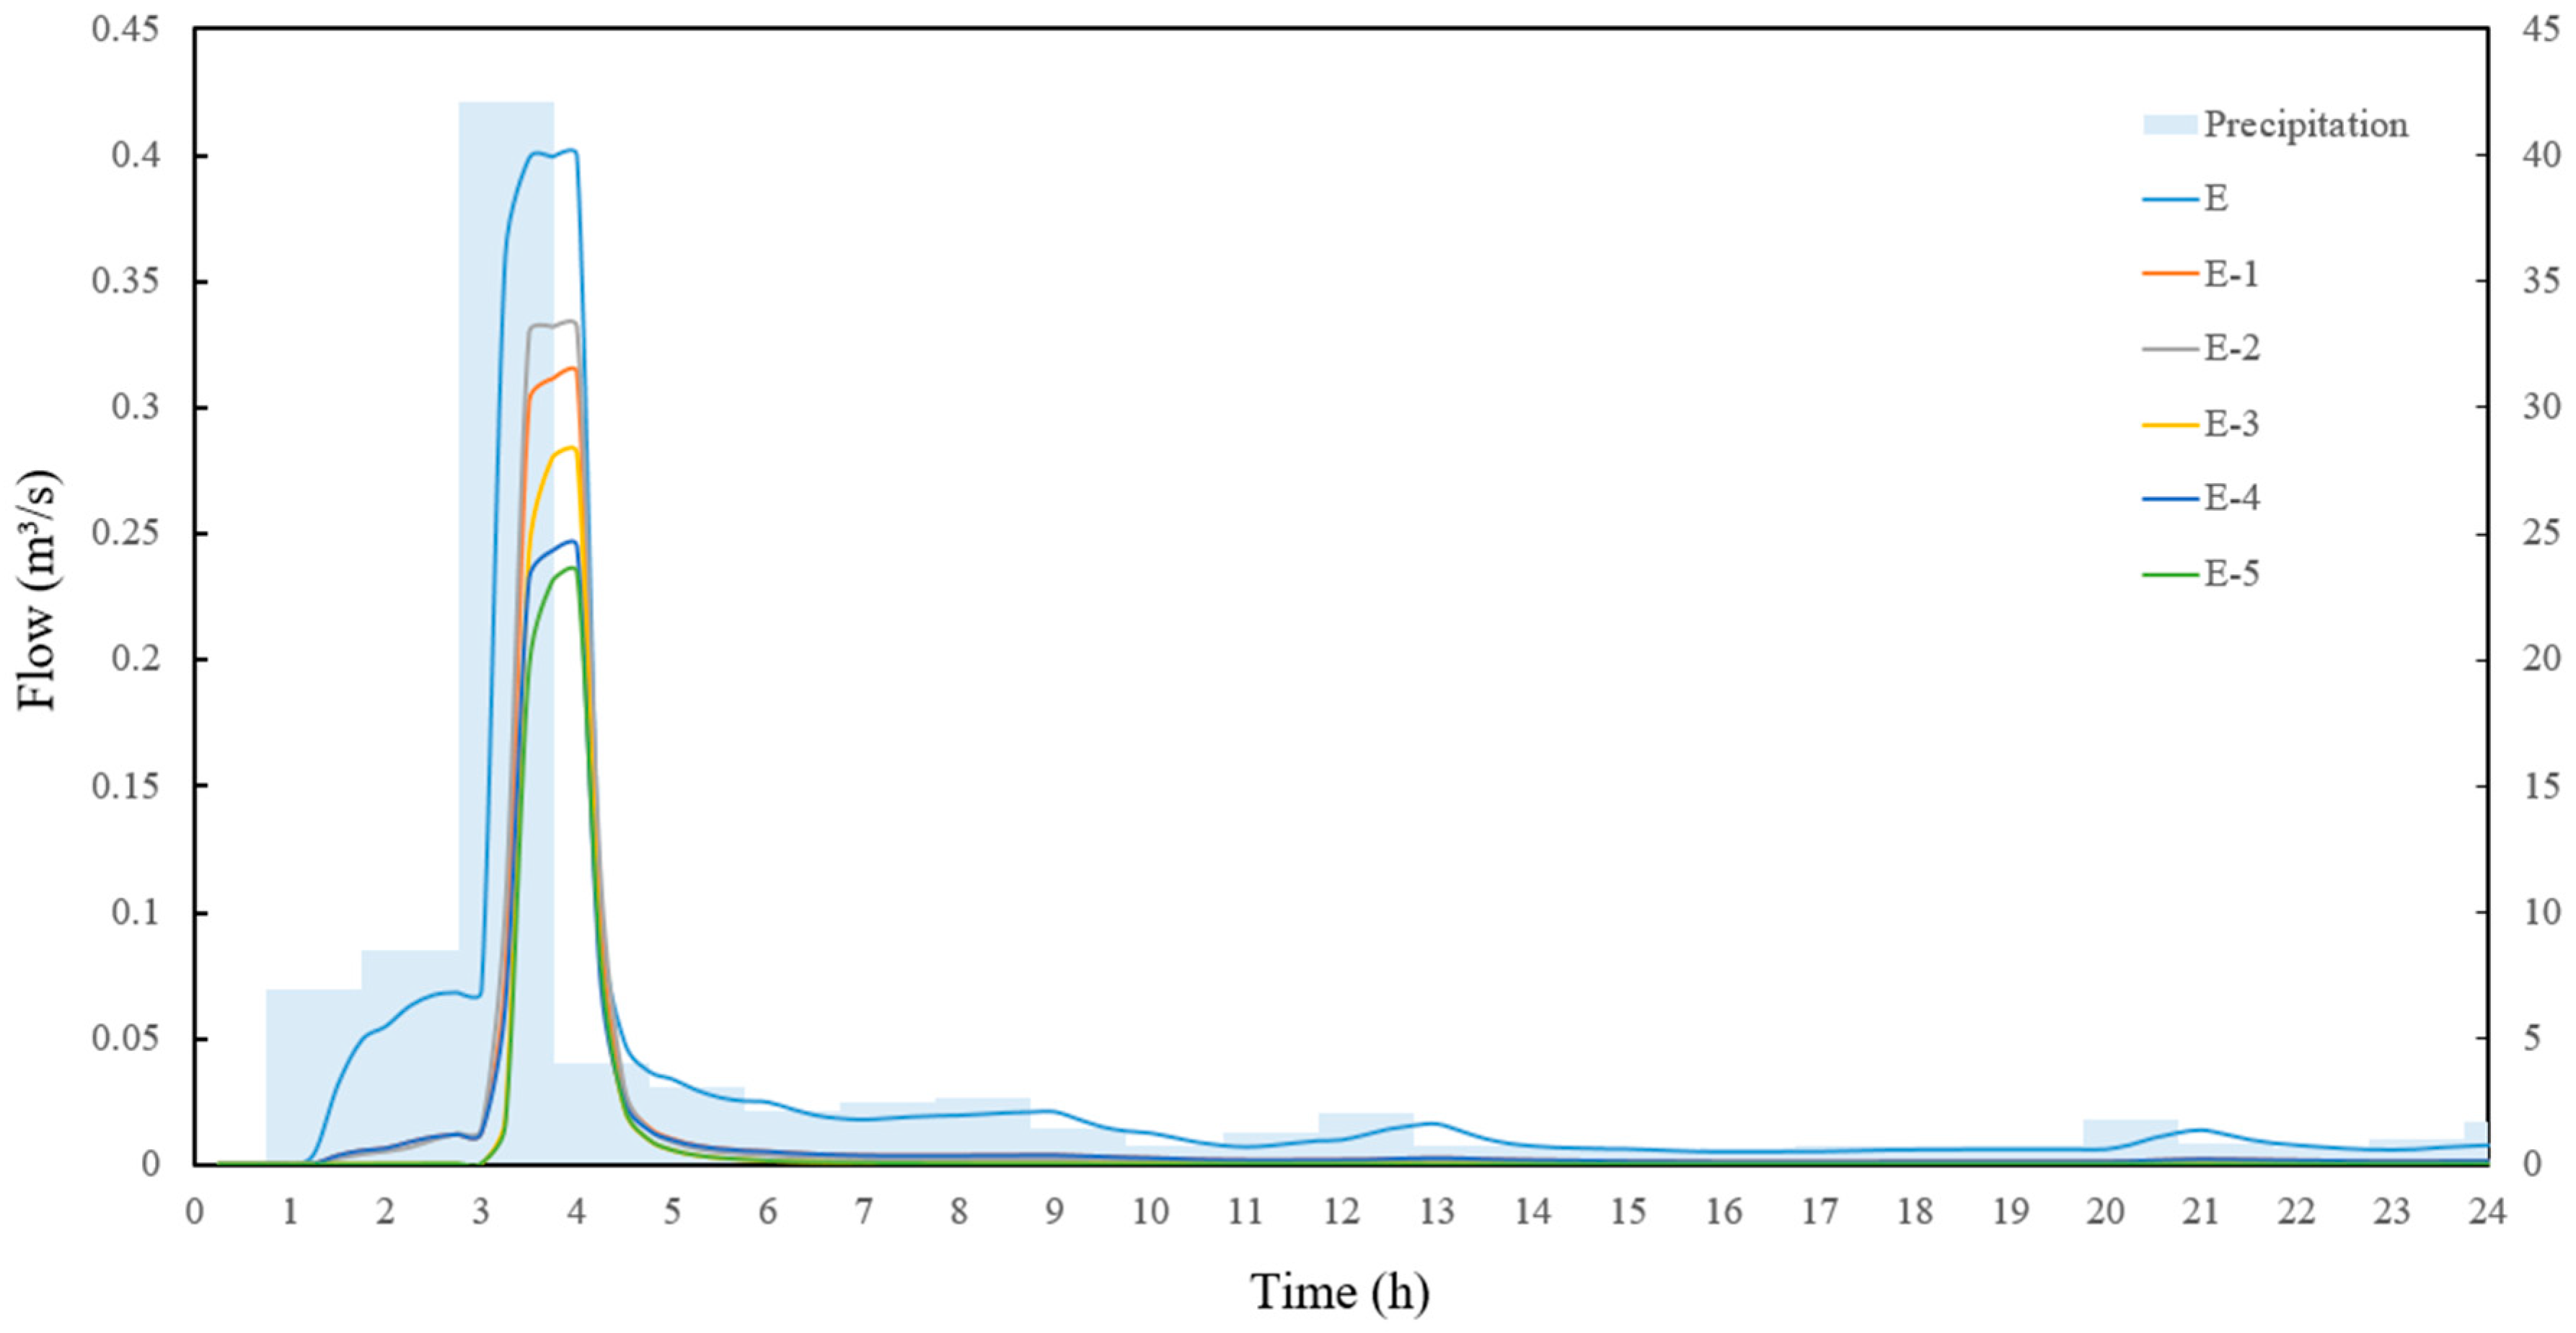
3.2. Impact of Green Space System Layout on Hydrological Process in Enclosed Mode URAs
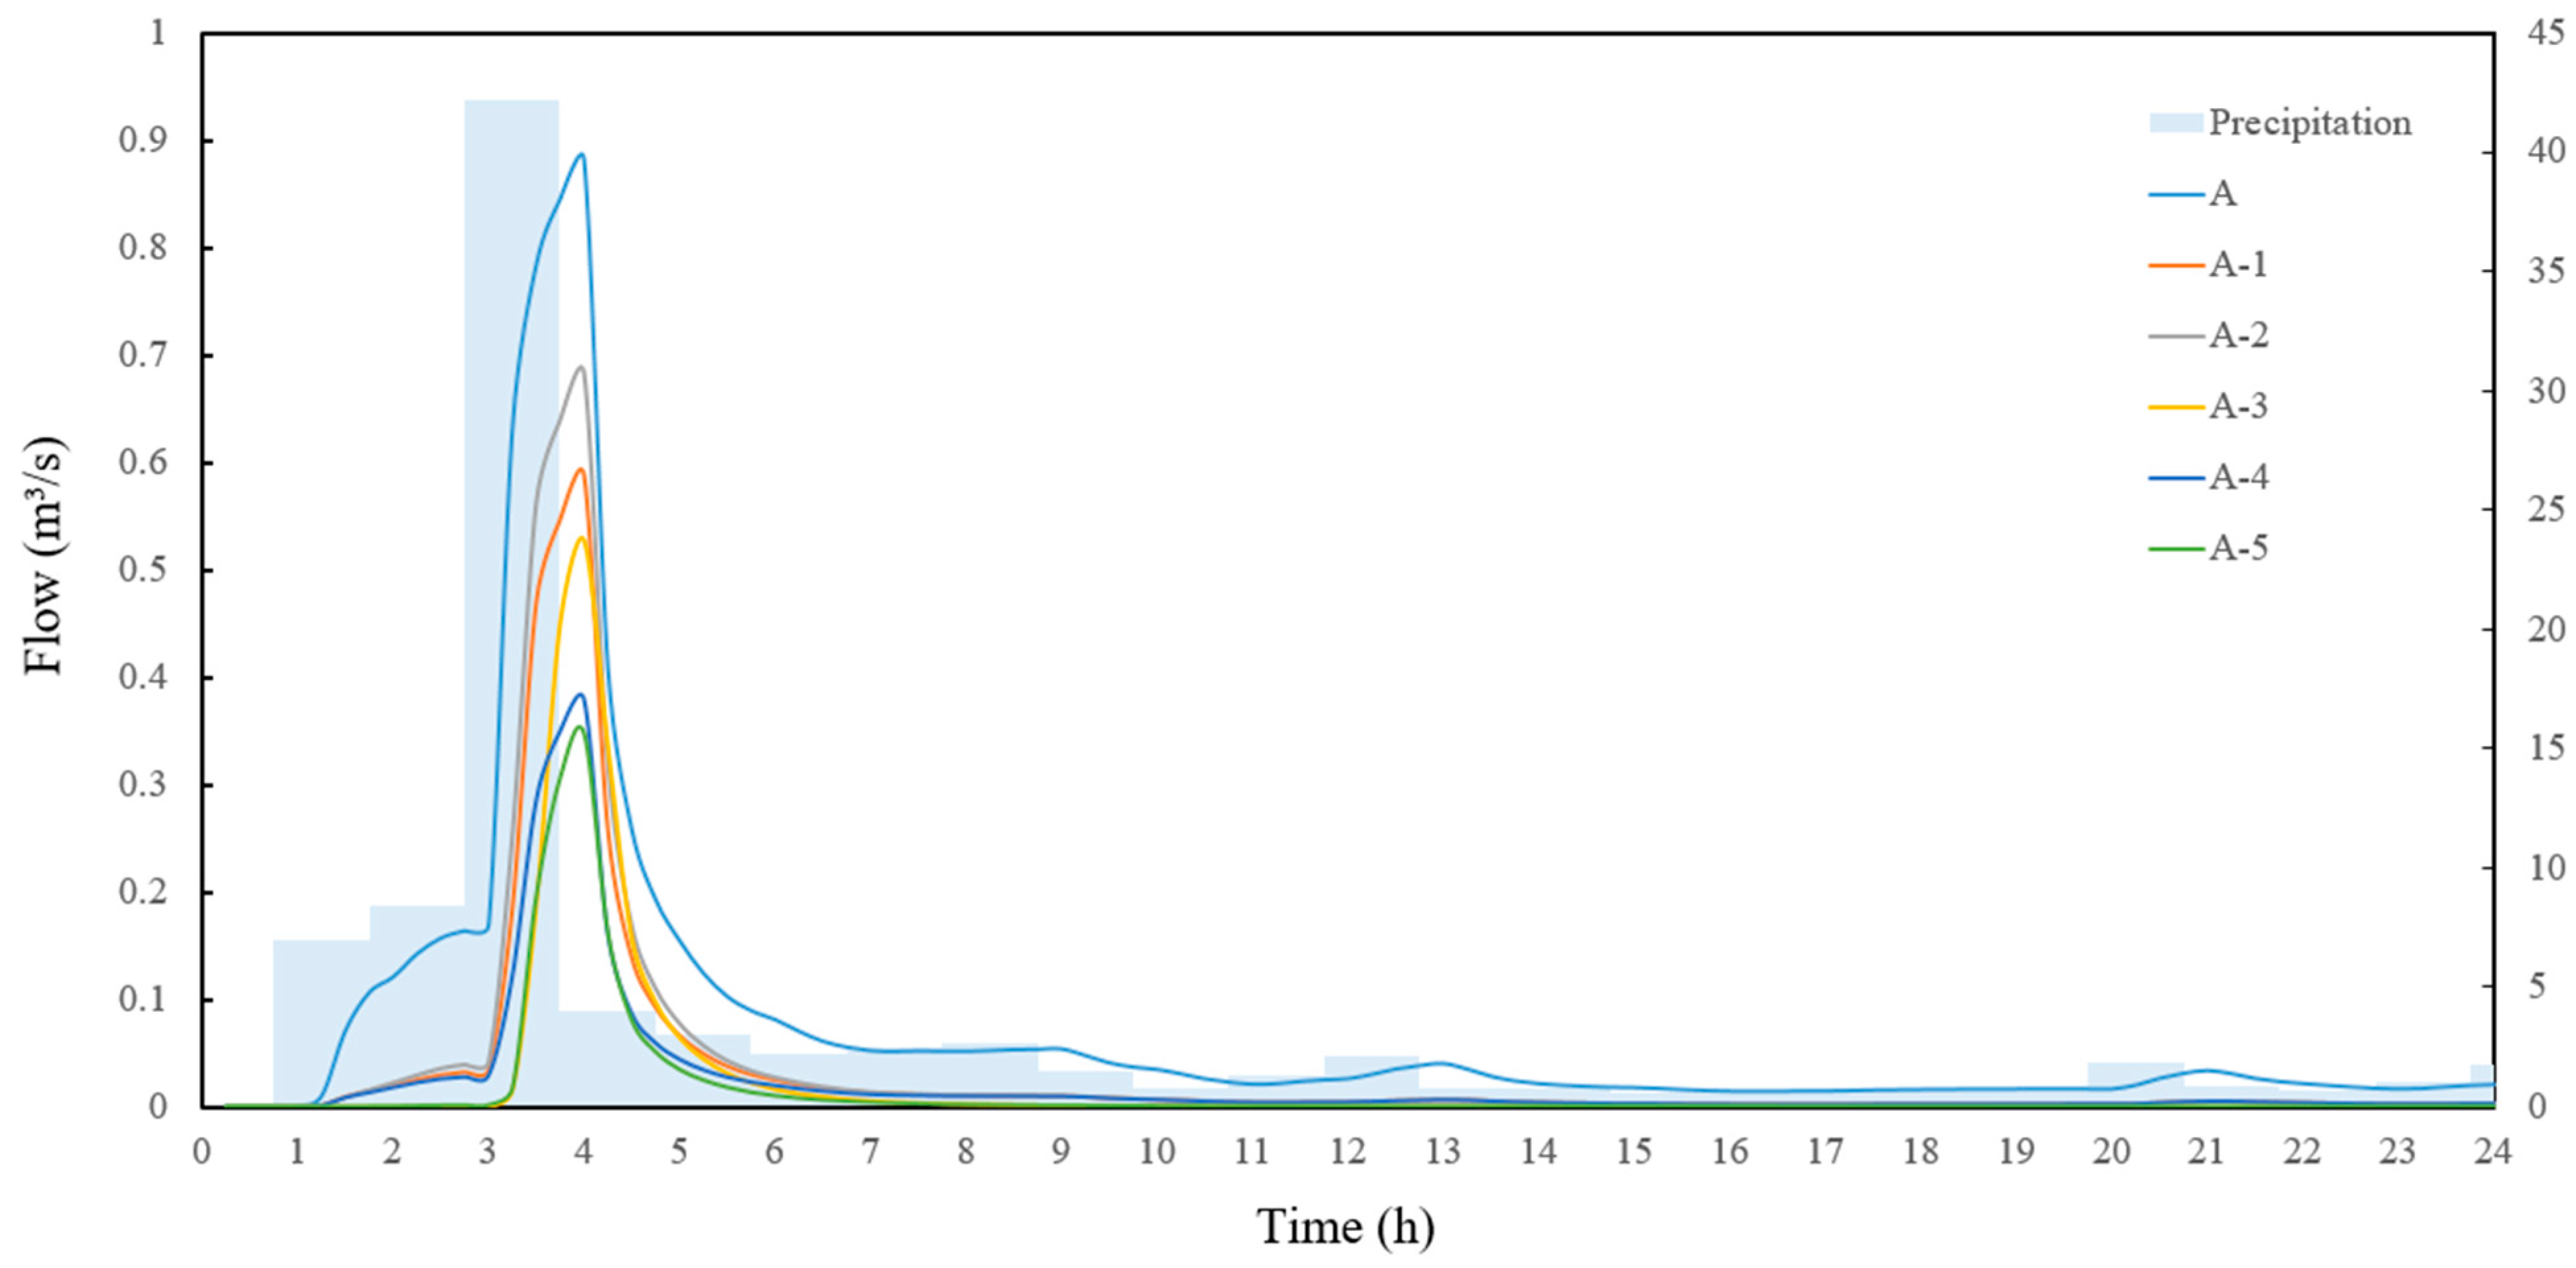
3.3. Impact of Green Space System Layout on Hydrological Process in Axial Mode URAs
4. Discussion
4.1. Impact of the Spatial Layout of Green Space on the Rainfall-Runoff Process
4.2. Optimization Strategies
4.2.1. Stormwater Management System in URAs
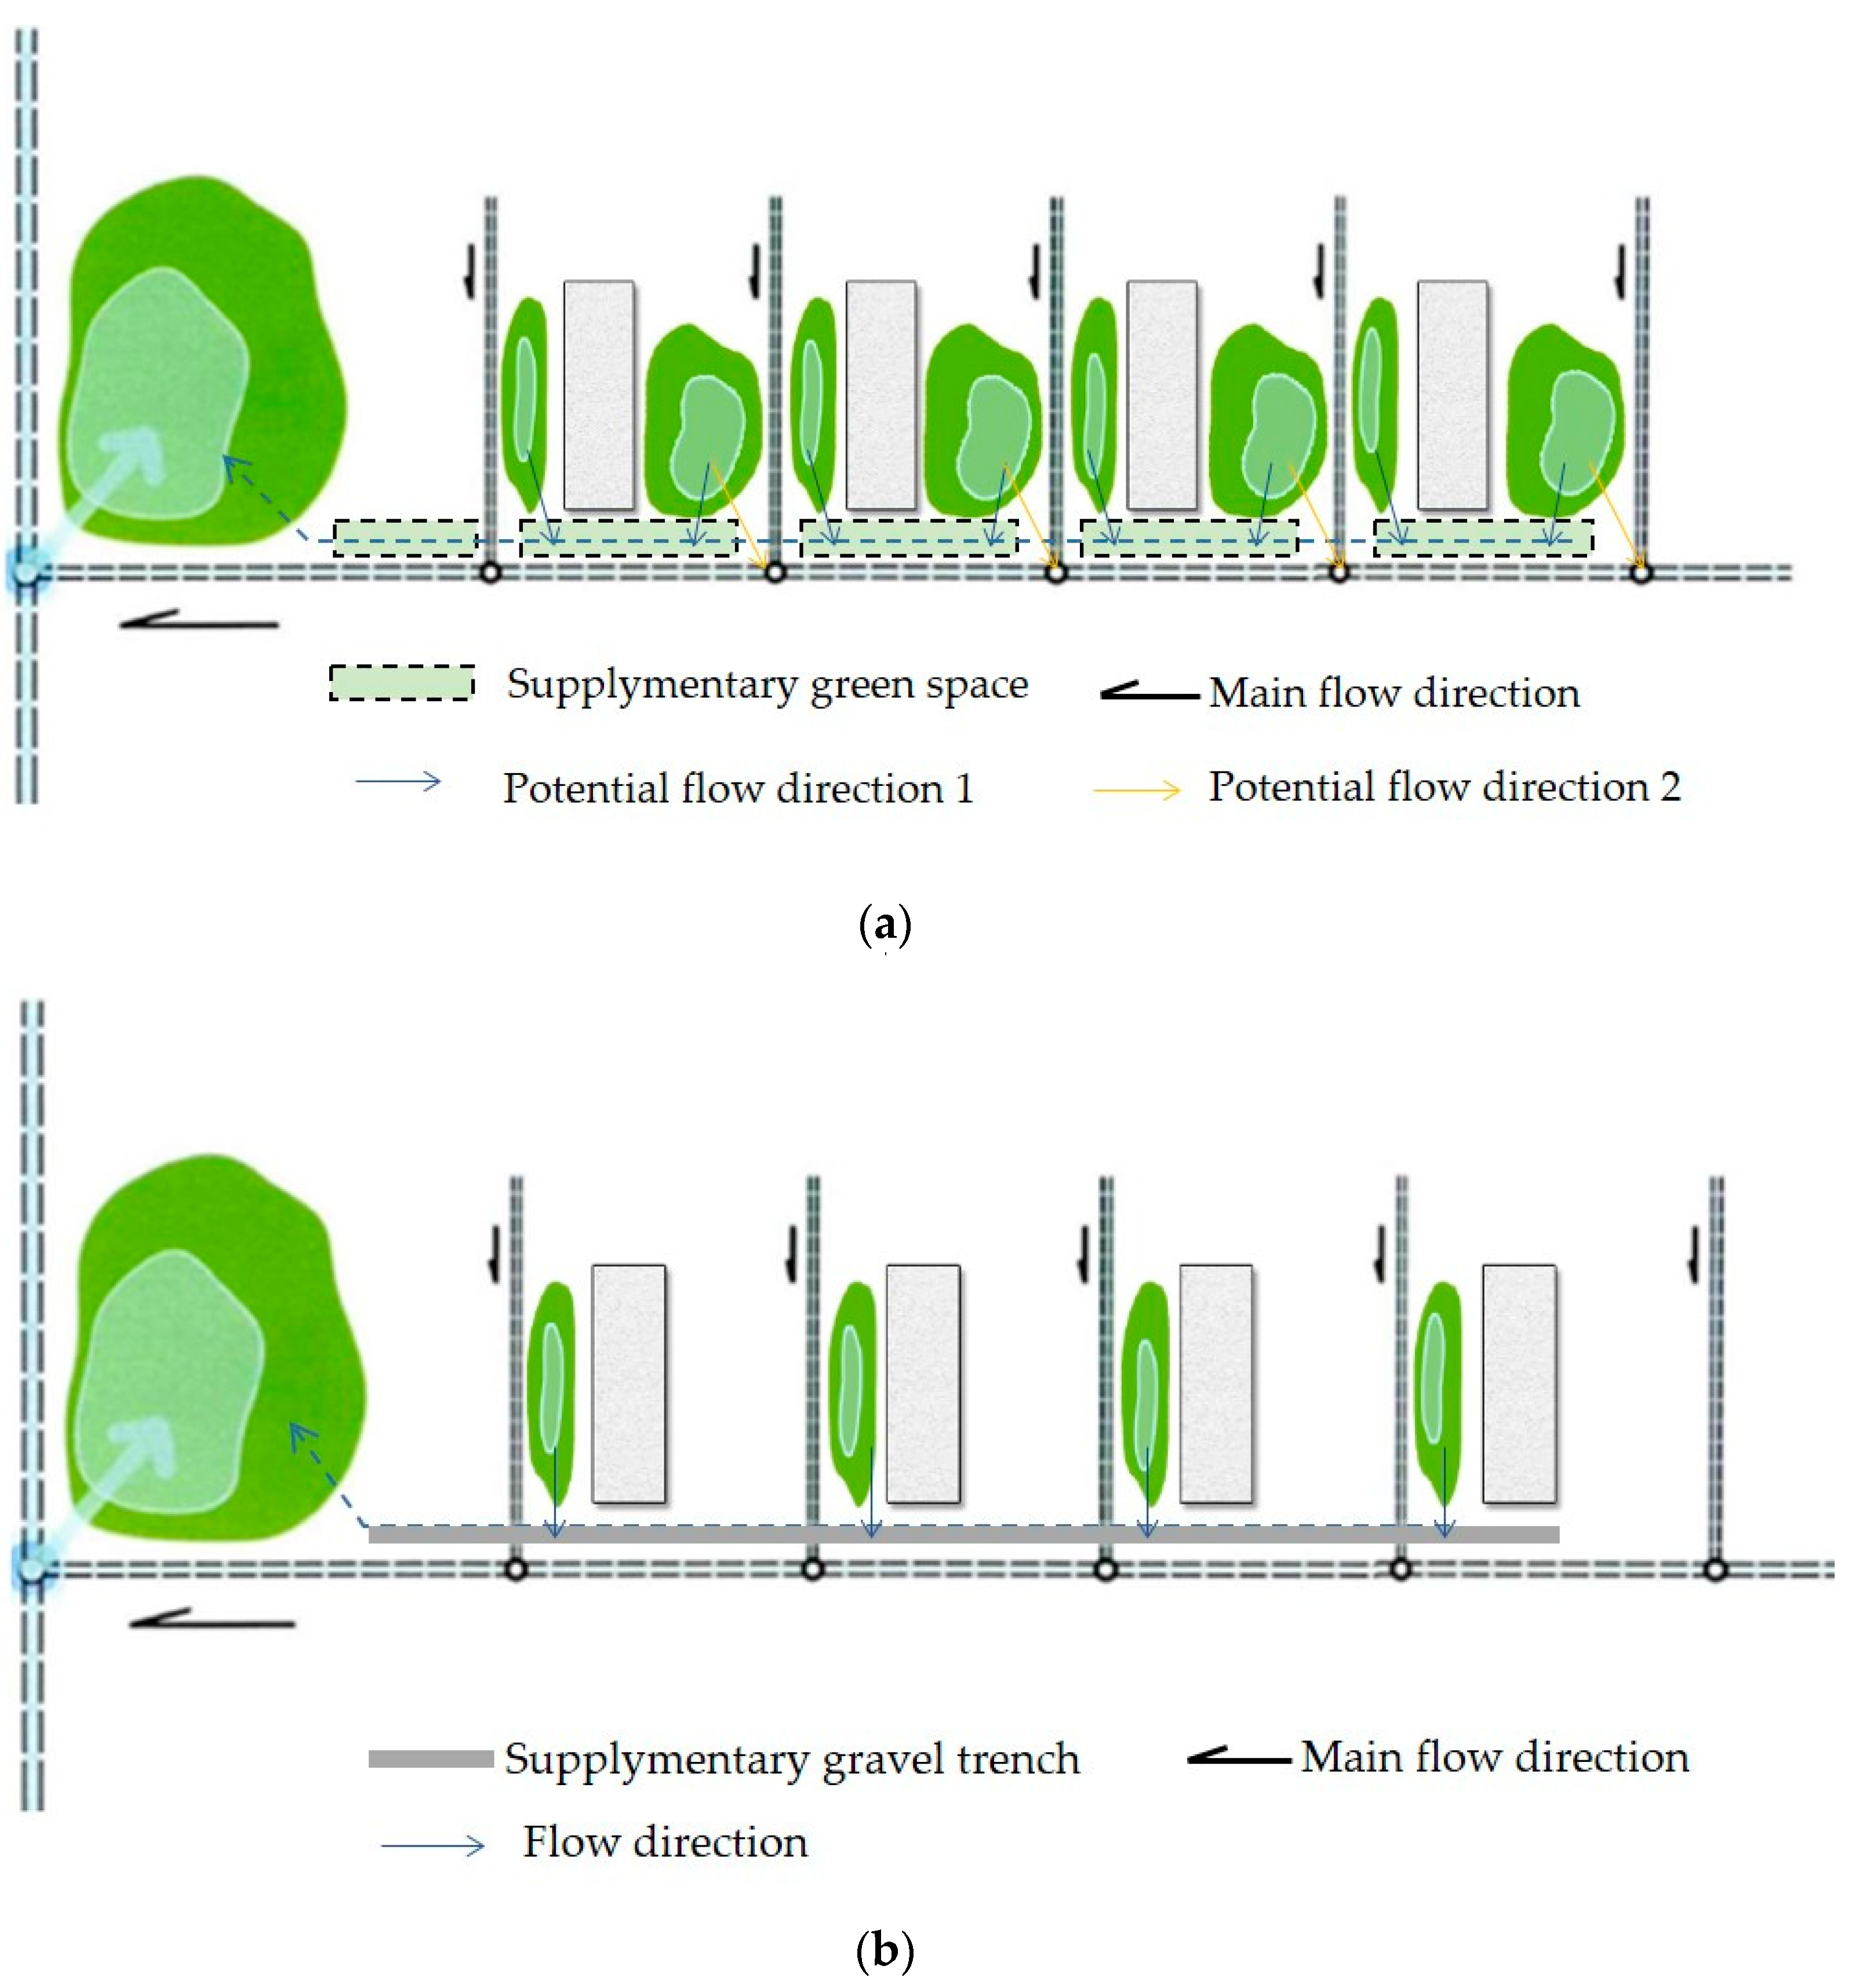
4.2.2. Reorganizing the Runoff Route and Redesigning the Green Space Layout
4.3. Uncertainty and Limitations
5. Conclusions
Author Contributions
Funding
Institutional Review Board Statement
Informed Consent Statement
Data Availability Statement
Acknowledgments
Conflicts of Interest
References
- Qin, H.-P.; Li, Z.-X.; Fu, G. The effects of low impact development on urban flooding under different rainfall characteristics. J. Environ. Manag. 2013, 129, 577–585. [Google Scholar] [CrossRef]
- Miller, J.D.; Hutchins, M. The impacts of urbanisation and climate change on urban flooding and urban water quality: A review of the evidence concerning the United Kingdom. J. Hydrol. Reg. Stud. 2017, 12, 345–362. [Google Scholar] [CrossRef]
- Xu, C.; Rahman, M.; Haase, D.; Wu, Y.; Su, M.; Pauleit, S. Surface runoff in urban areas: The role of residential cover and urban growth form. J. Clean. Prod. 2020, 262, 121421. [Google Scholar] [CrossRef]
- Bonebrake, T.C.; Mastrandrea, M.D. Tolerance adaptation and precipitation changes complicate latitudinal patterns of climate change impacts. Proc. Natl. Acad. Sci. USA 2010, 107, 12581–12586. [Google Scholar] [CrossRef]
- Hood, M.J.; Clausen, J.C.; Warner, G.S. Comparison of Stormwater lag times for low impact and traditional residential development 1. JAWRA J. Am. Water Resour. Assoc. 2007, 43, 1036–1046. [Google Scholar] [CrossRef]
- He, J.; Valeo, C.; Chu, A.; Neumann, N.F. Characteristics of suspended solids, microorganisms, and chemical water quality in event-based stormwater runoff from an urban residential area. Water Environ. Res. 2010, 82, 2333–2345. [Google Scholar] [CrossRef] [PubMed]
- Fletcher, T.D.; Shuster, W.; Hunt, W.F.; Ashley, R.; Butler, D.; Arthur, S.; Trowsdale, S.; Barraud, S.; Semadeni-Davies, A.; Bertrand-Krajewski, J.-L.; et al. SUDS, LID, BMPs, WSUD and more–The evolution and application of terminology surrounding urban drainage. Urb. Water J. 2014, 12, 525–542. [Google Scholar] [CrossRef]
- General Office of the State Council (GOSC). Guideline to Promote Building Sponge Cities. Available online: http://www.gov.cn/zhengce/content/2015-10/16/content_10228.htm (accessed on 16 October 2015).
- Li, H.; Ding, L.; Ren, M.; Li, C.; Wang, H. Sponge City Construction in China: A Survey of the Challenges and Opportunities. Water 2017, 9, 594. [Google Scholar] [CrossRef]
- Sadeghi, K.M.; Kharaghani, S.; Tam, W.; Gaerlan, N.; Loáiciga, H. Avalon green alley network: Low impact development (LID) demonstration project in Los Angeles, California. In Proceedings of the World Environmental and Water Resources Congress, West Palm Beach, FL, USA, 22–26 May 2016. [Google Scholar]
- Wang, M.; Zhang, D.; Wang, Z.; Zhou, S.; Tan, S.K. Long-term performance of bioretention systems in storm runoff management under climate change and life-cycle condition. Sustain. Cities Soc. 2021, 65, 102598. [Google Scholar] [CrossRef]
- Jingming, H.; Donglai, L.; Xiaojun, W.; Kaihua, G.; Yu, T.; Yue, M. Effects of initial conditions of LID measures on runoff control at residential community scale. Adv. Water Sci. 2019, 30, 45–55. [Google Scholar]
- Shan, J.; Huang, Z.; Chen, S.; Li, Y.; Ji, W.; Lv, Z. Green Space Planning and Landscape Sustainable Design in Smart Cities considering Public Green Space Demands of Different Formats. Complexity 2021, 2021, 5086636. [Google Scholar] [CrossRef]
- Zhang, B.; Li, N.; Wang, S. Effect of urban green space changes on the role of rainwater runoff reduction in Beijing, China. Landsc. Urb. Plan. 2015, 140, 8–16. [Google Scholar] [CrossRef]
- Eaton, T.T. Approach and case-study of green infrastructure screening analysis for urban stormwater control. J. Environ. Manag. 2018, 209, 495–504. [Google Scholar] [CrossRef] [PubMed]
- Astebol, S.O.; Hvitved-Jacobsen, T.; Simonsen, O. Sustainable stormwater management at Fornebu--from an airport to an industrial and residential area of the city of Oslo, Norway. Sci. Total Environ. 2004, 334–335, 239–249. [Google Scholar] [CrossRef]
- Wang, M.; Zhang, Y.; Zhang, D.; Li, S.; Tan, S.K. Life-cycle cost analysis and resilience consideration for coupled grey infrastructure and low-impact development practices. Sustain. Cities Soc. 2021, 75, 103358. [Google Scholar] [CrossRef]
- Wang, M.; Zhang, Y.; Bakhshipour, A.E.; Liu, M.; Rao, Q.; Lu, Z. Designing coupled LID–GREI urban drainage systems: Resilience assessment and decision-making framework. Sci. Total Environ. 2022, 834, 155267. [Google Scholar] [CrossRef]
- Yao, Y.; Li, J.; Li, N.; Jiang, C. Optimizing the layout of coupled grey-green stormwater infrastructure with multi-objective oriented decision making. J. Clean. Prod. 2022, 367, 133061. [Google Scholar] [CrossRef]
- Seo, M.; Jaber, F.; Srinivasan, R.; Jeong, J. Evaluating the Impact of Low Impact Development (LID) Practices on Water Quantity and Quality under Different Development Designs Using SWAT. Water 2017, 9, 193. [Google Scholar] [CrossRef]
- Berland, A.; Shiflett, S.A.; Shuster, W.D.; Garmestani, A.S.; Goddard, H.C.; Herrmann, D.L.; Hopton, M.E. The role of trees in urban stormwater management. Landsc. Urb. Plan. 2017, 162, 167–177. [Google Scholar] [CrossRef]
- Hoover, F.-A.; Hopton, M.E. Developing a framework for stormwater management: Leveraging ancillary benefits from urban greenspace. Urb. Ecosyst. 2019, 22, 1139–1148. [Google Scholar] [CrossRef]
- Burian, S.J.; Nix, S.J.; Durrans, S.R.; Pitt, R.E.; Fan, C.-Y.; Field, R. Historical development of wet-weather flow management. J. Water Resour. Plan. Manag. 1999, 125, 3–13. [Google Scholar] [CrossRef]
- Alberti, M.; Marzluff, J.M. Ecological resilience in urban ecosystems: Linking urban patterns to human and ecological functions. Urb. Ecosyst. 2004, 7, 241–265. [Google Scholar] [CrossRef]
- Alberti, M.; Booth, D.; Hill, K.; Coburn, B.; Avolio, C.; Coe, S.; Spirandelli, D. The impact of urban patterns on aquatic ecosystems: An empirical analysis in Puget lowland sub-basins. Landsc. Urb. Plan. 2007, 80, 345–361. [Google Scholar] [CrossRef]
- Yan, J.; Zhou, W.; Zheng, Z.; Wang, J.; Tian, Y. Characterizing variations of greenspace landscapes in relation to neighborhood characteristics in urban residential area of Beijing, China. Landsc. Ecol. 2020, 35, 203–222. [Google Scholar] [CrossRef]
- Wang, Y.; Peng, Z.; Chen, Q. The choice of residential layout in urban China: A comparison of transportation and land use in Changsha (China) and Leeds (UK). Habitat Int. 2018, 75, 50–58. [Google Scholar] [CrossRef]
- Zhou, D.; Li, Z.; Wang, S.; Tian, Y.; Zhang, Y.; Jiang, G. How does the newly urban residential built-up density differ across Chinese cities under rapid urban expansion? Evidence from residential FAR and statistical data from 2007 to 2016. Land Use Policy 2021, 104, 105365. [Google Scholar] [CrossRef]
- Xia, J.; Zhang, Y.; Xiong, L.; He, S.; Wang, L.; Yu, Z. Opportunities and challenges of the Sponge City construction related to urban water issues in China. Sci. China Earth Sci. 2017, 60, 652–658. [Google Scholar] [CrossRef]
- Liao, Z.; Zhang, G.; Wu, Z.; He, Y.; Chen, H. Combined sewer overflow control with LID based on SWMM: An example in Shanghai, China. Water Sci. Technol. 2015, 71, 1136–1142. [Google Scholar] [CrossRef]
- Yang, B.; Lee, D. Urban Green Space Arrangement for an Optimal Landscape Planning Strategy for Runoff Reduction. Land 2021, 10, 897. [Google Scholar] [CrossRef]
- Gao, J.; Li, J.; Li, Y.; Xia, J.; Lv, P. A distribution optimization method of typical LID facilities for sponge city construction. Ecohydrol. Hydrobiol. 2021, 21, 13–22. [Google Scholar] [CrossRef]
- Liu, W.; Chen, W.; Peng, C. Assessing the effectiveness of green infrastructures on urban flooding reduction: A community scale study. Ecol. Model. 2014, 291, 6–14. [Google Scholar] [CrossRef]
- Maragno, D.; Gaglio, M.; Robbi, M.; Appiotti, F.; Fano, E.A.; Gissi, E. Fine-scale analysis of urban flooding reduction from green infrastructure: An ecosystem services approach for the management of water flows. Ecol. Model. 2018, 386, 1–10. [Google Scholar] [CrossRef]
- Jiajin, Z. Residential Area Planning and Design, 2nd ed.; China Architecture & Building Press: Beijing, China, 2009; pp. 56–57. [Google Scholar]
- Tianjin Municipal Commission of Urban and Rural Development. Technical Guideline for the Construction of Tianjin Sponge City; Tianjin Housing and Urban-Rural Construction Commission: Tianjin, China, 2016; pp. 5–10. [Google Scholar]
- Kong, F.; Nakagoshi, N. Spatial-temporal gradient analysis of urban green spaces in Jinan, China. Landsc. Urb. Plan. 2006, 78, 147–164. [Google Scholar] [CrossRef]
- Li, H.; Chen, W.; He, W. Planning of green space ecological network in urban areas: An example of Nanchang, China. Int. J. Environ. Res. Public Health 2015, 12, 12889–12904. [Google Scholar] [CrossRef]
- Kang, J.-E.; Choi, H.-S.; Hwang, H.-S.; Lee, S. Analysis of ecological network according to invalidation of decision on urban parks: Focused on Busan. J. Environ. Impact Assess. 2018, 27, 618–634. [Google Scholar]
- Liang, H.; Chen, D.; Zhang, Q. Assessing Urban Green Space distribution in a compact megacity by landscape metrics. J. Eng. Landsc. Manag. 2017, 25, 64–74. [Google Scholar] [CrossRef]
- McGarigal, K. FRAGSTATS: Spatial Pattern Analysis Program. for Quantifying Landscape Structure; US Department of Agriculture, Forest Service, Pacific Northwest Research Station: Portland, OR, USA, 1995; Volume 351.
- Rossman, L.A.; Dickinson, R.E.; Schade, T.; Chan, C.C.; Burgess, E.; Sullivan, D.; Lai, F.-H. SWMM 5-the next generation of EPA’s storm water management model. J. Water Manag. Model. 2004, 22, 339–358. [Google Scholar] [CrossRef]


| Number | Ratio of Green Space (PLAND) | (PSSD) | Connectivity (γ) | MPS (m2) | Patch Density (PD) |
|---|---|---|---|---|---|
| ① | 13.50% | 0.09 | 0.17 | 870 | 189.15 |
| ② | 14.90% | 0.09 | 0.20 | 1177 | 182.58 |
| ③ * | 17.98% | 0.03 | 0.10 | 393 | 466.08 |
| ④ | 24.44% | 0.08 | 0.36 | 924 | 264.40 |
| ⑤ | 17.63% | 0.05 | 0.13 | 362 | 386.64 |
| ⑥ | 29.51% | 0.02 | 0.50 | 242 | 1157.72 |
| ⑦ | 31.40% | 0.08 | 0.39 | 874 | 342.78 |
| ⑧ | 39.60% | 0.16 | 0.33 | 1768 | 377.68 |
| ⑨ | 28.55% | 0.10 | 0.38 | 875 | 362.35 |
| ⑩ * | 35.57% | 0.02 | 0.36 | 202 | 1485.97 |
| ⑪ | 38.31% | 0.12 | 0.36 | 1106 | 322.99 |
| ⑫ | 31.86% | 0.05 | 0.28 | 578 | 549.05 |
| ⑬ | 29.70% | 0.14 | 0.39 | 790 | 413.45 |
| ⑭ * | 31.77% | 0.13 | 0.30 | 881 | 446.31 |
| ⑮ | 38% | 0.26 | 0.56 | 1184 | 236.84 |
| ⑯ * | 39.10% | 0.19 | 0.52 | 1305 | 403.86 |
| Index | Typical Value |
|---|---|
| PLAND | 30% |
| PSSD | 0.01–0.1; 0.1–0.2; 0.01–0.2 |
| Connectivity | 3.5–7 m |
| MPS | 800–1200 m2 |
| PD | 300–500 patches/km2 |
| Mode | Scenario Code | Ratio of Green Space (PLAND) % | Standard Deviation of Green Space Patch Size (PSSD) m2 | Dispersion of Green Space (γ) 0–1 | Mean Patch Size (MPS) m2 | Density of Green Space (PD) Number/km2 |
|---|---|---|---|---|---|---|
| Block Mode | B | 25.00% | 0.0772 | 0.4 | 930 | 264.4 |
| B-1 | 25.00% | 0.0772 | 0.4 | 930 | 264.4 | |
| B-2 | 25.00% | 0.1800 | 0.4 | 930 | 264.4 | |
| B-3 | 25.00% | 0.0772 | 0.8 | 930 | 264.4 | |
| B-4 | 35.00% | 0.0772 | 0.4 | 1331 | 264.4 | |
| B-5 | 35.00% | 0.0772 | 0.4 | 930 | 377.7 | |
| Enclosed Mode | E | 32.00% | 0.0485 | 0.28 | 1126 | 284.5 |
| E-1 | 32.00% | 0.0485 | 0.28 | 1126 | 284.5 | |
| E-2 | 32.00% | 0.1637 | 0.28 | 1126 | 284.5 | |
| E-3 | 32.00% | 0.0485 | 0.66 | 1126 | 284.5 | |
| E-4 | 42.00% | 0.0485 | 0.28 | 1406 | 284.5 | |
| E-5 | 42.00% | 0.0485 | 0.28 | 1126 | 385.0 | |
| Axial Mode | A | 32.00% | 0.1257 | 0.29 | 869 | 354.4 |
| A-1 | 32.00% | 0.1257 | 0.29 | 869 | 354.4 | |
| A-2 | 32.00% | 0.2000 | 0.29 | 869 | 354.4 | |
| A-3 | 32.00% | 0.1257 | 0.75 | 869 | 354.4 | |
| A-4 | 42.00% | 0.1257 | 0.29 | 1141 | 354.4 | |
| A-5 | 42.00% | 0.1257 | 0.29 | 869 | 484.0 |
| Indicators | B | B-1 | B-2 | B-3 | B-4 | B-5 |
|---|---|---|---|---|---|---|
| Runoff generation time (h) | 1.25 | 1.25 | 1.25 | 1.5 | 1.25 | 3 |
| Peak flow (CMS) | 0.4066 | 0.3016 | 0.3151 | 0.2929 | 0.2076 | 0.2249 |
| Time of peak flow (h) | 3.5 | 3.5 | 3.5 | 4 | 3.75 | 3.75 |
| Runoff volume (m3) | 3090 | 1560 | 1402 | 850 | 798 | 697 |
| Peak control rate | - | 25.82% | 22.50% | 32.66% | 48.94% | 44.69% |
| Total runoff control rate | - | 49.51% | 54.63% | 72.49% | 74.17% | 77.44% |
| Runoff generation time delay | - | 0 | 0 | 0.25 | 0 | 1.75 |
| Peak duration delay | - | 0 | 0 | 0.5 | 0.25 | 0.25 |
| Infiltration rate | 95.82 | 214.82 | 227.18 | 269.69 | 207.83 | 203.44 |
| Indicators | E | E-1 | E-2 | E-3 | E-4 | E-5 |
|---|---|---|---|---|---|---|
| Runoff generation time (h) | 1.25 | 1.25 | 1.25 | 3.25 | 1.25 | 2 |
| Peak flow (CMS) | 0.3996 | 0.314 | 0.3319 | 0.282 | 0.2453 | 0.235 |
| Time of peak flow (h) | 3 | 3 | 3 | 3.25 | 3 | 3.25 |
| Runoff volume (m3) | 2770 | 1260 | 1320 | 839 | 1030 | 723 |
| Peak control rate | - | 21.42% | 16.94% | 29.43% | 38.61% | 41.19% |
| Total runoff control rate | - | 54.51% | 52.35% | 69.71% | 62.82% | 73.90% |
| Runoff generation time delay | - | 0 | 0 | 2 | 0 | 0.75 |
| Peak duration delay | - | 0 | 0 | 0 | 0 | 0.25 |
| Infiltration rate | 131.6 | 211 | 205 | 234 | 179 | 191.62 |
| Indicators | B | B-1 | B-2 | B-3 | B-4 | B-5 |
|---|---|---|---|---|---|---|
| Runoff generation time (h) | 1.25 | 1.25 | 1.25 | 1.5 | 1.25 | 3 |
| Peak flow (CMS) | 0.4066 | 0.3016 | 0.3151 | 0.2929 | 0.2076 | 0.2249 |
| Time of peak flow (h) | 3.5 | 3.5 | 3.5 | 4 | 3.75 | 3.75 |
| Runoff volume (m3) | 3090 | 1560 | 1402 | 850 | 798 | 697 |
| Peak control rate | - | 33.30% | 22.59% | 40.12% | 57.00% | 60.61% |
| Total runoff control rate | - | 59.23% | 52.32% | 73.79% | 71.34% | 82.95% |
| Runoff generation time delay | - | 0 | 0 | 2.0 | 0 | 1.75 |
| Peak duration delay | - | 0 | 0 | 0 | 0 | 0 |
| Infiltration rate | 120.78 | 214.88 | 204 | 238.57 | 177.69 | 191.65 |
Publisher’s Note: MDPI stays neutral with regard to jurisdictional claims in published maps and institutional affiliations. |
© 2022 by the authors. Licensee MDPI, Basel, Switzerland. This article is an open access article distributed under the terms and conditions of the Creative Commons Attribution (CC BY) license (https://creativecommons.org/licenses/by/4.0/).
Share and Cite
Han, Y.; Yang, D.; Zhang, Y.; Cao, L. Optimizing Urban Green Space Layouts for Stormwater Runoff Treatment in Residential Areas: A Case Study in Tianjin, China. Water 2022, 14, 2719. https://doi.org/10.3390/w14172719
Han Y, Yang D, Zhang Y, Cao L. Optimizing Urban Green Space Layouts for Stormwater Runoff Treatment in Residential Areas: A Case Study in Tianjin, China. Water. 2022; 14(17):2719. https://doi.org/10.3390/w14172719
Chicago/Turabian StyleHan, Yiqun, Dongdong Yang, Yueming Zhang, and Lei Cao. 2022. "Optimizing Urban Green Space Layouts for Stormwater Runoff Treatment in Residential Areas: A Case Study in Tianjin, China" Water 14, no. 17: 2719. https://doi.org/10.3390/w14172719
APA StyleHan, Y., Yang, D., Zhang, Y., & Cao, L. (2022). Optimizing Urban Green Space Layouts for Stormwater Runoff Treatment in Residential Areas: A Case Study in Tianjin, China. Water, 14(17), 2719. https://doi.org/10.3390/w14172719