Article

A Novel Method to Identify Radial Drainage Based on Morphological Features

1
Key Laboratory of Virtual Geographic Environment, Nanjing Normal University, Ministry of Education, Nanjing 210023, China
2
Jiangsu Center for Collaborative Innovation in Geographical Information Resource Development and Application, Nanjing 210023, China
3
State Key Laboratory Cultivation Base of Geographical Environment Evolution (Jiangsu Province), Nanjing 210023, China
*
Author to whom correspondence should be addressed.
Water 2022, 14(18), 2820; https://doi.org/10.3390/w14182820
Submission received: 24 July 2022 / Revised: 3 September 2022 / Accepted: 7 September 2022 / Published: 10 September 2022

Abstract

:
The automatic detection and accurate characterization of drainage patterns are of primary importance for interpreting the regional geologic origin and the features of the regional geological structure. However, there are few studies regarding the identification of cross-basin drainage patterns. In addition, the automatic level of the current approaches needs to be further improved. As a typical type of cross-basin drainage pattern, radial drainage (RD) has unique spatial morphological features: diverging from the center to the surrounding area, developing in adjacent sections of multiple basins, and having a number of source nodes that is not smaller than the number of its outlet nodes. Based on these morphological features, this study aims to develop a novel method for automatic identification of RD using a feature-matching algorithm. The experiment in Mount Lu demonstrates that the proposed method was efficient in RD identification. In this study area, the RDs were identified, and there were no false or missed judgments, which was verified through experts. The proposed method not only helps to detect cross-basin drainage patterns, RD, and centripetal drainage but also has a unique advantage in identifying geographical scenes with complex spatial structures.

1. Introduction

The classification of drainage patterns can quickly interpret the diversity of topographical features and geological structures in a particular area [1,2,3]. The common drainage patterns mainly include dendritic, parallel, trellis, radial, centripetal, and annular patterns [1,4,5]. Different drainage patterns have different morphological characteristics [6]. The dendritic drainage pattern generally develops in an area with relatively uniform lithology and flat terrain [1,4,7], and the stream junction angles in this pattern are usually less than 90° [8]. The parallel drainage pattern, distributed in parallel folds or fault areas, is mainly controlled by tectonics and the trend of mountains. The orientation of streams in this pattern concentrates in one direction [1,2,9]. The radial drainage (RD) pattern developed on dome structures or volcanic cones, flows outward from the center [4,10], while the centripetal drainage pattern developed in basins or tectonic subsidence areas flows inward to the center. The accurate detection and characterization of drainage patterns can be used for interpreting regional geologic origins and the features of regional geological structures, which are of primary importance for water resource exploration and development, major engineering projects, and geological disaster prevention [11,12]. In recent years, some progress has been achieved in the semi-automated or automated recognition of drainage patterns. Alfonso and Niemann developed a method to classify drainage networks based on their deviations from self-similarity [13]. Vimal derived drainage patterns by studying morphometric parameters (such as stream order, stream length, drainage density, elongation ratio, etc.) of single basins from the river networks [14]. Zhang classified drainage patterns using different geometric indicators, such as the junction angles of streams and the shape of catchments [15,16]. Using junction angles and secondary tributary lengths, Jung recognized different drainage patterns from basins [17]. Using scaling invariance measures, Jung aimed to determine whether pinnate networks occur in arid and semi-arid regions [18].
These studies have laid a foundation for identifying drainage patterns in a single basin. However, there are few studies regarding the identification of cross-basin drainage patterns [15]. In addition, the automatic level of the methods mentioned above needs further improvement. Therefore, given the current research status, the objective of this study is to develop a novel approach for the automatic identification of RD, a typical type of cross-basin drainage pattern.
RD, which develops in the adjacent parts of the multiple basins, always diverges from the center to the surrounding area, and the number of its source nodes is not smaller than the number of its outlet nodes. Based on these morphological features, an automatic recognition method for RD using a feature-matching algorithm is proposed in this paper. This paper is organized as follows: Section 2 shows the study area, data used, and the methodology, Section 3 presents the experimental results, Section 4 presents the discussion, and Section 5 gives the conclusions and future work.

2. Materials and Methods

2.1. Study Area

Mount Lu, between the coordinates 115°50′~116°10′ E and 29°28′~29°45′ N, is located in the northern Jiangxi province of south-eastern China. The region develops rich drainage patterns due to the occasional tectonic activities and long-term river erosion [19,20,21]. For example, many dendritic drainages develop in the north of the Qinglian Temple and the Baihe gully; the Sandiequan area has the characteristics of trellis drainages; the Yangtianping region develops RD [22]. Therefore, selecting Mount Lu for the automatic identification of RD is reasonable. The Landform and Drainage of Mount Lu are shown in Figure 1.

2.2. Experiment Data

The 5 m resolution DEM in Mount Lu was employed, and the data reflect the detailed topographical features [23,24,25]. The geographic coordinate system of the DEM is GCS_Beijing_1954, and the projected coordinate system is CGCS2000_3_Degree_GK_CM_117E. Based on stream directions and the appropriate threshold of the flow accumulation (with the continuous decrease of flow accumulation, the flow accumulation when the river density tends to be stable can be selected as the threshold) [26,27,28], the multiple river layers with different river density and basin layers were extracted from the DEM, respectively [29,30]. Furthermore, the rivers were classified into various levels in accordance with the Strahler stream order [31,32,33]. The extracted layers of basins and rivers are shown in Figure 1, and the flow chart of basin and river extraction based on ArcGIS is shown in Figure 2 [34].
For a river network, there are three types of nodes: the source node is the origin of a river; an outlet node is a place in which rivers are remitted, and there is only one outlet in a river network; and the junction node is an intersection point where any two rivers converge into one river. All types of nodes are illustrated in Figure 3.

2.3. Methods

The proposed method mainly involves the following steps: (1) generating the identification units via the basin intersections and extracting the drainage data of identification units, (2) extracting morphological features of drainage in identification units, (3) identifying RD via a feature-matching algorithm, and (4) determining the scope of RD. Figure 4 shows a flow diagram illustrating the method.

2.3.1. Morphological Features of RD

RD is a cross-basin drainage pattern that flows outward from the center at the intersection of multiple basins. Mount Wuzhi on Hainan Island, Mount Lu in Jiangxi province, and Mount Huang in Anhui province are typical areas with RD [35]. RD mainly includes the following characteristics (Figure 5):
  • It develops in the adjacent parts of multiple basins. RD is a pattern that uniformly diverges from the center to the surrounding area (Figure 5), so the shape of identification units can be abstracted into a circle. In most cases, the river networks of a region are always divided into multiple basins, and RD often exists where the multiple basins intersect. Therefore, the basins’ intersections could be the RD pattern’s central points.
  • Its rivers always uniformly diverge from the center to the surrounding area, so the shape of identification units can be abstracted into a circle. The distribution characteristics of rivers in all directions can be acquired by calculating the flow directions and accumulative lengths in the identification units.
  • The number of the source nodes is not less than the outlet nodes, and the average distance from all the source nodes to the center point is less than that between all the outlet nodes and the center point.

2.3.2. Generation of Identification Units

Firstly, extracting the basin intersections as the centers of identification units. The extraction process of basin intersections is shown in Figure 6. The specific steps are:
  • Constructing a Delaunay triangulated irregular network (D-TIN) using the centroid points of the basins [36,37];
  • Generating external rectangles of the three adjacent basins by reading one triangle in the D-TIN;
  • Obtaining the intersecting area of the three external rectangles;
  • Taking the point belonging to three adjacent basins as the basin intersection and putting it into the set I n t e r P o i n t s = { i p i | i = 0 , 1 , 2 , , m } ;
  • Repeating steps (2)–(4) until all the triangles are formed.
In this paper, obtaining basin intersections using D-TIN and external rectangles greatly reduces the time and space complexity and improves the computational efficiency.
Secondly, the identification units of the RD pattern can be confirmed using the basin intersections and calculating the radii of the circle buffers.
Generally, for any basin intersection, searching the intersection with the shortest distance and taking half of the distance can give the initial radius of an identification unit. However, these initial radii may be too large or too small, which could affect the recognition results of RD. Therefore, the initial radii need to be optimized in accordance with Formula (2). The extraction process of the identification units is shown in Figure 7.
In summary, the extraction of the identification units is divided into the following steps:
  • Reading the D-TINs constructed above, calculating the length of all TIN edges, and then putting them into the array Ldis[i][k], i ∈ [0, m−1], k ∈ [0, n−1], where m is the number of D-TINs, and n is the number of the edges of a TIN, n ∈ [0, 3);
  • Searching the minimum TIN edge distance that does not equal zero in each TIN and saving half of it to the array R[i];
  • Calculating the average distance ad in accordance with Formula (1):
    a d = 1 m 1 i = 0 m 1 R i ,   M i n R i M a x
    where Min and Max are the minimum and maximum threshold of the buffer radius set by the user, respectively;
  • In accordance with Formula (1), calculating the optimized radius array R’[m]:
    R i = R i ,                             M i n R i M a x a d ,             R i < Min   o r   R i > M a x
Considering the adjacency relation between different units is more complicated, the radii of the identification units extracted via this method are suitable, and the algorithm is also efficient.
Thirdly, the pre-treatment of the rivers is carried out to reduce the influence of irrelevant rivers to extract the characteristics of the rivers more accurately. It is mainly divided into two processes: clipping the rivers and eliminating the non-radial river segments.
The first step is taking the recognition units as the clipping range, taking the rivers in the entire study area as the clipping elements, and then generating the river elements in the recognition units (Figure 8).
The second step is deleting the river segments whose order is greater than two to prevent interference from the external geological environment when high-level rivers converge. The elimination of non-radial river segments ensures each river segment has a particular radial direction outward from the center or inward to the center in each identification unit. The specific processes are:
  • Deleting the river segments whose stream order is greater than 2;
  • In each identification unit, calculating the distance between the last point (or the first point) of each river segment and the center of the unit (the distance is marked as dl (or df)). If Formula (3) is satisfied, then the stream is a radial river segment. Conversely, the stream is a non-radial river segment.
d l d f > k 1 × l e n
Among them, len is the length of the stream, k1 is the deviation coefficient of a river segment, k1 ∈ [0.5, 1], df (or dl) is the distance between the first point (or the last point) of a river and the center of the unit.

2.3.3. Extraction of Drainage Features

The first point is extracting the river directions and accumulative lengths. In a particular region, the characteristic distribution of drainage can be reflected in the flow directions and accumulative lengths of rivers. However, the flow directions cannot be calculated easily because of the winding rivers. Thus, this paper proposes a method of estimating flow directions: the first and last points connection method [2], the minimum bounding rectangle method [38], and the interval division method [39]. The characteristics of these methods are shown in Table 1. Considering the advantages and disadvantages of these algorithms, this paper uses the first method to calculate the flow directions.
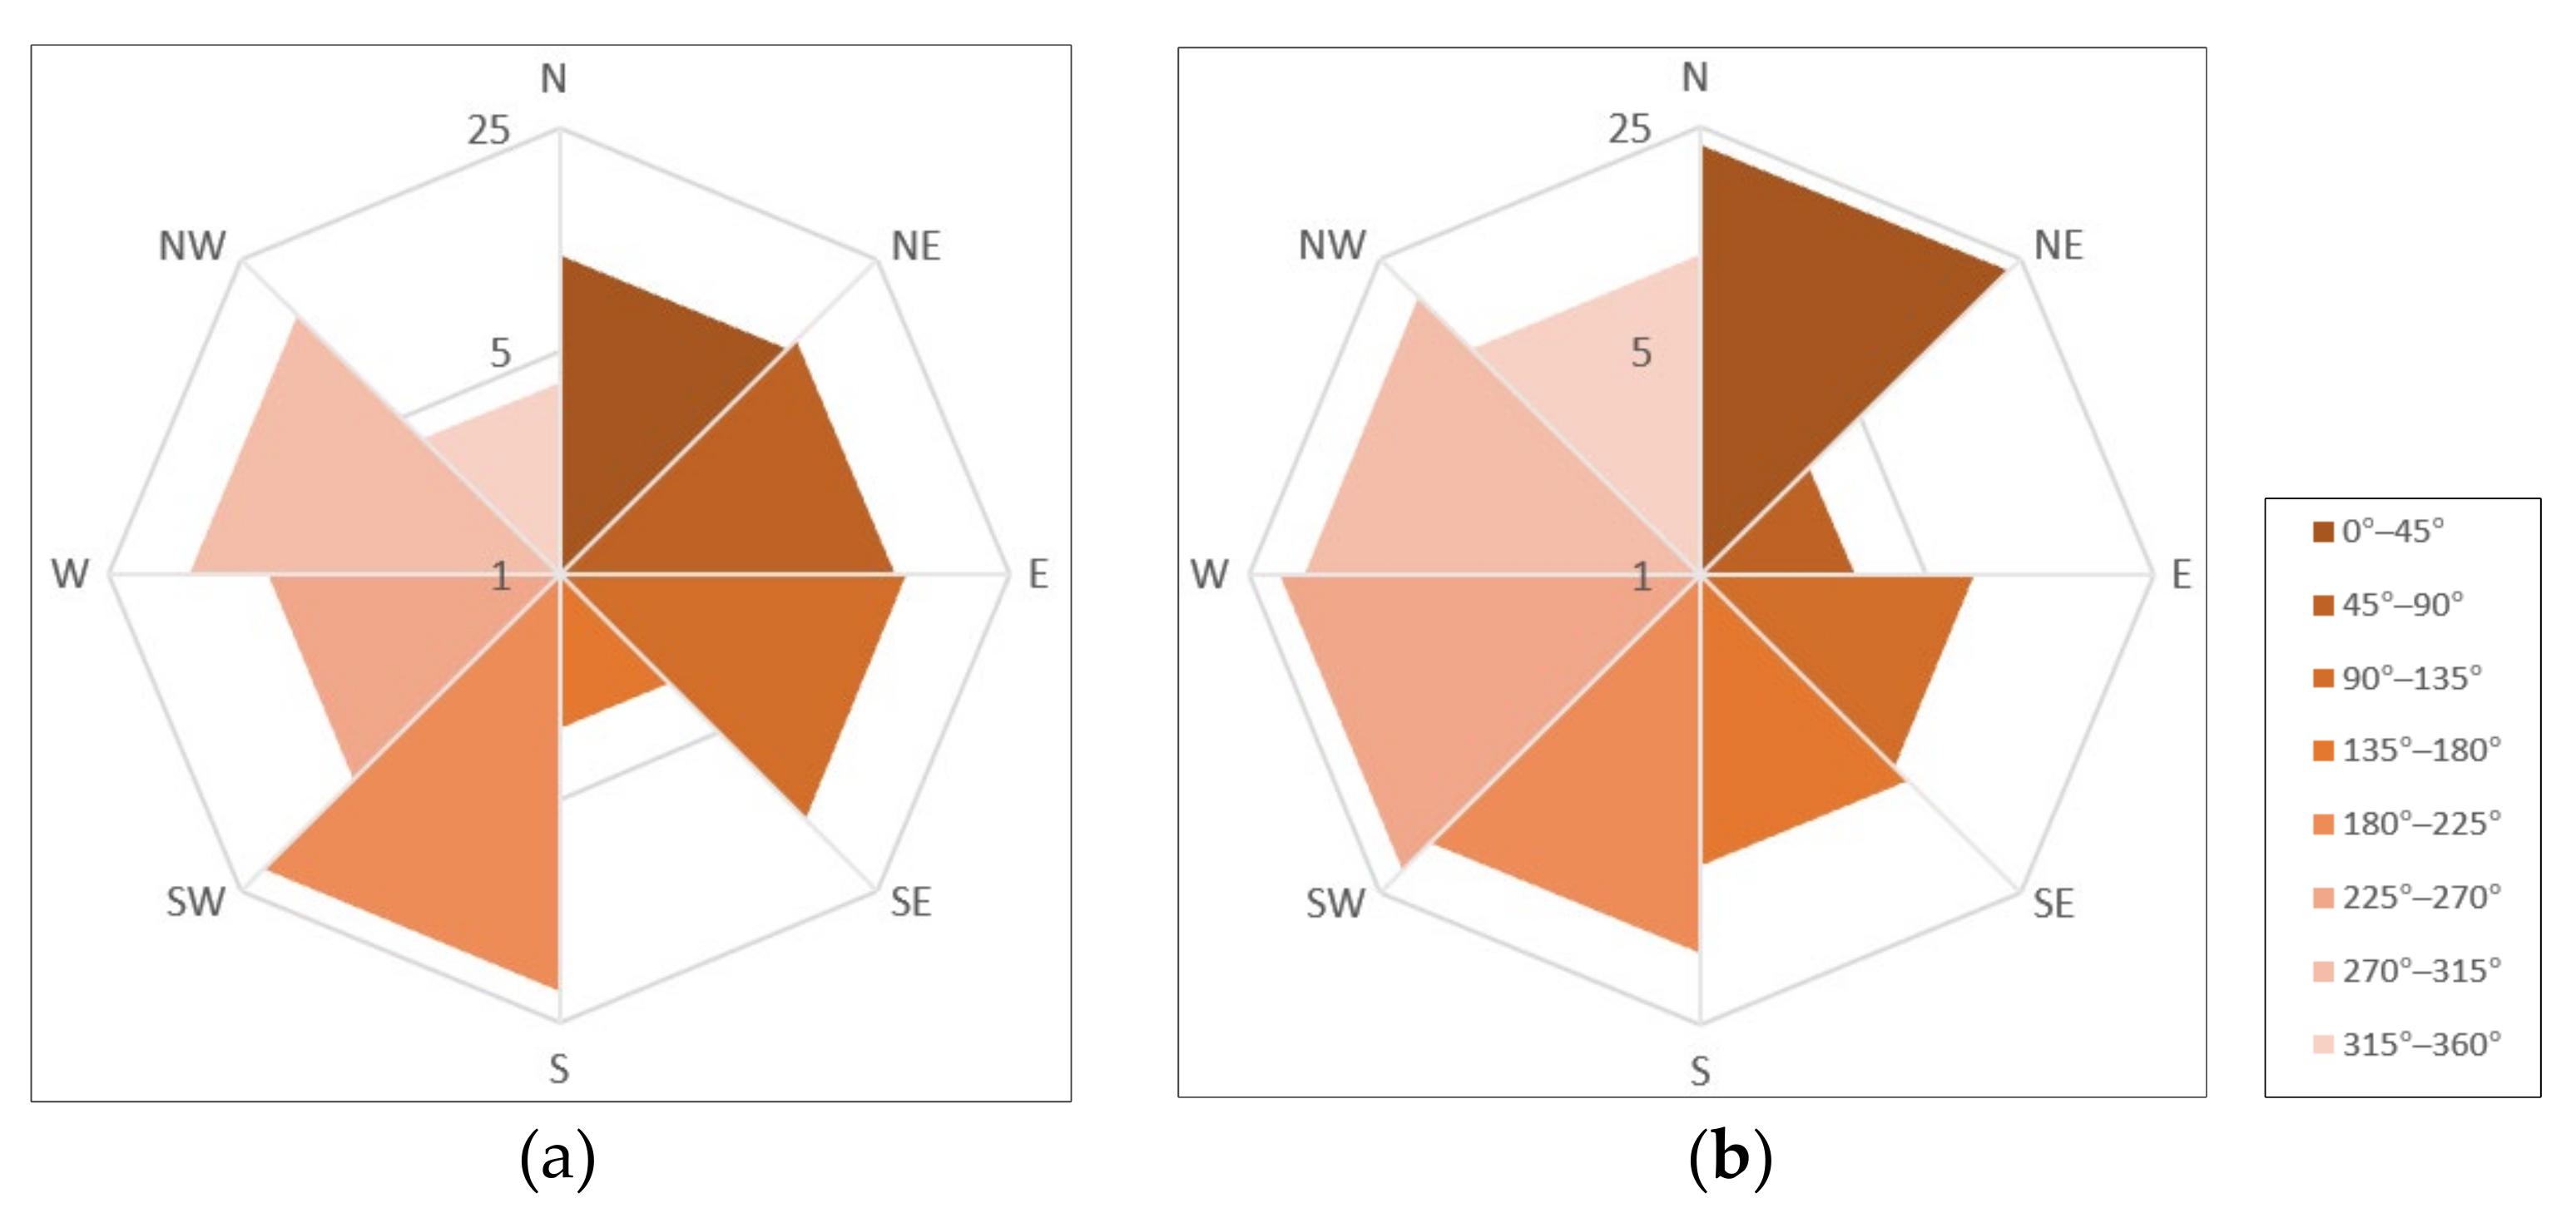
To better express the flow directions of the RD, the paper uses rose charts to show the flow frequency and accumulative length of the river segments [40,41]. The rose chart is divided into eight basic azimuths (N, NE, E, SE, S, SW, W, NW) in accordance with the rule that the RD flows in all directions in this paper. If the frequency of flow directions and accumulative lengths of rivers exist in each azimuth, one of the characteristics of RD is satisfied. The frequency of the flow direction of the radial and the non-radial drainage by the rose charts is shown, respectively, in Figure 9. The feature of accumulative length is similar to the flow direction and is not illustrated here.
The specific steps are as follows:
  • Calculating the angle range according to Formula (4):
    t = 360°/N
    where N is the number of flow directions for a rose chart. Generally, N is an integer and a multiple of 8;
  • Calculating the flow frequency and accumulative length in each interval and saving them to the array dir[N] and len[N], respectively.
The second step is extracting the feature of source and outlet nodes. Another key to identifying RD is the quantity of source and outlet nodes and the distance of the corresponding basin intersections. The distinction rules are that the total number of river source nodes is greater than that of outlet nodes, and the average distance between the center point and all source nodes is shorter than that between the center point and all outlet nodes.
To extract those nodes in each identification unit, the specific steps are as follows:
  • Obtaining the first and last point of each river segment;
  • Obtaining the points whose in-degree is 0 and putting them into SnodeList. Similarly, obtaining the points whose out-degree is 0 and putting them into OnodeList;
  • Marking the number of elements in SnodeList and OnodeList as Scount and Ocount, respectively;
  • Calculating the average distance from all the points in SnodeList (or OnodeList) to the center point and marked as Sd (or Od).

2.3.4. Recognition of Drainage Patterns

Based on the drainage features extracted in Section 2.3.3, RD can be recognized using a feature matching algorithm. Only if these features are satisfied in an identification unit at the same time can the rivers in this unit be identified as RD. The decision tree based on feature matching is shown in Figure 10.
Judgment criterion:
If (dir[i] > 2) and (len[i] > 100 m) and (ScountOcount) and (Sd << Od), then an RD pattern can be recognized.
The conditions of dir[i] > 2 and len[i] > 100 m are both used to eliminate the influence of some accidental factors.

2.3.5. Determination of Drainage Scope

The identification units obtained according to Section 2.3.2 are used for the identifications of RD. Thus, if the drainage pattern of an identification unit is recognized as RD, it is necessary to determine the scope of the drainage further. The specific scope of the drainage needs to find the points where the elevation changes steeply (PS). The connection of these PSs is the RD scope. As shown in Figure 11a, the letters A–L are the extracted points. Figure 11b is the profile along the radius OP according to Figure 11a, and point B is the PS.
The specific steps are as follows:
  • Generating N auxiliary radii uniformly in each identification unit (N is a positive integer) and discretizing these radii into the points;
  • Obtaining the elevations of the points with DEM;
  • Among the points of an auxiliary radius, searching for the point with the lowest elevation, and finding all the other points that have approximate elevation with the minimum point, then taking the closest point to the center point from the minimum point and all the other points as the feature point, finally adding the feature point to the set SP;
  • Repeating steps (3) until all the auxiliary radii are finished;
  • Connecting all points in SP orderly as the scope line of RD.

3. Results

The algorithm of this paper is implemented using ArcGIS Engine 10.2 and compiled using the Microsoft Visual C# 2013 compiler. The experiments were conducted using a computer configuring a 3.19 GHz Inter (R) Core (TM) i7-8700 CPU, 32.0 GB RAM. The operating system is Windows 10 Professional.

3.1. Identification Results of RD

The river network in Mount Lu is divided into 19 basins, and 16 basin intersections are extracted. Then, referring to 2.3.2, the 16 optimized identification units are generated. Based on method 2.3.3, the drainage features extracted from different identification units are shown in Table 2.
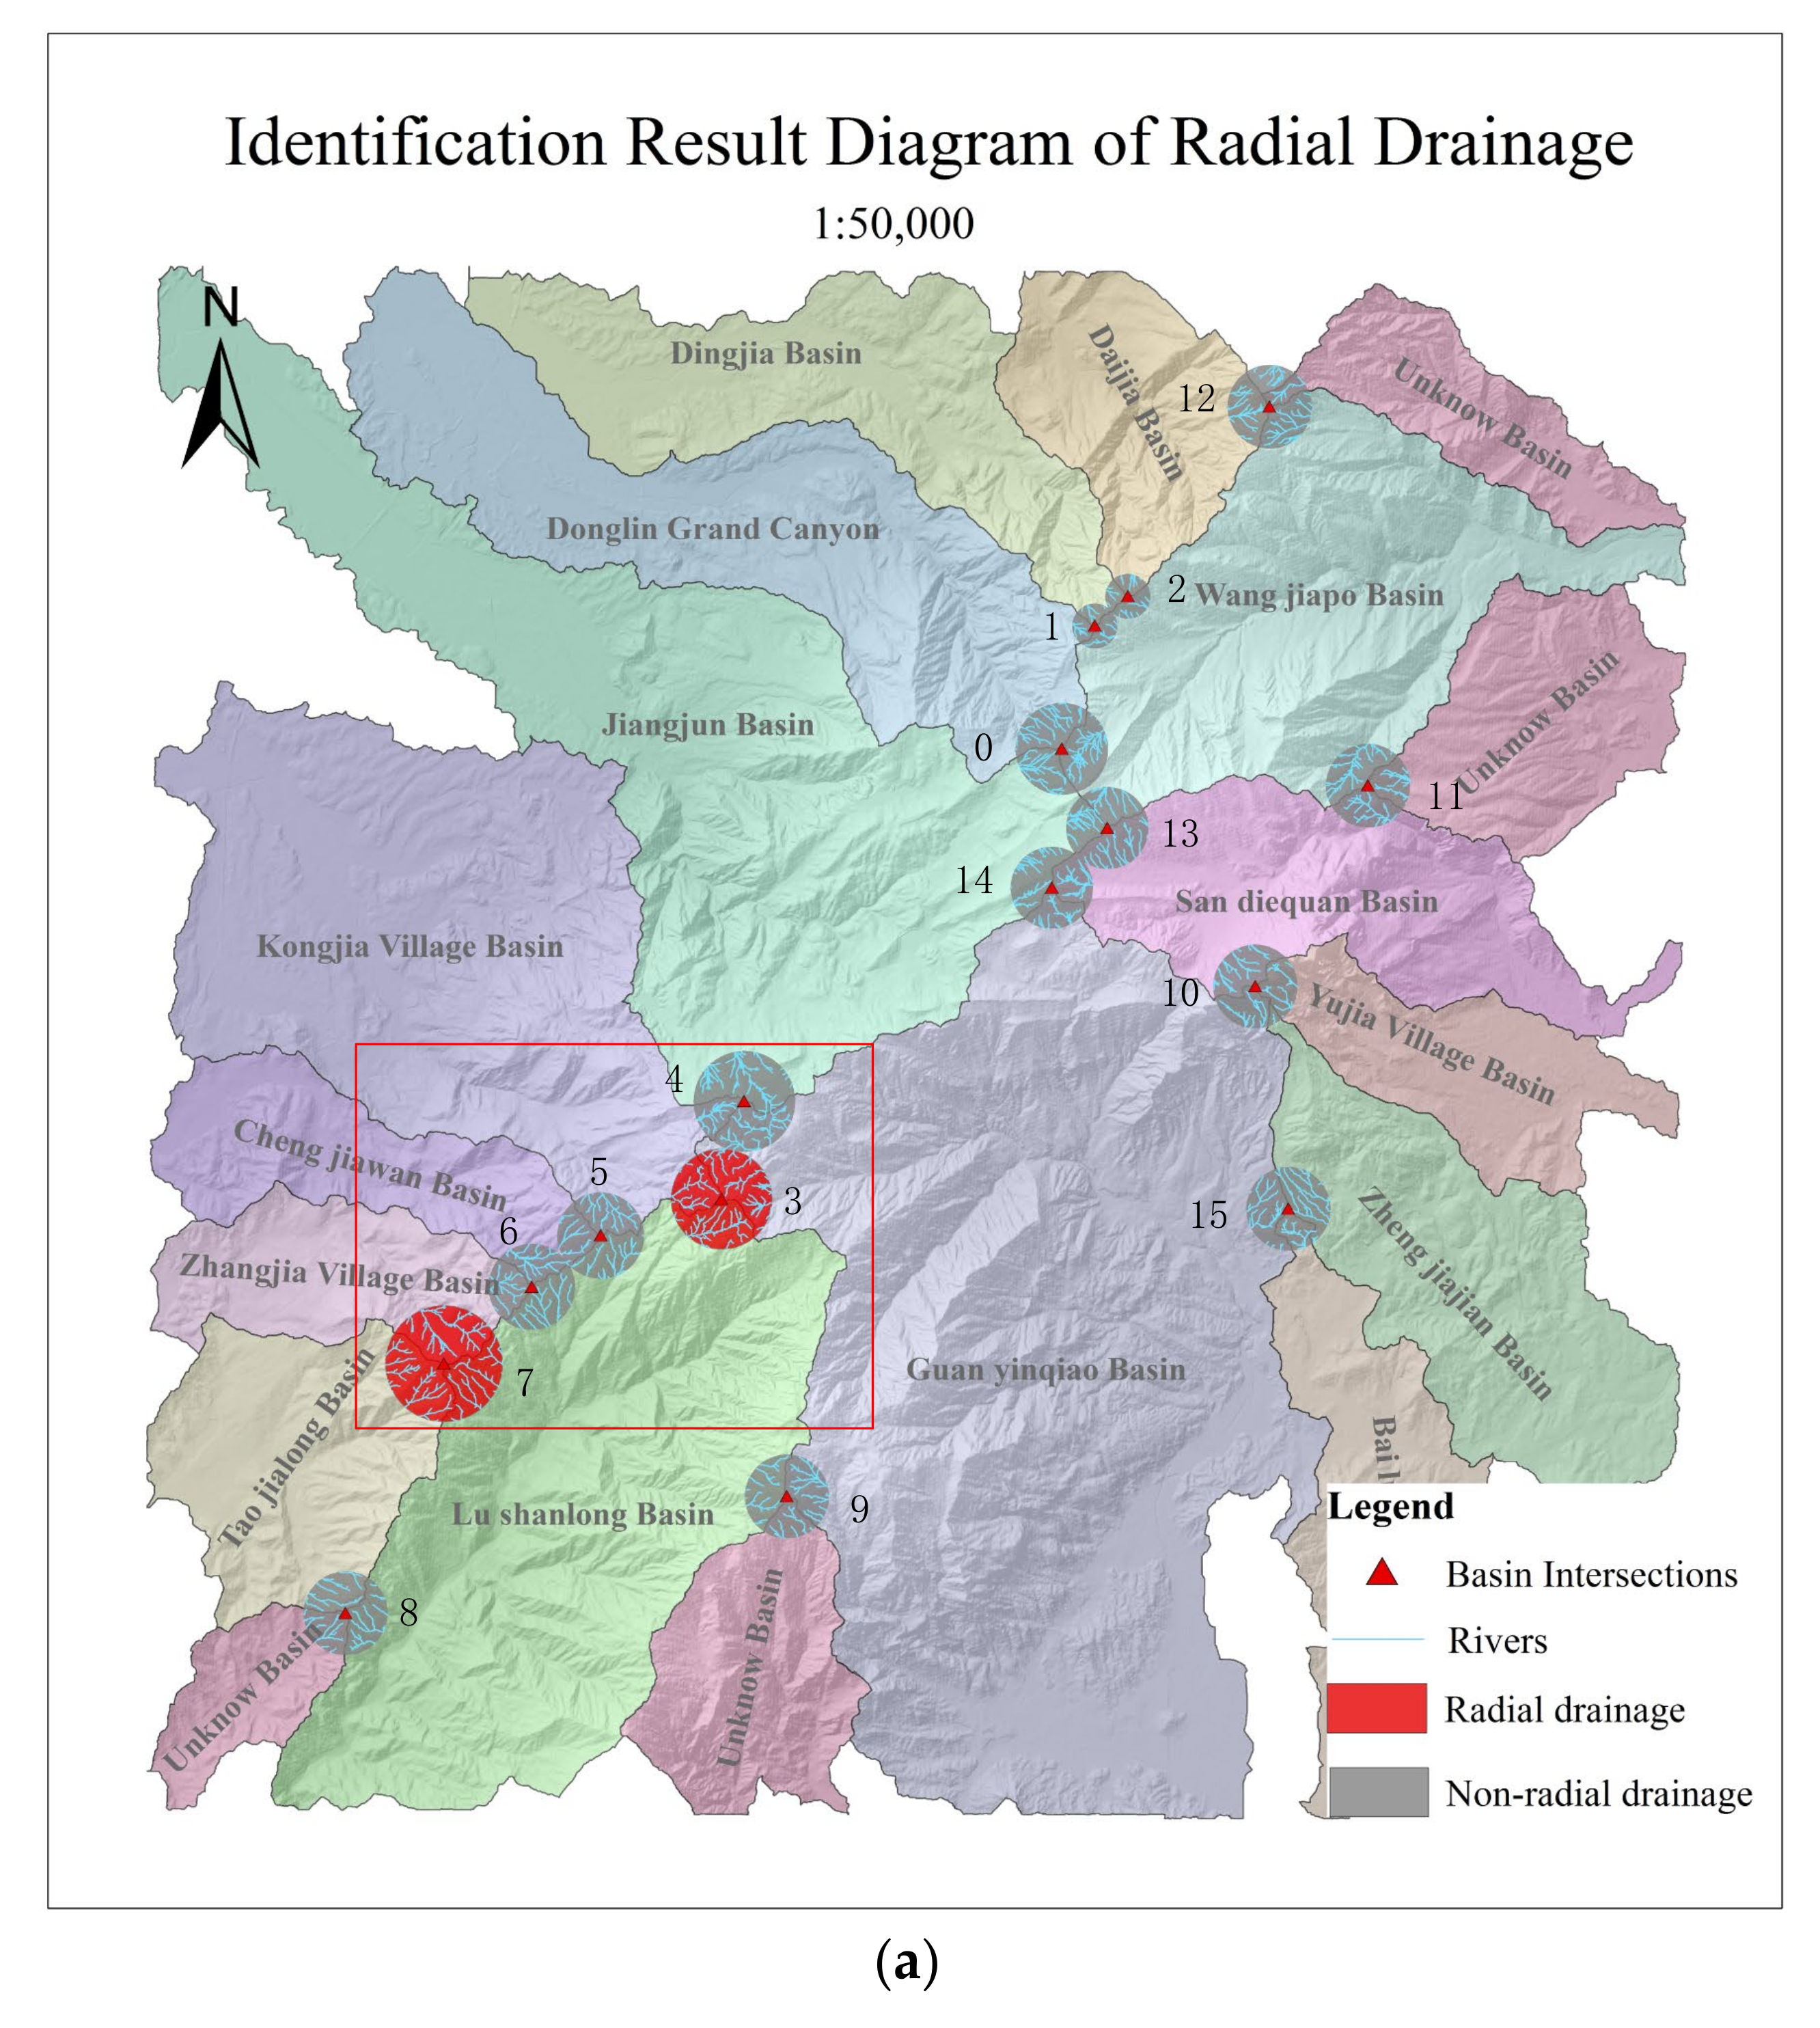
According to the judgment criterion in Table 2, the two units, whose ID = 3 and ID = 7, are identified as RD, while the drainage in other units is non-radial drainage. The identification result of the whole of Mount Lu is shown in Figure 12a, and Figure 12b is a partial magnification of Figure 12a.

3.2. Result of RD Scope

For the units identified as RD (ID = 3, ID = 7), Figure 13a,c show the PSs, respectively. The scopes of drainage by connecting PSs are shown in Figure 13b,d, respectively. By superimposing the ranges of RD with the rivers, it can be found that the scopes have effectively excluded the regions covered by the non-radial drainage in the identification units.

4. Discussion

4.1. Validation of Identification Results

To better show the characteristics of flow direction and accumulative length of the RD, the units identified as RD (ID = 3, ID = 7) were selected for typical analysis. The frequency of flow direction and accumulative length in each unit is represented by rose charts (Figure 14). According to Figure 14, the flow direction frequency is greater than zero, and the accumulative length is greater than 100 m in each azimuth interval. Therefore, the drainage in the two units satisfies the characteristics of diverging to the surrounding area.
To verify the reliability of the identification results, this paper superimposes the drainage and terrain information in all the identification units and performs visual interpretation by experts. It can be seen that rivers with the areas (ID = 3 and ID = 7) meet the characteristics of radial drainage. Therefore, the expert judgment result is consistent with the experimental result. Moreover, the accuracy of automatic identification is 100%, the FAR = 0, and the MAR = 0.

4.2. Several Aspects That Affect the Recognition Results

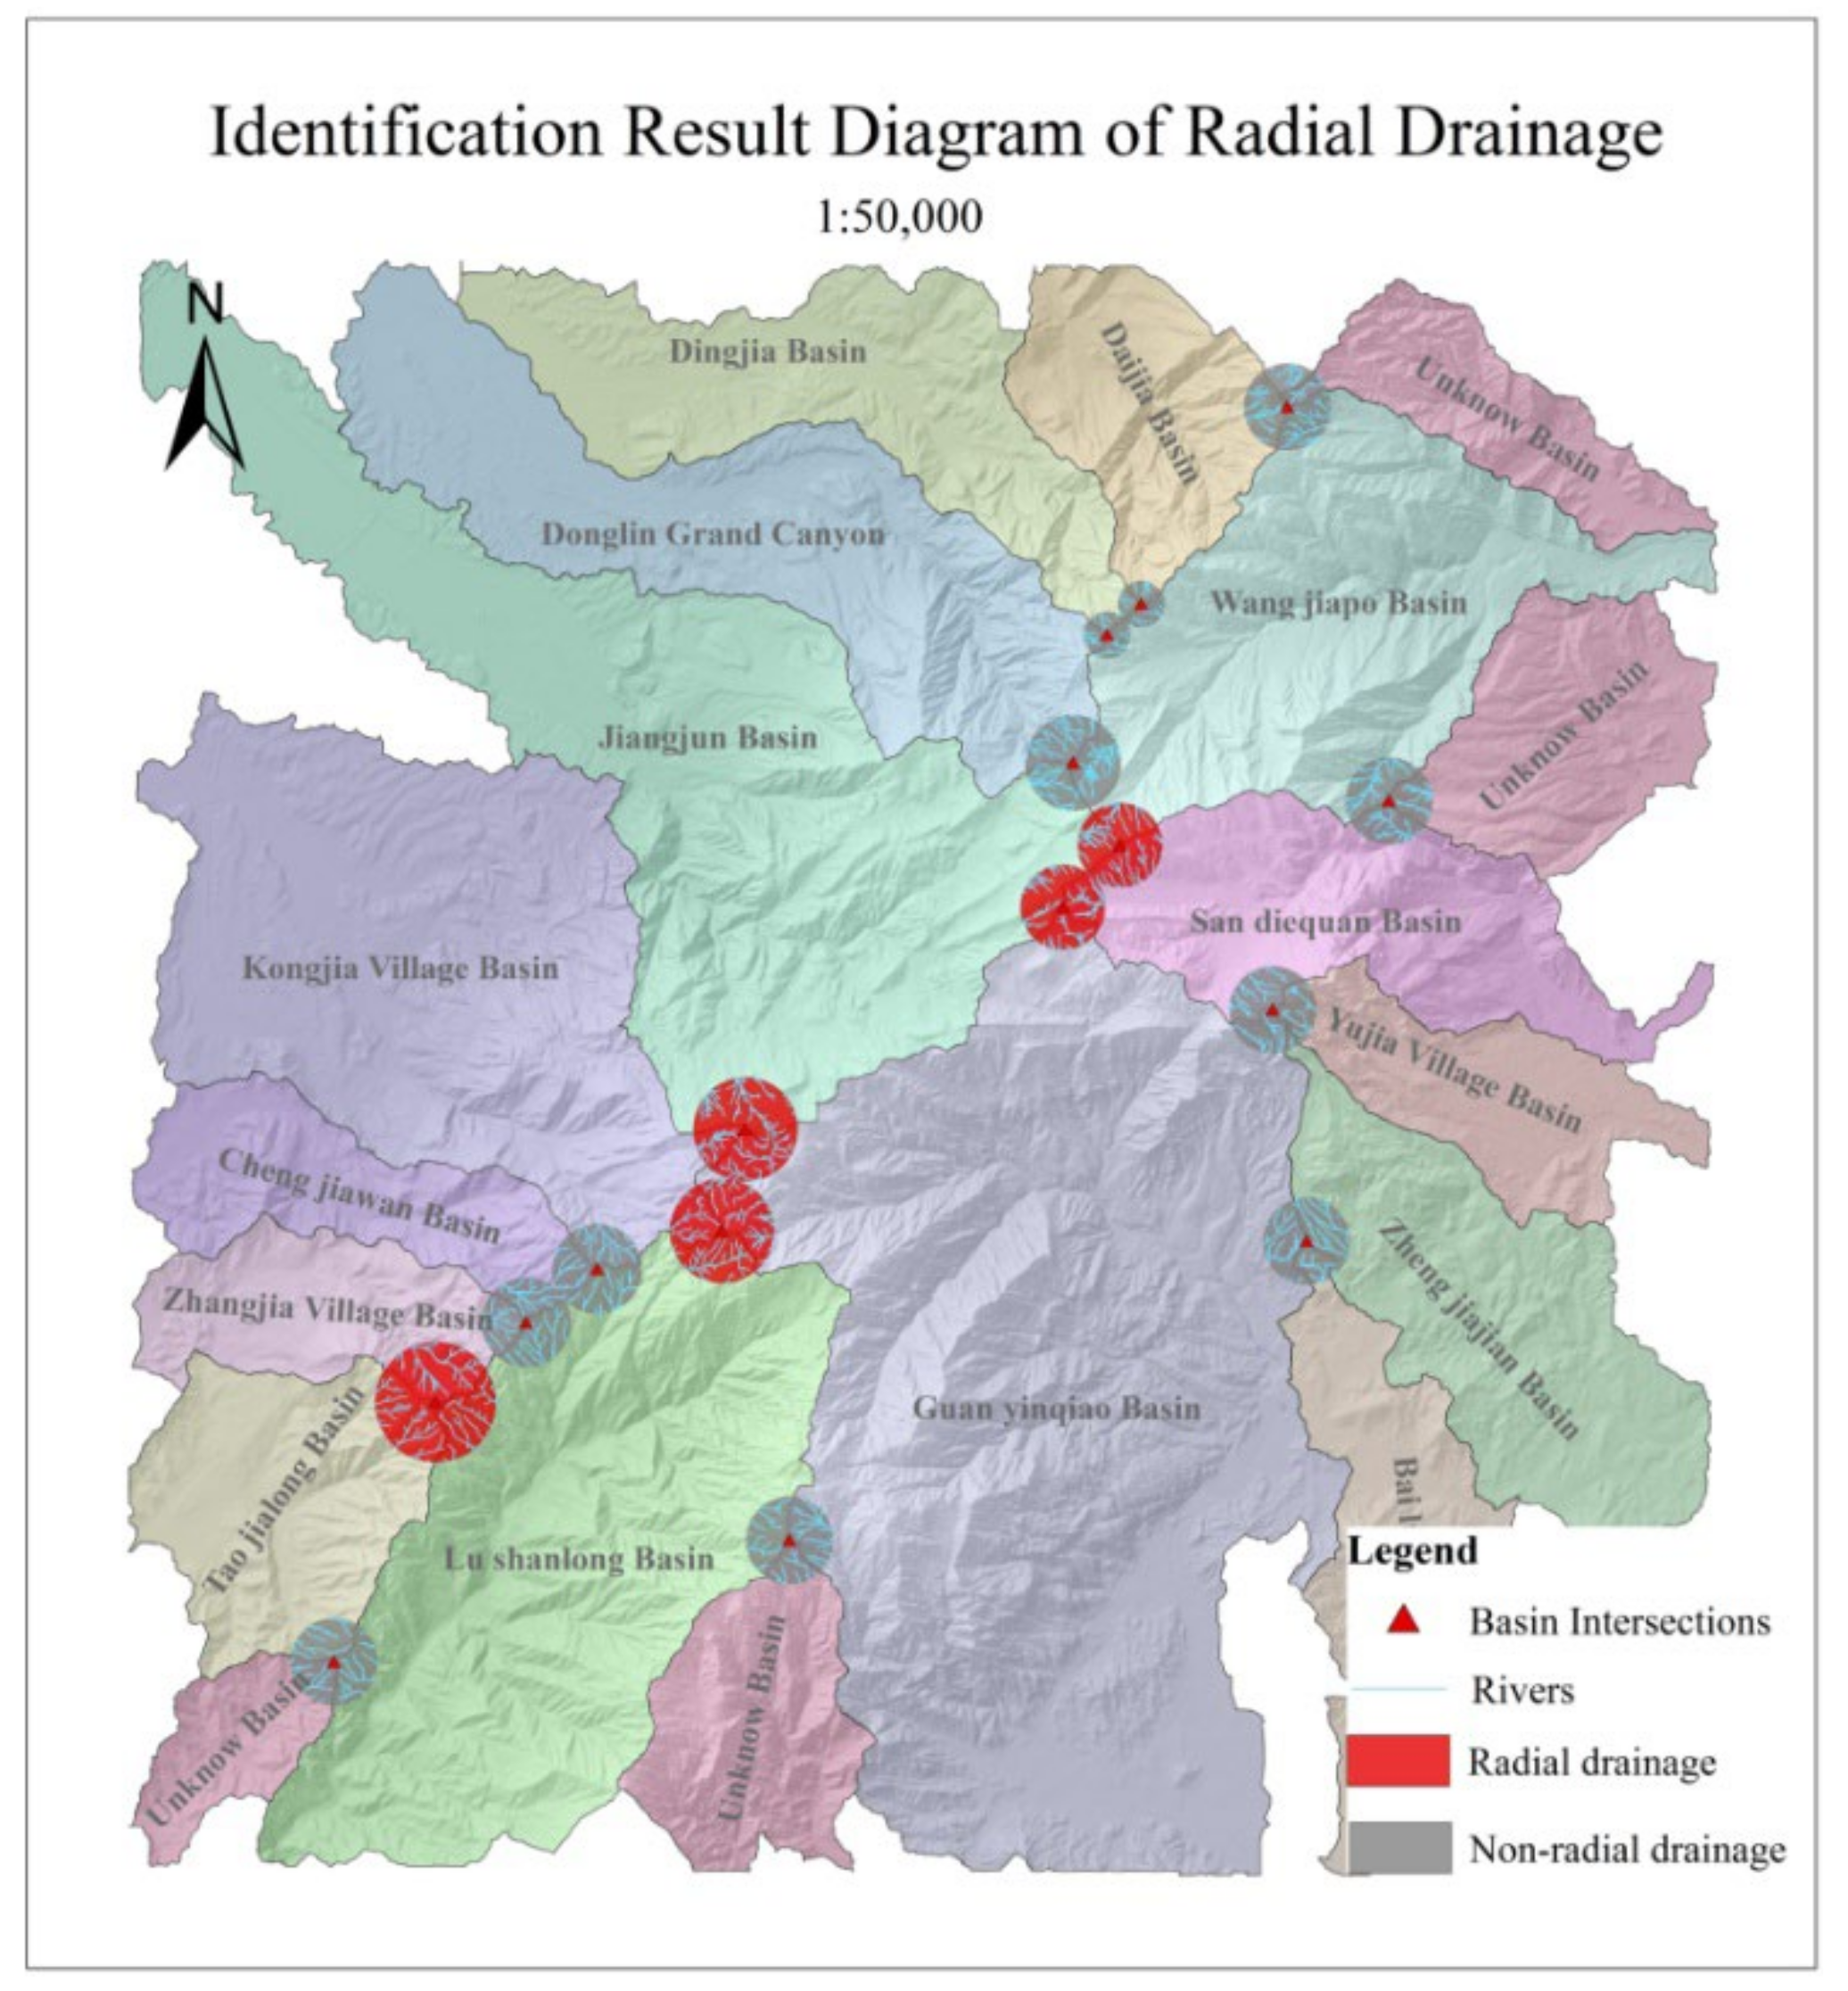
Firstly, the elimination of non-radial river segments (in Section 2.3.2) significantly influences the recognition accuracy. Without removing the non-radial river segments, five units can be identified as RD (Figure 15). Compared with the identification results in Section 2.3.4, the accuracy reduces to 81.25%, and the FAR rises to 60%. Therefore, the removal of the non-radial river segments is necessary for precise recognition of RD.
Secondly, considering the area of RD, the DEM below 30 m resolution is qualified and suitable. If the DEM resolution is too low, RD that develops in smaller volcanoes and domes may be missed.
Thirdly, the centripetal drainage and the RD are similar in shape. The only difference is that the rivers of the centripetal drainage flow inward to the center, while the RD is different. Therefore, the method in this paper is also suitable for automatically identifying centripetal drainage.

5. Conclusions

Based on the unique spatial morphological features of RD (e.g., diverging from the center to the surrounding area, developing in the adjacent parts of the multiple basins, and the number of its source nodes not less than the outlet nodes), this study proposed an automatic identification method of RD based on the feature-matching algorithm. First, the method of this paper can effectively generate the identification units of RD using the basin intersections and the calculated circle buffer. Second, RD can be accurately recognized using a feature-matching algorithm. Third, the drainage scope of an RD pattern can be accurately extracted by connecting the points where the elevation changes steeply in order.
The experiment in Mount Lu demonstrates that the proposed method was efficient in RD identification. In this study area, the two regions of RD are identified, and there are no false judgments or missed judgments, which is verified by experts. The accuracy of this algorithm is 100%, the FAR is 0, and the MAR is 0.
The proposed method not only helps to detect cross-basin drainage patterns (RD and centripetal drainage) but also has some advantages in identifying geographical scenes with complex spatial structures. This research is helpful for water resource exploration and development, major engineering projects, and geological disaster prevention.

Author Contributions

X.W. developed the main modules of the prototype system conceived and is the main author of the article. A.-B.L. conceived the original idea and designed the study. K.-L.W. and H.C. developed partial modules of the prototype system. All authors have read and agreed to the published version of the manuscript.

Funding

This research was supported by the National Natural Science Foundation of China (Grant No. 41771431, 41971068) and the National Key R&D Program of China (Grant No.2021YFE0112300).

Institutional Review Board Statement

Not applicable.

Informed Consent Statement

Not applicable.

Data Availability Statement

Not applicable.

Conflicts of Interest

The authors declare no conflict of interest.

References

  1. Zernitz; Emilie, R. Drainage patterns and their significance. J. Geol. 1932, 40, 498–521. [Google Scholar] [CrossRef]
  2. Morisawa, M.E. Rivers: Form and Process; Geomophology Texts 7; Longman: London, UK, 1988. [Google Scholar]
  3. Argialas, D.P.; Lyon, J.G.; Mintzer, O.W. Quantitative description and classification of drainage pattern. Photogramm. Eng. Remote Sens. 1988, 54, 505–509. [Google Scholar]
  4. Charlton, R. Fundamentals of Fluvial Geomorphology. In Sedimentation Engineering; Routledge: London, UK, 2007. [Google Scholar]
  5. Yang, J.C.; Li, Y.L. Principles of Geomorphology; Peking University Press: Beijing, China, 2001. [Google Scholar]
  6. Twidale, C.R. River patterns and their meaning. Earth-Sci. Rev. 2004, 67, 159–218. [Google Scholar] [CrossRef]
  7. Ai, T.H.; Liu, Y.L.; Huang, Y.F. The Hierarchical Watershed Partitioning and Generalization of River Network. J. Surv. Mapp. 2007, 2, 231–236; 243. [Google Scholar]
  8. Lubowe, J.K. Stream junction angles in the dendritic drainage pattern. Am. J. Sci. 1964, 262, 325–339. [Google Scholar] [CrossRef]
  9. Soykan, A.; Cürebal, I.; Efe, R.; Sönmez, S. Geomorphological features and seismicity of Bigadi? Plain and its immediate vicinity. Procedia—Soc. Behav. Sci. 2014, 120, 524–531. [Google Scholar] [CrossRef]
  10. Bamousa, A.O.; Matar, S.S.; Mohamed, D. Structural and geomorphic features accommodating groundwater of al-madinah city, Saudi Arabia. Arab. J. Geosci. 2013, 6, 3127–3132. [Google Scholar] [CrossRef]
  11. Haakon, F. Structural Geology; Cambridge University Press: New York, NY, USA, 2010. [Google Scholar]
  12. Roger, M. Geological Methodsin Mineral Exploration and Mining, 2nd ed.; Springer: Berlin/Heidelberg, Germany; London, UK; New York, NY, USA, 2010; 13p. [Google Scholar]
  13. Alfonso, I.M.; Niemann, J.D. Identification and characterization of dendritic, parallel, pinnate, rectangular, and trellis networks based on deviations from planform self-similarity. J. Geophys. Res. Earth Surf. 2008, 113(F2), F02015.1–F02015.21. [Google Scholar]
  14. Vimal, S.; Nagesh Kumar, D.; Jaya, I. Extraction of drainage pattern from ASTER and SRTM data for a river basin using GIS tools. In Proceedings of 2012 International Conference on Environment, Energy and Biotechnology, Jeju Island, South Korea, 28 November 2012; Volume 33, pp. 126–130. [Google Scholar]
  15. Zhang, L.; Guilbert, E. Automatic Drainage Pattern Recognition in River Networks; Taylor and Francis, Inc.: Philadelphia, PA, USA, 2013; Volume 27, pp. 2319–2342. [Google Scholar]
  16. Zhang, L.; Guilbert, E. A study of variables characterizing drainage patterns in river networks. Remote Sens. Spat. Inf. Sci. 2012, 39, 29–34. [Google Scholar] [CrossRef]
  17. Jung, K.; Marpu, P.R.; Ouarda, T.B.M.J. Improved classification of drainage networks using junction angles and secondary tributary lengths. Geomorphology 2015, 239, 41–47. [Google Scholar] [CrossRef]
  18. Jung, K.; Ouarda, T.B.M.J. Classification of drainage network types in the arid and semi-arid regions of Arizona and California. J. Arid. Environ. 2017, 144, 60–73. [Google Scholar] [CrossRef]
  19. Xie, G.G.; Deng, B.R. Establishment of Lushan ridge group of Lushan area in the Neoproterozoic, Jiangxi province. Geol. Sci. Technol. Jiangxi 1996, 4, 167–171. [Google Scholar]
  20. Huang, C.G.; Zhong, C.G. Neoproterozoic marine volcanic activity and petrographic features in the Lushan area. Jiangxi Geol. 2000, 14, 99–104. [Google Scholar]
  21. Shi, Z.G. Neoproterozoic Strata and Tectonic Evolution in Lushan Area, JIANGXI Province. Ph.D. Thesis, Chinese Academy of Geological Science, Beijing, China, 2014. [Google Scholar]
  22. Zhang, Z.G.; Wang, L.C. Guide to Field Practice of Geography in Lushan Area; Science Press: Beijing, China, 2011. [Google Scholar]
  23. Jackson, J.; Norris, R.; Youngson, J. The structural evolution of active fault and fold systems in central Otago, New Nealand: Evidence revealed by drainage patterns. J. Struct. Geol. 1996, 18, 217–234. [Google Scholar] [CrossRef]
  24. Yang, C.C.B.; Chen, W.S.; Wu, L.C.; Lin, C.W. Active deformation front delineated by drainage pattern analysis and vertical movement rates, southwestern coastal plain of Taiwan. J. Asian Earth Sci. 2008, 31, 251–264. [Google Scholar] [CrossRef]
  25. Pérez-Peña, J.V.; Azor, A.; Azañón, J.M.; Keller, E.A. Active tectonics in the Sierra Nevada (Betic Cordillera, SE Spain): Insights from geomorphic indexes and drainage pattern analysis. Geomorphology 2010, 119, 74–87. [Google Scholar] [CrossRef]
  26. Guang, Y.H.; Zheng, F.L.; Wang, B. DEM Based Extraction of River Networks in Binzhou River Basin of Heilongjiang Province. Bull. Soil Water Conserv. 2012, 32, 127–131. [Google Scholar]
  27. LI, J.; Tang, G.A.; Zhang, T. Conflux Threshold of Extracting Stream Networks from DEMs in North Shanxi Province of Loess Plateau. Bull. Soil Water Conserv. 2007, 2, 75–78. [Google Scholar]
  28. Xiong, L.H.; Guo, S.L. Method for extracting digital channel network from digital elevation model of watershed. J. Yangtze River Sci. Res. Inst. 2003, 4, 14–17. [Google Scholar]
  29. Lanyan, M.A. Research on drainage network extraction in LiaoHe basin based on SRTM DEM and aster GDEM. J. Anhui Agric. Sci. 2010, 39, 2692–2695. [Google Scholar]
  30. Turcotte, R.; Fortin, J.P.; Rousseau, A.N.; Massicotte, S.; Villeneuve, J.P. Determination of the drainage structure of a watershed using a digital elevation model and a digital river and lake network. J. Hydrol. 2001, 240, 225–242. [Google Scholar] [CrossRef]
  31. Strahler, A.N. Quantitative analysis of watershed geomorphology. Eos Trans. Am. Geophys. Union 1957, 38, 913–920. [Google Scholar] [CrossRef]
  32. Strahler, A.N. Dynamic basis of geomorphology. Geol. Soc. Am. Bull. 1952, 63, 923–938. [Google Scholar] [CrossRef]
  33. Shreve, R.L. Statistical law of stream numbers. J. Geol. 1966, 74, 17–37. [Google Scholar] [CrossRef]
  34. O’Callaghan, J.F.; Mark, D.M. The extraction of drainage networks from digital elevation data. Comput. Vis. Graph. Image Processing 1984, 28, 323–344. [Google Scholar] [CrossRef]
  35. Zhang, G.S. Contemporary Geomorphology; Science Press: Beijing, China, 2005. [Google Scholar]
  36. Chew, L.P. Constrained Delaunay triangulations. Algorithmica 1989, 4, 97–108. [Google Scholar] [CrossRef]
  37. Anglada, M.V. An improved incremental algorithm for constructing restricted Delaunay triangulations. Comput. Graph. 1997, 21, 215–223. [Google Scholar] [CrossRef]
  38. Barber, C.B.; Dobkin, D.P.; Huhdanpaa, H. The quickhull algorithm for convex hulls. ACM Trans. Math. Softw. 1996, 22, 469–483. [Google Scholar] [CrossRef]
  39. Yu, G.F.; Yan, B.Z. Drawing of ancient flow rose chart based on VB. West-China Explor. Eng. 2005, 9, 71–72. [Google Scholar]
  40. Bharani, R.; Sivaprakasam, A. Meteorosoft: A excel function for wind data processing and rose diagram. Earth Sci. Inform. 2020, 13, 965–971. [Google Scholar] [CrossRef]
  41. David, J.S.; David, C.P.P. Making rose diagrams fit-for-purpose. Earth-Sci. Rev. 2020, 201, 103055. [Google Scholar]
Figure 1. Landform and drainage of Mount Lu.
Water 14 02820 g001
Figure 2. Flowchart of extracting basins and rivers.
Water 14 02820 g002
Figure 3. The three types of nodes in a river network. 1, 2, 3, and 4 in the figure are the river levels according to the Strahler stream order method [31].
Water 14 02820 g003
Figure 4. Flow diagram of the RD identification algorithm.
Water 14 02820 g004
Figure 5. Schematic representation of RD.
Water 14 02820 g005
Figure 6. Extraction process of basin intersections. (a) Initial basins. (b) Regional adjacency graph. (c) D-TIN. (d) External rectangles and intersecting rectangle. (e) The points of the basin boundaries within the intersecting rectangle. (f) The basin intersection.
Water 14 02820 g006
Figure 7. The process of identification unit extraction. (a) Constructing TINs based on basin intersections. (b) Calculating radii and generating the circular buffers. (c) Optimizing the buffers whose radii are unsuitable.
Water 14 02820 g007
Figure 8. Clipping of the rivers. (a) Identification units and their centers. (b) Vector rivers in the experimental area. (c) Clipping result of rivers. The small triangles are the basin intersections.
Water 14 02820 g008
Figure 9. The features of flow direction in two regions. (a) radial and (b) non-radial.
Water 14 02820 g009
Figure 10. The flow diagram of RD identification.
Water 14 02820 g010
Figure 11. Determination of drainage scope. (a) Points A-L are the extracted PSs (marked as red points). Connecting the A–L in order is the scope of the RD (marked as a red segment). (b) A profile generated by the radius OP (marked as blue segment), which clearly reflects the location of the points on the OP.
Water 14 02820 g011
Figure 12. The identification result of RD. (a) The identification result of RD in the whole of Mount Lu. (b) The local identification results.
Water 14 02820 g012aWater 14 02820 g012b
Figure 13. Determination of the RD scope. (a) Auxiliary radii and PSs of unit 3. (b) The RD scope of unit 3. (c) Auxiliary radii and PSs of unit 7. (d) The RD scope of unit 7.
Water 14 02820 g013aWater 14 02820 g013b
Figure 14. The rose charts of flow direction frequency and accumulative length of the RD. (a,b) are the rose chart of the flow directions of units 3 and 7, respectively. (c,d) are the rose charts of the accumulative length of units 3 and 7, respectively.
Water 14 02820 g014aWater 14 02820 g014b
Figure 15. The identification result of drainage patterns without removing non-radial river segments.
Water 14 02820 g015
Table 1. Comparison of calculation methods for flow directions.
Method NameMeaning of Flow DirectionAdvantageDisadvantage
The first and last point connection method Overall flowConsiders the whole conditions and is simpleDifficult to describe local conditions
Minimum bounding rectangle methodOverall flowConsiders the whole conditionsDifficult to describe local conditions and more complex
Interval division methodAdvantage flowConsiders the whole and local conditionsThreshold limit and more complex
Table 2. Drainage features of identification units.
IDNARNRRWSCRFWSALCRTNSPTNOPADSCADOCIRDP
016866NoNo419320.82 400.19 No
13720No No125152.53 209.64 No
23120No No1211174.51 240.21 No
319982Yes Yes506346.25 417.78 Yes
423371No Yes419341.97 402.02 No
511750No No314282.50 358.26 No
611031No No174258.07 344.25 No
7239102Yes Yes666379.01 446.77 Yes
810753No No317291.91 368.42 No
911054NoNo3113280.86 358.80 No
1012064No No327328.57 391.13 No
1116353No No305286.97 346.80 No
1212158No No379269.47 338.36 No
1311957No No3812294.21 381.19 No
1415275No No4412293.46 345.21 No
1512731No No175253.02 303.25 No
ID: ID of identification unit. NAR: the number of all rivers. NRR: the number of the radial river segments. WSCRF: whether to satisfy the features of river flow. WSALCR: whether to satisfy the accumulative length features of the rivers. TNSP: the number of source nodes. TNOP: the number of outlet nodes. ADSC: the average distance from all source nodes to the center point. ADOC: the average distance from all outlet nodes to the center point. IRDP: is there an RD pattern.
Publisher’s Note: MDPI stays neutral with regard to jurisdictional claims in published maps and institutional affiliations.