Article

Long-Term Assessment of a Water Safety Plan (WSP) in Salta, Argentina

by
María Soledad Rodriguez-Alvarez
1,*,
Aimé Gutiérrez-López
1,2,
Martín Alejandro Iribarnegaray
1,
Mark Howard Weir
3,4 and
Lucas Seghezzo
1,2
1
Instituto de Investigaciones en Energía No Convencional (INENCO), Consejo Nacional de Investigaciones Científicas y Técnicas (CONICET), Universidad Nacional de Salta (UNSa), Salta A4408FVY , Argentina
2
Facultad de Ciencias Naturales, Universidad Nacional de Salta, Salta A4408FVY, Argentina
3
Division of Environmental Health Sciences, College of Public Health, The Ohio State University, Columbus, OH 43210, USA
4
Sustainability Institute, The Ohio State University, Columbus, OH 43210, USA
*
Author to whom correspondence should be addressed.
Water 2022, 14(19), 2948; https://doi.org/10.3390/w14192948
Submission received: 29 June 2022 / Revised: 12 September 2022 / Accepted: 14 September 2022 / Published: 20 September 2022

Abstract

:
The use of water safety plans (WSPs) has been recommended by the World Health Organization (WHO) since 2004 as a highly effective means of improving water safety management. Experience with the implementation of WSPs is increasing worldwide, but there is no unified or standardized methodology for how the verification of a WSP should be conducted. In this article, we present a thorough evaluation of a specific WSP five years after its initial implementation. We reviewed the risk assessment methodology used by a water utility in Salta, Argentina, and assessed the implementation of control measures. To objectively evaluate the effectiveness of the WSP, we evaluated water quality parameters and customer complaints using a time-series analysis. We show that although some control measures were implemented, and a reduction in risk values was observed, it was not possible to improve long-standing problems in the water supply of the city of Salta, such as the number of consumer complaints or high turbidity levels in the water during the rainy season. We discuss the role of rigorous scientific assessments and the importance of legislation and regulatory bodies in implementing the WSP.

1. Introduction

In the city of Salta, the water utility has historically experienced two recurring problems: (a) increases in turbidity during the rainy season and (b) associated water outages used as a control measure [1]. To address these and several other relevant water quantity and quality issues, the water utility and local researchers, including some of the authors of this article, set out in 2012 to develop a comprehensive water safety plan (WSP) for the city of Salta [2].
A WSP is a management approach recommended by the World Health Organization and the International Water Association (IWA) since 2004 [3,4]. It is considered the most effective preventive risk management tool for improving water safety [5]. The method is well-described in [6] and elsewhere, especially for small community water supplies [7,8]. The implementation of WSPs is growing steadily across the world. They are increasingly being implemented in water utilities and have also been integrated into policy or regulatory instruments [9].
WSPs have been implemented in both rural and urban areas, and a number of advantages, disadvantages, and challenges have been identified [10,11,12,13,14,15,16]. These include the need to set performance targets, identify and monitor evaluation indicators [17], build stakeholder capacity [18,19], educate and train operators [18,20], improve data collection and recording procedures [21,22], and explore how local legislation [11,23,24] and other factors influence WSP implementation [25].
Rigorous and periodic assessment is critical for proper implementation of any WSP [6]. Studies on the long-term impact of WSPs on drinking-water quality or public health are still limited and mostly focused on high-income countries such as Iceland, Italy, Spain, and France. Quantifying the relationship between drinking water parameters (e.g., turbidity) and gastroenteritis [26,27] or recording the number of quality-related complaints and resolution times [28] can show how a WSP can affect public health.
Argentina has some experience in implementing WSPs [29,30]. In Salta, a professional team developed a WSP that identified a set of control measures needed to minimize risks to water quantity, water quality, and human health [2]. In this paper, we provide a long-term assessment of the implementation of that WSP. Our study was conducted after the control measures had been implemented by the company. We wanted to know whether the WSP had helped to improve some of the long-standing problems of the city’s water supply. We provide a brief overview of the risk-assessment process conducted by the company and attempt to determine the impact of the WSP on drinking water quality and public perception. We provide some recommendations to optimize the WSP implementation process. This work provides some tools to improve the long-term assessment of WSPs and may be useful to allow comparisons between WSPs implemented in different cities.

2. Materials and Methods

This study is based on a WSP developed in 2012 for the city of Salta in northwestern Argentina (24°51′ S 65°29′ W; 1187 m above sea level). The climate is defined as subtropical with a dry season with rain mainly between November and March. The average air temperature is 16.5 °C and the annual rainfall is about 700 mm [31].
The water supply of the city of Salta is managed by the state-owned company Aguas del Norte (AdN). Water supply can be divided into four basic processes: catchment, transport, potabilization, and distribution. Water is obtained from surface, subsurface, and subterranean sources. Surface and subsurface water is transported from the catchment area through open and closed aqueducts to treatment plants, where it undergoes sedimentation, filtration, and chlorination processes depending on the characteristics of the water. Groundwater is obtained from more than 169 deep wells distributed throughout the city and is treated only with chlorine. After drinking-water treatment, the water is distributed through a distribution system. In some cases, distribution also includes water reservoirs and cisterns.
For the purposes of this study, the systems are classified as System No. 1 (Finca Las Costas), System No. 2 (North System), System No. 3 (South System), and System No. 4 (Wells). System No. 5 is the distribution system common to all the previous systems. The simplified flow diagram of the water system in Salta is shown in Figure 1.
The risk assessment was based on the WSP manual [6] with modifications suggested by Seghezzo et al. [2]. During participatory workshops with a professional team assembled by AdN, the hazardous events for each system were evaluated, assigning probability and severity values on a scale from 0 to 100, which was considered more intuitive and facilitated the evaluation. The probability and severity were estimated based on objective, statistical, or scientific data, such as the probability of earthquakes or droughts or the severity of microbiological contamination of water sources. When quantitative criteria could not be applied, values were assigned based on participants’ experiences and opinions. Severity was determined based on the impact of hazardous events on water quantity, water quality, and human health. Risk was calculated as the product of the probability of occurrence of a hazard and the severity of that occurrence, and was ranked according to the following scale: risk < 25: low; 25 ≤ risk < 50: medium; 50 ≤ risk < 75: high; risk ≥ 75: very high (adapted from [32]). An acceptable risk value was set at 24%, one unit below the upper end of the “low” range [2].

2.1. Review of the WSP

At the beginning of the WSP in 2012, 98 hazardous events were identified, and an initial risk was determined for each system. The water utility has conducted its own annual risk assessment for 5 years since the implementation of the WSP. In this study, we provide a descriptive review of all the activities the company has conducted during this 5-year period. This includes a review of the control measures established for each hazard, an analysis of compliance or noncompliance with the control measures, an analysis of the methodology used to calculate annual risk, and a discussion of how the decrease in annual risk values might be associated with the implementation of the control measures.

2.2. Assessment of the WSP

The company monitors water quality and sends a monthly report to a control body, the Public Services Regulatory Entity (ENRESP, Spanish acronym). Using these reports (from 2011 to 2017), the research team identified indicators that could reflect improvements in the water service in each system under study. These indicators were also discussed in two workshops with members of ENRESP. Two groups of potential indicators were identified: (1) Complaints. This group includes all consumer complaints received by the water utility, such as water quality deficiencies (high turbidity, lack or excess of chlorine, among others), lack of water, water delivery requests, tank or cistern overflows, lack of signals at certain locations, poor maintenance of water facilities, water losses, and insufficient water pressure; and (2) Water quality. In this group, we included water quality parameters and variables such as turbidity, residual chlorine, and Escherichia coli (E. coli), considering that legislation allows a maximum of 3 NTU for turbidity, a minimum of 0.2 mg/L for residual chlorine, and the absence of E. coli in 100 mL [33].
The systematization of the data was carried out taking into account the totality of neighborhoods distributed throughout the city, which in 2017 were 369 neighborhoods. The results of the analysis of water quality and complaints are assigned to the address and the associated neighborhood of the consumer. In order to evaluate different systems independently, only neighborhoods that receive water from one system were selected. (In some areas, water from two or more systems is blended prior to distribution.) This limited the available data to Systems No. 1 and No. 2, as most of the available from Systems No. 3 and No. 4 correspond to households receiving mixed water. The results from “Salta City” include all systems (No. 1 through No. 5) as a whole.
To verify the effectiveness of the WSP, the Mann–Kendall test (MKT) and the Pettit test (PT) were applied to water quality variables using XLSTAT software. Both are time-series tests, with the MKT assessing the monotonicity of positive or negative trends and the PT assessing the quantified shifts in the central tendency of the distributions of the data. One of the MKT parameters is Kendall’s tau, whose sign, positive or negative, indicates whether the trend is positive or negative when the p-value is less than the significance level alpha (in our case, alpha = 0.05). The PT is an adaptation of the MKT that identifies the moment when a significant change occurs in the mean of the evaluated values and the date when the change occurs. The analysis shows the date of the change in the mean and the value of the corresponding means µ1 and µ2. These tests have also been used in the evaluation of hydrologic time series collected over several years [34,35,36]. A summary of the data analysis described can be found in Table 1.

3. Results and Discussion

3.1. Review of the WSP

3.1.1. Review of Control Measures

The complexity of the water supply of the city of Salta required a painstaking effort by the company to establish the control measures for each hazardous event.
One or more control measures were assigned to each hazardous event. For example, in one case where unexpected flooding occurred and posed a hazard to the water-treatment process, three control measures were implemented: (1) a shutdown procedure for the potabilization plant; (2) an alternative water source; and (3) new infrastructure such as physical barriers in the river to protect areas from flooding. Table 2 shows a summary of the systems, the associated sub-processes (14 in total), the number of hazardous events, and the number of control measures associated with each system. Table S1 in the supplemental material shows the hazardous events and control measures for each process of each system.

3.1.2. Analysis of Compliance with Control Measures and Annual Risk Calculation

Annually, the WSP team evaluated compliance with each control measure and recalculated the risk level for each hazardous event based on their own risk-estimation approach. The risk values for Systems No. 1 to No. 5 were determined by averaging all risk values calculated for each corresponding subprocess. Finally, a global risk value for the city of Salta was estimated as the average of all risk values for all systems.
The company risk calculation method included three variables: (1) the initial risk from hazard i (Xi,0); (2) the compliance for each control measure adopted for hazard i (Ci); and (3) the impact value of that control measure to minimize risk (Ii). Ii is an arbitrary variable defined by the company to weight each control measure. The company considered that different control measures have a different impact on mitigating hazard i. However, the sum of the impacts would still need to be within the range (0,1). Therefore, they use Equation (1), in which the sum of changes from subsequent years since WSP implementation is subtracted from X i , 0 .
X i , n = X i , 0 j = 1 p ( X i , 0 · I i , j · C i , j , n )
For a hazard i with p control measures, ( X i , n ) is the risk value in the year n; I i , j   is the impact of the control measure j; and C i , j , n is the percentage of compliance with the control measure j in the year n. The values for I i , j   were established only once at the beginning of the WSP through internal workshops using an expert elicitation process. The values for C i , j , n , on the other hand, were discussed annually among the members of the company and reviewed internally.
Table 3 shows this assessment for two example hazards and their corresponding control measures for catchment used for System No. 1.
Following the examples in Table 3, two control measures with the same 50% risk mitigation impact were defined for hazard 1. For hazard 2, fencing in the catchment area to prevent livestock entry is assumed to reduce risk by only 5%, so additional measures must be taken to regulate the presence of livestock in the area. Housing livestock in appropriate areas could have a 20% impact, and building a new water-treatment plant would have a 70% impact. In terms of percent compliance, 0% compliance means the control measure was not implemented, while 100% means it was fully complied with. The percentages in between (70%, 50%) mean that the control measure is still in progress. Table S1 (last column) in the supplemental material shows compliance with each control measure.
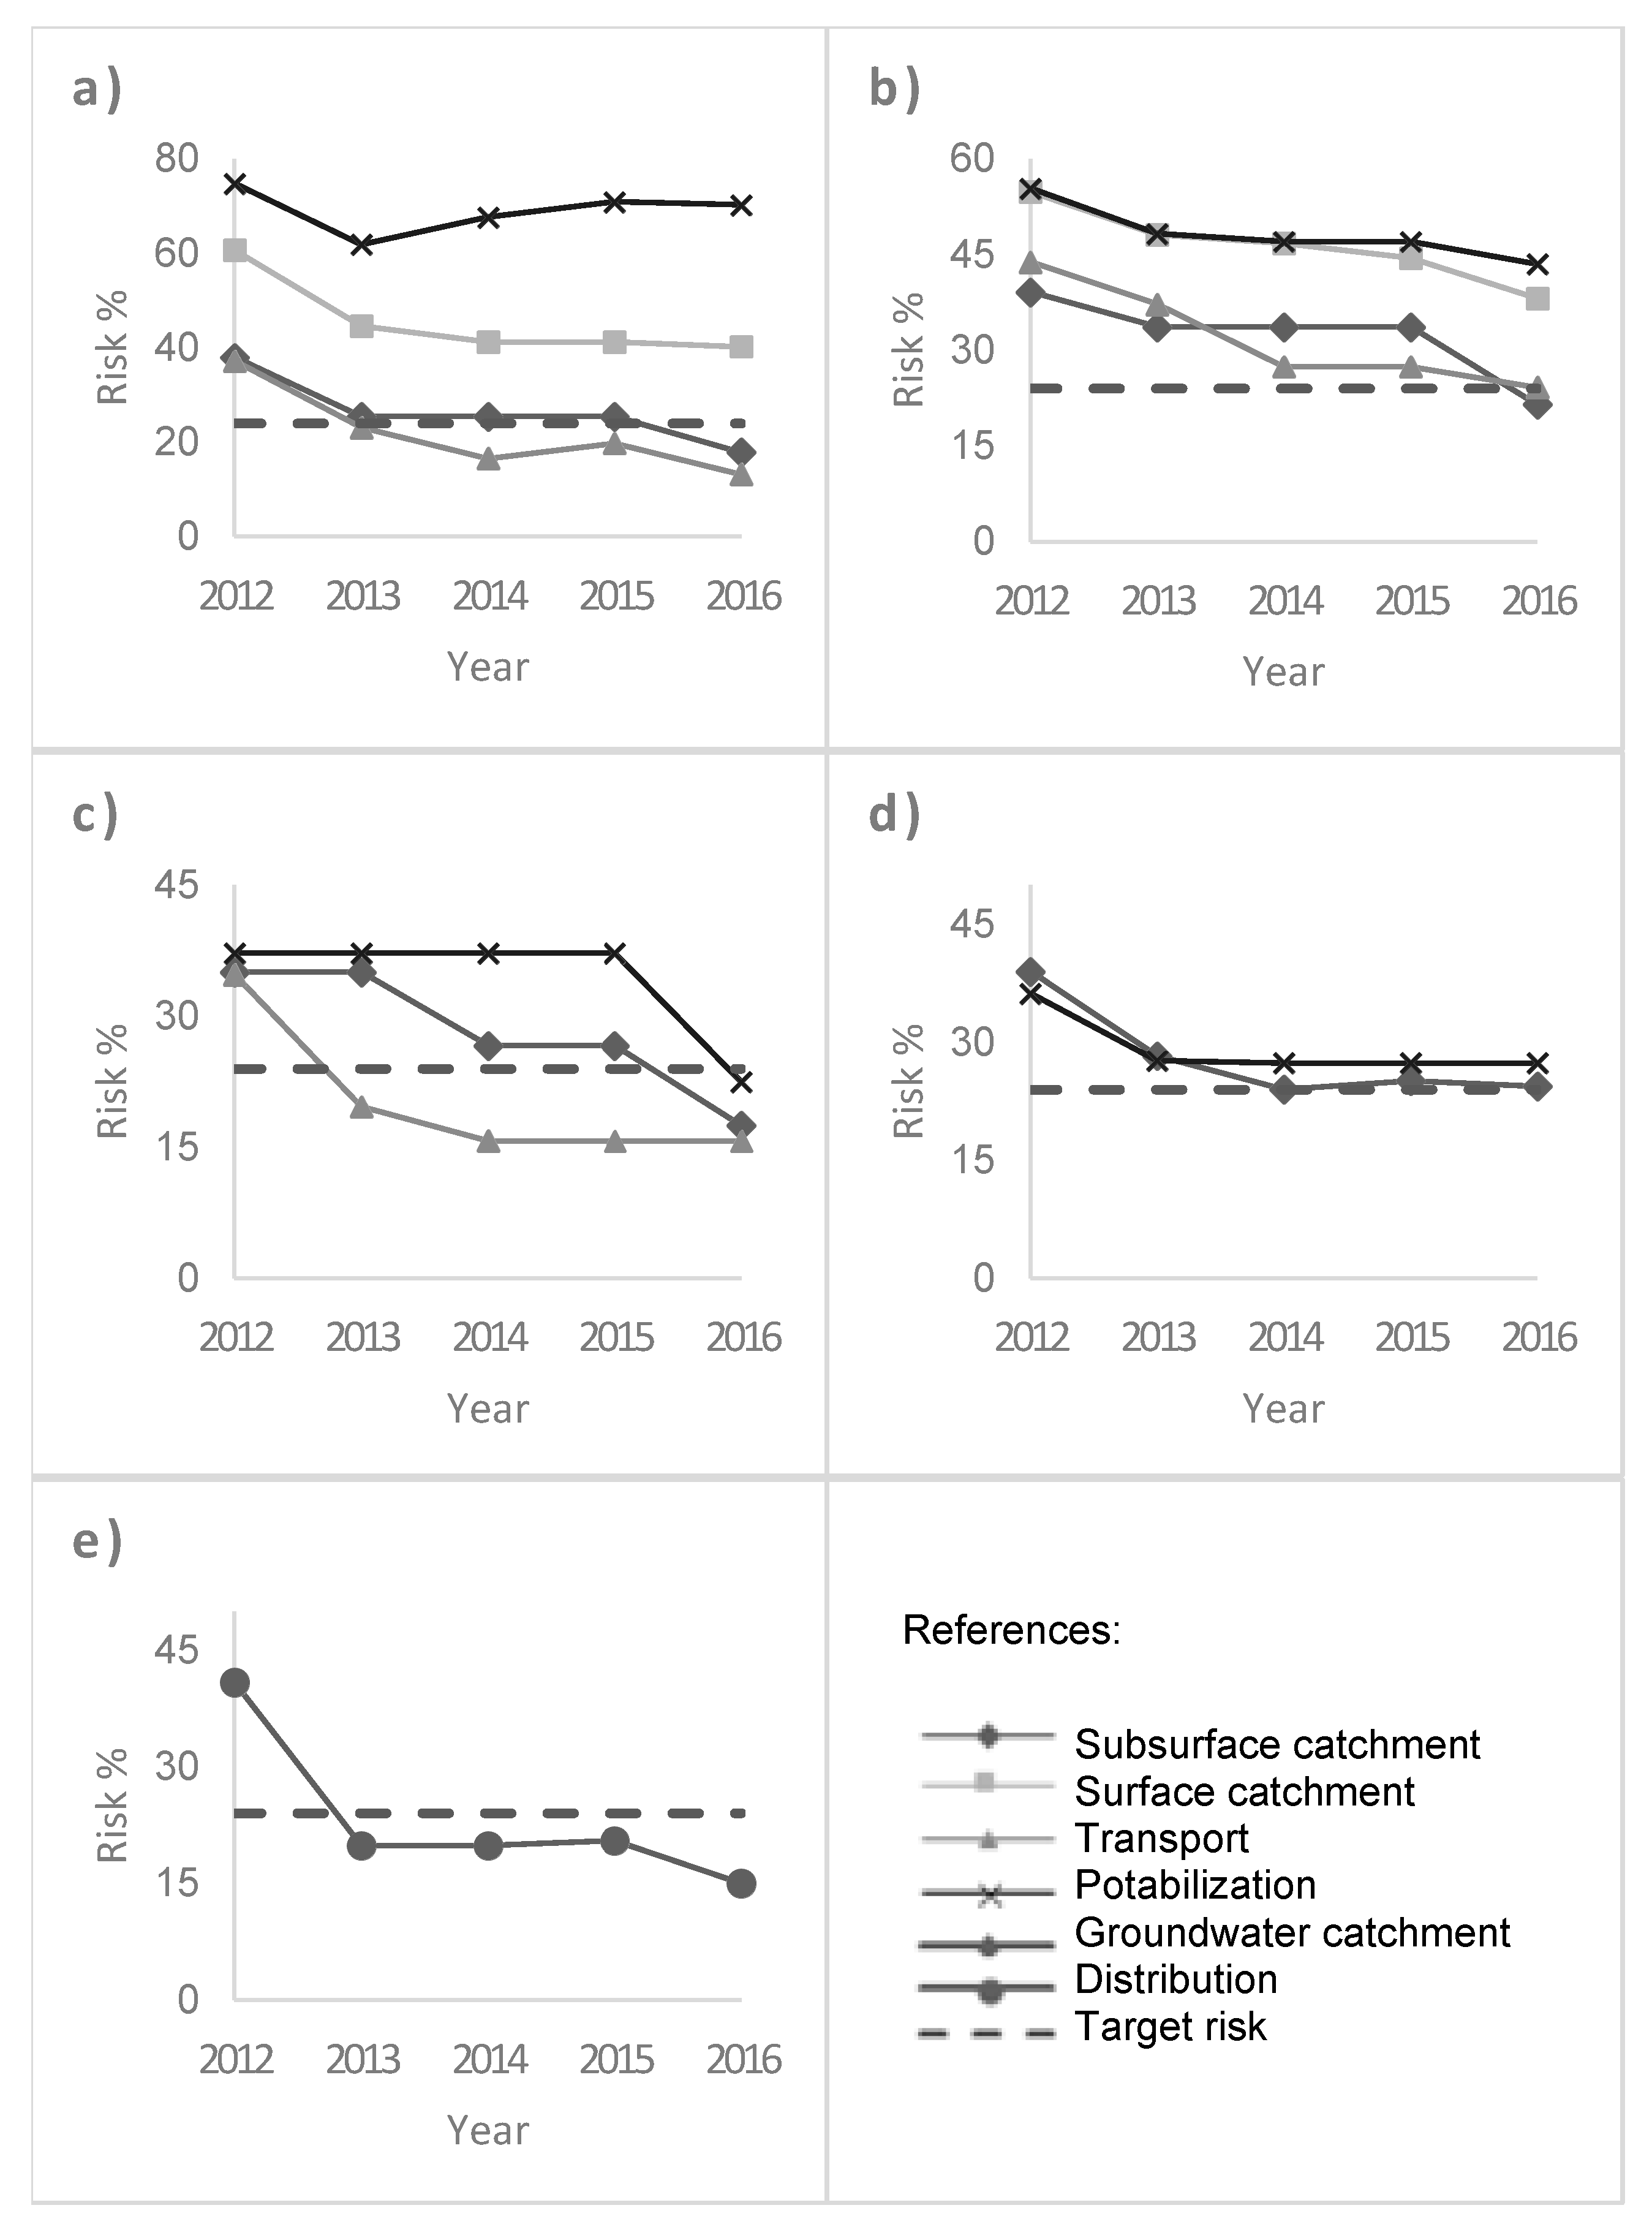
Based on this risk-calculation method, the annual changes in risk values for all systems studied with their respective sub-processes are shown in Figure 2.
It can be seen that the risk in all sub-processes exceeded the acceptable risk threshold of 24% by 2012 and gradually decreased with the implementation of various control measures. In 2016, the risk was reduced below the threshold except for the sub-processes of “Surface catchment” and “Potabilization” in Systems No. 1 and No. 2. The sub-process of potabilization of System No. 4 was slightly above the target risk (27%).
The company considers this methodology to be the best alternative for assessing its risks and agrees with the recommendations of Bartram et al. [6], according to which the WSP methodology can be adapted to specific needs. At the internal level of the company, the checklist of control measures has allowed the development of an orderly and thorough work plan to verify compliance and annual progress.
However, the specificity of the method used by the company must be verified, in particular, with regard to possible improvements to Equation (1), especially to the variable used, Ii,j. This variable was adopted based on expert opinion in a workshop, but the ability to justify that a particular control measure can reduce a risk value by a certain percentage was not determined. In addition, many of the control measures established by the company had not yet been put into practice, so it might be more reasonable to determine the impact value (Ii,j) after the control measures had been implemented. Using Equation (1) gave them a false sense of security about the effectiveness of the WSP they had implemented.
Those control measures that have not been implemented after 5 years deserve special attention because there is a latent hazard and unresolved risk over 5 years. Compliance with control measures in each system was analyzed, and it was found that 37% of the control measures proposed in 2012 had not been implemented 5 years after the implementation of the WSP. The complexity and cost of the unimplemented control measures varied widely, and it was not possible to identify the order of priorities established by the company. Some of the unimplemented control measures included construction of physical barriers in the river course to prevent flooding, system improvement studies, optimization of the piping system, optimization of the water treatment system, replacement of the filter bed, expansion of the existing water facilities, implementation of guard rotation services, installation of a generator, monitoring and control of wastewater disposal, and construction of a fence, among others. In Systems No. 1 and No. 2, more than half of the measures proposed at the beginning of the WSP were not implemented. Some of these measures involve low costs, such as installing a generator in case of a power outage, permanent guards in vandalism-prone areas, and building a fence; others involve higher costs, such as optimizing water-treatment systems or expanding existing facilities. If a control measure cannot be met for any reason, the hazard should be reassessed and the need for new control measures considered.
A particularly interesting sub-process is the water-potabilization process of System No. 1 and No. 2, where the initial risk estimates in 2012 were 75% and 55%, respectively. In System No. 1, nine of the twelve control measures had 0% compliance, and control measure impacts ranged from 5% to 70%. In System No. 2, seven of ten control measures had 0% compliance. In particular, the control measure “construction of a new water-treatment plant” is considered to have an impact of 70% to minimize the risks related to agriculture, domestic animals and livestock, insufficient treatment capacity, pollution of water sources, and meteorological and climatic phenomena, so it was considered the most important control measure to improve System No. 1. The surface catchment sub-process is also influenced by this control measure. A similar situation about this control measure is observed in system No. 2. To assess the importance of this facility, two situations were simulated in 2016 using Equation 1. First is Scenario 1, in which the facility is built by 2016, resulting in 100% compliance. In Scenario 2, the company decides to focus on all control measures except the construction of a new water-treatment plant. Since System No. 2 also proposes the execution of a new plant to optimize service, the same scenarios were proposed for this case. In the case of System No. 1, the construction of a new plant would reach a risk value of 22%, while focusing on the implementation of the remaining control measures, as proposed in Scenario 2, would allow a risk of 18%. In the case of System No. 2, values of 19% and 18%, respectively, would be achieved. In other words, similar results were obtained, with a significant difference in decision making, investments used, and time required to achieve the risk objectives. This analysis is important to decide whether the execution of an investment is really necessary or not and whether it justifies the effort and money.

3.2. Assessment of the WSP

3.2.1. Analysis of Complaints

Between 2011 and 2017, the city of Salta received 658,729 complaints, of which 351,221 corresponded to water service. Data on the evolution of the population served over time were not available.
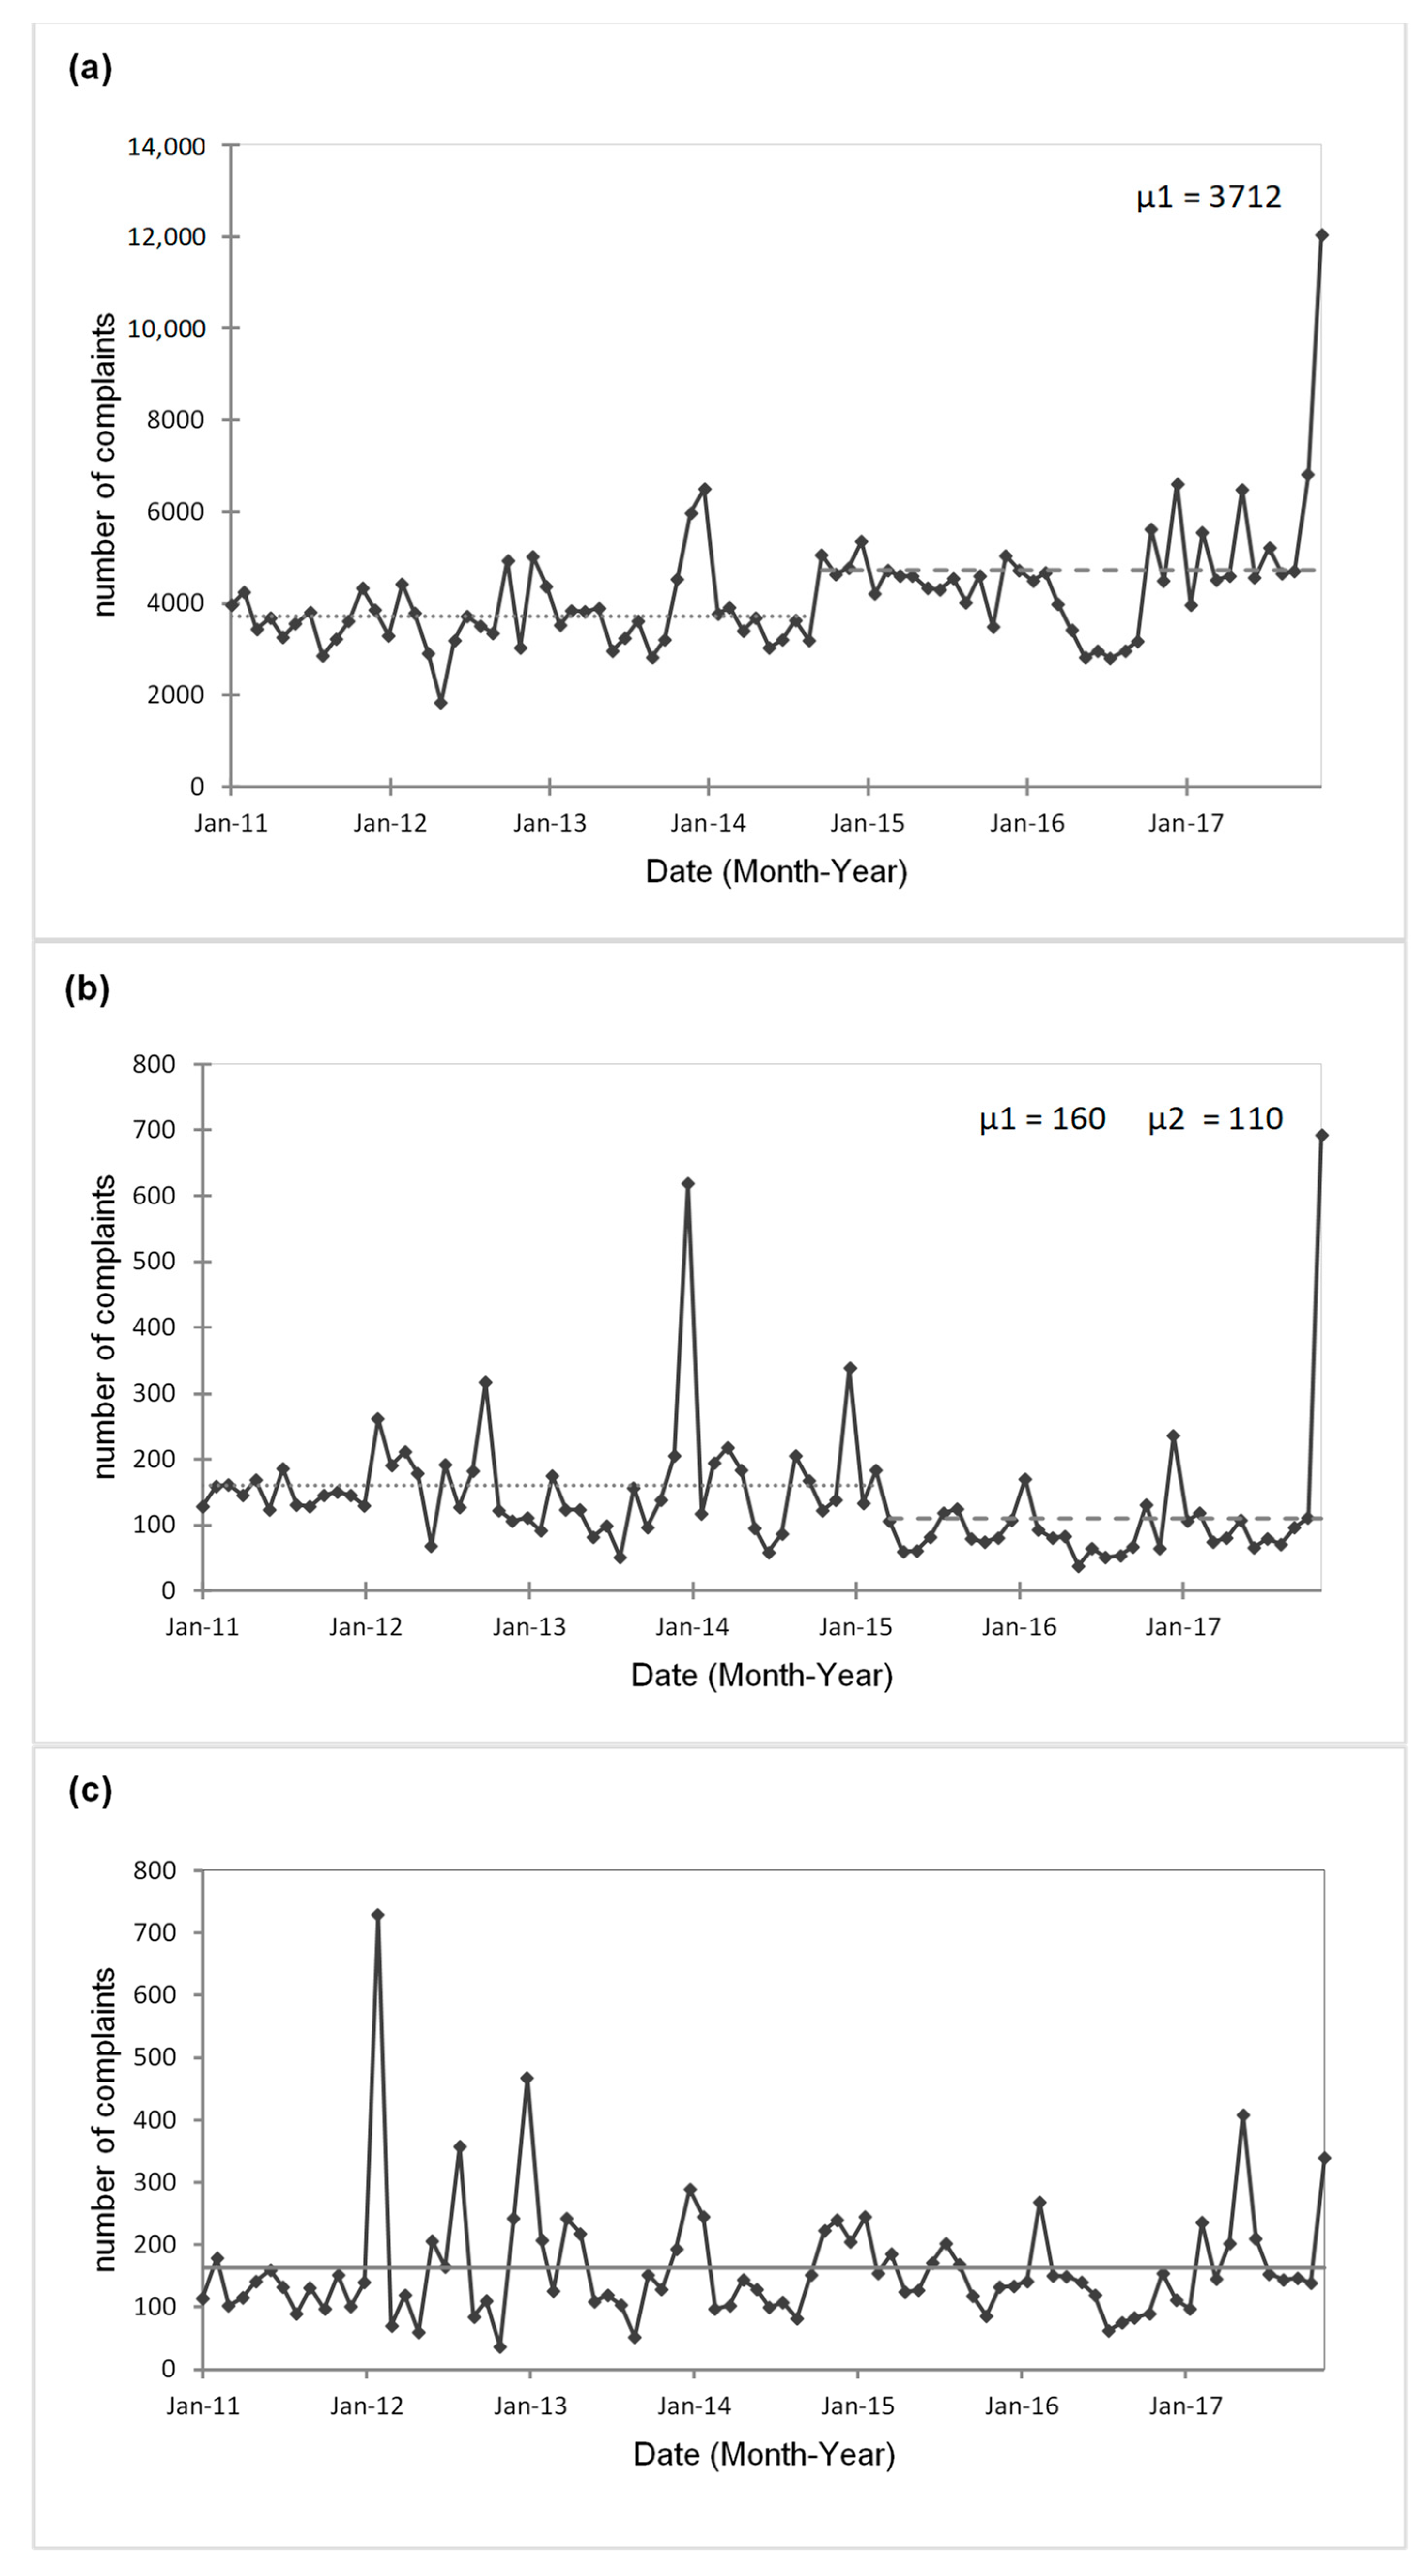
For the time-series analysis, those 351,221 complaints were considered, of which 11,803 came from System No. 1, and 13,691 came from System No. 2. The results are shown in Figure 3a–c: for the entire city of Salta, System No. 1, and System No. 2, respectively. Trends and significant shifts in the means from the Pettit analysis, indicated by μ1 and μ2, are also shown in these figures.
The city of Salta showed a statistically positive trend (Kendall’s tau 0.286, p-value 0.050): an increase in the number of complaints, which showed a significant change in September 2014 by the Pettit test. System No. 1 is observed to have a negative trend in the number of complaints (Kendall’s tau −0.309, p-value < 0.0001) and a significant change in March 2015. System No. 2 showed no trend shifts in the data series during the studied period (p-value 0.310), indicating that the number of complaints neither improved nor decreased.
The WSP shows that although the city of Salta’s risk has decreased since the implementation of the WSP, this has had no effect on the number of complaints about the quality of water service (Figure 3). Pettitt’s analysis shows that there was an increase in the average score in September 2014. At that time, the company indicated that it was able to identify the absence of a filter bed in a potabilization process while monitoring compliance with control measures. The increase in complaints coinciding with that date suggests that this aspect may have an impact on the quality of the service.
Regarding System No. 1, which has a negative trend in the number of complaints and a significant change in March 2015 (Figure 3), there is no specific control measure that influenced a decrease in risk in 2015. However, from 2012 to 2016, some control measures were implemented in all sub-processes that could be associated with the negative trend in the number of complaints, mainly measures that increase the safety of the catchment areas, inspection of the facilities, and permanent staff for the operation of the water-treatment plant. Likewise, action plans have been developed to address meteorological and climatic phenomena such as droughts and floods. These include the use of alternative water sources, the possibility of closing water intakes when turbidity exceeds the treatment capacity of the plant, the development of prevention and emergency plans, and the training of all personnel and the implementation of drills for emergencies. On the other hand, the company worked with external stakeholders to regulate agricultural and livestock activities in the catchment area, the location of livestock in appropriate areas, and prohibiting recreational activities in catchment areas. These actions, which are not significant investments but rather important management improvements, may have had an impact on the observed decline in complaints.
System No. 2 did not show statistically significant changes; i.e., the control measures implemented that led to a decrease in risk did not affect the number of user complaints. Furthermore, the control measures proposed at the beginning of the WSP, which were aimed at minimizing the hazards related to meteorological and climatic phenomena, lack of safety in the sub-processes, erosive phenomena, insufficient treatment capacity, power failure, and pollution sources, were not implemented at any time during the period studied.

3.2.2. Time-Series Analysis of Water Quality Parameters

Table 4 shows the amount of data available for each of the systems considered in this phase. For the turbidity indicator, a trend analysis was performed for the three systems considered, while for the residual chlorine and E. coli indicators, the data analysis, ordered by the number of deviations per month per year, was performed only for the city of Salta since only a limited number of deviations were observed in Systems No. 1 and No. 2.
Figure 4 shows the results of a Mann–Kendall analysis for the city of Salta. In both the analysis of all available turbidity values (p = 0.759) (Figure 4a) and the analysis of the number of deviations, i.e., turbidities greater than 3 NTU (p = 0.311) (Figure 4b), no statistically significant changes were found that would explain a change in the trend of the values. It should be noted that none of the control measures taken were sufficient to prevent turbidity spikes during the summer. Similarly, most records of turbidity values above 3 NTU occur primarily in December, January, and February of each year, as shown by the peaks in both Figure 4a,b. This behavior did not change over time; i.e., the WSP had no relationship with this variable. The values for System No. 1 behaved similarly to those for the entire city of Salta both for all turbidity values (p = 0.902) and for the number of values above 3 NTU per month-year (p = 0.323).
System No.2 registered a statistically negative trend (Kendall’s Tau = −0.118; p = 0.002), with a significant change in the mean in March 2014 (p < 0.0001) (Figure 5a). Control measures that may have contributed to the reduction in turbidity included catchment area access restrictions, closure of water intakes after heavy rains, alternative water sources (such as groundwater), leakage reduction, and more stringent water quality controls. As shown in Figure 5b, there was no trend in turbidity levels greater than 3 NTU. The lack of negative trends and the peaks above 3 NTU during the rainy season indicate that more effective control measures are still needed.
In the three systems studied, “water loss” and “lack of water” accounted for most complaints, with a peak of 78% of complaints in 2016 (46% for water loss and 32% for to lack of water). This behavior is related to inadequate infrastructure to address high turbidity levels, as the control measure for turbidity is to turn off the water intake. An important finding was that water quality complaints account for only 2% of all complaints, considering that the time-series analysis of turbidity levels shows significant turbidity spikes during the rainy season that far exceed the maximum allowable value of 3 NTU, including a maximum value of 124 NTU for System No. 1. Furthermore, the turbidity levels do not improve over time. This means that the consumer receives turbid water at home but does not complain to the company. This acceptance of the turbidity problem would also be a good point to evaluate in the near future, as perhaps this is the reason that complaints of high turbidity do not prevail. It is important to consider what actions people take when they receive turbid water in their homes: whether they drink it no matter what, whether they buy water, or whether they use some other method to treat drinking water. There is no evidence of community warnings to take complementary water-treatment measures, such as boiling or additional filtration, when it is clear that turbidity levels greater than 30 NTU, as observed in 2016, are perceptible to any consumer and because high turbidity also complicates the subsequent chlorination process and bacteriological treatment [37]. A study by Kumpel et al. [22] in the Asia-Pacific region found that infrastructure improvements focused on water quality rather than water quantity, while consumer complaints focused primarily on water quantity. This highlights the importance of balancing both aspects in water safety planning, but it is also important to consider the social perspective when making decisions [38].
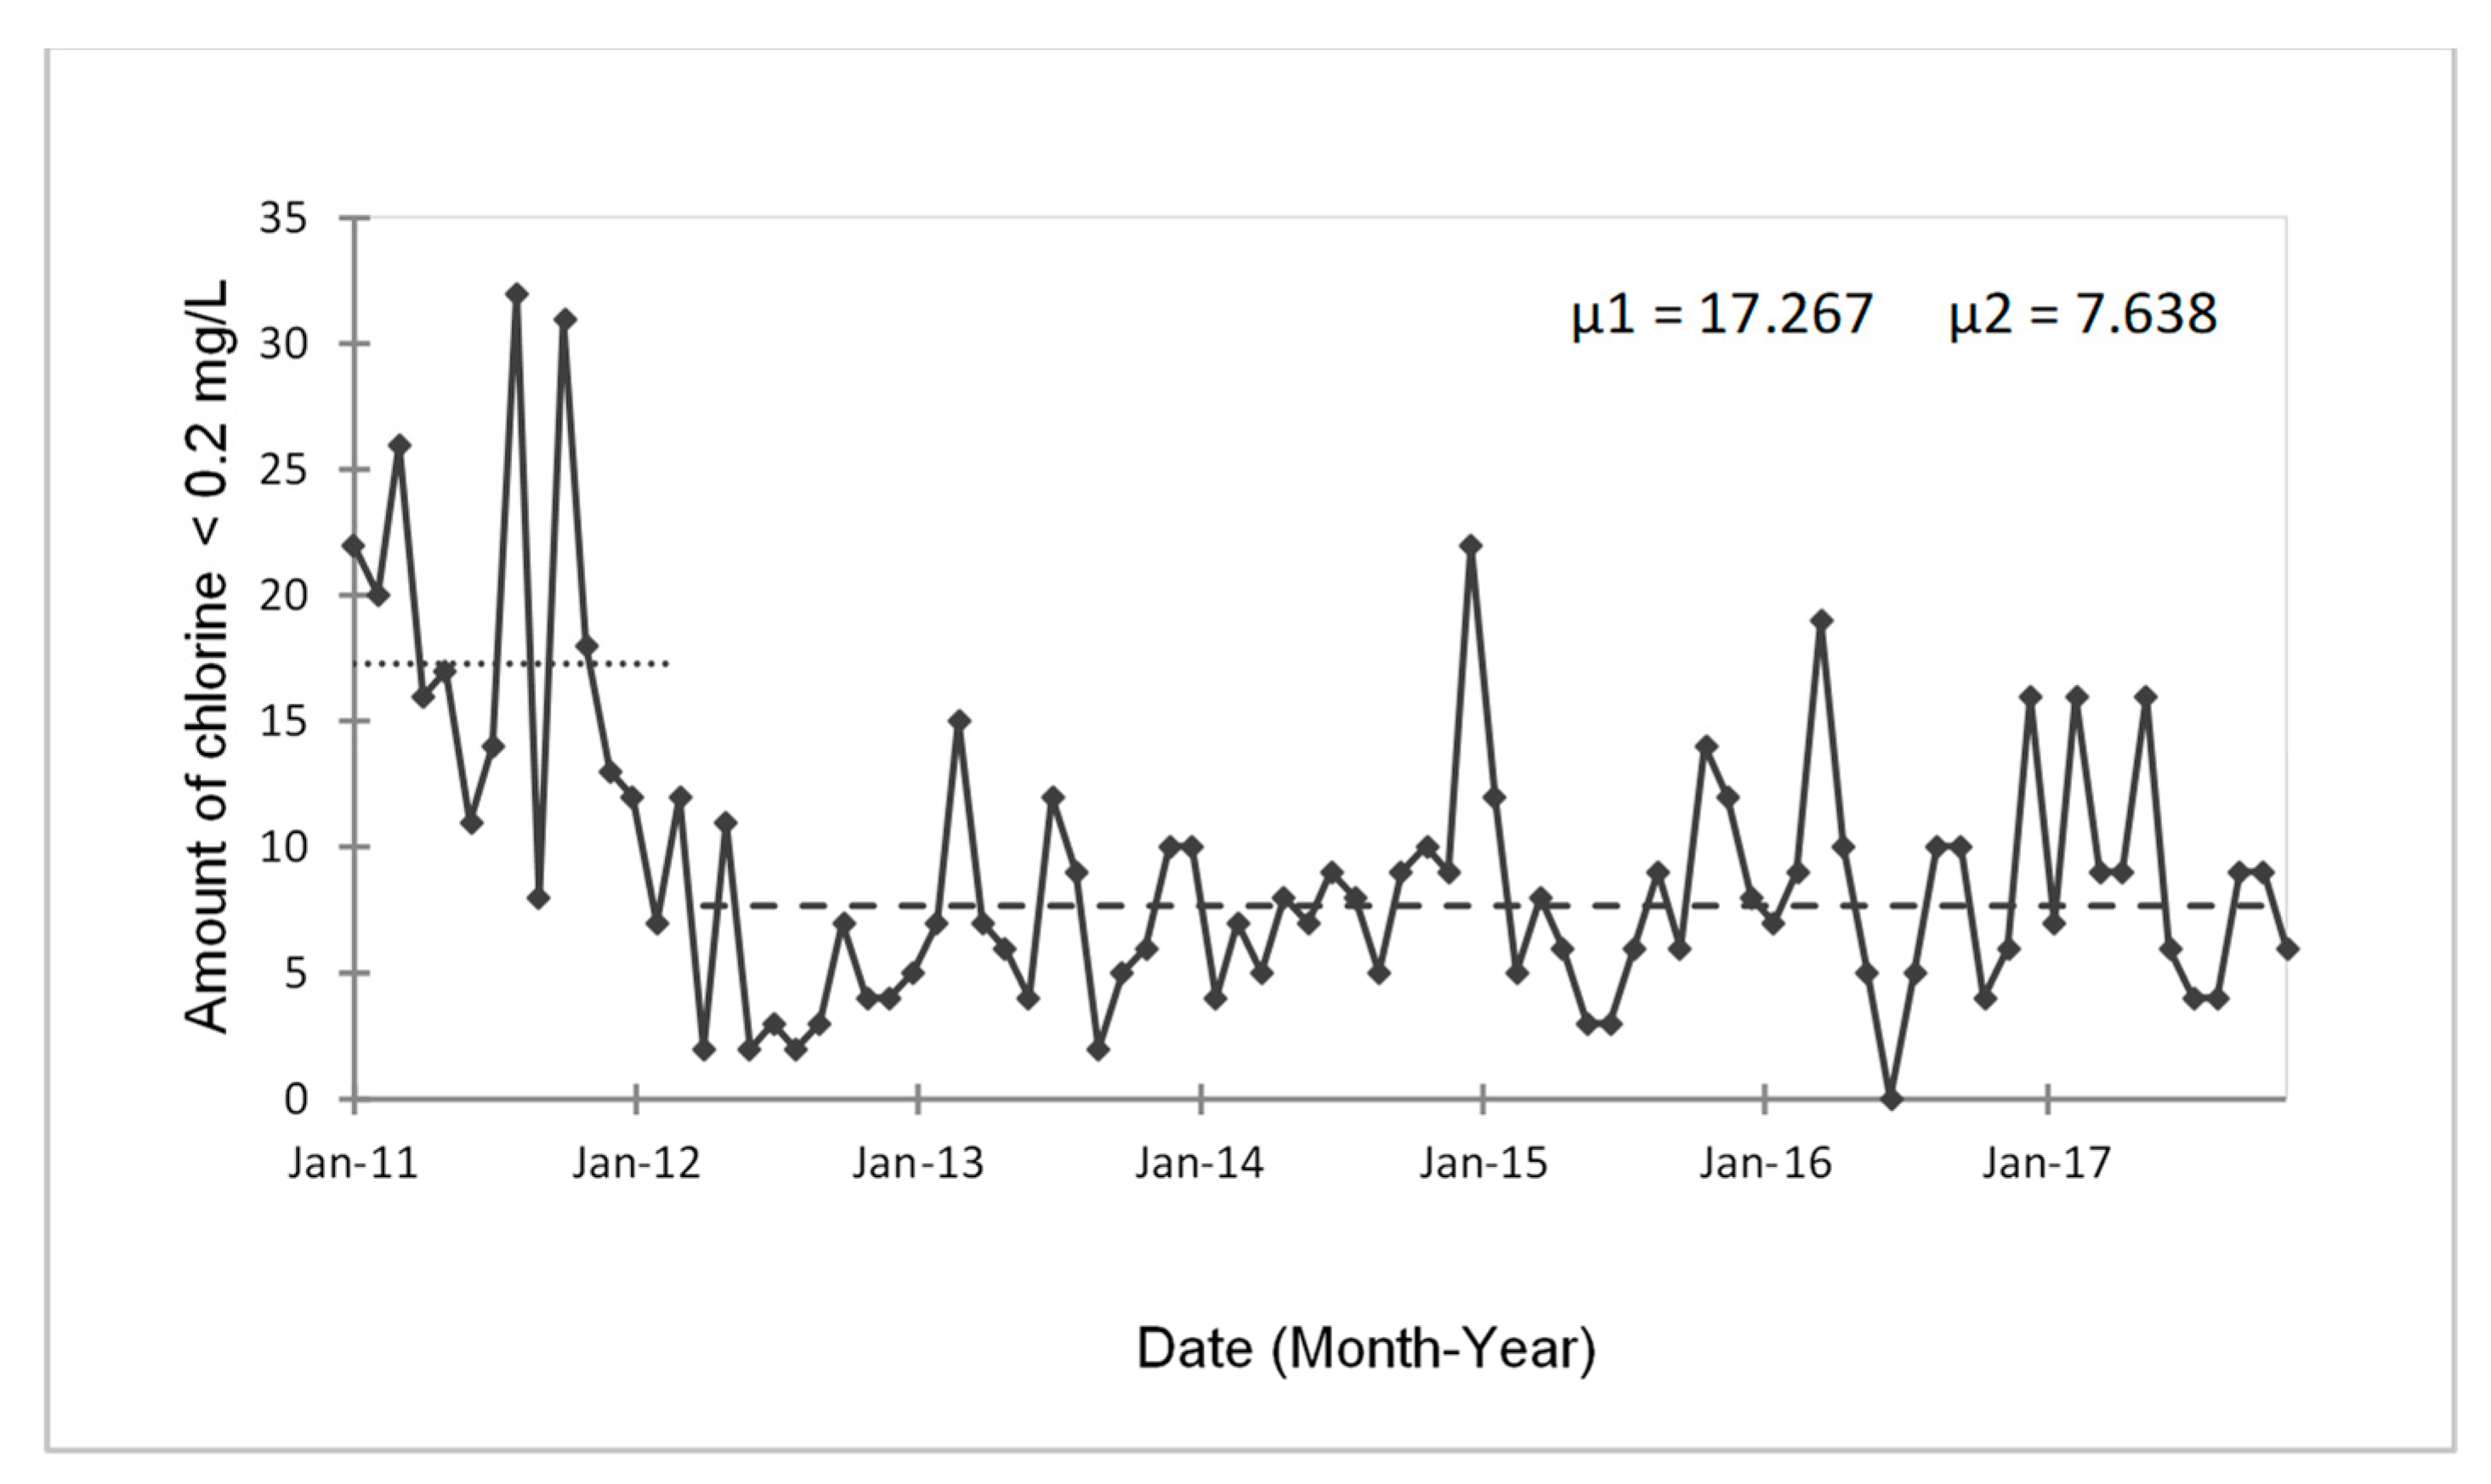
Figure 6 shows the data analysis on the amount of chlorine less than 0.2 mg/L in the city of Salta per month-year. A change in the mean is observed in March 2012 (µ1 = 17.3; µ2 = 7.6; p = 0.002). A MKT with data after that date (2012 to 2017) indicates no statistically significant change.
This improvement in the initial phase of the WSP can be associated with the revision of the individual process steps in all plants, which means that the chlorination process was indirectly optimized. Control measures such as rotating guards, hiring more personnel in potabilization plants, and stricter water quality controls may have exerted a positive influence although no specific control measures were implemented for this variable. According to Table 4, anomalous chlorine levels represent 2% of the total chlorine data from 2011 to 2017, and Figure 6 shows a peak of 22 anomalous chlorine data in January 2015. This variable is relatively sensitive and must be carefully controlled, as any low chlorine concentration exposes a significant number of users to potential microbiological hazards.
No fluctuations were observed in E. coli during the study period. According to Table 3, anomalous E. coli values accounted for 0.42% of the total data from 2011 to 2017, and an average of 1.7 anomalous values was observed during this entire period. Directly related control measures were taken, including restrictions to domestic animals and livestock, infrastructure improvements, increased security in catchment areas, continuous monitoring, and permanent staff at treatment plants, among others. E. coli is sensitive to chlorination, but high turbidity can also compromise the disinfection process [37]. Chlorination is also not sufficient to remove pathogens such as protozoa. Recent publications also indicate that evaluating the efficiency of water treatment based only on fecal indicator groups may misjudge the risk since other pathogens may be present even if coliform bacteria are not present [39]. In Salta Province, a quantitative microbiological risk assessment (QMRA) detected the presence of Giardia spp. in chlorinated drinking water, while E. coli was not present [37]. E. coli may not be the appropriate indicator to verify the effectiveness of WSP in our case study or in other cases where chlorination is well-controlled.

3.2.3. Limitations and Challenges

As mentioned in the introduction, there are previous studies that have examined the outcomes of implementing a WSP. However, the evidence is still limited, and there is no unified or standardized methodology for how the verification of a WSP should be conducted. Gunnarsdottir et al. [40] refer to a study in Iceland, one of the first countries to legislate the use of WSP, which allowed for the analysis of more than a decade of data on the impact of WSP. They compared sites with and without WSP implementation and also compared the values of variables before and after implementation. Significant compliance and public health impact benefits of WSP implementation were found. Setty et al. [41] conducted a verification of WSP and concluded that WSP improved water quality and led to a decrease in gastroenteritis at one of the sites studied. Setty et al. [26] also extended the earlier study using time series and recognized that implementation of a WSP is associated with improvements in water management and thus public health by controlling hazards such as precipitation events and turbidity spikes. For example, they found that at one study site, the rate of acute gastroenteritis increased by 9.6% for every 0.1 NTU increase in the monthly average, which is not comparable to the turbidity levels in Salta’s baseline data. Recently, a time-series study was published [27,42,43] in which turbidity data from two years in Italy were analyzed to extrapolate with epidemiologic gastroenteritis events. What stands out in this study are the turbidity values observed in the time series, which in no case exceeded the value of 1 NTU. This situation is difficult to imagine in Salta. As can be seen in Figure 4, the turbidity levels in the rainy season exceed the maximum value of 3 UNT [33] established by law at the national level, and only 2% of the total complaints represent water quality complaints. A whole process of change of mentality is needed among the company, the regulators, and even the consumers so that the values registered in Salta are considered as serious as they really are. A significant decrease in customer complaints related to water quality was demonstrated in [28] during a 5-year WSP implementation. Although such benefits were not conclusively found in this study, it is possible to consider time-series analysis as an appropriate method to test the effectiveness of a WSP.
During the 5 years of the WSP in Salta, a certain degree of inertia was observed perhaps because the perceived decrease in risk was misinterpreted as continuous improvement. We believe that WSPs should focus more on recurring problems such as the presence of E. coli, poor chlorination, high turbidity, complaints, and water cuts. Control measures and monitoring should then be aimed at minimizing these specific hazards rather than focusing on general risk values.
The implementation of WSPs by water utilities is still voluntary, which is perhaps one of the limitations to its effective implementation. In addition, the WSP reveals current problems and also the need to allocate financial resources to implement control measures, some of which may not have been considered at the time of implementing a WSP. Decision makers should be careful to include the cost of complementary technologies to enable maintenance of services, as the impact on water quality and quantity may compromise water security [44]. One of the limitations of this study was the lack of easy access to the information due to the constant change of authorities in the company and some distrust of disclosing the results although this was later resolved, knowing that this scientific analysis can lead to addressing current problems. We believe that statutory regulation of WSP implementation would provide the necessary framework for effective implementation by utilities and provide the regulator with tools for decision making. It is not easy to obtain reliable information on the implementation of WSP by private or public utilities and not even by control authorities. Therefore, it is important to identify specific quantitative variables that may be useful in evaluating the effectiveness of these plans.
To date, there has been a decade of scientific contributions addressing various aspects of the water supply failure in Salta from a dual technical-socioecological perspective [2,37,38,45,46]. However, these results should go beyond the scientific milieu. Further research could address how previous scientific studies have impacted decision making or why they have not, considering that science-based decision making must be the way to effectively and sustainably address long-standing problems and water management.
It is important that decision makers do not minimize water supply problems, especially when these have health implications. The WSP serves to reveal the problems, but it is necessary to have quantitative parameters to demonstrate its effectiveness and not just subjective or questionable assessments. If this is not done, companies could be scrutinized by scientists and public opinion in the future.

4. Conclusions

In this paper, we present an assessment of the WSP for the city of Salta, Argentina, after 5 years of implementation. We reviewed the risk-assessment methodology adopted by a water utility in Salta, Argentina, and evaluated the implementation of control measures. We then verified the effectiveness of this WSP using a time-series analysis with data from consumer complaints and water quality indicators.
This allowed us to determine that although some control measures were implemented, and a reduction in risk values was observed, it was not possible to improve long-standing water supply problems, such as the number of consumer complaints or high turbidity levels during the rainy season. To address these problems, we suggest identifying the inherent problems of each water supply system and from there considering the necessary control measures to improve the service, especially if they are long-standing problems. In addition, evaluating the effectiveness of a WSP through a time-series analysis using as indicators the number of user complaints, turbidity levels, residual chlorine, and E. coli is a useful and objective tool for long-term evaluation of the effectiveness of a WSP.
We believe that stakeholder participation, distinct from water company membership, is necessary for objective and scientifically sound decision making. Regulation of WSP implementation would provide the necessary legal framework for efficient implementation by utilities and provide the regulatory authority with tools to monitor the achievement of efficient water service.
This study provides new insights into the implementation of a WSP, particularly in the effectiveness verify phase, and it is possible that future studies will be based on the methodology used here to further advance WSP implementation. We believe that these types of studies could be very useful for policy making because of their quantitative, independent assessment of water-management strategies of private or public companies.

Supplementary Materials

The following supporting information can be downloaded at: https://www.mdpi.com/article/10.3390/w14192948/s1, Table S1: Hazardous events, control measures and compliance of the control measures in 2016 for each system.

Author Contributions

Conceptualization, methodology and writing—original draft preparation, M.S.R.-A.; formal analysis, M.S.R.-A. and M.A.I.; investigation, A.G.-L. and M.A.I.; data curation, A.G.-L.; writing—review and editing, M.A.I., M.H.W. and L.S.; supervision, L.S.; funding acquisition, M.S.R.-A. All authors have read and agreed to the published version of the manuscript.

Funding

This research was funded by CONICET (Project PUE 22920180100032CO).

Institutional Review Board Statement

Not applicable.

Data Availability Statement

Not applicable.

Acknowledgments

Some of the technical information contained in this paper was kindly provided by CoSAySa and ENRESP. Sincere thanks are extended to all who participated in the meetings and workshops.

Conflicts of Interest

The authors declare no conflict of interest. The funders had no role in the design of the study; in the collection, analyses, or interpretation of data; in the writing of the manuscript; or in the decision to publish the results.

References

  1. Gatto D’Andrea, M.L. Aplicación y Adaptación de una Metodología Estandarizada de Gestión de Riesgos en los Sistemas de Abastecimiento de Agua Potable de la Ciudad de Salta (Application and Adaptation of a Standardized Risk Management Methodology in the Drinking Water Supply Systems of the City of Salta). Ph.D. Thesis, Facultad de Ciencias Naturales, Universidad Nacional de Salta, Salta, Argentina, 2012; p. 100. (In Spanish). [Google Scholar]
  2. Seghezzo, L.; Gatto D’Andrea, M.L.; Iribarnegaray, M.A.; Liberal, V.I.; Fleitas, A.; Bonifacio, J.L. Improved risk assessment and risk reduction strategies in the Water Safety Plan (WSP) of Salta, Argentina. Water Sci. Technol. Water Supply 2013, 13, 1080–1089. [Google Scholar] [CrossRef]
  3. WHO (World Health Organization). Guidelines for Drinking-Water Quality, 3rd ed.; World Health Organization: Geneva, Switzerland, 2004. [Google Scholar]
  4. IWA. Bonn Charter for Safe Drinking Water; International Water Association: London, UK, 2004. [Google Scholar]
  5. WHO (World Health Organization). Guidelines for Drinking-Water Quality, 4th Edition, Incorporating the 1st Addendum. 2017. Available online: https://apps.who.int/iris/bitstream/handle/10665/254637/9789241549950-eng.pdf;jsessionid=129B614988B395796D1B6A99AA126B0C?sequence=1 (accessed on 13 October 2020).
  6. Bartram, J.; Corrales, L.; Davison, A.; Deere, D.; Drury, D.; Gordon, B.; Howard, G.; Rinehold, A.; Stevens, M. Manual para el Desarrollo de planes de Seguridad del Agua: Metodología Pormenorizada de Gestión de Riesgos para Proveedores de Agua de Consumo (Water Safety Plan Manual: Step-by-step Risk Management for Drinking-water Suppliers). 2009. Available online: https://apps.who.int/iris/handle/10665/75142 (accessed on 13 September 2022). (In Spanish).
  7. WHO. Water Safety Planning for Small Community Water Supplies: Step-by-step Risk Management Guidance for Drinking-Water Supplies in Small Communities; World Health Organization: Geneva, Switzerland, 2012. [Google Scholar]
  8. Rickert, B.; Schmoll, O.; Rinehold, A.; Barrenberg, E. Water Safety Plan: A Field Guide to Improving Drinking-water Safety in Small Communities. World Health Organization, 2014. Regional Office for Europe. Available online: https://apps.who.int/iris/handle/10665/329537 (accessed on 29 January 2022).
  9. WHO. Global Status Report on Water Safety Plans: A Review of Proactive Risk Assessment and Risk Management Practices to Ensure the Safety of Drinking-Water; World Health Organization: Geneva, Switzerland, 2017. [Google Scholar]
  10. Sutherland, D. Observations and lessons learnt from more than a decade of water safety planning in South-East Asia. WHO South-East Asia J. Public Health 2017, 6, 27. [Google Scholar] [CrossRef] [PubMed]
  11. Tsoukalas, D.S.; Tsitsifli, S. A critical evaluation of Water Safety Plans (WSPs) and HACCP implementation in water utilities. In Multidiscip. Digit. Publ. Inst. Proc. 2018, 2, 600. [Google Scholar]
  12. Kanyesigye, C.; Marks, S.J.; Nakanjako, J.; Kansiime, F.; Ferrero, G. Status of water safety plan development and implementation in Uganda. Int. J. Environ. Res. Public Health 2019, 16, 4096. [Google Scholar] [CrossRef]
  13. Kayser, G.; Loret, J.F.; Setty, K.; Blaudin De Thé, C.; Martin, J.; Puigdomenech, C.; Bartram, J. Water safety plans for water supply utilities in China, Cuba, France, Morocco and Spain: Costs, benefits, and enabling environment elements. Urban Water J. 2019, 16, 277–288. [Google Scholar] [CrossRef]
  14. Gunnarsdottir, M.J.; Gardarsson, S.M.; Figueras, M.J.; Puigdomènech, C.; Juárez, R.; Saucedo, G.; Arnedo, M.J.; Santos, R.; Monteiro, S.; Avery, L.; et al. Water safety plan enhancements with improved drinking water quality detection techniques. Sci. Total Environ. 2020, 698, 134185. [Google Scholar] [CrossRef]
  15. Li, H.; Smith, C.D.; Cohen, A.; Wang, L.; Li, Z.; Zhang, X.; Zhang, R. Implementation of water safety plans in China: 2004–2018. Int. J. Hyg. Environ. Health 2020, 223, 106–115. [Google Scholar] [CrossRef]
  16. String, G.M.; Singleton, R.I.; Mirindi, P.N.; Lantagne, D.S. Operational research on rural, community-managed Water Safety Plans: Case study results from implementations in India, DRC, Fiji, and Vanuatu. Water Res. 2020, 170, 115288. [Google Scholar] [CrossRef]
  17. Mudaliar, M.M. Success or failure: Demonstrating the effectiveness of a Water Safety Plan. Water Supply 2012, 12, 109–116. [Google Scholar] [CrossRef]
  18. Ferrero, G.; Setty, K.; Rickert, B.; George, S.; Rinehold, A.; DeFrance, J.; Bartram, J. Capacity building and training approaches for water safety plans: A comprehensive literature review. Int. J. Hyg. Environ. Health 2019, 222, 615–627. [Google Scholar] [CrossRef]
  19. Kishipour, A.; Mostafaloo, R.; Mehdipour Rabori, M.; Ghordouei-Milan, E.; Hosseini, F.; Aali, R. Experience of implementing Water Safety Plan in Iran: A systematic review. J. Environ. Health Sustain. Dev. 2021, 6, 1243–1255. [Google Scholar] [CrossRef]
  20. Ferrero, G.; Bichai, F.; Rusca, M. Experiential learning through role-playing: Enhancing stakeholder collaboration in Water Safety Plans. Water 2018, 10, 227. [Google Scholar] [CrossRef]
  21. Mayr, E.; Lukas, A.; Aichlseder, W.; Perfler, R. Experiences and lessons learned from practical implementation of a software-supported water safety plan (WSP) approach. Water Sci Technol Water Supply. 2012, 12, 101–108. [Google Scholar] [CrossRef]
  22. Kumpel, E.; Delaire, C.; Peletz, R.; Kisiangani, J.; Rinehold, A.; De France, J.; Khush, R. Measuring the impacts of water safety plans in the Asia-Pacific region. Int. J. Environ. Res. Public Health 2018, 15, 1223. [Google Scholar] [CrossRef]
  23. Baum, R.; Bartram, J. A systematic literature review of the enabling environment elements to improve implementation of water safety plans in high-income countries. J. Water Health 2018, 16, 14–24. [Google Scholar] [CrossRef]
  24. Hasan, H.; Parker, A.; Pollard, S.J.T. Whither regulation, risk and water safety plans? Case studies from Malaysia and from England and Wales. Sci. Total Environ. 2021, 755, 142868. [Google Scholar] [CrossRef]
  25. Roeger, A.; Tavares, A.F. Do governance arrangements affect the voluntary adoption of water safety plans? An empirical study of water utilities in Portugal. Water Resour. Manag. 2020, 34, 1757–1772. [Google Scholar] [CrossRef]
  26. Setty, K.E.; Enault, J.; Loret, J.F.; Serra, C.P.; Martin-Alonso, J.; Bartram, J. Time series study of weather, water quality, and acute gastroenteritis at Water Safety Plan implementation sites in France and Spain. Int. J. Hyg. Environ. Health 2018, 221, 714–726. [Google Scholar] [CrossRef]
  27. Muoio, R.; Caretti, C.; Rossi, L.; Santianni, D.; Lubello, C. Water safety plans and risk assessment: A novel procedure applied to treated water turbidity and gastrointestinal diseases. Int. J. Hyg. Environ. Health 2020, 223, 281–288. [Google Scholar] [CrossRef]
  28. Setty, K.; O’Flaherty, G.; Enault, J.; Lapouge, S.; Loret, J.; Bartram, J. Assessing operational performance benefits of a Water Safety Plan implemented in Southwestern France. Perspect. Public Health 2018, 138, 270–278. [Google Scholar] [CrossRef]
  29. Ente Regulador de Servicios Sanitarios. Provincia de Santa Fe. Resolución No. 1008 (Sanitary Services Regulatory Entity. Province of Santa Fe. Resolution No. 1008). 2016. Available online: http://www.enress.gov.ar/wp-content/uploads/2017/05/1008_GuiaPracticaPlandeAguaSegura-1.pdf (accessed on 9 November 2010). (In Spanish)
  30. Agua y Saneamientos Argentinos. Reporte de Sustentabilidad (Argentine Water and Sanitation. Sustainability Report). 2011. Available online: https://www.aysa.com.ar/media-library/rse/RSE_2011.pdf (accessed on 11 November 2020). (In Spanish).
  31. Arias, M.; Bianchi, A.R. Estadísticas Climatológicas de la Provincia de Salta. Dirección de Medio Ambiente y Recursos Naturales de la Provincia de Salta. Estación Experimental Agropecuaria Salta, INTA (Climate statistics of the province of Salta. Department of Environment and Natural Resources of the Province of Salta. Salta Agricultural Experimental Station, INTA); INTA: Salta, Argentina, 1996; p. 189. (In Spanish) [Google Scholar]
  32. Bossel, H. Indicators for Sustainable Development: Theory, Method, Applications. A report to the Balaton Group; International Institute for Sustainable Development (IISD): Winnipeg, MB, Canada, 2019. [Google Scholar]
  33. Código Alimentario Argentino. Capítulo XII, Bebidas Hídricas, Agua y Agua Gasificada (Argentine Food Code. Chapter XII, Hydrous Drinks, Water and Carbonated Water). 2019. Available online: http://www.anmat.gov.ar/alimentos/normativas_alimentos_caa.asp (accessed on 10 June 2019). (In Spanish)
  34. Chang, H. Spatial analysis of water quality trends in the Han River basin, South Korea. Water Res. 2008, 42, 3285–3304. [Google Scholar] [CrossRef]
  35. Kisi, O.; Ay, M. Comparison of Mann–Kendall and innovative trend method for water quality parameters of the Kizilirmak River, Turkey. J. Hydrol. 2014, 513, 362–375. [Google Scholar] [CrossRef]
  36. Sun, S.; Barraud, S.; Castebrunet, H.; Aubin, J.B.; Marmonier, P. Long-term stormwater quantity and quality analysis using continuous measurements in a French urban catchment. Water Res. 2015, 85, 432–442. [Google Scholar] [CrossRef]
  37. Rodriguez-Alvarez, M.S.; Weir, M.H.; Pope, J.M.; Seghezzo, L.; Rajal, V.B.; Salusso, M.M.; Moraña, L.B. Development of a relative risk model for drinking water regulation and design recommendations for a peri urban region of Argentina. Int. J. Hyg. Environ. Health 2015, 218, 627–638. [Google Scholar] [CrossRef]
  38. Iribarnegaray, M.A.; D’Andrea ML, G.; Rodriguez-Alvarez, M.S.; Hernández, M.E.; Brannstrom, C.; Seghezzo, L. From indicators to policies: Open sustainability assessment in the water and sanitation sector. Sustainability 2015, 7, 14537–14557. [Google Scholar] [CrossRef]
  39. Mraz, A.L.; Tumwebaze, I.K.; McLoughlin, S.R.; McCarthy, M.E.; Verbyla, M.E.; Hofstra, N.; Rose, J.B.; Murphy, H.M. Why pathogens matter for meeting the united nations’ sustainable development goal on safely managed water and sanitation. Water Res. 2021, 189, 116591. [Google Scholar] [CrossRef]
  40. Gunnarsdottir, M.J.; Gardarsson, S.M.; Elliott, M.; Sigmundsdottir, G.; Bartram, J. Benefits of water safety plans: Microbiology, compliance, and public health. Environ. Sci. Technol. 2012, 46, 7782–7789. [Google Scholar] [CrossRef]
  41. Setty, K.E.; Kayser, G.L.; Bowling, M.; Enault, J.; Loret, J.F.; Serra, C.P.; Alonso, J.M.; Mateu, A.P.; Bartram, J. Water quality, compliance, and health outcomes among utilities implementing Water Safety Plans in France and Spain. Int. J. Hyg. Environ. Health 2017, 220, 513–530. [Google Scholar] [CrossRef]
  42. Setty, K.E.; Bartram, J.; De Roos Anneclaire, J.; Beaudeau, P. Letter to the Editor: Water safety plans and risk assessment: A novel procedure applied to treated water turbidity and gastrointestinal diseases. Int. J. Hyg. Environ. Health 2020, 229, 113435. [Google Scholar] [CrossRef] [PubMed]
  43. Muoio, R.; Caretti, C.; Rossi, L.; Santianni, D.; Lubello, C. Letter to the Editor: Water safety plans and risk assessment: A novel procedure applied to treated water turbidity and gastrointestinal diseases. Int. J. Hyg. Environ. Health 2020, 229, 113455. [Google Scholar] [CrossRef] [PubMed]
  44. Giannetti, B.F.; Sevegnani, F.; García, R.R.M.; Agostinho, F.; Almeida, C.M.V.B.; Coscieme, L.; Liu, G.; Lombardi, G.V. Enhancing the assessment of cleaner production practices for sustainable development: The five-sector sustainability model applied to water and wastewater treatment companies. Sustainability 2022, 14, 4126. [Google Scholar] [CrossRef]
  45. Iribarnegaray, M.A.; Seghezzo, L. Governance, sustainability and decision making in water and sanitation management systems. Sustainability 2012, 4, 2922–2945. [Google Scholar] [CrossRef]
  46. Clavijo, A.; Iribarnegaray, M.A.; Rodriguez-Alvarez, M.S.; Seghezzo, L. Closing the cycle? Potential and limitations of Water and Sanitation Safety Plans (WSSPs) for Latin American metropolitan areas. J. Water Sanitation Hyg. Dev. 2020, 10, 490–501. [Google Scholar] [CrossRef]
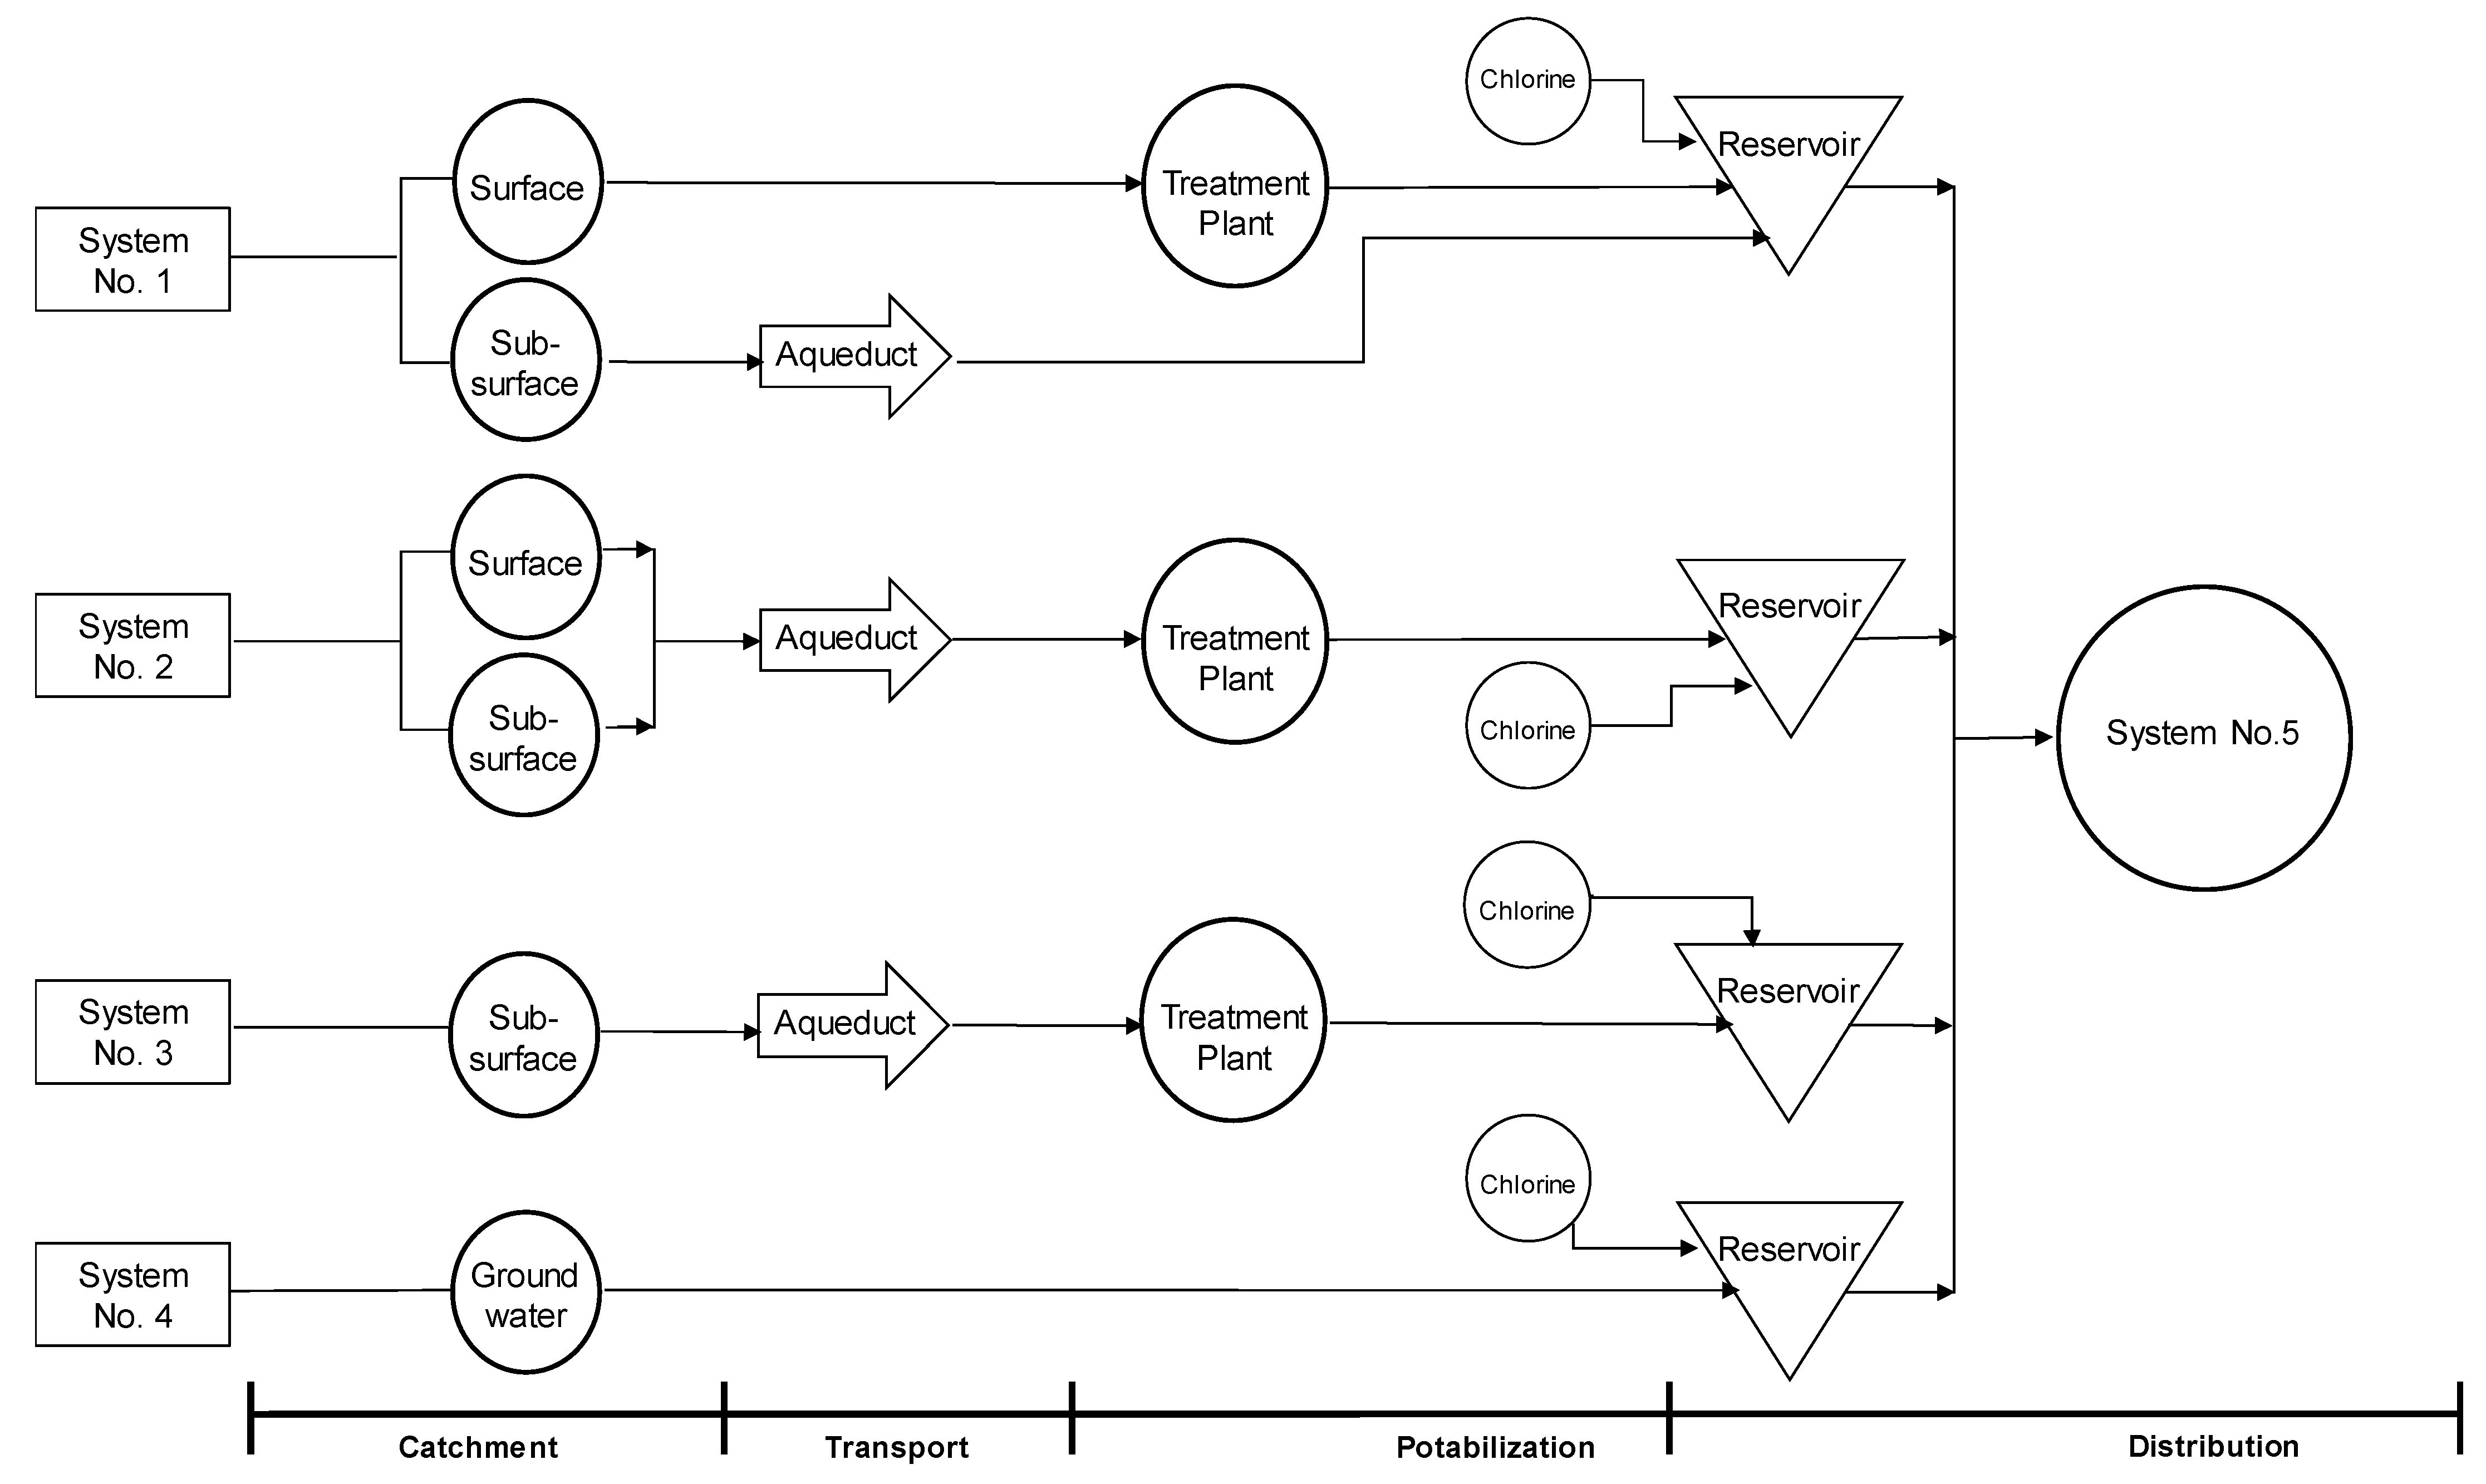
Figure 1. Flow diagram of the water system of the city of Salta. The processes are indicated below the bottom line.
Water 14 02948 g001
Figure 2. Risks of the individual processes of each system: (a) System No. 1; (b) System No. 2; (c) System No. 3; (d) System No. 4; and (e) System No. 5. Dotted line: target risk (24%).
Water 14 02948 g002
Figure 3. Time-series analysis of complaints. (a) City of Salta; (b) System No. 1; and (c) System No. 2. The date format for the x-axis is month-year. Significant shifts and their values from Pettit analysis are indicated by μ1 (dotted line) and μ2 (dashed line).
Water 14 02948 g003
Figure 4. City of Salta. Mann–Kendall analysis for turbidity. (a) Analysis using all available turbidity data; (b) Amount of values greater than 3 NTU per month per year. The trend line is shown in dark grey.
Water 14 02948 g004
Figure 5. System No. 2. (a) Time-series analysis for turbidity values; (b) Number of values greater than 3 NTU per month per year. Significant shifts in the means values from the Pettit analysis are indicated by (dotted line) and μ2 (dashed line).
Water 14 02948 g005
Figure 6. City of Salta. Pettit analysis for residual chlorine values. Significant shifts in mean values from Pettit analysis are indicated by (dotted line) and μ2 (dashed line).
Water 14 02948 g006
Table 1. Variables and data analysis methods used in this study.
ParametersData Used PeriodSystemsMethod
ComplaintsNumber of complaints2011–2017Salta city/System No. 1/System No. 2MKT-PT
TurbidityAll available data 2011–2017Salta city/System No. 1/System No. 2MKT-PT
TurbidityNumber of deviations (turbidities greater than 3 NTU) per month per year2011–2017Salta city/System No. 1/System No. 2MKT-PT
ChlorineAmount of deviations (chlorine values less than 0.2 mg/L) per month per year2011–2017Salta cityMKT-PT
E. coliAll available data2011–2017Salta cityMKT-PT
Table 2. Summary of systems, sub-processes, number of hazardous events, and number of control measures.
SystemsSub-ProcessesNumber of Hazardous Events in Each Sub-ProcessNumber of Control Measures in Each System
System No. 1Sub-surface catchment
Surface catchment
Transport
Potabilization
5
11
4
8
26
System No. 2Sub-surface catchment
Surface catchment
Transport
Potabilization
9
7
8
7
25
System No. 3Sub-surface catchment Transport
Potabilization
7
6
2
11
System No. 4Groundwater catchment
Potabilization
9
5
18
System No. 5Distribution1020
TOTAL14 sub-processes98 hazardous events100 control measures
Table 3. Example of risk calculation for two hazards.
Hazards (i)Control Measures (j) I i , j C i , j , n X i , 0 X i , n
1. Recreational misuse1. Fence in the catchment area. I 11 = 50% C 111 = 100% X 10 = 47% X 11 = 7%
2. Work in cooperation with the competent entity to establish access restrictions in the catchment areas. I 12 = 50% C 121 = 70%
2. Domestic and livestock animals1. Agreeing on the regulation of livestock with the manager of the protected area. I 21 = 5% C 211 = 50% X 20 = 100% X 21 = 92%
2. Housing of livestock in suitable areas. I 22 = 20% C 221 = 0%
3. Fencing in of the catchment area. I 23 = 5% C 231 = 100%
4. Construction of a new water-treatment plant. I 24 = 70% C 241 = 0%
Table 4. Available and deviated data (years 2011–2017).
SystemTurbidity DataResidual Chlorine DataE. coli Data
Available>3 UNTAvailable<0.2 mg/LAvailablePresence of E. coli
Salta city35,341224735,57778634,831145
System No.1 1297432132040126811
System No.210852031129410605
Publisher’s Note: MDPI stays neutral with regard to jurisdictional claims in published maps and institutional affiliations.