Article

Response of the Headcut Erosion Process to Flow Energy Variation in the Loess Gully Region of China

1
School of Environment and Resources, Taiyuan University of Science and Technology, Taiyuan 030024, China
2
State Key Laboratory of Soil Erosion and Dryland Farming on the Loess Plateau, Institute of Soil and Water Conservation, Northwest A&F University, Xianyang 712100, China
3
Institute of Soil and Water Conservation, Chinese Academy of Sciences and Ministry of Water Resources, Xianyang 712100, China
*
Author to whom correspondence should be addressed.
Water 2022, 14(19), 3038; https://doi.org/10.3390/w14193038
Submission received: 30 June 2022 / Revised: 3 September 2022 / Accepted: 23 September 2022 / Published: 27 September 2022
(This article belongs to the Section Soil and Water)

Abstract

:
In the headcut erosion process, flow energy is transformed and consumed when runoff is used to transport sediment. Therefore, flow energy variations are critical in the study of headcut erosion. The aim of this study was to illustrate the effects of the upslope inflow discharge and slope gradient on flow energy and the response of the sediment yield of headcut erosion to flow energy variations in China’s Loess Plateau. This study examined the headcut erosion using slope gradients ranging from 1° to 7° and designed and upslope inflow discharges of 3.6, 4.8, 6.0 and 7.2 m3·h−1. The rainfall intensity was set as invariable 0.8 mm·min−1. The results showed that the kinetic energy at the downstream gully bed was 0.03~0.16 J·s−1 lower than that in the upstream catchment area because of the concentrated flow drop at the gully head. The potential energy at the summit and bottom of the plot were both affected by upstream inflow discharge and slope gradient. The flow energy consumption values of the gully head increased by approximately 1.26 times as the inflow discharge increased by 1.2 m3·h−1. Greater energy consumption occurred at the gully head than in the upstream catchment area and downstream gully bed, and the gully head contribution to the flow energy consumption was 44.30~64.29%, which showed an increasing trend as the upslope inflow discharge increased and slope gradient decreased. The influence of the slope gradient on the sediment yield was stronger than that of the upslope inflow discharge, and a nonlinear regression equation was established to calculate the sediment yield. The flow energy consumption showed a significant correlation with the sediment yield (p < 0.01). Our results could enhance the understanding of the flow energy variations and headcut evolution process during headcut erosion and can also be helpful in the design of gully erosion prevention measures.

1. Introduction

The loess gully region covers an area of approximately 14.8 × 10³ km2 in the northern Loess Plateau and is a vulnerable ecological environment area in China [1,2,3]. Because of low vegetation coverage, frequent rainstorms and drastic land-use changes [4], headcut erosion is the major sediment source in the loess gully region and represents a serious threat to soil resources, agricultural productivity and sustainable development [5,6]. The gully head number is 0.391–0.518 per square kilometer in the loess gully region [7]. A headcut refers to a sudden change in bed elevation, and at a headcut, intense erosion, referred to as headcut erosion, occurs due to the jet impact from the upstream area [8,9]. Headcut erosion is mainly caused by erosion driven by water and gravity, the latter of which mainly causes slope instability, in which a gully is the major pathway for sediment delivery to surface water [10,11]. Flow energy provides the power for headcut erosion, and sediment yield is an important index for expressing erosion intensity. The study of flow energy variations in the headcut erosion process is very helpful for thoroughly revealing the processes and mechanisms associated with headcut erosion and can provide scientific support for controlling headcut erosion.
The development of erosion gullies on the Loess Plateau largely includes headcut erosion of the gully head, lateral erosion of the gully slope and vertical incised erosion at the gully bottom. Headcut erosion indicates that when rainfall produces runoff, surface runoff flows from high to low areas, while the gully head advances from low to high areas, i.e., opposite directions. Much of the head collapses and advances in the shape of waterfalls, continuously eroding the upstream area. Headcut erosion is the main process of valley erosion [8,12,13]. The result of gully erosion is an increase in gully length. The gully head refers to the area where the elevation suddenly changes and local erosion occurs [12,14]. Headcut erosion mainly occurs in two ways: (1) runoff erodes the gully head, causing collapse; (2) upstream water in the catchment area is discharged, and soil remains above the water outflow position due to erosion.
Many studies on headcut erosion have focused on erosion processes and their influencing factors. In America, some researchers [8,15,16,17,18,19,20,21,22] have illustrated the effects of the overland upslope inflow discharge, bed slope, soil characteristics (soil stratification, soil texture and pore water pressure) and initial step height on headcut erosion. In Iran, Babazadeh et al. [23] and Ashourian et al. [24] studied the headcut erosion processes under different soil consolidation types. In the dry–hot valley region of China, a systematic in situ scouring experiment was conducted to describe the headcut erosion process, and a series of significant achievements were derived [13,25,26,27,28,29,30,31,32].
In the Loess Plateau of China, a series of specific experiments was conducted by Han et al. [33] and Qin et al. [34,35] on loess slopes to analyze the headcut erosion process, and they found that the sediment yield is highly correlated with the upslope inflow discharge and that gravitational erosion events often occur when the slope gradient is more than 65°. Rudi and Theo [36] measured the largest gully headcut and estimated the quantity of loose soil material in the rolling hill region. These researchers made significant progress in understanding headcut erosion. However, the combined influence of the slope gradient and upslope inflow discharge on headcut erosion in the loess gully region remains unclear.
Soil erosion is a process in which water flow overcomes the soil’s resistance to erosion, which consumes flow energy. Runoff energy is consumed when runoff is used to transport eroded sediment [37]. When the runoff flows from the summit of the catchment area to the bottom of the gully bed, the potential energy is transformed into kinetic energy. Quantitatively characterizing the soil erosion process based on runoff energy consumption plays an important role in understanding the mechanism of the headcut erosion process. Studies on flow energy are mainly based on the energy equilibrium theory. This theory is increasingly being used to describe the soil erosion process and has been widely applied to single slope, convex composite slope and hill slope–gully slope erosional systems [13,37,38,39,40]. Li et al. [38] formulated the relationship between runoff energy consumption from the interaction between water flow and the slope bed. Therefore, the consumption of flow energy is meaningful in illustrating headcut erosion processes and worthy of further study.
In general, headcut erosion is the main producer of eroded sediment and can generate considerable damage. Many past studies have focused on headcut erosion processes in other regions, and the loess gully region has rarely been studied. In addition, no comparative research has been conducted to quantify the flow energy variations in the headcut erosion process and their relationship. This study represents an initial effort to analyze the erosion characteristics by a series of simulated rainfall-based scouring experiments. Hence, this study specifically aims to (1) evaluate the flow energy and soil loss variation during the headcut erosion process for each run and (2) clarify the impact of flow energy consumption on sediment yield.

2. Materials and Methods

2.1. Study Area

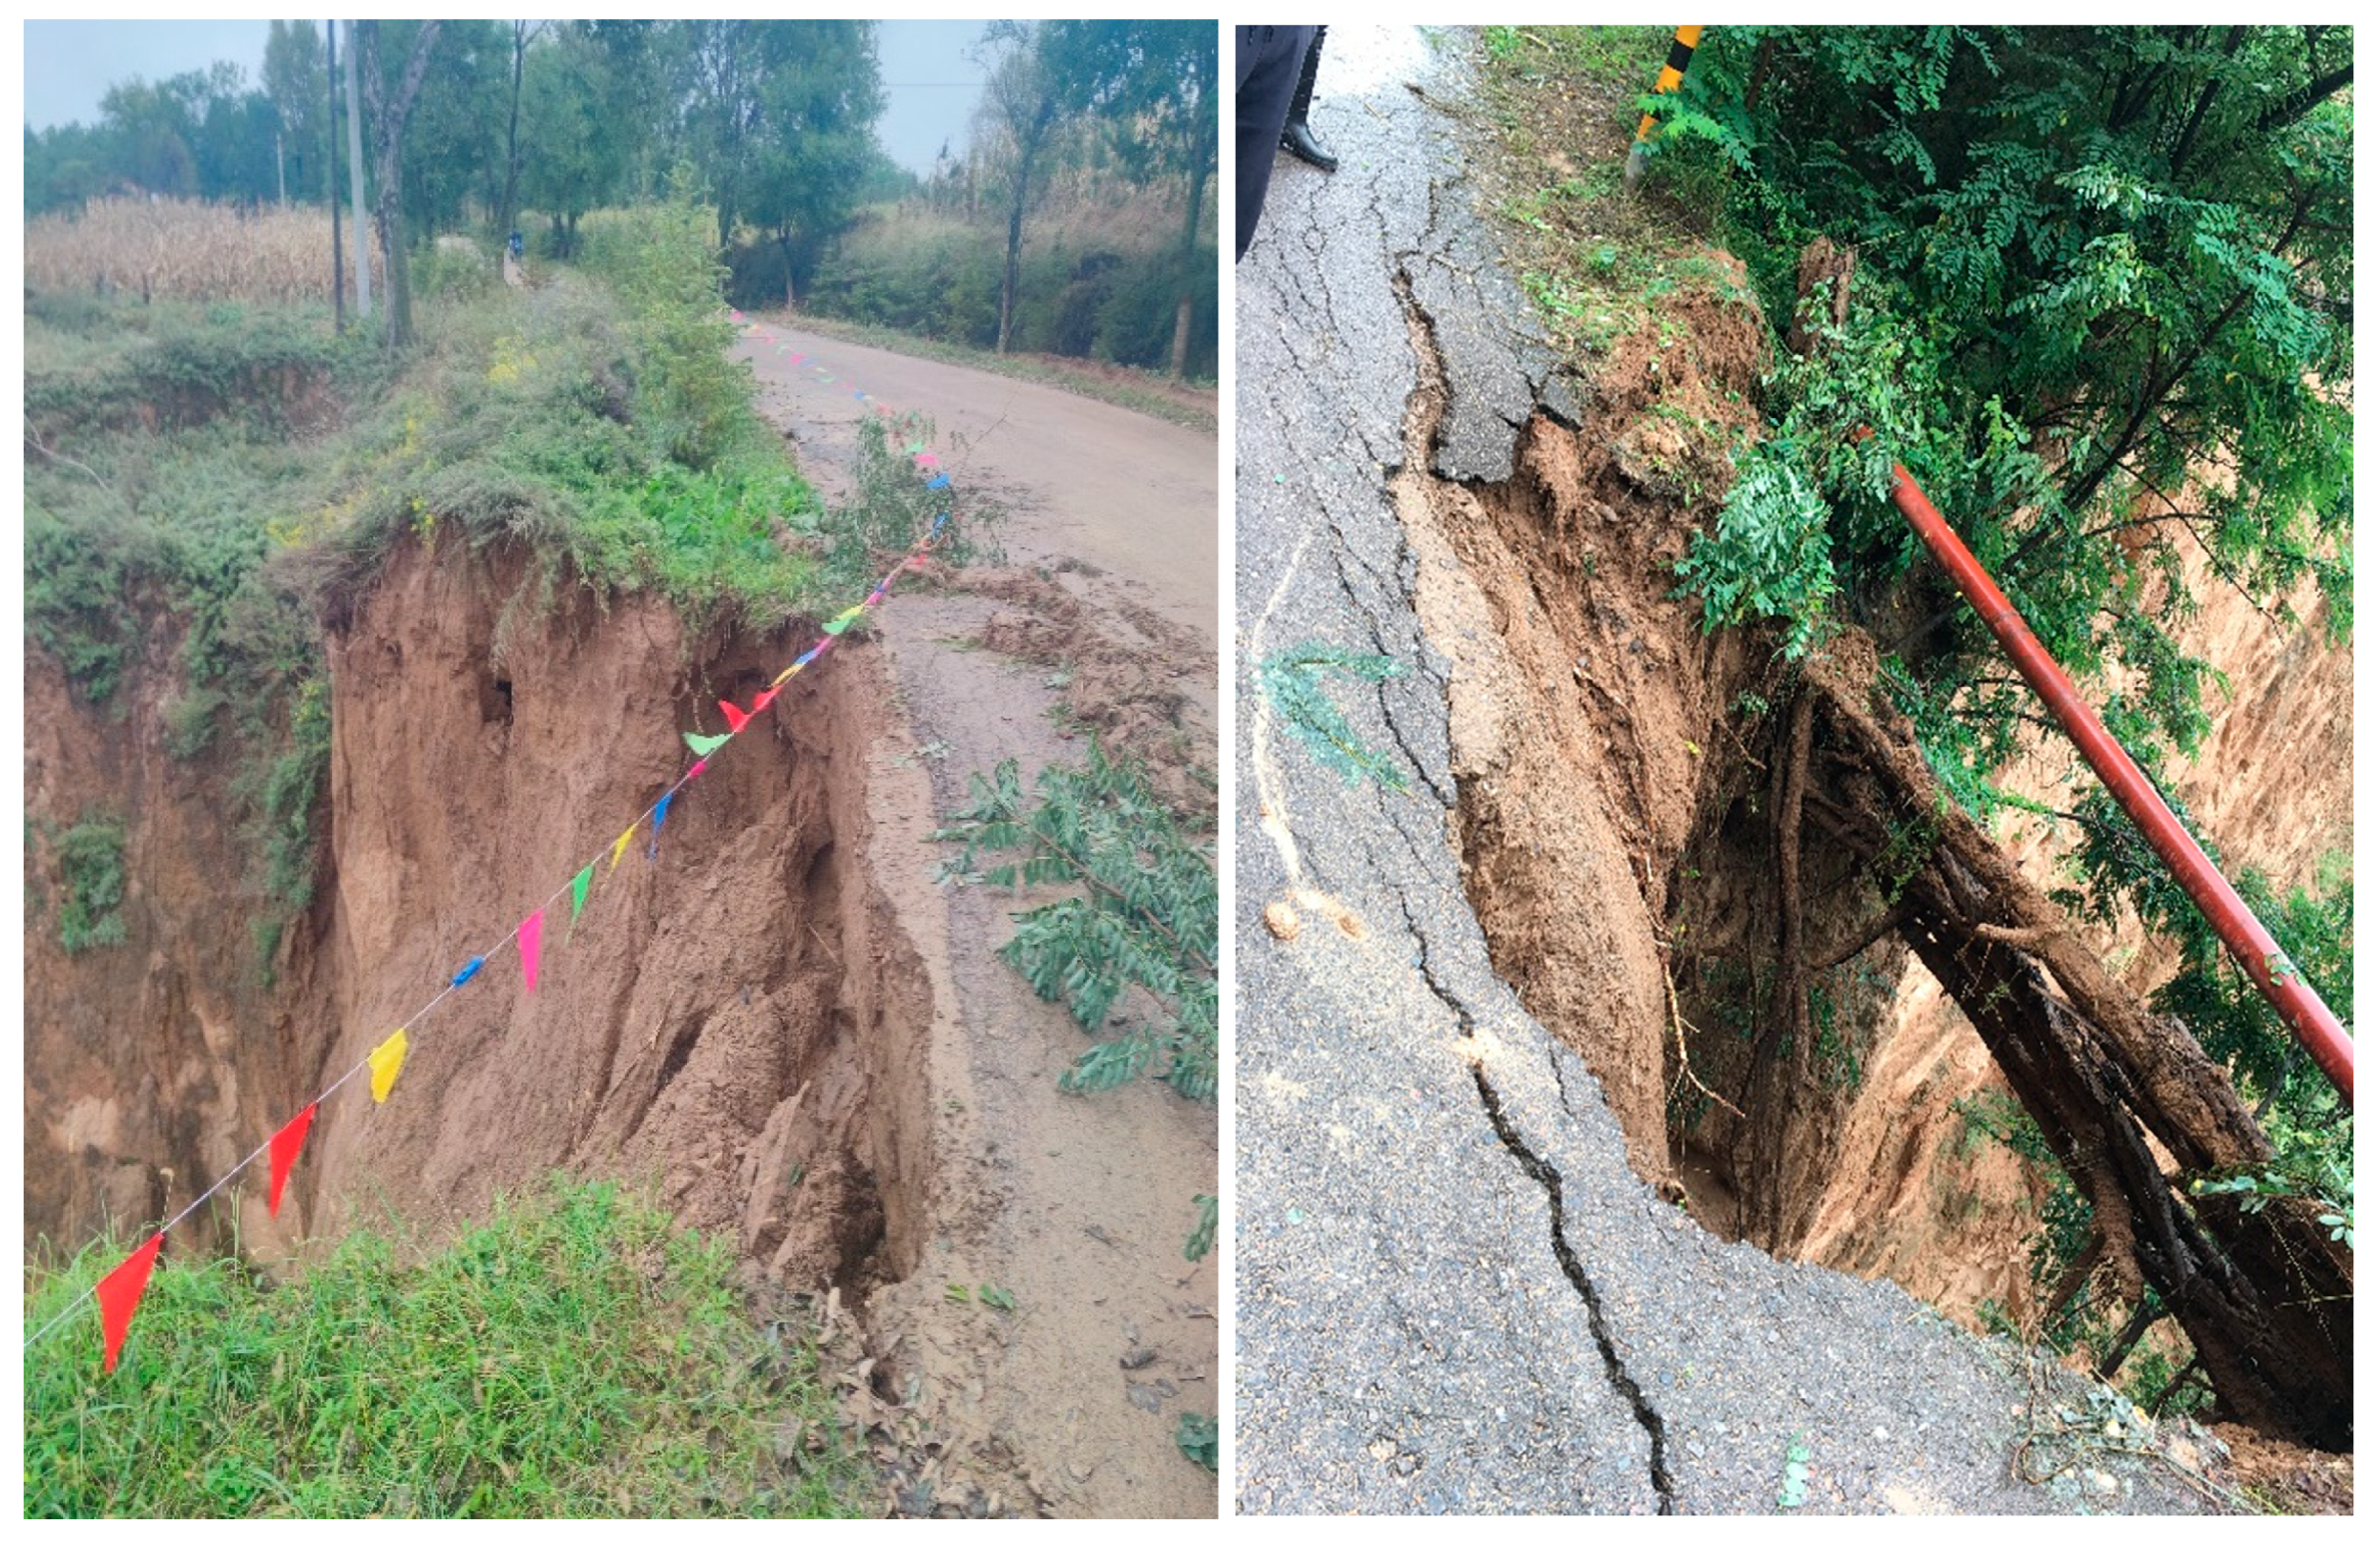
Four experiment plots were constructed in the Nanxiaohegou watershed (35°41′~35°44′ N, 107°30′~107°37′ E), a typical gully region of the Loess Plateau, which is located in Gansu Province in Northwest China (Figure 1). This area has an elevation range of 1050 to 1423 m. The study area features semiarid continental climate in a warm temperate zone. The mean annual precipitation is 557.7 mm and erosive rains usually occur from July to September. The average annual temperature is 8.7 °C, and the average annual potential evaporation is 1475 mm. The soil erosion rate is recorded as 4350 t·km−2·a−1, which accounts for most soil erosion in this area (Figure 2). The soil type in the experiment site is loam soil with 44.38% sand content, 30.61% silt content and 25.01% clay content according to the international soil quality grading standards (USDA) [41]. The major types of vegetation in this area are Robinia pseudoacacia, Platycladus orientalis, Hippophae rhamnoides, Agropyron cristatum, Bothriochloa ischaemum and others.

2.2. Experimental Design

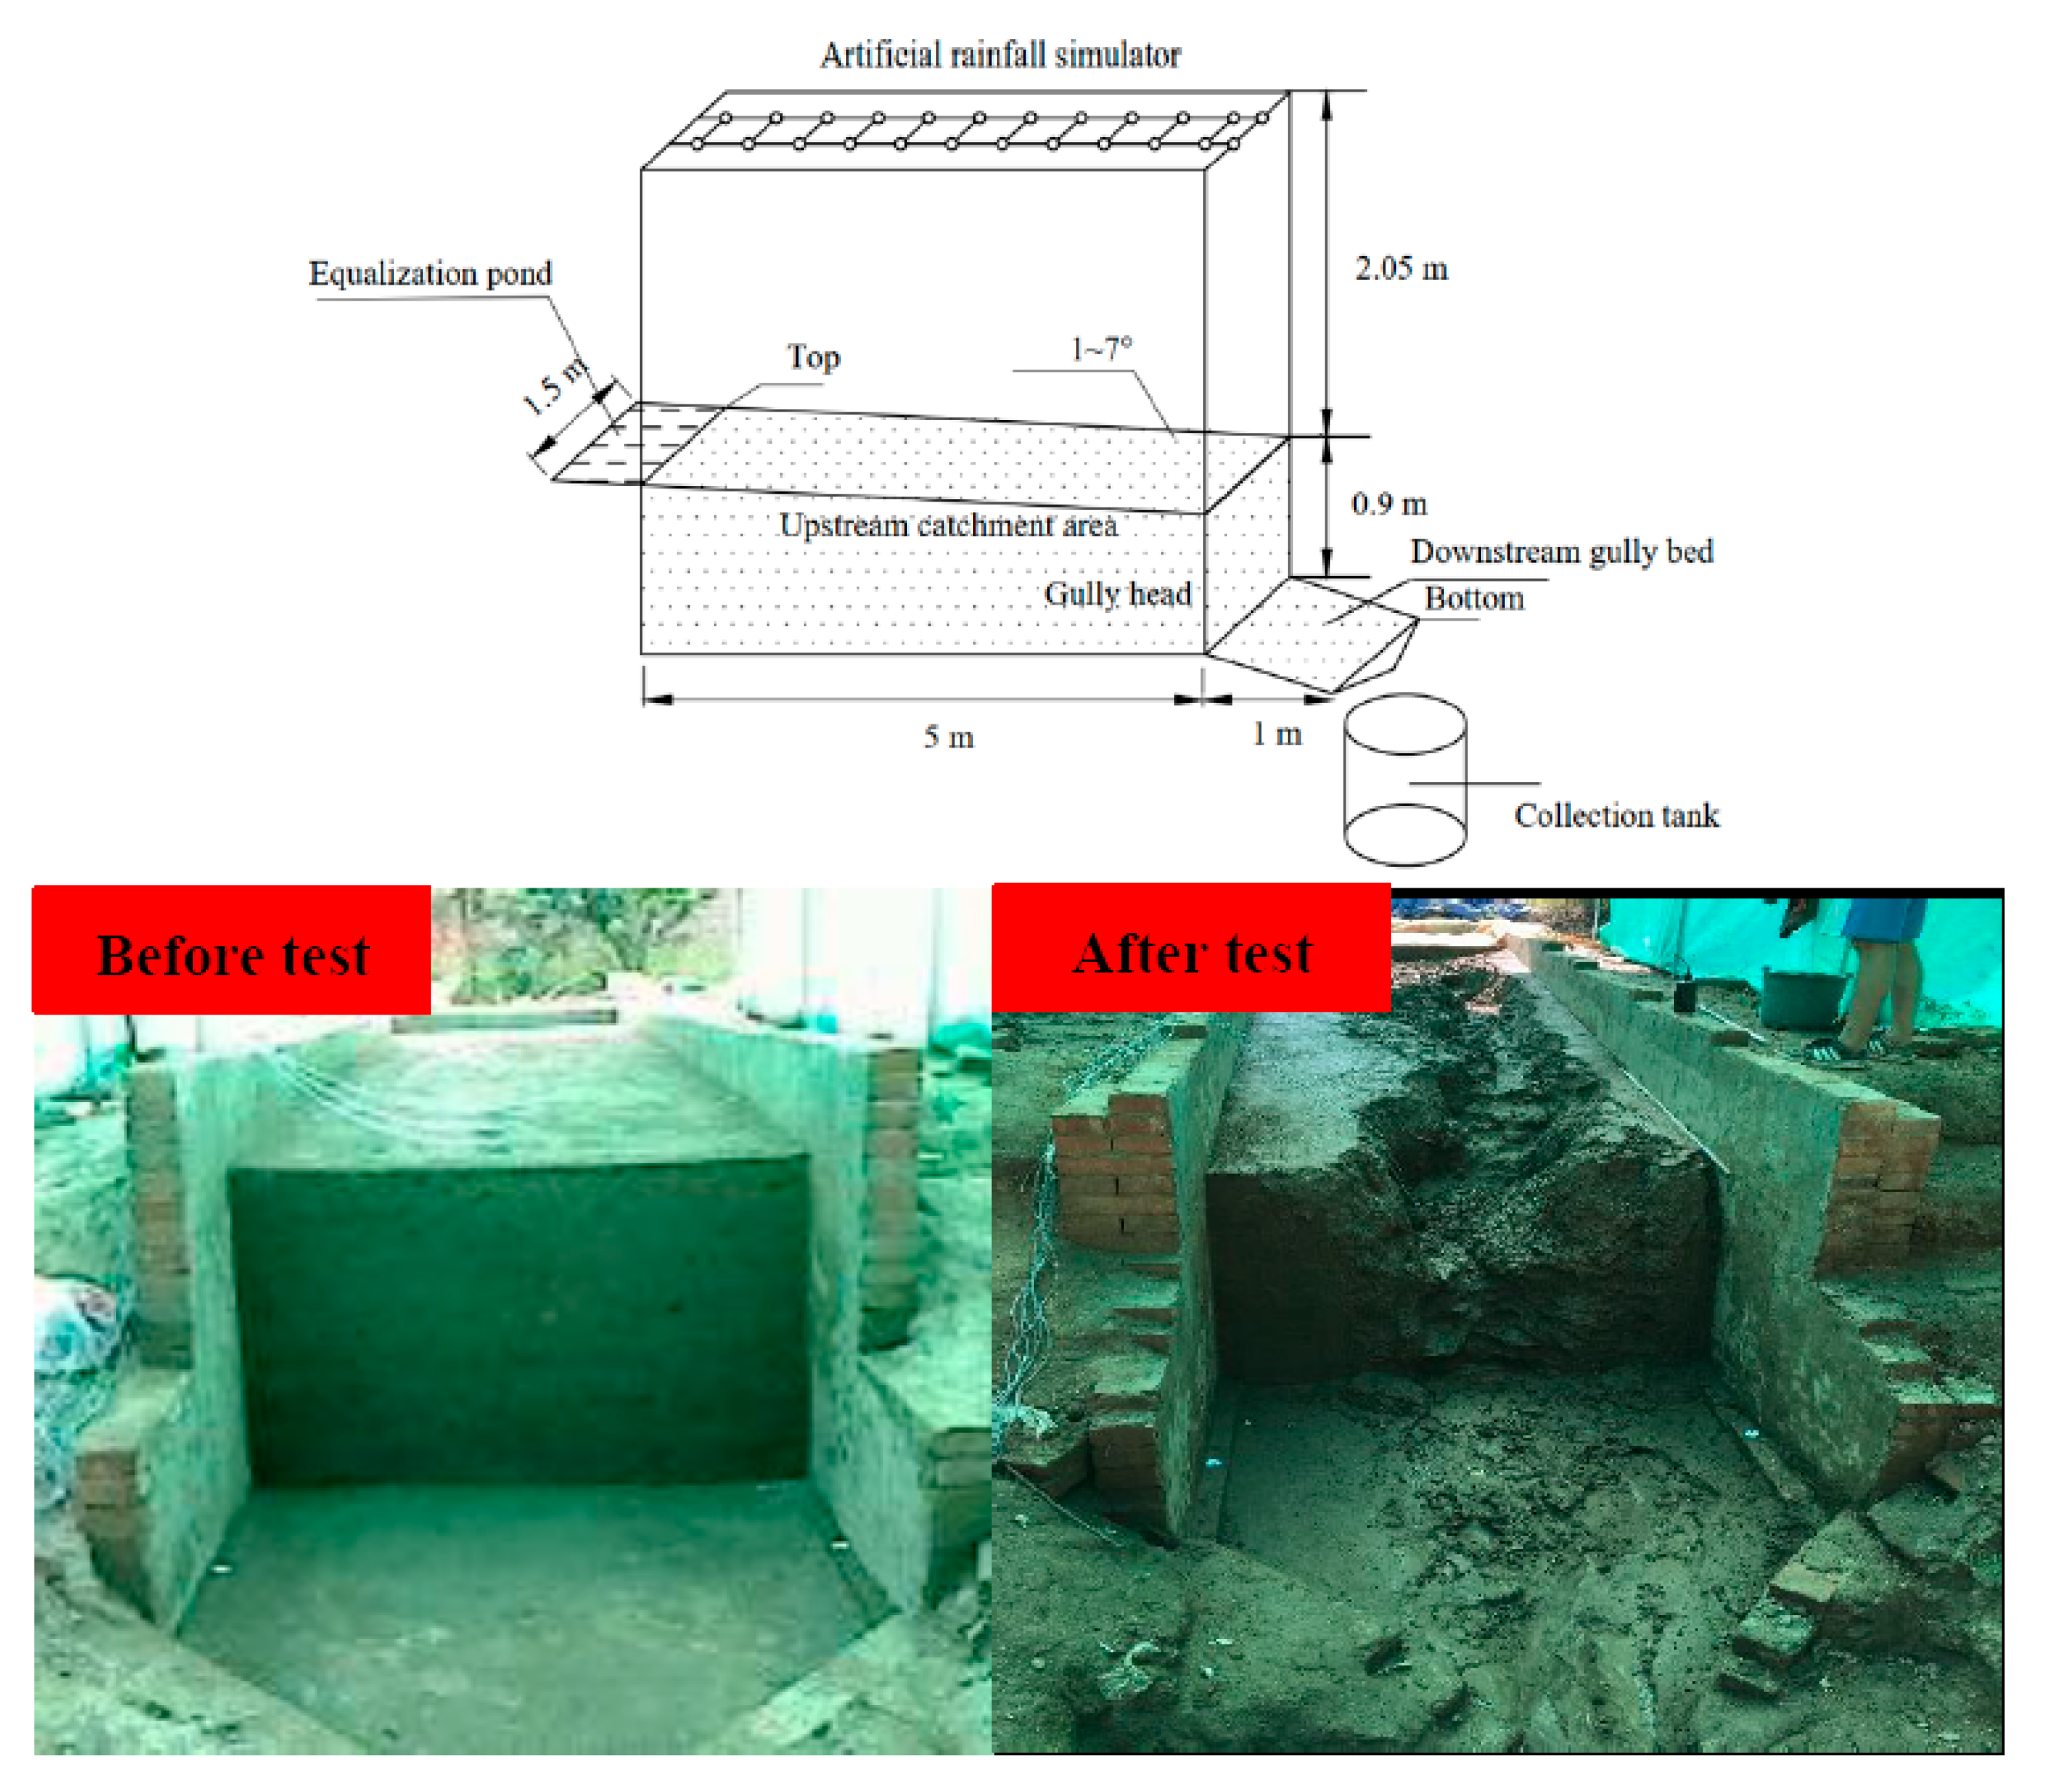
The four experimental plots were composed of an upstream catchment area, a gully head and a downstream gully bed (Figure 3). Che [42] investigated 206 gully heads in Xifeng, and the survey results showed that there are 130 gully heads with width-to-depth ratio greater than 1 in this area, accounting for 64.56% of the total investigated gully heads. The width-to-depth ratio is 1.06~5.60, so when the width of the plot is 1.5 m, the corresponding head height is 0.27~1.42 m. The average width-to-depth ratio of 130 gully heads is 1.6, so when the width of the plot is 1.5 m, the corresponding head height is 0.94 m; therefore, 0.9 m was finally selected as the design gully head height of the test plot. In conclusion, the upstream area and downstream gully beds were 5 and 1 m long, respectively, and 1.5 m wide, and the gully heads were 0.9 m height. The main landforms in the Nanxiaohegou watershed include gentle loess tableland, steep hillslopes and gully channels, and the loess tableland accounts for 57.0% [43]. The range of slope gradient on the tableland in this study area is gentle (1~7°); therefore, the slope gradient of the upstream catchment area was set to 1°, 3°, 5°and 7°, and the slope gradient of the gully bed was the same as that of the upstream catchment area. The initial intensity of rainstorm means the maximum average rainfall intensity in 5 min, which is a heavy rain standard. When the rainfall intensity is larger than the initial rainstorm intensity, the surface flow and soil erosion are initiated. The initial rainstorm intensity in 5 min was 0.78 mm·min−1 in Xifeng district, Gansu Province, located in the Loess Plateau [44]. Therefore, we selected 0.8 mm·min−1, close to 0.78 mm·min−1, as the simulated design rainfall intensity. The inflow discharge was calculated using Equation (1) that involves the runoff coefficient, storm intensity and upstream area. According to the field survey data [43], the watershed area was 0.146~3.00 km2; the width of the gully head ranged from 2 to 31 m with an average width of 13.01 m. The runoff coefficient was identified as 0.167 by analyzing the runoff and rainfall data of standard runoff plots [45]. The calculated flow discharge per unit width was 4.22~10.97 m2·h−1. For comparison with previous studies, we selected the inflow discharge as 3.6, 4.8, 6.0 and 7.2 m3·h−1. The duration of each upslope inflow discharge and slope gradient experiment was 180 min.
q = λ · A · i · d D
where q is the flow discharge per unit width (m2·h−1), λ is the runoff coefficient, A is the upstream area (m2), i is the storm rainfall intensity (mm·min−1), d is the width of the plot (m), D is the gully width of the upstream catchment area (m).
Before the test, the topsoil was stripped with a loader. Four brick solid-gully head models were built along the width direction. The soil used in this experiment was first sieved through a 10 mm sieve to remove gravel, roots and other debris, and then it was evenly mixed and compacted in the experimental plot to a depth of 90 cm (four successive 20 cm thick layers and a 10 cm thick top layer). The erosion plot was uniformly trimmed to obtain an initial erosion form that was flat and steep without inner cavities in the filling process. The soil was packed by tamping the surface and maintained at a constant bulk density of 1.27 g·cm−3; the soil moisture was controlled at 13~15%. Prior to the launch of the experiment, antecedent precipitation was applied to keep the soil moisture content about the same. Simulated rainfall and scouring experiments were unduplicated and limited by harsh experimental conditions.

2.3. Experimental Procedure

Before filling, the soil was screened to remove gravel, roots and other debris. To reduce the damage to the edge of the plot, the bulk density was maintained at 1.27 g·cm−3 in layers in the filling process, and filling was performed at 10 cm intervals. The erosion plot was uniformly trimmed to obtain an initial erosion form that was flat and steep without inner cavities in the filling process. Rainfall was produced by an artificial rainfall simulator with downward pointing nozzles and a spacing of 67 cm. The raindrop fall-height was designed as 2.05 m according to the field environment. The upslope inflow was adjusted by a water valve. Once the actual upslope inflow discharge reached the experimental design, water flow was allowed to be pass through the experimental plot. At the end of the gully bed, we built a collection groove to collect the sediment samples. The water supply was monitored and adjusted via valves in real time to maintain the average standard deviation of upslope inflow discharge within ±5.0%. The runoff velocity in 5 sections in the upstream catchment area and 1 section in the downstream gully bed was measured using a potassium permanganate tracer (KMnO4 solution) at 2 min intervals. The flow width was measured by using a flexible ruler with a precision of 1 mm at 2 min intervals. The sediment samples were collected at 2 min intervals at the outlet of the experimental plot and then oven-dried at 105° for 12 h to a constant weight.

2.4. Parameter Calculation and Statistical Analysis

The gully head was set as the zero-potential surface. The kinetic energy at the summit of the slope (Eks, J·s−1) was calculated using Equation (2) [30]:
E k s = ρ q v 2 / 2
where ρ is the water density (kg·m−3), q is the designed upslope inflow discharge (m3·s−1) and v is the runoff velocity at the summit of the slope (m·s−1).
The potential energy at the summit of the catchment area (Eps, J·s−1) was calculated using Equation (3) [30]:
E p s = ρ q g L 1 s i n
where L1 is the slope length of the upstream catchment area (m) and is the slope gradient in the upstream catchment area (°).
The kinetic energy at the bottom of the gully bed (Ekb, J·s−1) and the potential energy at the bottom of the gully bed (Epb, J·s−1) were calculated using Equations (4) and (5):
E k b = ρ q v b 2 / 2
E p b = ρ q g ( H + L 2 s i n β )
where q′ is the runoff rate at the bottom of the gully bed (m3·s−1), vb is the runoff velocity at the corresponding slope position (m·s−1), L2 is the slope length for the downstream gully bed (m), H is the headcut height (m) and β is the slope gradient in the downstream gully bed (°).
The flow energy consumption for the experiment plot ( Δ E , J·s−1) was calculated using Equation (6):
Δ E = E p s + E k s E p b E k b
The cumulative energy consumption for the experiment plot (ΔEc, J) was calculated using Equation (7) [30,37,40]:
Δ E c = 0 T Δ E d t
where T is the experiment time (s).
The soil erosion rate (Sr, g·m−2·min−1) was calculated using Equation (8) [46]:
S r = 60 × m d 1000 × ( t × s p )
where md is the mass of sediment (kg) and sp is the projection area (m2).
The sediment yield (Sy, kg) was calculated using Equation (9):
S y = t = 0 180 S r × s p 1000
Pearson correlation analysis (95% confidence intervals) was performed in SPSS 17.0 to test the correlation between the flow energy parameters and soil loss parameters, and upslope inflow discharge and slope gradient. Differences were considered significant at 5% (p-value < 0.05). A nonlinear regression analysis (95% confidence intervals) was conducted in SPSS 17.0 to establish the regression equations between flow energy consumption and sediment yield and their influencing factors. Figures were illustrated with Origin 8.5 software, and the experimental apparatus was drawn with Auto CAD 2017.

3. Results

3.1. Flow Energy Variation

3.1.1. Changes in Kinetic Energy

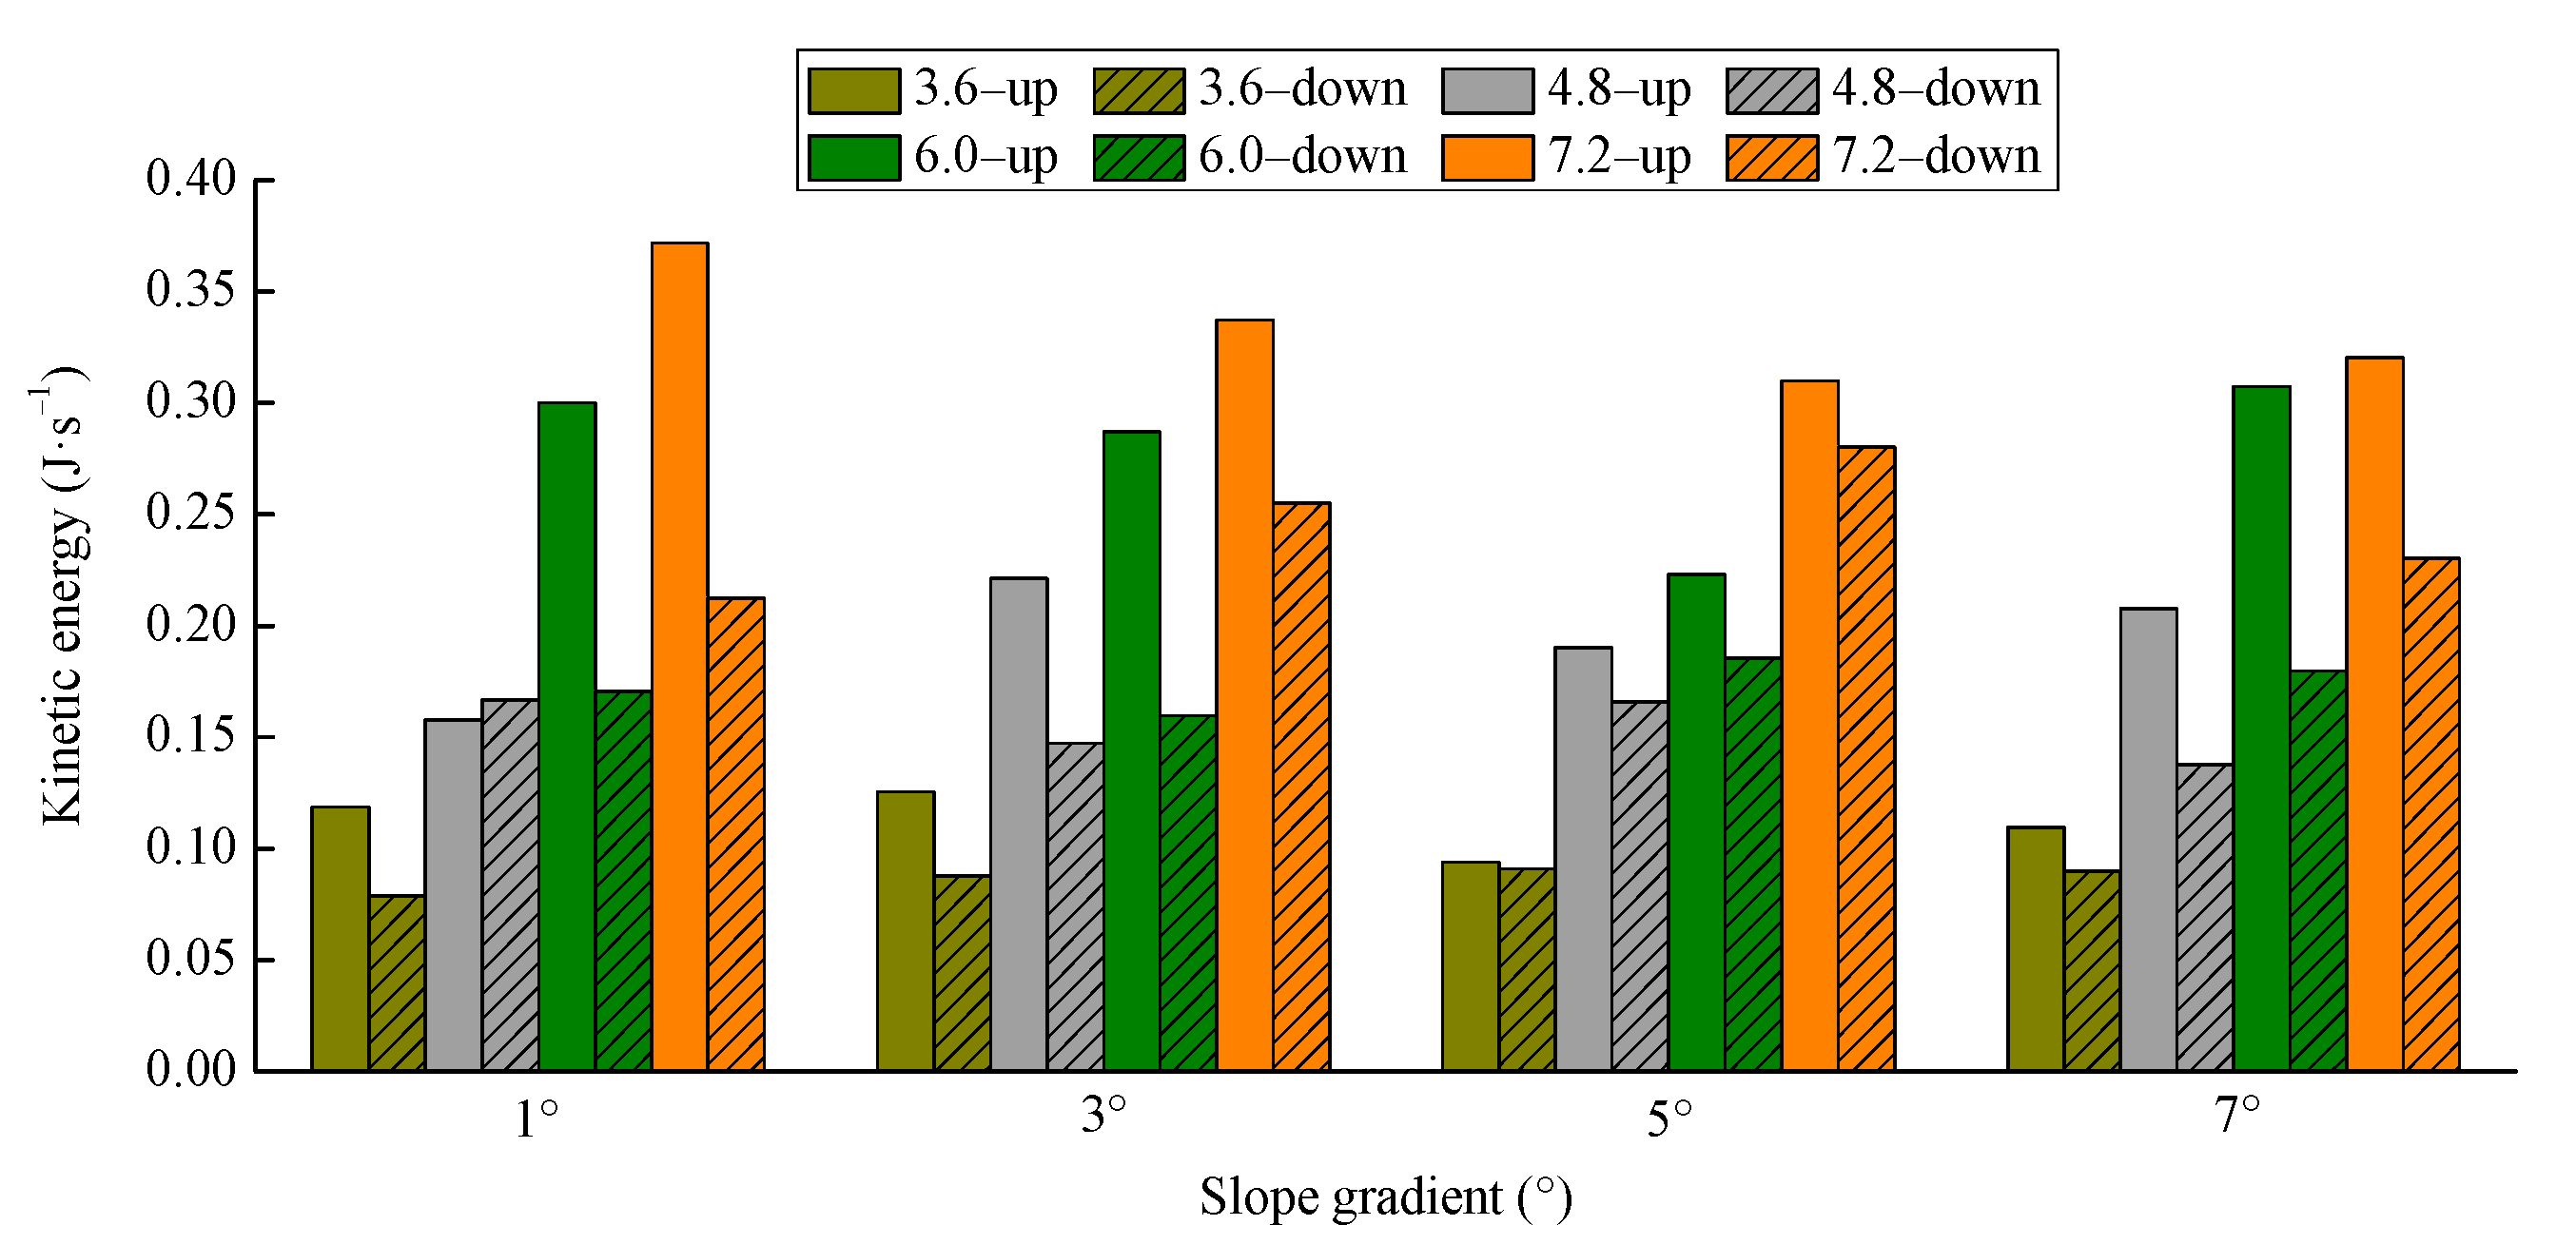
Figure 4 shows the four upslope inflow discharges and slope gradients. For the upstream catchment area, the kinetic energy values (Ek) associated with the slope gradients of 1°, 3°, 5° and 7° were 0.08~0.21, 0.09~0.26, 0.09~0.28 and 0.09~0.23 J·s−1, respectively. There was no significant correlation between Ek and the slope gradient (p > 0.05, n = 16), and the Ek rank order under different slope gradients was entirely different for each inflow discharge. According to Figure 3, Ek clearly increased with increasing inflow discharge and a significant positive correlation occurred between Ek and the inflow discharge for each slope gradient (p < 0.01, n = 16). The highest Ek was observed at the largest inflow discharge (7.2 m3·h−1), and Ek increased 4.26~102.75% as the inflow discharge increased by 1.2 m3·h−1.
For the downstream gully bed, the effect of the inflow discharge and slope gradient on Ek was coincident with that for the upstream catchment area (Figure 4). In conclusion, the kinetic energy of the downstream gully was significantly related to inflow discharge (p < 0.01, n = 16), while no significant correlation was observed between the slope gradient and Ek (p > 0.05, n = 16). Ek was much lower in the downstream gully bed than in the upstream catchment area. As the concentrated flow dropped across the gully head, Ek decreased by 0.03~0.04, 0.02~0.07, 0.03~0.13 and 0.03~0.16 J·s−1 for slope gradients of 1°~7°, indicating that Ek markedly decreased when the concentrated flow dropped through the gully head.

3.1.2. Changes in Potential Energy

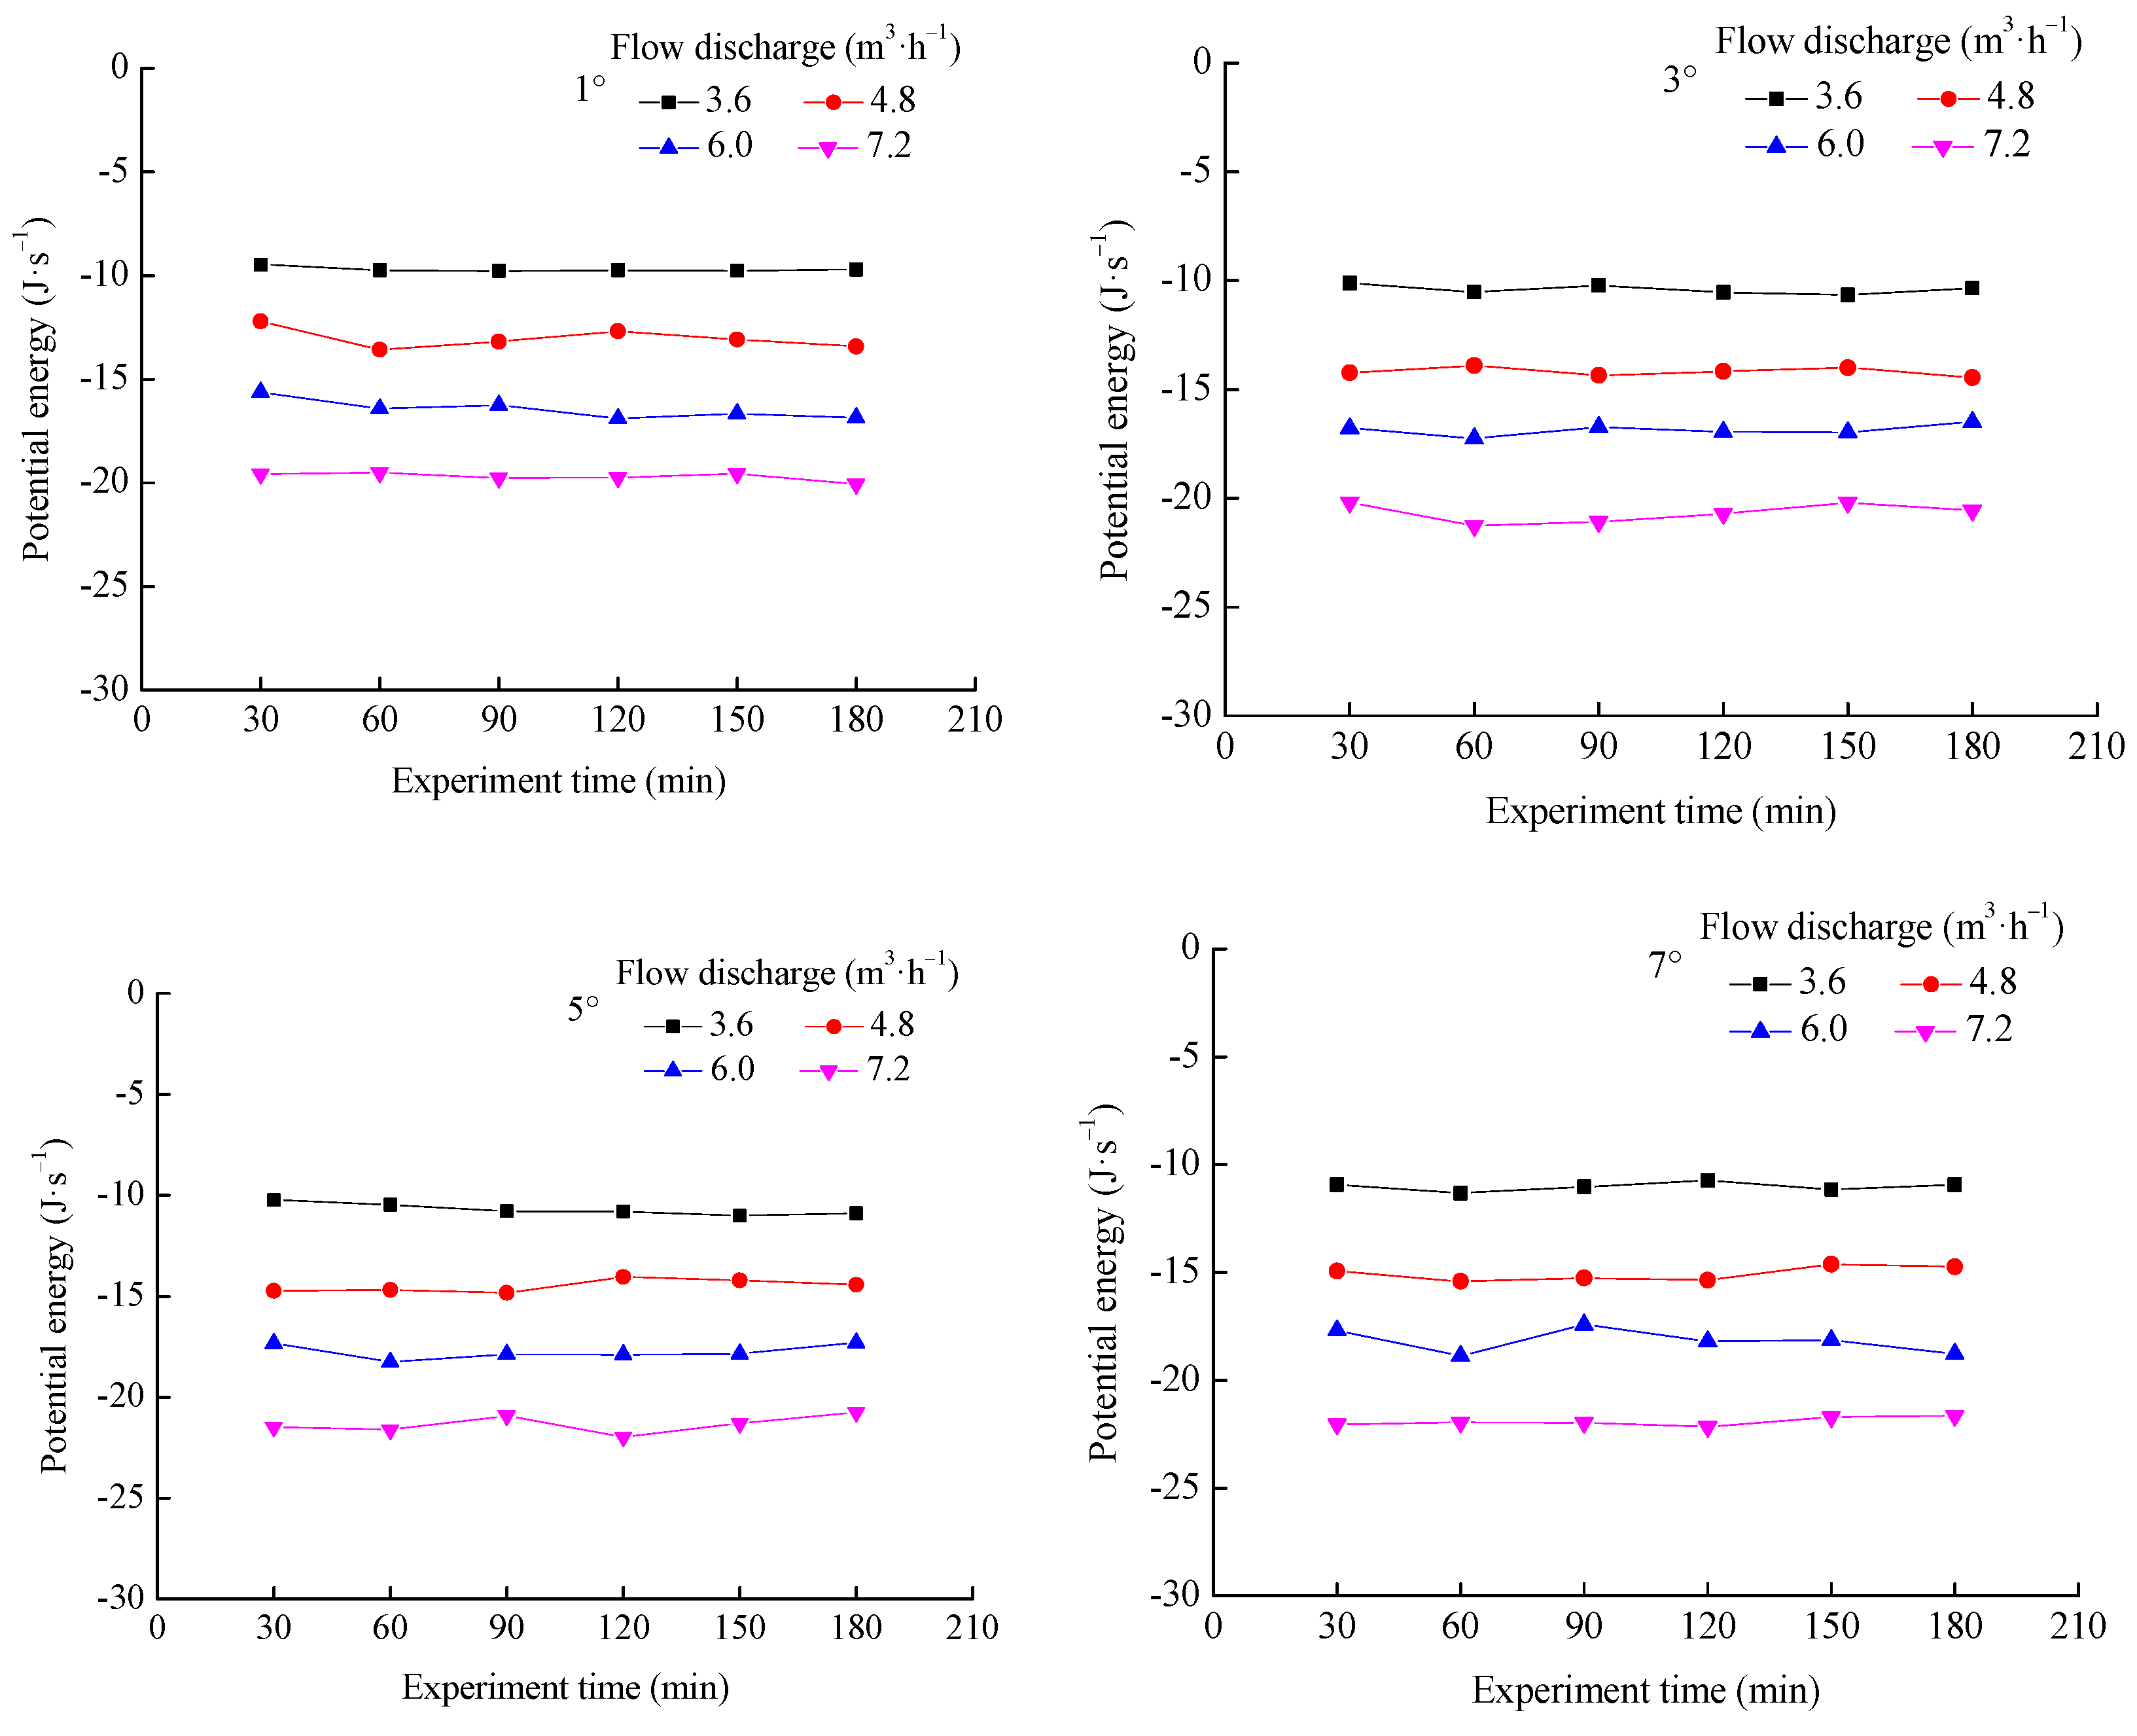
The potential energy values at the summit of the plot (Eps) were constant for a given slope gradient and upslope inflow discharge, with values of 1.88~2.74, 5.64~8.21, 9.4~13.67 and 13.14~19.11 J·s−1 for slope gradients of 1°, 3°, 5° and 7°, respectively, and increased as the slope gradient and inflow discharges increased. Figure 5 shows the temporal variation for potential energy at the bottom of the gully bed (Epb). The variable coefficient of Epb was 0.01~0.04 for each run, indicating that Epb was relatively stable over the entire experiment.
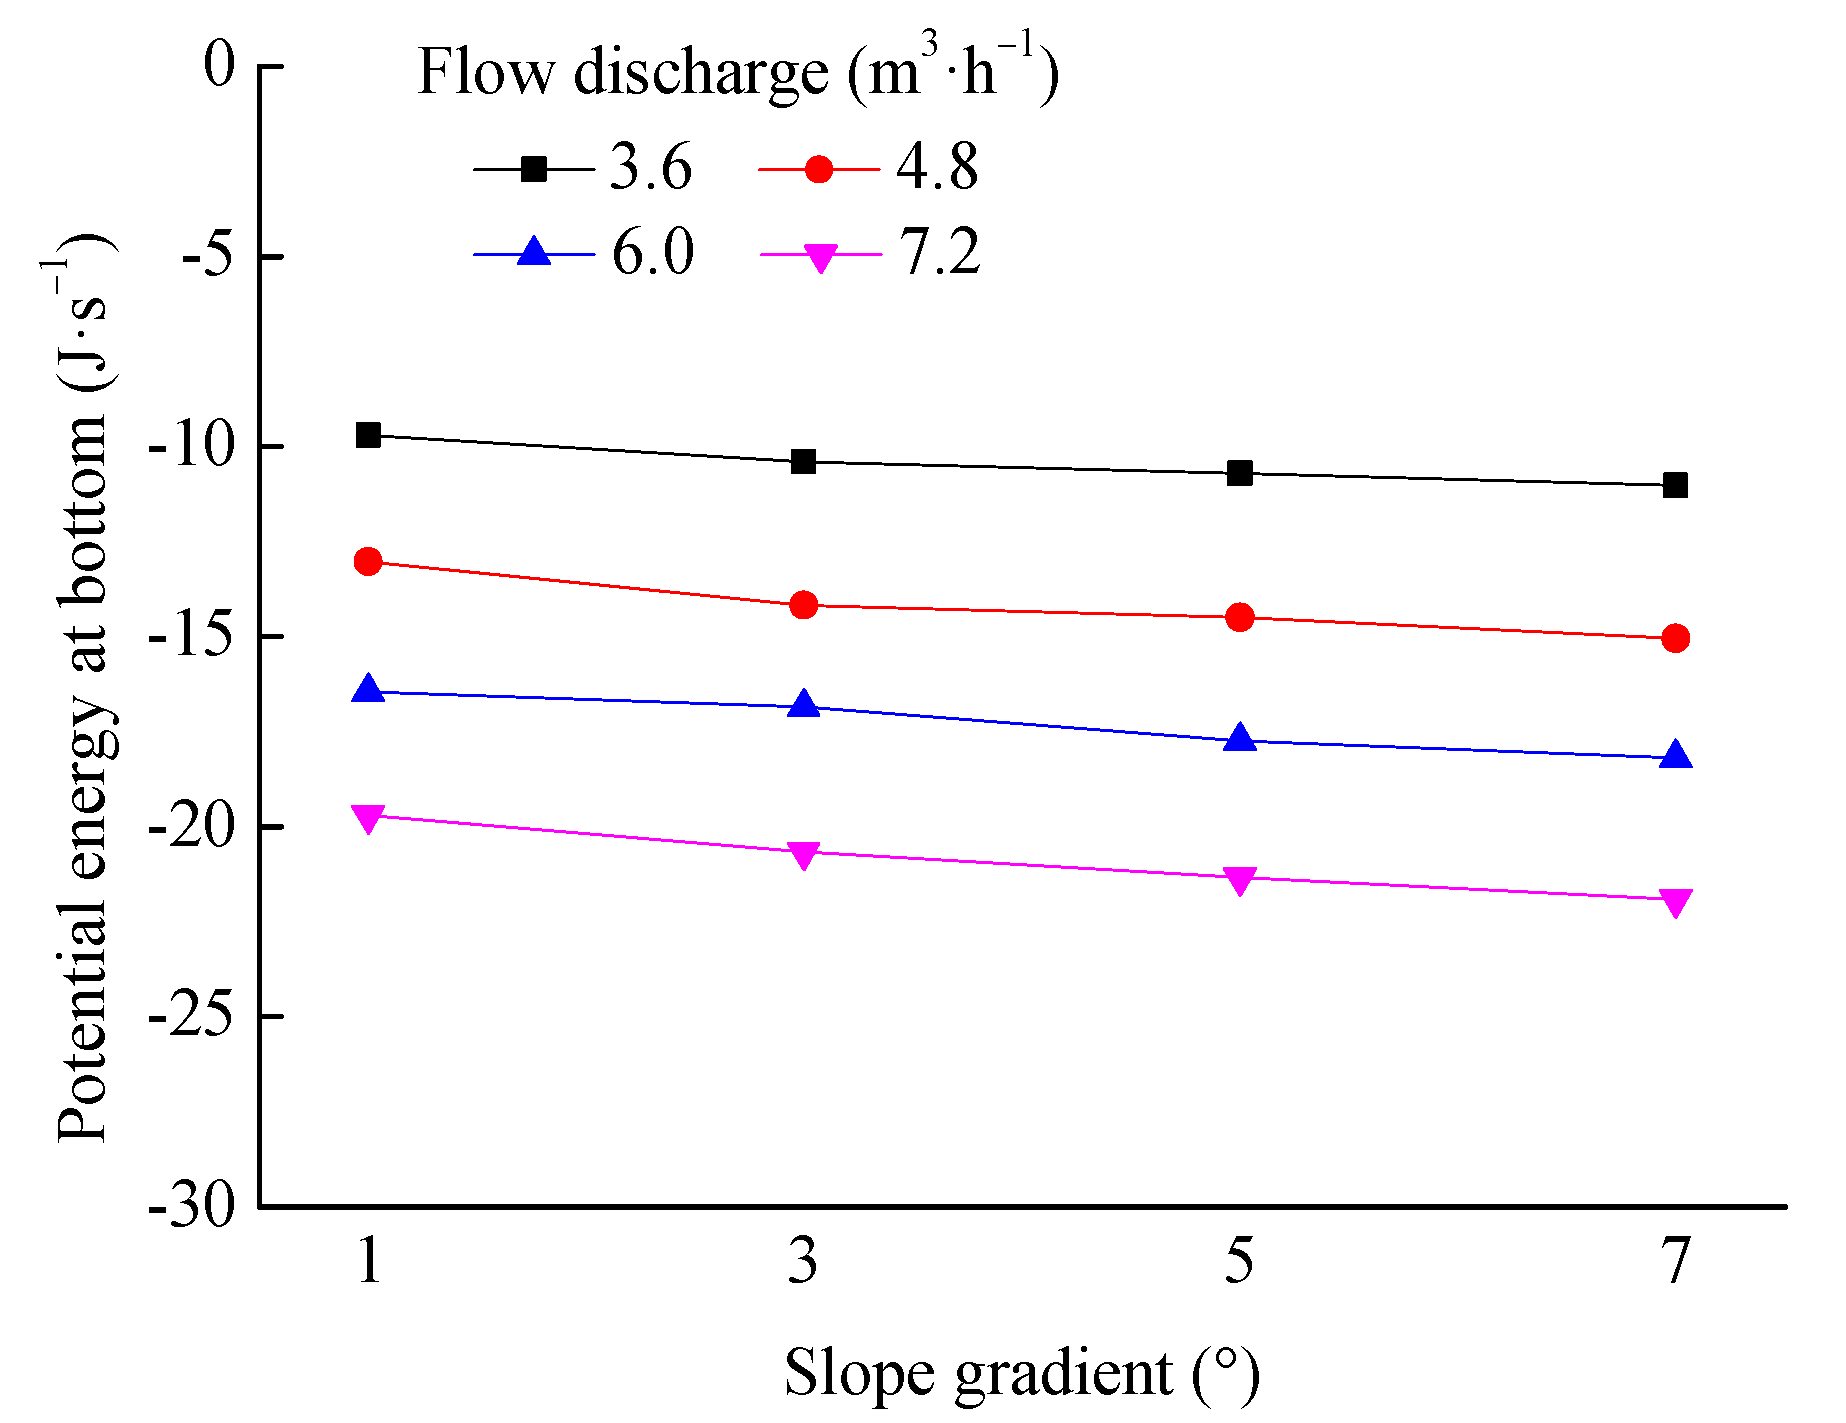
A slight increase in the mean Epb was observed as the slope gradient increased when the upslope inflow discharge was 3.6, 4.8, 6.0 and 7.2 m3·h−1. Epb increased by 2.39~7.19% when the slope gradient increased by 2° for each inflow discharge level, and it increased by 19.75~36.50% when the inflow discharge increased by 1.2 m3·h−1 for each slope gradient. In conclusion, Epb tended to increase as the slope gradient and inflow discharge increased (Figure 6). We conducted a regression analysis to evaluate the response relationship of the mean bottom potential energy at the bottom to the variations in the inflow discharge. The results showed that the slope gradient (S) and inflow discharge (Q) could efficiently describe Epb by using the following multivariate regression equation: Epb = 3.527 × (tanS)0.058 × Q0.984 (R2 = 0.99, p < 0.01, n = 16). The dimensionless coefficient determined by regression after the Z-score was standardized also indicated that Epb was primarily dependent upon the inflow discharge.

3.1.3. Changes in Flow Energy Consumption

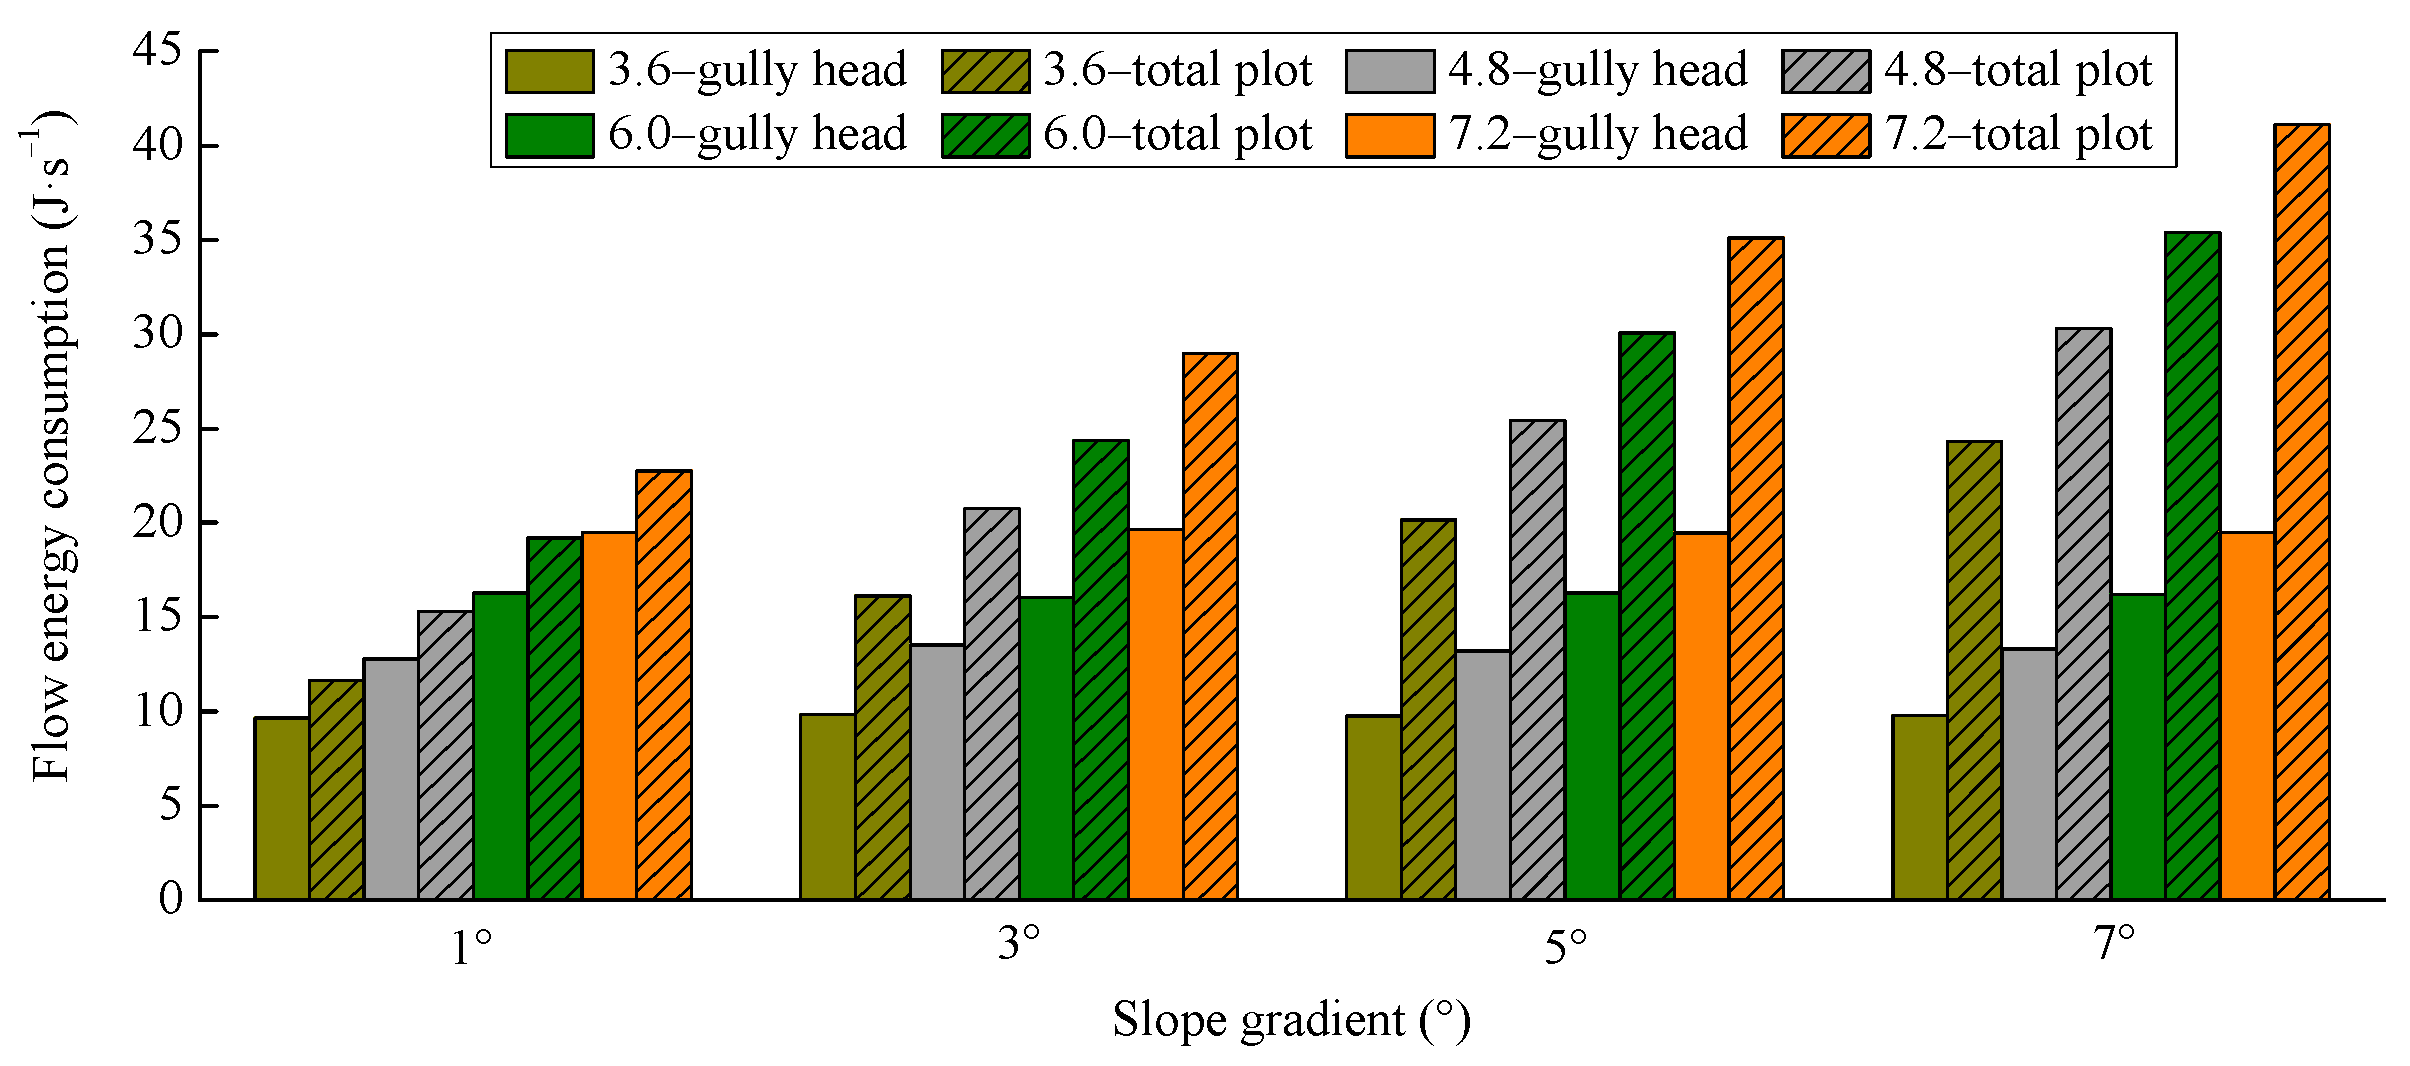
Figure 7 shows the flow energy consumption values of the gully head and the total plot. The flow energy consumption at the gully head (ΔEg) clearly increased with increasing inflow discharges, whereas it did not show an obvious trend with the slope gradient increases. ΔEg increased by approximately 1.26 times as the inflow discharge increased by 1.2 m3·h−1. The results showed that ΔEg was significantly related to the inflow discharge (p < 0.01, n = 16) and that no significant correlation existed between the slope gradient and ΔEg (p > 0.05, n = 16).
When the inflow discharge increased by 1.2 m3·h−1, the flow energy consumption of the total plot (ΔE) increased by 3.71, 4.29, 4.98 and 5.60 J·s−1 at slope gradients of 1°, 3°, 5° and 7°, respectively. Similarly, ΔE increased by approximately 1.32, 1.23 and 1.19 times when the slope gradient increased by 2°. The results indicated that the higher the slope gradient and inflow discharge, the higher the flow energy consumption. A multiple regression analysis showed that the relationship among ΔE, slope gradient (S) and inflow discharge (Q) was: ΔE = 17.299 × (tanS)0.347 × Q0.772 (R2 = 0.92, p < 0.01, n = 16). The regression results after standardization showed that ΔE was determined by the slope gradient.
We defined the ratio calculated by ΔEg divided by ΔE as the gully head contribution to the flow energy consumption (Ec). The statistical results show that Ec decreased from 64.19% to 44.30% as the slope gradient increased from 1° to 7°. Additionally, Ec was 40.20~82.85%, 43.88~83.48%, 45.76~84.87% and 47.36~85.58% at inflow discharges of 3.6, 4.8, 6.0 and 7.2 m3·h−1, respectively; thus, the contribution increased with increasing inflow discharge. In conclusion, Ec increased with increasing inflow discharge and decreasing slope gradient. The relationship among Ec, the inflow discharge (Q) and the slope gradient (S) was Ec = 0.205 × (tanS)−0.303 × Q0.121 (R2 = 0.97, p < 0.01, n = 16). The regression results after standardization showed that Ec was also determined by the slope gradient.

3.2. Soil Loss Variation

3.2.1. Temporal Variation in Sediment Yield

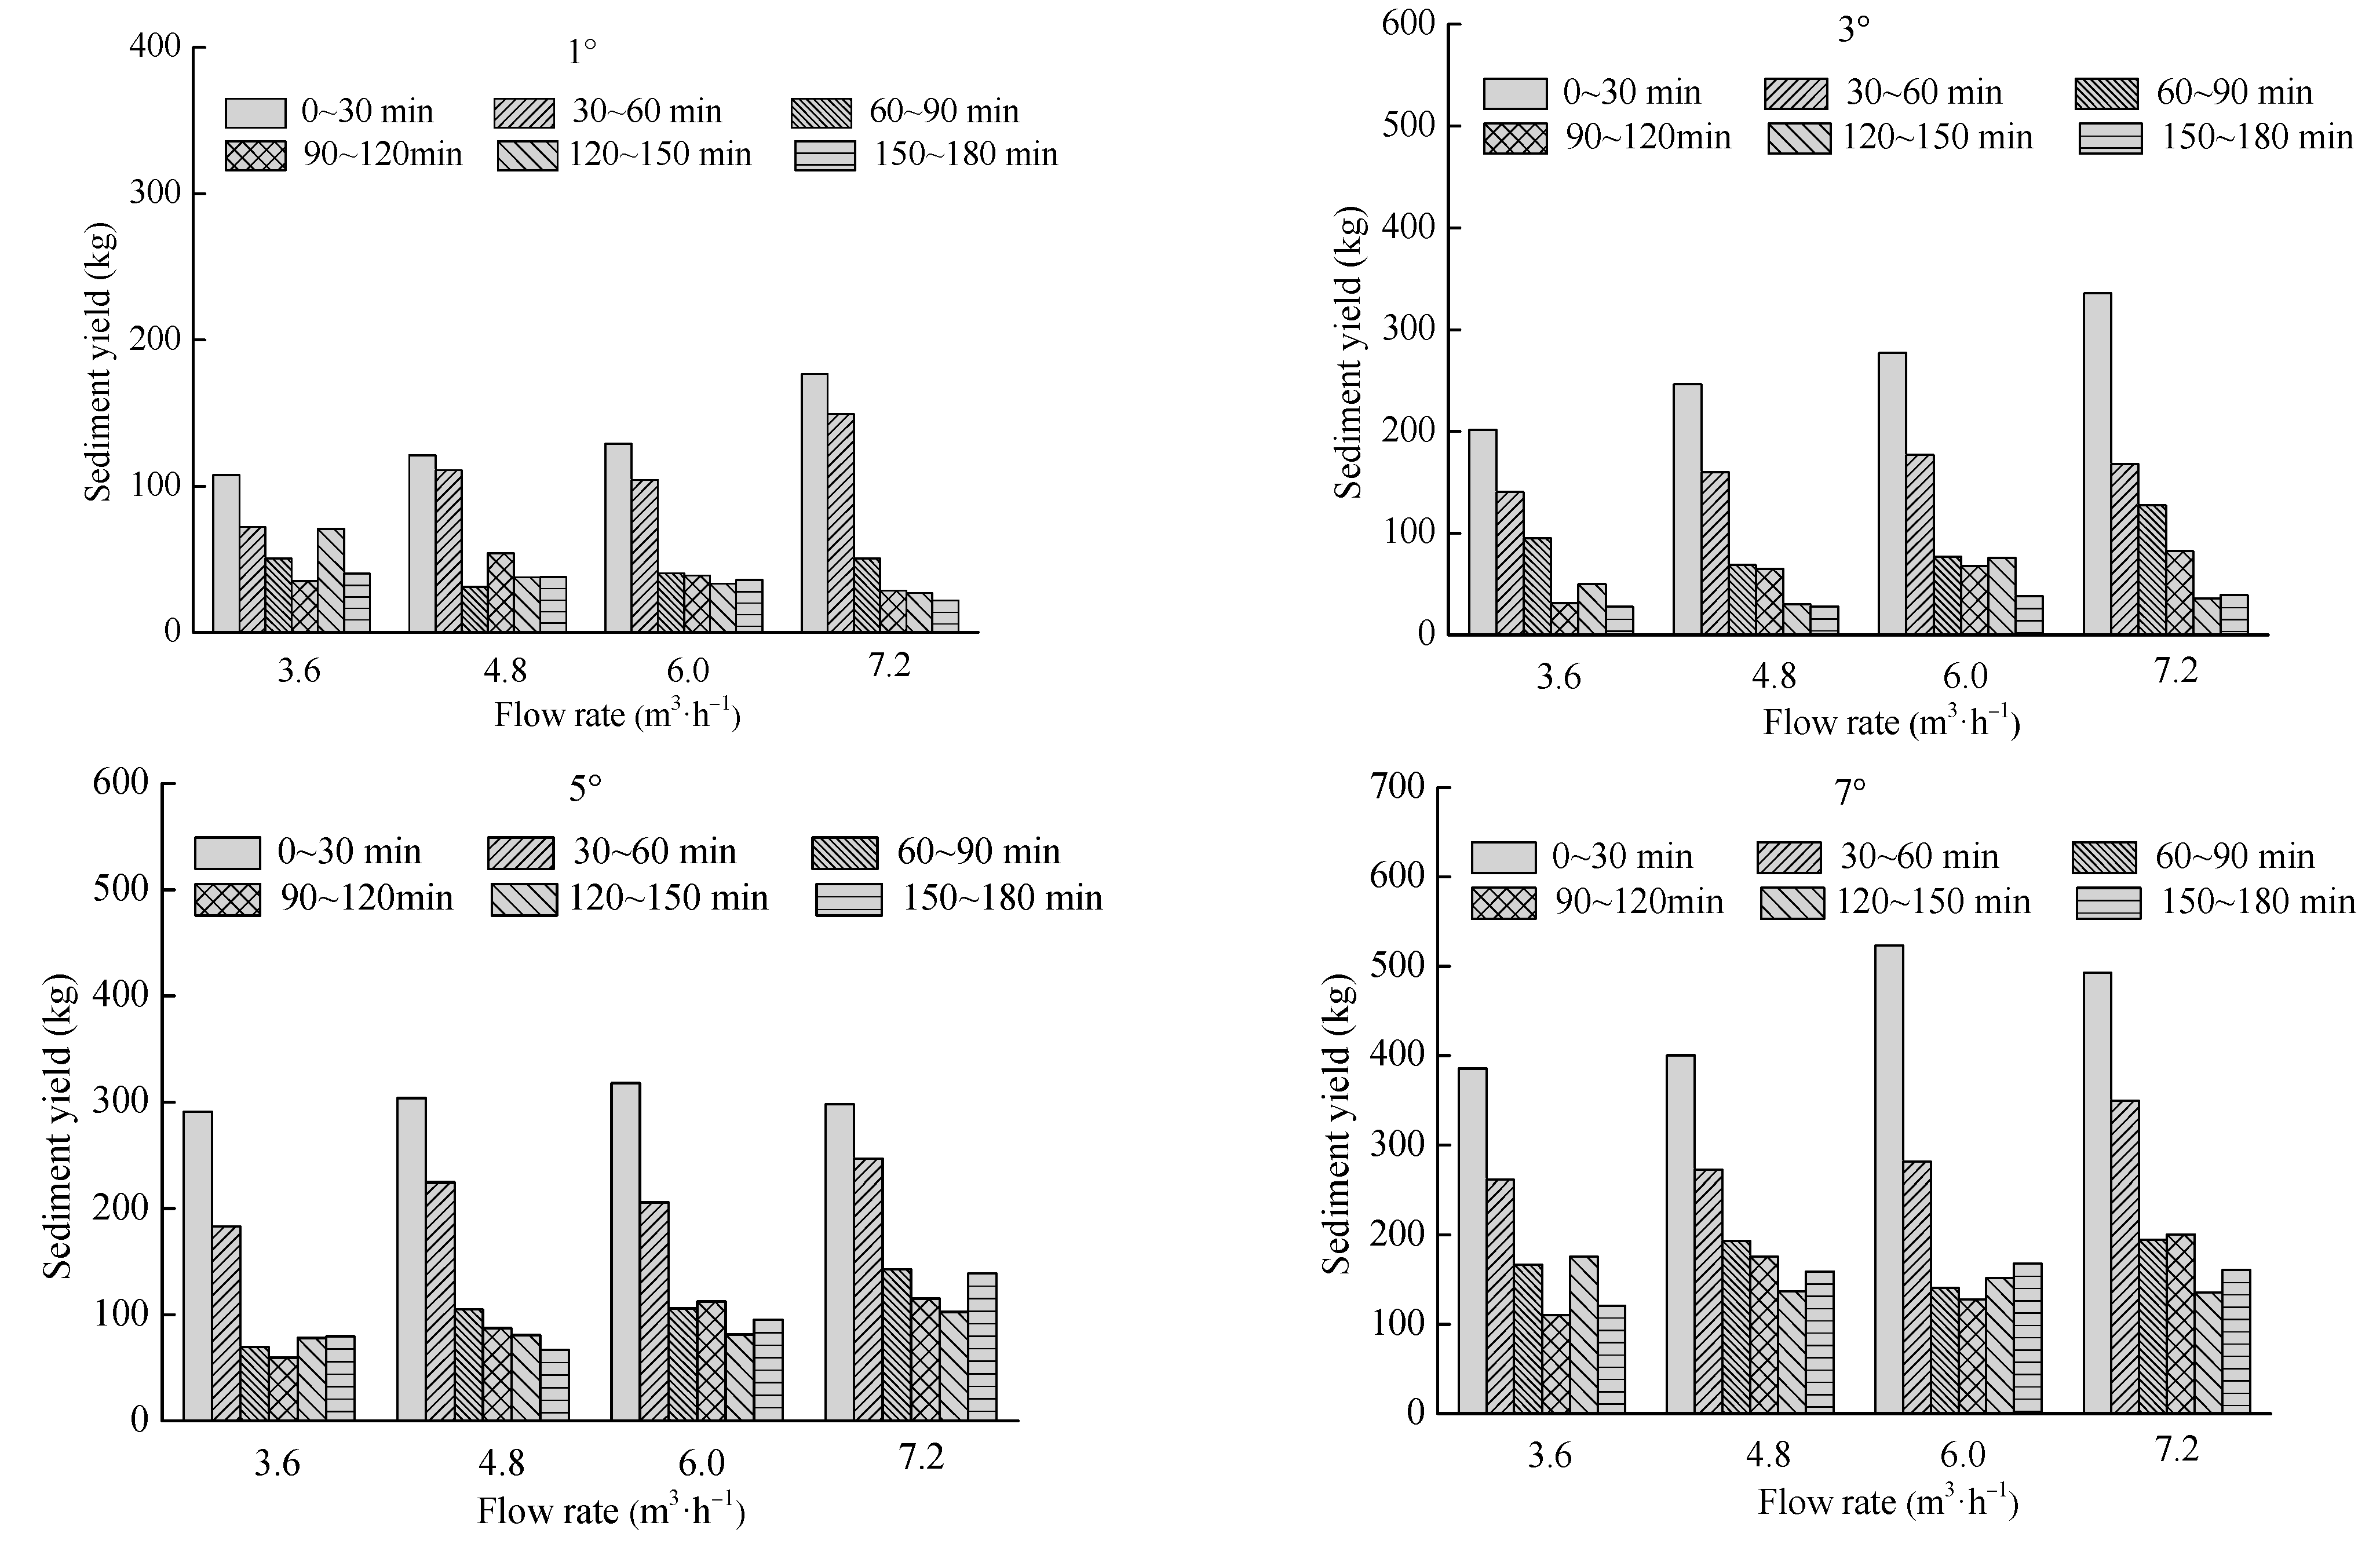
Figure 8 shows the sediment yield (Sy) variation under different time periods. Sy was 376.43~454.13, 545.73~787.71, 761.95~1044.18 and 1221.08~1533.60 kg at slope gradients of 1°, 3°, 5° and 7°, respectively. Sy was the greatest during the initial 30 min under each experimental condition; however, the timing of the minimum Sy varied under different slope gradients and inflow discharges. Approximately 35% of the soil loss took place in the initial 30 min, and 41% of the soil loss occurred in the last 120 min. This trend indicates that the greatest soil erosion took place during the initial stage.

3.2.2. Impact of Slope Gradient and Inflow Discharge on Sediment Yield

Figure 9 shows the variations in the sediment yield in response to different slope gradients and inflow discharges. Generally, Sy tended to increase with increasing slope gradient and inflow discharge.
When the slope gradient was relatively gentle (1°), the inflow discharges ranked in the following order in terms of the sediment yield: 7.2 m3·h−1 > 4.8 m3·h−1 > 3.6 m3·h−1 > 6.0 m3·h−1, and the variation in Sy under different inflow discharges was small. However, as the slope gradient increased (3°, 5° and 7°), Sy increased with increasing inflow discharge. At slope gradients of 3°, 5° and 7°, an increase in the inflow discharge of 1.2 m3·h−1 produced increases in Sy of 9.57~19.05%, 5.89~13.97% and 4.06~10.14%, respectively. Hence, Sy tended to increase as the inflow discharge increased.
Soil erosion also gradually increased as the slope gradient increased for different inflow discharges. Under inflow discharges of 3.6, 4.8, 6.0 and 7.2 m3·h−1, an increase in the slope gradient of 2° produced increases in Sy of 0.40~0.60 times, 0.45~0.54 times, 0.29~0.86 times and 0.33~0.73 times, respectively.
To evaluate the response relationship of the total sediment yield to the variations in the slope gradient and inflow discharge, a multivariate regression analysis was conducted to establish multiple regression equations to fit the measured Sy. The equation was Sy = 3165.47 × (tanS)0.73 × Q0.381, R2 = 0.95, n = 16, p < 0.01. Additionally, in SPSS we standardized the data of each variable by the Z-score to determine the critical independent variable affecting soil erosion. The results indicated that Sy was more sensitive to the slope gradient than to the inflow discharge. The estimated Sy using the equation above appears to satisfactorily match the measured Sy. The results showed that there was good agreement between the calculated and measured Sy.

3.3. Response of Flow Energy Consumption to Sediment Yield

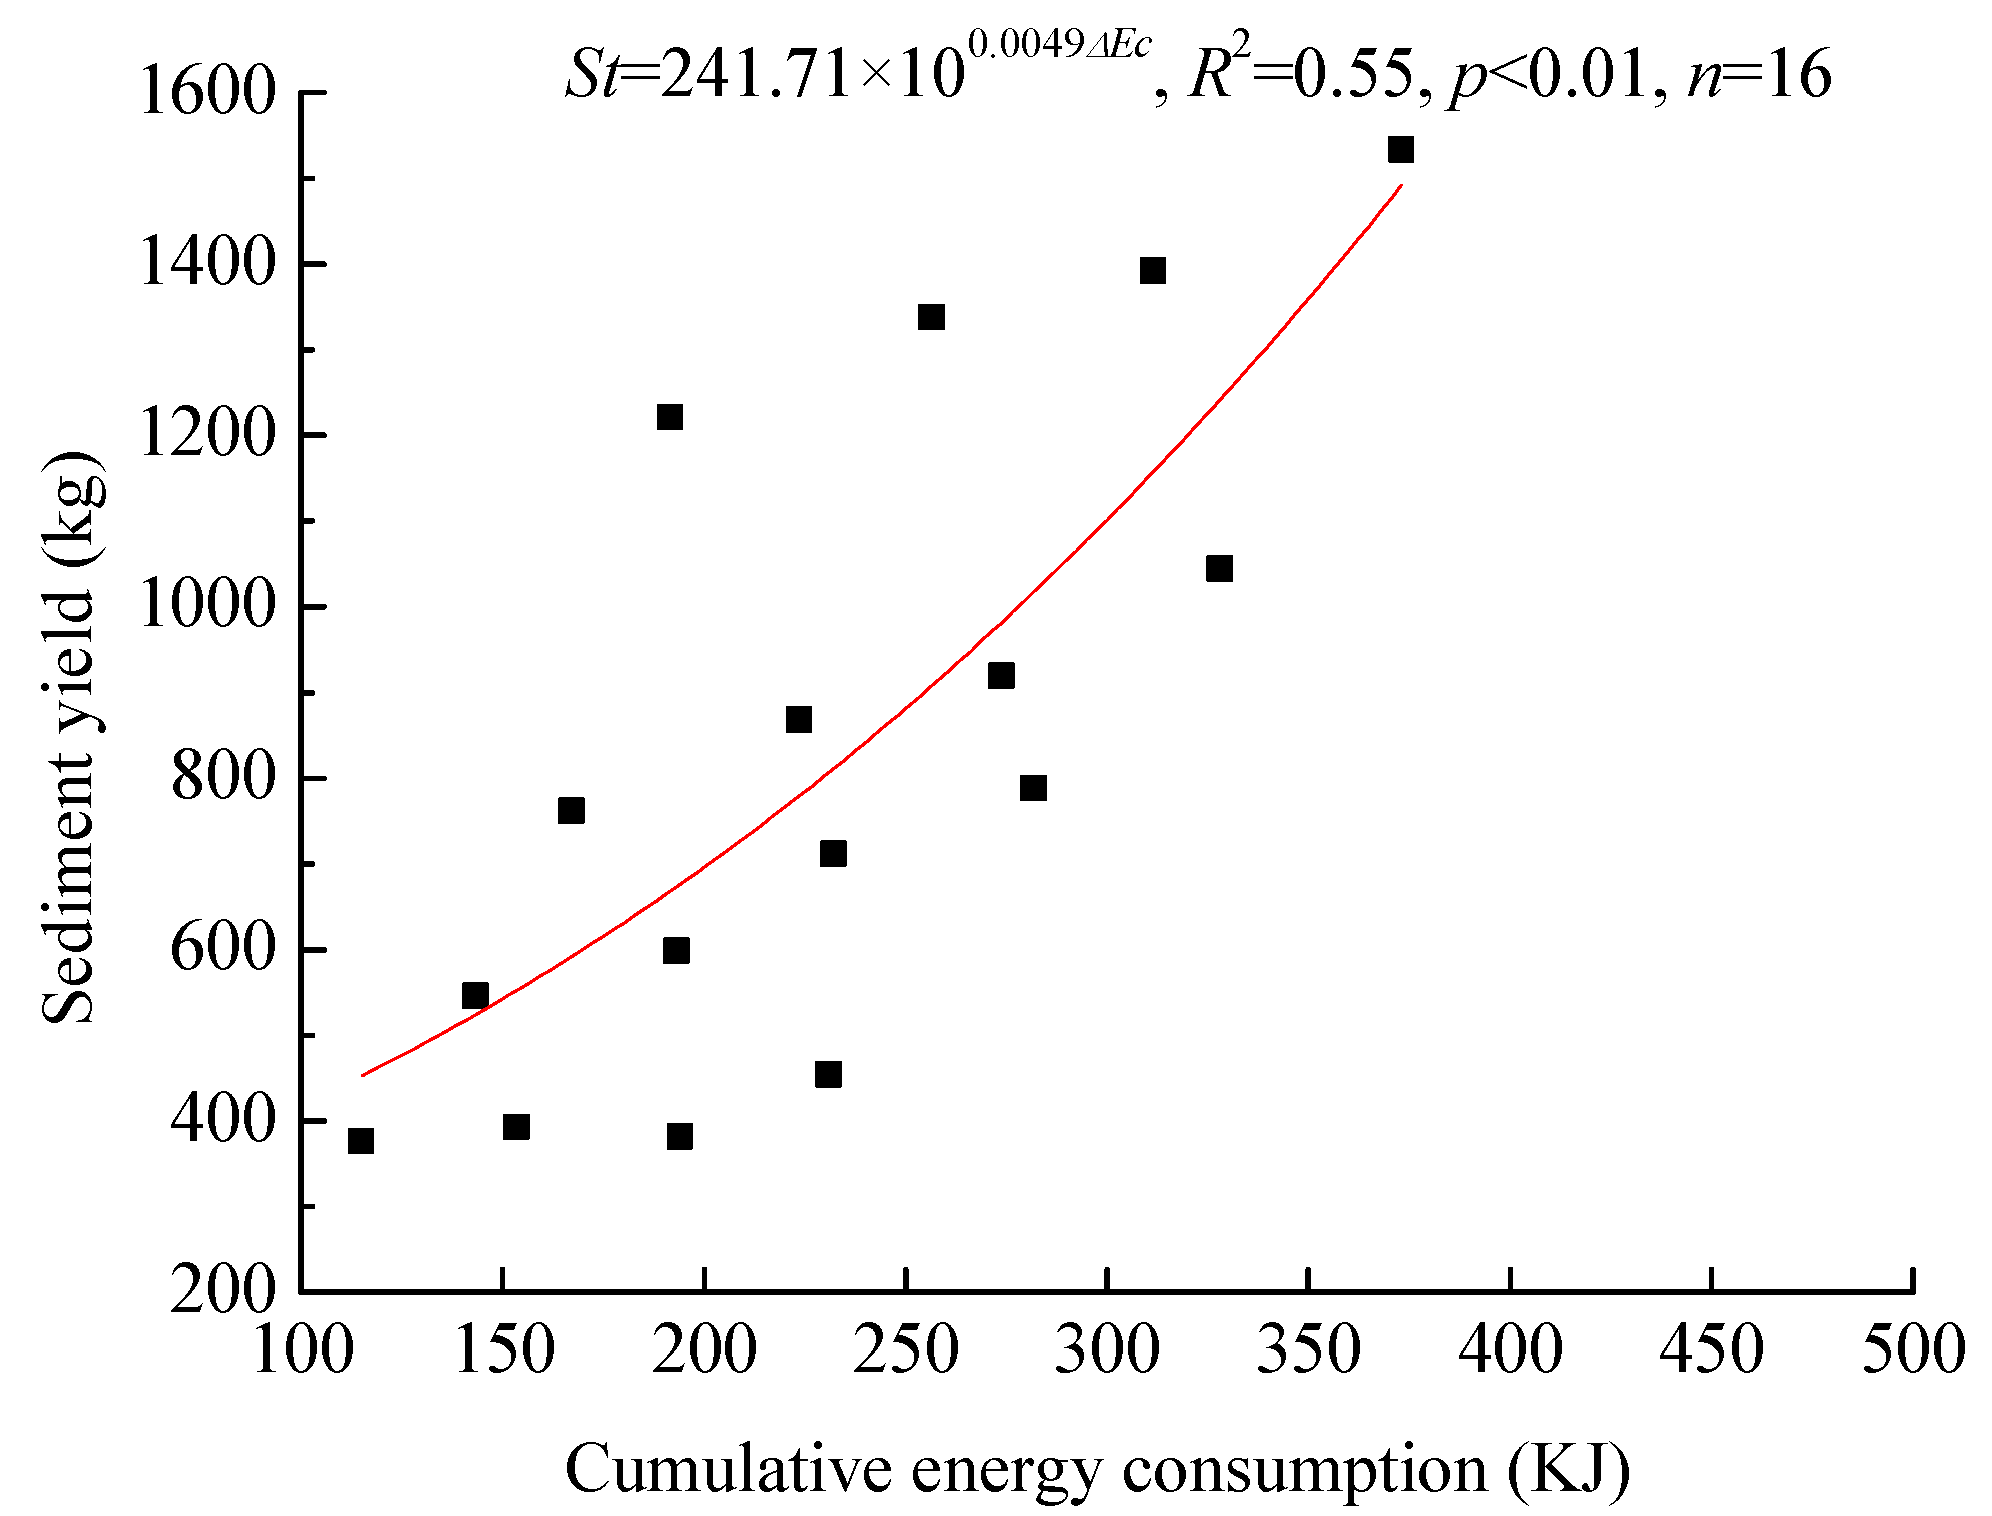
The sediment yield plotted against the cumulative energy consumption (ΔEc) is shown in Figure 10. Sy increased as ΔEc increased, indicating that ΔEc can be used to calculate Sy. By regression analysis, there was a significant positive exponential function relating Sy and ΔEc (S = 209.24e0.0047ΔEc, R2 = 0.55, p < 0.01, n = 16).

4. Discussion

4.1. Impact of Slope Gradient and Inflow Discharge on Flow Energy

For the upstream catchment area and the downstream gully bed, the kinetic energy increased with the inflow discharge but neither increased nor decreased with the slope gradient. Govers [47] also concluded that the runoff velocity is mainly determined by the inflow discharge. The irregularity of the kinetic energy under different slope gradients was determined by the irregular changes in the runoff velocity. However, the runoff velocity usually increases with increasing slope gradients, as reported by Zhang et al. [48] and Huang et al. [49]. The discrepancy was caused by the following reasons: (1) Soil was eroded from the upstream catchment area and gully head under the force of gravity, and the sediment was deposited in the gully; therefore, the underlying surface in the upstream catchment area and the downstream gully bed changed continually [9,50], which caused increases and decreases in the flow path. (2) For the downstream gully bed, a plunge pool was developed at the downstream of the gully bed near the bottom of the gully head due to the jet flow [13]. The plunge pool increased the flow turbulence [50], thereby increasing the fluctuation in the runoff velocity in the downstream gully bed. Based on these reasons, the runoff velocity in the downstream gully bed changed irregularly under different slope gradients. This finding was confirmed on the Loess Plateau by Wei et al. [40], who suggested that the runoff kinetic energy showed more complex variation in convex composite slopes.
The potential energy at the bottom showed an increasing trend as the inflow discharge and slope gradient increased. This trend may be because the potential energy at the bottom was determined by the runoff rate, slope length and slope gradient according to Equation (2). The slope length was a constant value and the runoff rate on the bottom was influenced by the inflow discharge. The flow energy consumption of the total plot also exhibited an increasing trend with the inflow discharge and slope gradient, and in their relationship, the slope gradient was more relevant to the flow energy consumption of the total plot than the inflow discharge. This may be attributed to the development of high turbulences within the concentrated flow and within the plunge pool at the base of the headcut. Similarly, Su et al. [30] found that the flow energy consumption gradually increased as the discharge increased from 1.8 to 7.2 m3·h−1. Wang et al. [37] illustrated that the runoff consumption energy increased significantly with increasing flow discharge.

4.2. Impact of Gully Head on Flow Energy

The kinetic energy was much lower at the downstream gully bed than in the upstream area, indicating that the kinetic energy decreased markedly as the concentrated flow dropped across the gully head, which may contribute to the flow energy consumption at the gully head. The flow energy consumption at the gully head accounts for 40.20~85.58% of the total flow energy. This result implies that more energy consumption occurs at the gully head than in the upstream area and downstream gully bed. The flow energy must be consumed to surmount the soil resistance as the headcut migrates, and the consumed energy was mainly focused on the headwall development [43,50]. Therefore, land managers should focus their concern on the gully head to pre-consume most flow energy to reduce soil loss. Furthermore, some researchers [13,40,43] confirmed that the energy consumption increased significantly as the runoff travels to the downstream area. In the upstream catchment area and downstream gully bed, the slope was relatively gentle, and the potential energy increased by (0.017~0.123) × ρqg as the slope section increased by 1 m, while the change in the potential energy associated with the sudden change in the bed elevation at the gully head was 0.9 × ρqg. This finding indicated that the potential energy significantly decreased when the concentrated flow dropped from the upstream catchment area to the bottom of the gully head.
The slope gradient and inflow discharge are important controlling factors that influence the sediment yield, and the sediment yield in this study was primarily dependent upon the slope gradient rather than the inflow discharge. The influence of the slope is mainly dependent on the movement status of the overland flow and the stability of the sediment on the slope. The steeper the slope gradient is, the greater the potential energy, and the lower the stability of the sediment on the slope [13]. Therefore, with increasing slope gradient, the value of sediment yield increased. The higher the inflow discharge is, the more concentrated the flow, and the stronger the runoff erosivity of the concentrated flow. Therefore, the sediment yield also increased with increasing inflow discharge, similar to the results reported by Bennett et al. [8], who determined that headcut erosion rates are positively correlated with overland inflow discharge and bed slope. Engineering design and forest and grass measures are suggested to be developed to lead to infiltration of all rainfall and stored in situ to reduce concentrated flow. Slope cutting is also a good measure to prevent soil loss. Some researchers have reported that power regression equations exist between sediment yield and inflow discharge and slope gradient [51,52,53]. Accordingly, we used the same equation model to quantify the relationship between these parameters, which achieved a good fitting effect. The difference in our coefficient may be caused by the differences in the soil type and slope length. In our study, sediment yield was more sensitive to slope gradient than to inflow discharge. This may suggest that the slope gradient was more sensitive to hydraulic characteristics in our study. The regression analysis showed that hydraulic parameters such as shear stress, stream power, unit stream power and Darcy-friction factor were significantly positively correlated with slope gradient. The increasing slope gradient increased these hydraulic parameters; therefore, the sediment yield was increased [54]. The inflow discharge mainly influences the flow depth; therefore, increasing inflow discharge increased the flow velocity and turbulence. Above all, slope gradient was better for calculating the sediment yield.
The greatest erosion occurred in the initial stage. Zhang et al. [32] reached a similar conclusion. Possibly, in the initial stage, loose soil particles were eroded, and a gully developed in the catchment area in approximately 15 min. At that point, runoff constantly flowed into the gully channel, so the headcut erosion and lateral erosion were intense in the channel, resulting in collapses of the channel walls. As the simulated rainfall and scouring experiment progressed, the channel development became relatively stable, and the sediment yield reached an approximately steady-state condition. In some special conditions, the maximum soil erosion rate was not in the initial stage because of large-scale collapse through time. This tendency has been confirmed by other studies that reported that the soil erosion rate was greatest in the initial stage and progressively decreased as the scouring test progressed [8,13,20,28,29,30]. There was a logarithmic relationship between the experiment time and the soil erosion rate, while Zhang et al. [32] found a declining power function trend. Similarly, Zhang et al. [13] asserted that the sediment concentration was greatest at the beginning of the scouring experiment and that following an initial flush, the sediment concentration decreased rapidly, then decreased slowly and finally tended to be stable. Bennett et al. [8] revealed that after a short adjustment, a constant rate of sediment yield was produced during overland flow. These discrepancies may occur because rainfall produces a well-developed surface seal with a thickness of a few millimeters at the soil surface, which minimized soil erosion in Bennett’s experiment. An abrupt collapse or slide along the slope caused a change to appear in the time dependent soil erosion rate curve. This volatility was also observed in Su’s experiment [29].

4.3. Response of Sediment Yield on Flow Energy Consumption

The flow energy consumption showed good ability to estimate the sediment yield. There was a significant power relationship between the sediment yield and the flow energy consumption (p < 0.01). Similarly, Su et al. [29] suggested that flow energy consumption can be applied to estimate the soil loss associated with headcut erosion for both bare land and cultivated land. The reason for this estimation was that as concentrated flow moves from the summit of the catchment to the end of the gully bed, the flow energy was consumed in scouring-related erosion and the suspension and transport of soil sediments [40,43].

5. Conclusions

Headcut erosion is an important sediment-producing process; therefore, further attention must be given to controlling sediment yield in this region. Simulated rainfall-based scouring experiments were conducted to quantify the influence of slope gradient and inflow discharge on flow energy variations and the headcut erosion process. Kinetic energy at the downstream gully bed was 0.03~0.16 J·s−1 lower than that in the upstream catchment area because of the concentrated flow drop at the gully head. Overall, more than 44% of total flow energy was consumed during the headcut erosion, and the flow energy consumption at the gully head was maximal compared to that at the upstream area and downstream gully bed. The gully head contribution to the flow energy consumption increased with increasing inflow discharge and decreasing slope gradient. The soil erosion rate was relatively high during the initial stage and then gradually decreased as the experiment progressed, and the sediment yield could be calculated by a linear equation with two unknowns and a high determination coefficient. The sediment yield tended to increase exponentially as the flow energy consumption increased, illustrating that the cumulative flow energy consumption shows good performance in estimating the sediment yield in the headcut erosion process.

Author Contributions

Methodology, Q.S. and L.F.; writing—original draft preparation, Q.S.; writing—review and editing, Q.S., L.F. and W.W.; project administration, Q.S. and W.W.; funding acquisition, Q.S. and W.W. All authors have read and agreed to the published version of the manuscript.

Funding

This research was funded by the Ph.D. early development program of Taiyuan Science and Technology University (No. 20212031), the National Natural Science Foundation of China (42107356, 42077079 and 41907057).

Data Availability Statement

The data presented in this study are available on request from the corresponding author.

Acknowledgments

We acknowledge Mingming Guo, Zhuoxin Chen, Man Zhao and Hongliang Kang for their contributions to the indoor experiment. The careful reviews and constructive comments of the editors and anonymous reviewers are gratefully acknowledged.

Conflicts of Interest

The authors declare no conflict of interest.

References

  1. Zhang, T.; Fukuda, H.; Hu, Q.N. Analysis on traditional gully village’s sustainable development methods in Gully Region of Loess Plateau. Soc. Behav. Sci. 2016, 216, 87–96. [Google Scholar] [CrossRef]
  2. Wang, J.; Zhong, L.N.; Zhao, W.W.; Ying, L.X. The influence of rainfall and land use patterns on soil erosion in multi-scale watersheds: A case study in the hilly and gully area on the Loess Plateau, China. J. Geogr. Sci. 2018, 28, 1415–1426. [Google Scholar] [CrossRef]
  3. Gao, Z.; Zhang, G.G.; Fan, H.H.; Ji, Q.Q.; Li, A.B.; Zhang, Y.Y.; Feng, B.Y.; Yu, Y.H.; Ma, L.; Gao, J.E. Erosion-transportation processes influenced by spatial distribution of terraces in watershed in the Loess hilly-gully region (LHGR), China. Water 2022, 14, 1875. [Google Scholar] [CrossRef]
  4. Guo, P.; Lyu, J.Q.; Yuan, W.N.; Zhou, X.W.; Mo, S.H.; Mu, D.R.; Luo, P.P. Detecting the quantitative hydrological response to changes in climate and human activities at temporal and spatial scales in a typical gully region of the Loess Plateau, China. Water 2022, 14, 257. [Google Scholar] [CrossRef]
  5. Jia, Y.F.; Kitamura, T.; Wang, S.S.Y. Numerical simulation of head-cut with a two-layered bed. Int. J. Sediment. Res. 2005, 20, 185–193. [Google Scholar]
  6. Shi, Q.H.; Wang, W.L.; Zhu, B.C.; Guo, M.M. Experimental study of hydraulic characteristics on headcut erosion and erosional response in the tableland and gully regions of China. Soil Sci. Soc. Am. J. 2020, 84, 700–716. [Google Scholar] [CrossRef]
  7. Li, C.R.; Li, F.Y.; Dai, Z.Y.; Yang, X.; Cui, X.J.; Luo, L.H. Spatial variation of gully development in the loess plateau of China based on the morphological perspective. Earth Sci. Inform. 2020, 13, 1103–1117. [Google Scholar] [CrossRef]
  8. Bennett, S.J.; Alonso, C.V.; Prasad, S.N.; Romkens, M.J.M. Experiments on headcut growth and migration in concentrated flows typical of upland areas. Water Resour. Res. 2000, 36, 1911–1922. [Google Scholar] [CrossRef]
  9. Dey, A.K.; Tsujimoto, T.; Kitamura, T. Experimental investigations on different modes of headcut migration. J. Hydraul. Res. 2007, 45, 333–346. [Google Scholar] [CrossRef]
  10. Zaimes, G.N.; Schultz, R.C. Assessing riparian conservation land management practice impacts on gully erosion in Iowa. Environ. Manag. 2012, 49, 1009–1021. [Google Scholar] [CrossRef]
  11. Zaimes, G.N.; Tufekcioglu, M.; Schultz, R.C. Riparian land-use impacts on stream bank and gully erosion in agricultural watersheds: What we have learned. Water 2019, 11, 1343. [Google Scholar] [CrossRef] [Green Version]
  12. Bennett, S.J.; Alonso, C.V. Turbulent flow and bed pressure within headcut scour holes due to plane reattached jets. J. Hydraul. Res. 2006, 44, 510–521. [Google Scholar] [CrossRef]
  13. Zhang, B.J.; Xiong, D.H.; Zhang, G.H.; Zhang, S.; Wu, H.; Yang, D.; Xiao, L.; Dong, Y.F.; Su, Z.A.; Lu, X.N. Impacts of headcut height on flow energy, sediment yield and surface landform during bank gully erosion processes in the Yuanmou Dry-hot Valley region, southwest China. Earth Surf. Proc. Land 2018, 43, 2271–2282. [Google Scholar] [CrossRef]
  14. Wells, R.R.; Momm, H.J.; Rigby, J.R.; Bennett, S.J.; Bingner, R.L.; Dabney, S.M. An empirical investigation of gully widening rates in upland concentrated flows. Catena 2013, 101, 114–121. [Google Scholar] [CrossRef]
  15. Bennett, S.J. Effect of slope on the growth and migration of headcuts in rills. Geomorphology 1999, 30, 273–290. [Google Scholar] [CrossRef]
  16. Bennett, S.J.; Casalí, J. Effect of initial step height on headcut development in upland concentrated flows. Water Resour. Res. 2001, 37, 1475–1484. [Google Scholar] [CrossRef]
  17. Alonso, C.V.; Bennett, S.J.; Stein, O.R. Predicting head cut erosion and migration in concentrated flows typical of upland areas. Water Resour. Res. 2002, 38, 39-1–39-15. [Google Scholar] [CrossRef]
  18. Gordon, L.M.; Bennett, S.J.; Bingner, R.L.; Theurer, F.D.; Alonso, C.V. Simulating ephemeral gully erosion in AnnAGNPS. Trans. ASABE 2007, 50, 857–866. [Google Scholar] [CrossRef]
  19. Gordon, L.M.; Bennett, S.J.; Wells, R.R.; Alonso, C.V. Effect of soil stratification on the development and migration of headcuts in upland concentrated flows. Water Resour. Res. 2007, 43, 1–12. [Google Scholar] [CrossRef]
  20. Wells, R.R.; Alonso, C.V.; Bennett, S.J. Morphodynamics of headcut development and soil erosion in upland concentrated flows. Soil Sci. Soc. Am. J. 2009, 73, 521–530. [Google Scholar] [CrossRef]
  21. Bryan, R.B.; Poesen, J. Laboratory experiments on the influence of slope length on runoff, percolation and rill development. Earth Surf. Proc. Land 2010, 14, 211–231. [Google Scholar] [CrossRef]
  22. Bennett, S.J.; Wells, R.R. Gully erosion processes, disciplinary fragmentation, and technological innovation. Earth Surf. Proc. Land 2019, 44, 46–53. [Google Scholar] [CrossRef]
  23. Babazadeh, H.; Ashourian, M.; Shafai-Bajestan, M. Experimental study of headcut erosion in cohesive soils under different consolidation types and hydraulic parameters. Environ. Earth Sci. 2017, 76, 438. [Google Scholar] [CrossRef]
  24. Ashourian, M.; Shafaei Bejestan, M.; Babazade, H. Investigation of headcut erosion in cohesive soils. Water Resour. 2018, 45, 69–78. [Google Scholar] [CrossRef]
  25. Dong, Y.F.; Xiong, D.H.; Su, Z.A.; Li, J.J.; Yang, D.; Zhai, J.; Shi, L.T. Critical topographic threshold of gully erosion in Yuanmou dry-hot valley in southwestern China. Phys. Geogr. 2013, 34, 50–59. [Google Scholar] [CrossRef]
  26. Dong, Y.F.; Xiong, D.H.; Su, Z.A.; Li, J.J.; Yang, D.; Shi, L.T.; Liu, G.C. The distribution of and factors influencing the vegetation in a gully in the dry-hot valley of southwest China. Catena 2014, 116, 60–67. [Google Scholar] [CrossRef]
  27. Dong, Y.F.; Wu, Y.Q.; Qin, W.; Guo, Q.K.; Yin, Z.; Duan, X.W. The gully erosion rates in the black soil region of northeastern China: Induced by different processes and indicated by different indexes. Catena 2019, 182, 104146. [Google Scholar] [CrossRef]
  28. Su, Z.A.; Xiong, D.H.; Dong, Y.F.; Li, J.J.; Yang, D.; Zhang, J.H.; He, G.X. Simulated headward erosion of bank gullies in the dry-hot valley region of southwest China. Geomorphology 2014, 204, 532–541. [Google Scholar] [CrossRef]
  29. Su, Z.A.; Xiong, D.H.; Dong, Y.F.; Zhang, B.J.; Zhang, S.; Zheng, X.Y.; Yang, D.; Zhang, J.H.; Fan, J.R.; Fang, H.D. Hydraulic properties of concentrated flow of a bank gully in the dry-hot valley region of southwest China. Earth Surf. Proc. Land 2015, 40, 1351–1363. [Google Scholar] [CrossRef]
  30. Su, Z.A.; Xiong, D.H.; Dong, Y.F.; Yang, D.; Zhang, S.; Zhang, B.J.; Zheng, X.Y.; Zhang, J.H.; Shi, L.T. Influence of bare soil and cultivated land use types upstream of a bank gully on soil erosion rates and energy consumption for different gully erosion zones in the dry-hot valley region, Southwest China. Nat. Hazards 2015, 79, S183–S202. [Google Scholar] [CrossRef]
  31. Yang, D.; Xiong, D.H.; Guo, M.; Su, Z.A.; Zhang, B.J.; Zheng, X.Y.; Fang, H.D. Impact of grass belt position on the hydraulic properties of runoff in gully beds in the Yuanmou dry-hot valley region of southwest China. Phys. Geogr. 2015, 36, 408–425. [Google Scholar] [CrossRef]
  32. Zhang, B.J.; Xiong, D.H.; Su, Z.A.; Yang, D.; Dong, Y.F.; Xiao, L.; Zhang, S.; Shi, L.T. Effects of initial step height on the headcut erosion of bank gullies: A case study using a 3D photo-reconstruction method in the dry-hot valley region of southwest China. Phys. Geogr. 2016, 37, 409–429. [Google Scholar] [CrossRef]
  33. Han, P.; Ni, J.R.; Li, T.H. Headcut and bank Landslip in rill evolution. J. Basic Sci. Eng. 2002, 10, 115–125. (In Chinese) [Google Scholar]
  34. Qin, C.; Zheng, F.L.; Zhang, X.C.J.; Xu, X.M.; Liu, G. A simulation of rill bed incision processes in upland concentrated flows. Catena 2018, 165, 310–319. [Google Scholar] [CrossRef]
  35. Qin, C.; Zheng, F.L.; Wilsond, G.V.; Zhang, X.C.J.; Xu, X.M. Apportioning contributions of individual rill erosion processes and their interactions on loessial hillslopes. Catena 2019, 181, 104099. [Google Scholar] [CrossRef]
  36. Rudi, H.; Theo, V.A. Modelling gully erosion for a small catchment on the Chinese Loess Plateau. Catena 2003, 54, 131–146. [Google Scholar]
  37. Wang, T.; Li, P.; Hou, J.M.; Li, Z.B.; Ren, Z.P.; Cheng, S.D.; Xu, G.C.; Su, Y.Y.; Wang, F.C. Response of the meltwater erosion to runoff energy consumption on loessal slopes. Water 2018, 10, 1522. [Google Scholar] [CrossRef]
  38. Li, Z.B.; Lu, K.X.; Ding, W.F. Study on the dynamic process of rill erosion of loess slope surface. Int. J. Sediment. Res. 2001, 16, 308–314. [Google Scholar]
  39. Li, M.; Yao, W.Y.; Chen, J.N.; Ding, W.F.; Yang, J.F.; Li, L.; Yang, C.X. Experimental study on changeable characteristics of runoff energy in hillslope-gully slope erosion system with different grass coverage. J. Soil Water Conserv. 2005, 19, 13–17. (In Chinese) [Google Scholar]
  40. Wei, X.; Li, X.G.; Li, Z.B. Experimental study on variable characteristics of runoff energy in convex composite slopes of Loessial soil. J. Soil Water Conserv. 2014, 28, 71–76. (In Chinese) [Google Scholar]
  41. FAO. Soil Erosion by Water: Some Measures for Its Control on Cultivated Lands; UNESCO: Rome, Italy, 1956; pp. 98–104. [Google Scholar]
  42. Che, X.L. Study of Distribution Characteristic and Evolution of Headward Erosion on Dongzhi Tableland of the Loess Gully Region; Northwest A&F University: Xianyang, China, 2012. (In Chinese) [Google Scholar]
  43. Guo, M.M.; Chen, Z.X.; Wang, W.L.; Wang, T.C.; Shi, Q.H.; Kang, H.L.; Zhao, M.; Feng, L.Q. Spatiotemporal changes in flow hydraulic characteristics and soil loss during gully headcut erosion under controlled conditions. Hydrol. Earth Syst. Sci. 2021, 25, 4473–4494. [Google Scholar] [CrossRef]
  44. Li, M.; Song, X.Y.; Shen, B.; Li, H.Y.; Meng, C.X. Influence of vegetation change on producing runoff and sediment in gully region of Loess Plateau. J. Northwest Sci-Tech Univ. Agric. For. (Nat. Sci. Ed.) 2006, 34, 117–120. (In Chinese) [Google Scholar]
  45. Zhang, H.X. The characteristics of hard rain and its distribution over the Loess Plateau. Acta Geogr. Sin. 1983, 38, 416–425. (In Chinese) [Google Scholar]
  46. Dai, Q.H.; Peng, X.D.; Zhao, L.S.; Shao, H.B.; Yang, Z. Effects of underground pore fissures on soil erosion and sediment yield on karst slopes. Land Degrad. Dev. 2017, 28, 1922–1932. [Google Scholar] [CrossRef]
  47. Govers, G. Relationship between discharge, velocity and flow area for rills eroding loose, non-layered materials. Earth Surf. Proc. Land 1992, 17, 515–528. [Google Scholar] [CrossRef]
  48. Zhang, G.H.; Liu, B.Y.; Liu, G.B.; He, X.W.; Nearing, M.A. Detachment of undisturbed soil by shallow flow. Soil Sci. Soc. Am. J. 2003, 67, 713–719. [Google Scholar] [CrossRef]
  49. Huang, Y.H.; Chen, X.Y.; Li, F.H.; Zhang, J.; Lei, T.W.; Li, J.; Chen, P.; Wang, X.F. Velocity of water flow along saturated loess slopes under erosion effects. J. Hydrol. 2018, 561, 304–311. [Google Scholar] [CrossRef]
  50. Obiechefu, G.C. The impact of velocity fluctuations and hydraulic flow conditions in small channel headcut erosion. In ASABE Annual International Meeting, Montreal, Canada; American Society of Agricultural and Biological Engineers: St. Joseph, MI, USA, 2014. [Google Scholar]
  51. Carson, M.A.; Kirkby, M.J. Hillslope Form and Process; Cambridge Univ. Press: Cambridge, UK, 1972. [Google Scholar]
  52. Fox, D.M.; Bryan, R.B. The relationship of soil loss by interrill erosion to slope gradient. Catena 2000, 38, 211–222. [Google Scholar] [CrossRef]
  53. Liu, D.D.; She, D.L.; Yu, S.E.; Shao, G.C.; Chen, D. Rainfall intensity and slope gradient effects on sediment losses and splash from a saline-sodic soil under coastal reclamation. Catena 2015, 128, 54–62. [Google Scholar] [CrossRef]
  54. Shi, Q.H. Experimental Study of Hydrodynamic Processes and Gully Head Morphological Evolution in the LOESS Yuan; Northwest A&F University: Xianyang, China, 2022. (In Chinese) [Google Scholar]
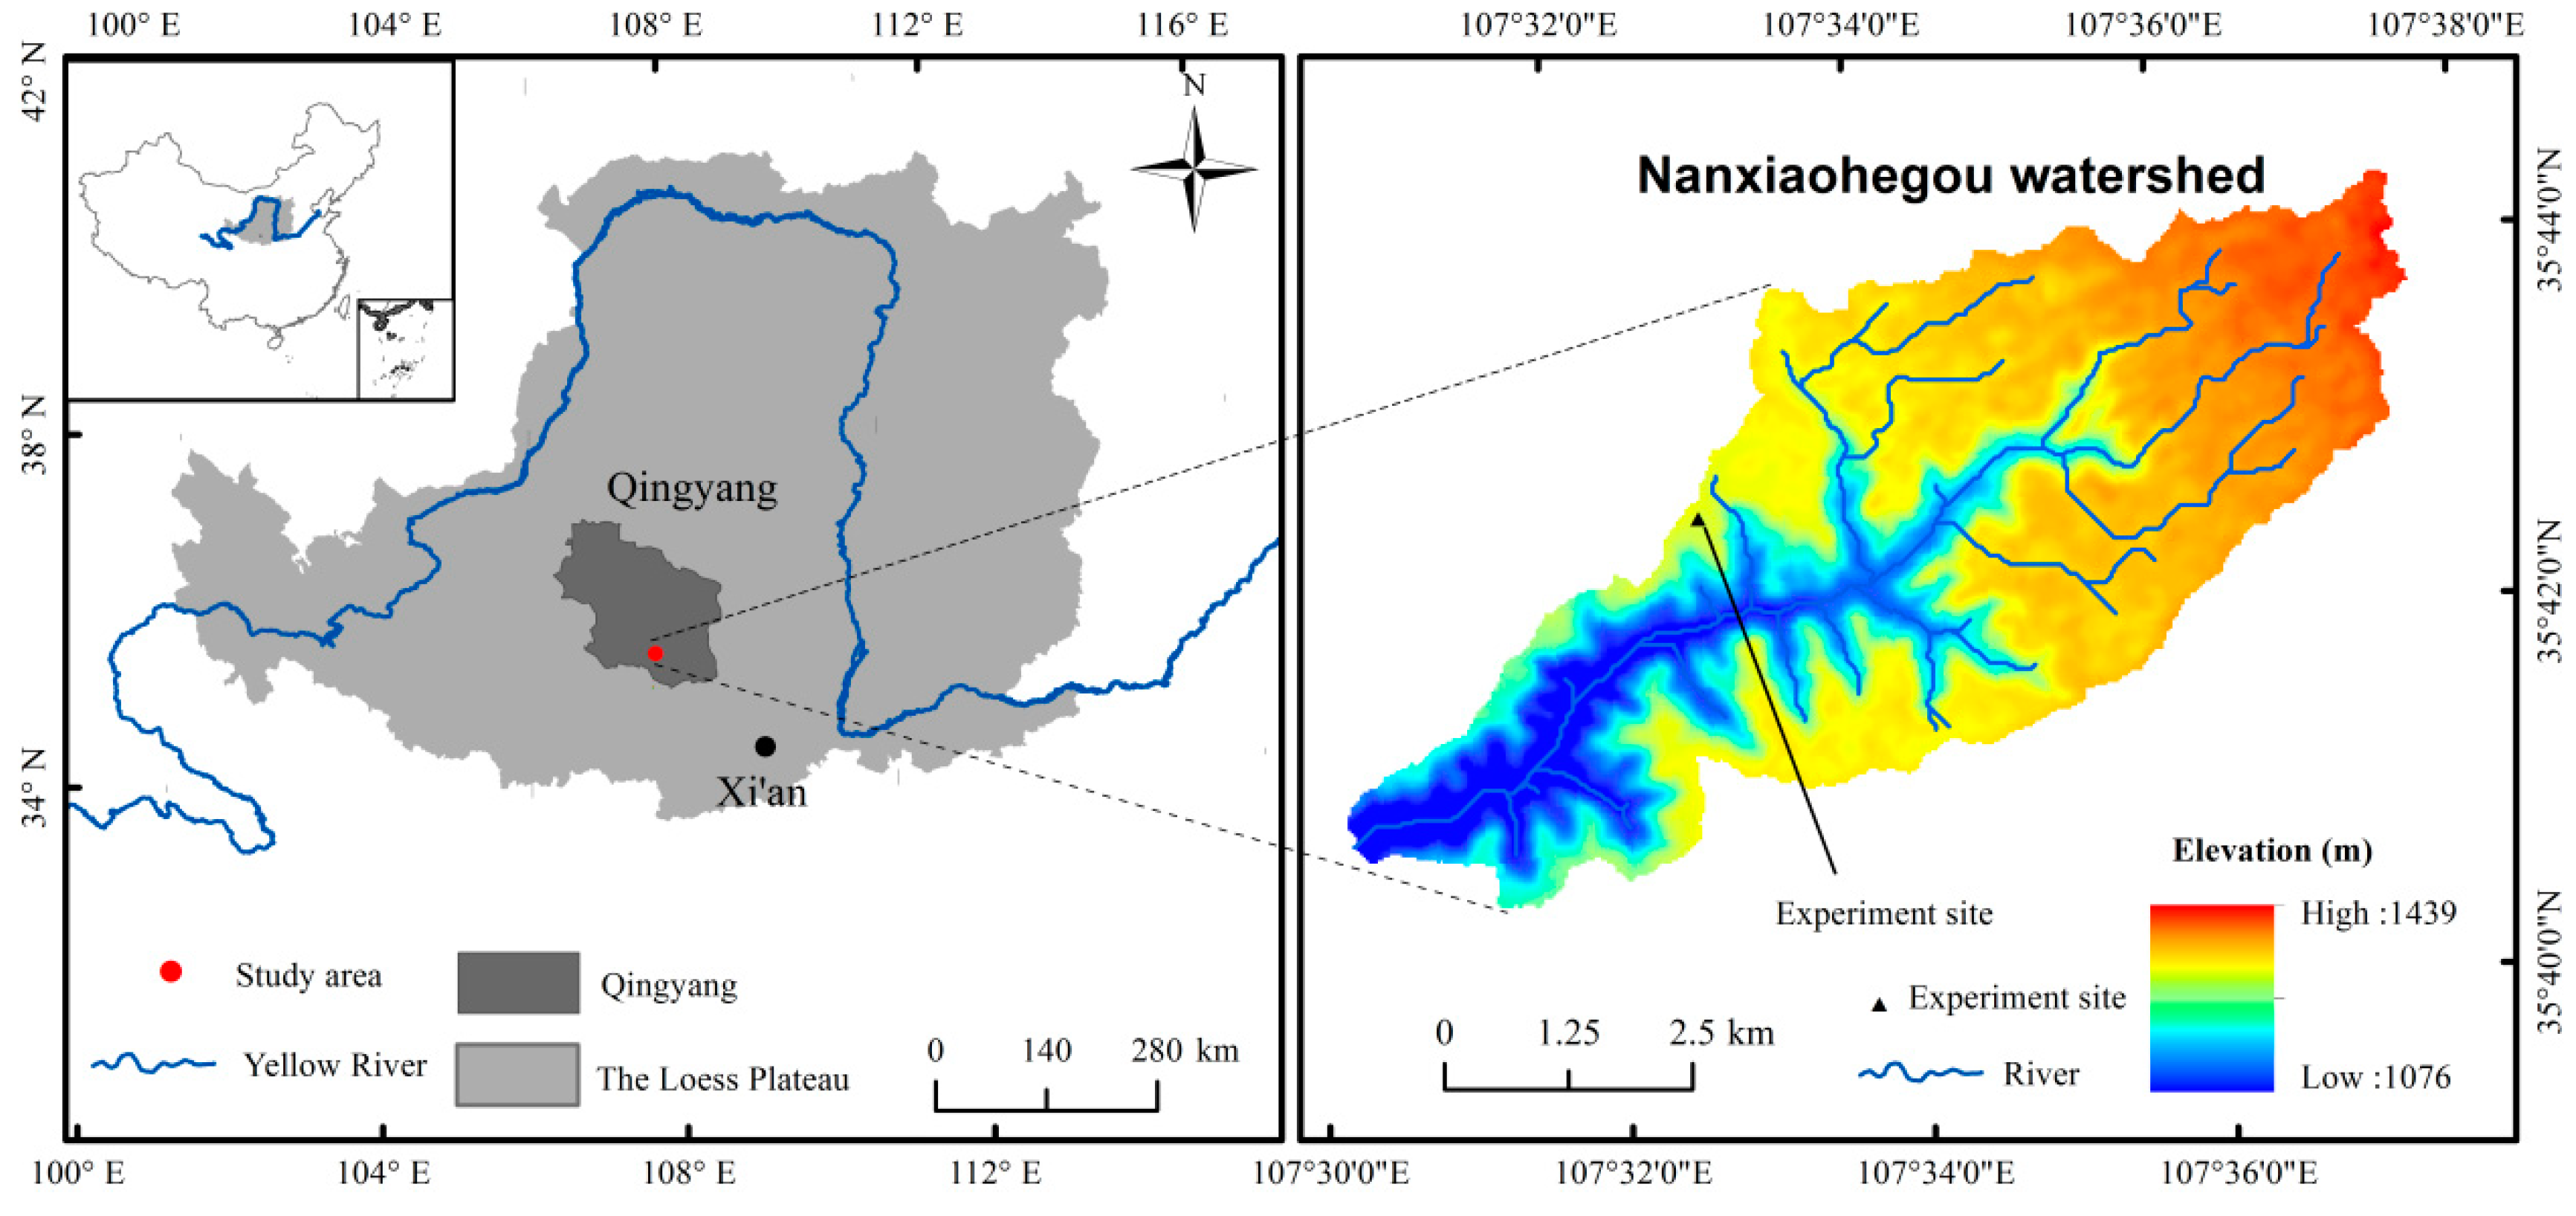
Figure 1. Location of the Nanxiaohegou watershed.
Water 14 03038 g001
Figure 2. Severe headcut erosion in the study area.
Water 14 03038 g002
Figure 3. Schematic diagram and experimental processes of the simulated experimental plot.
Water 14 03038 g003
Figure 4. Kinetic energy values in the upstream catchment area and downstream gully bed under different slope gradients and flow discharges.
Water 14 03038 g004
Figure 5. Potential energy variations in the downstream gully bed through the time of the experiment.
Water 14 03038 g005
Figure 6. Potential energy at the bottom of the downstream gully bed under different slope gradients and flow discharges.
Water 14 03038 g006
Figure 7. Flow energy consumption values of the gully head and the total plot.
Water 14 03038 g007
Figure 8. Sediment yield during different time periods.
Water 14 03038 g008
Figure 9. Sediment yield under different slope gradients and flow discharges.
Water 14 03038 g009
Figure 10. Relationship between the cumulative flow energy consumption and the sediment yield.
Water 14 03038 g010
Publisher’s Note: MDPI stays neutral with regard to jurisdictional claims in published maps and institutional affiliations.