1. Introduction
Groundwater is considered one of the safest and most important sources of water for domestic, agricultural, and industrial uses in the present world [
1]. In Bangladesh, around 98% of potable water and about 80% of the irrigation water supply in the dry season is from groundwater [
2]. However, groundwater is not equally available across the country. Among the four major physiographic units in Bangladesh, the Tertiary Hills in the northern and eastern fringes of the country occupy about 18% of the land and are home to 1.11% of the population [
3]. Hill tract communities have long been experiencing a safe drinking water crisis, particularly during the dry period, when most of the surface water sources deplete [
4,
5]. Generally, groundwater is not used to its full potential in the hilly region due to the geological complexity, the greater depth of aquifers at the top of hilly surfaces, the inadequate availability of data, and inaccessibility that prevents conducting rigorous investigations on groundwater. Thus, these hilly regions in Bangladesh have remained underprivileged zones compared to the other parts of the country in terms of sustainable groundwater development.
A few water quality investigations [
6,
7,
8,
9,
10,
11,
12,
13] have been performed in the hill districts of south-eastern Bangladesh up to this point. However, no groundwater quality assessment study has yet been conducted in the town of Khagrachhari in the Sadar Upazila, which is considered a significant area in this hill district due to its role as the center of local administration, its importance for the livelihood of a large hill tract community, and its extensive agricultural activity due to having relatively flat land surrounded by hills. The town is situated in a syncline, where the Pleistocene Dupi Tila Formation constitutes a very productive aquifer [
14]. Consequently, groundwater provides most of the water supply for about 111,833 people living in this area [
3]. A detailed assessment of groundwater quality for drinking and irrigation uses in this area is, therefore, very important. Groundwater chemistry, i.e., the composition and concentrations of dissolved constituents in water, play a significant role in determining the quality of water [
15,
16]. Anthropogenic actions may alter water composition extensively through the direct effects of contamination and the indirect consequences of water development [
15]. Fundamental data used in different water quality assessments are obtained by chemical analyses of water samples in the laboratory as well as onsite measurements of the physicochemical parameters of water in the field [
15]. A number of scientists and organizations have established benchmarks for different water quality parameters based on drinking and irrigation uses [
16,
17,
18,
19,
20,
21,
22,
23,
24,
25]. Irrigation water quality mainly depends on the type and amount of dissolved salts present in the water supply and their effects on crop growth and development. There are some basic criteria for assessing groundwater quality for irrigation purposes [
26]. For example, measures of electrical conductivity are used to address the salinity hazard; estimates of the relative proportion of Na
+ to Ca
2+ and Mg
2+ ions, which is referred to as the sodium adsorption ratio (SAR), are used to address the sodium hazard; and estimates of residual sodium carbonates (RSCs) that take into account the HCO
3− and CO
32− anions and Ca
2+ and Mg
2+ cations in irrigation water are used to address the alkalinity hazard. Drinking water quality has long been evaluated by using the groundwater quality index (GWQI) method [
23,
24,
25,
27,
28,
29,
30,
31,
32,
33,
34].
This study characterizes the groundwater types and assesses the groundwater quality for drinking and irrigation uses in the Khagrachhari Sadar. The results of this study can be considered as the baseline groundwater investigation for this area and be insightful for future water resource development and water quality management planning in this hill district of south-eastern Bangladesh. Moreover, as the major delta part of the country has long been extensively studied in terms of groundwater quality and development, and since the hill tract districts rarely have received proper attention on this issue, this groundwater study can also contribute to further investigations on the complex hilly aquifers of the country.
2. Materials and Methods
2.1. Study Area
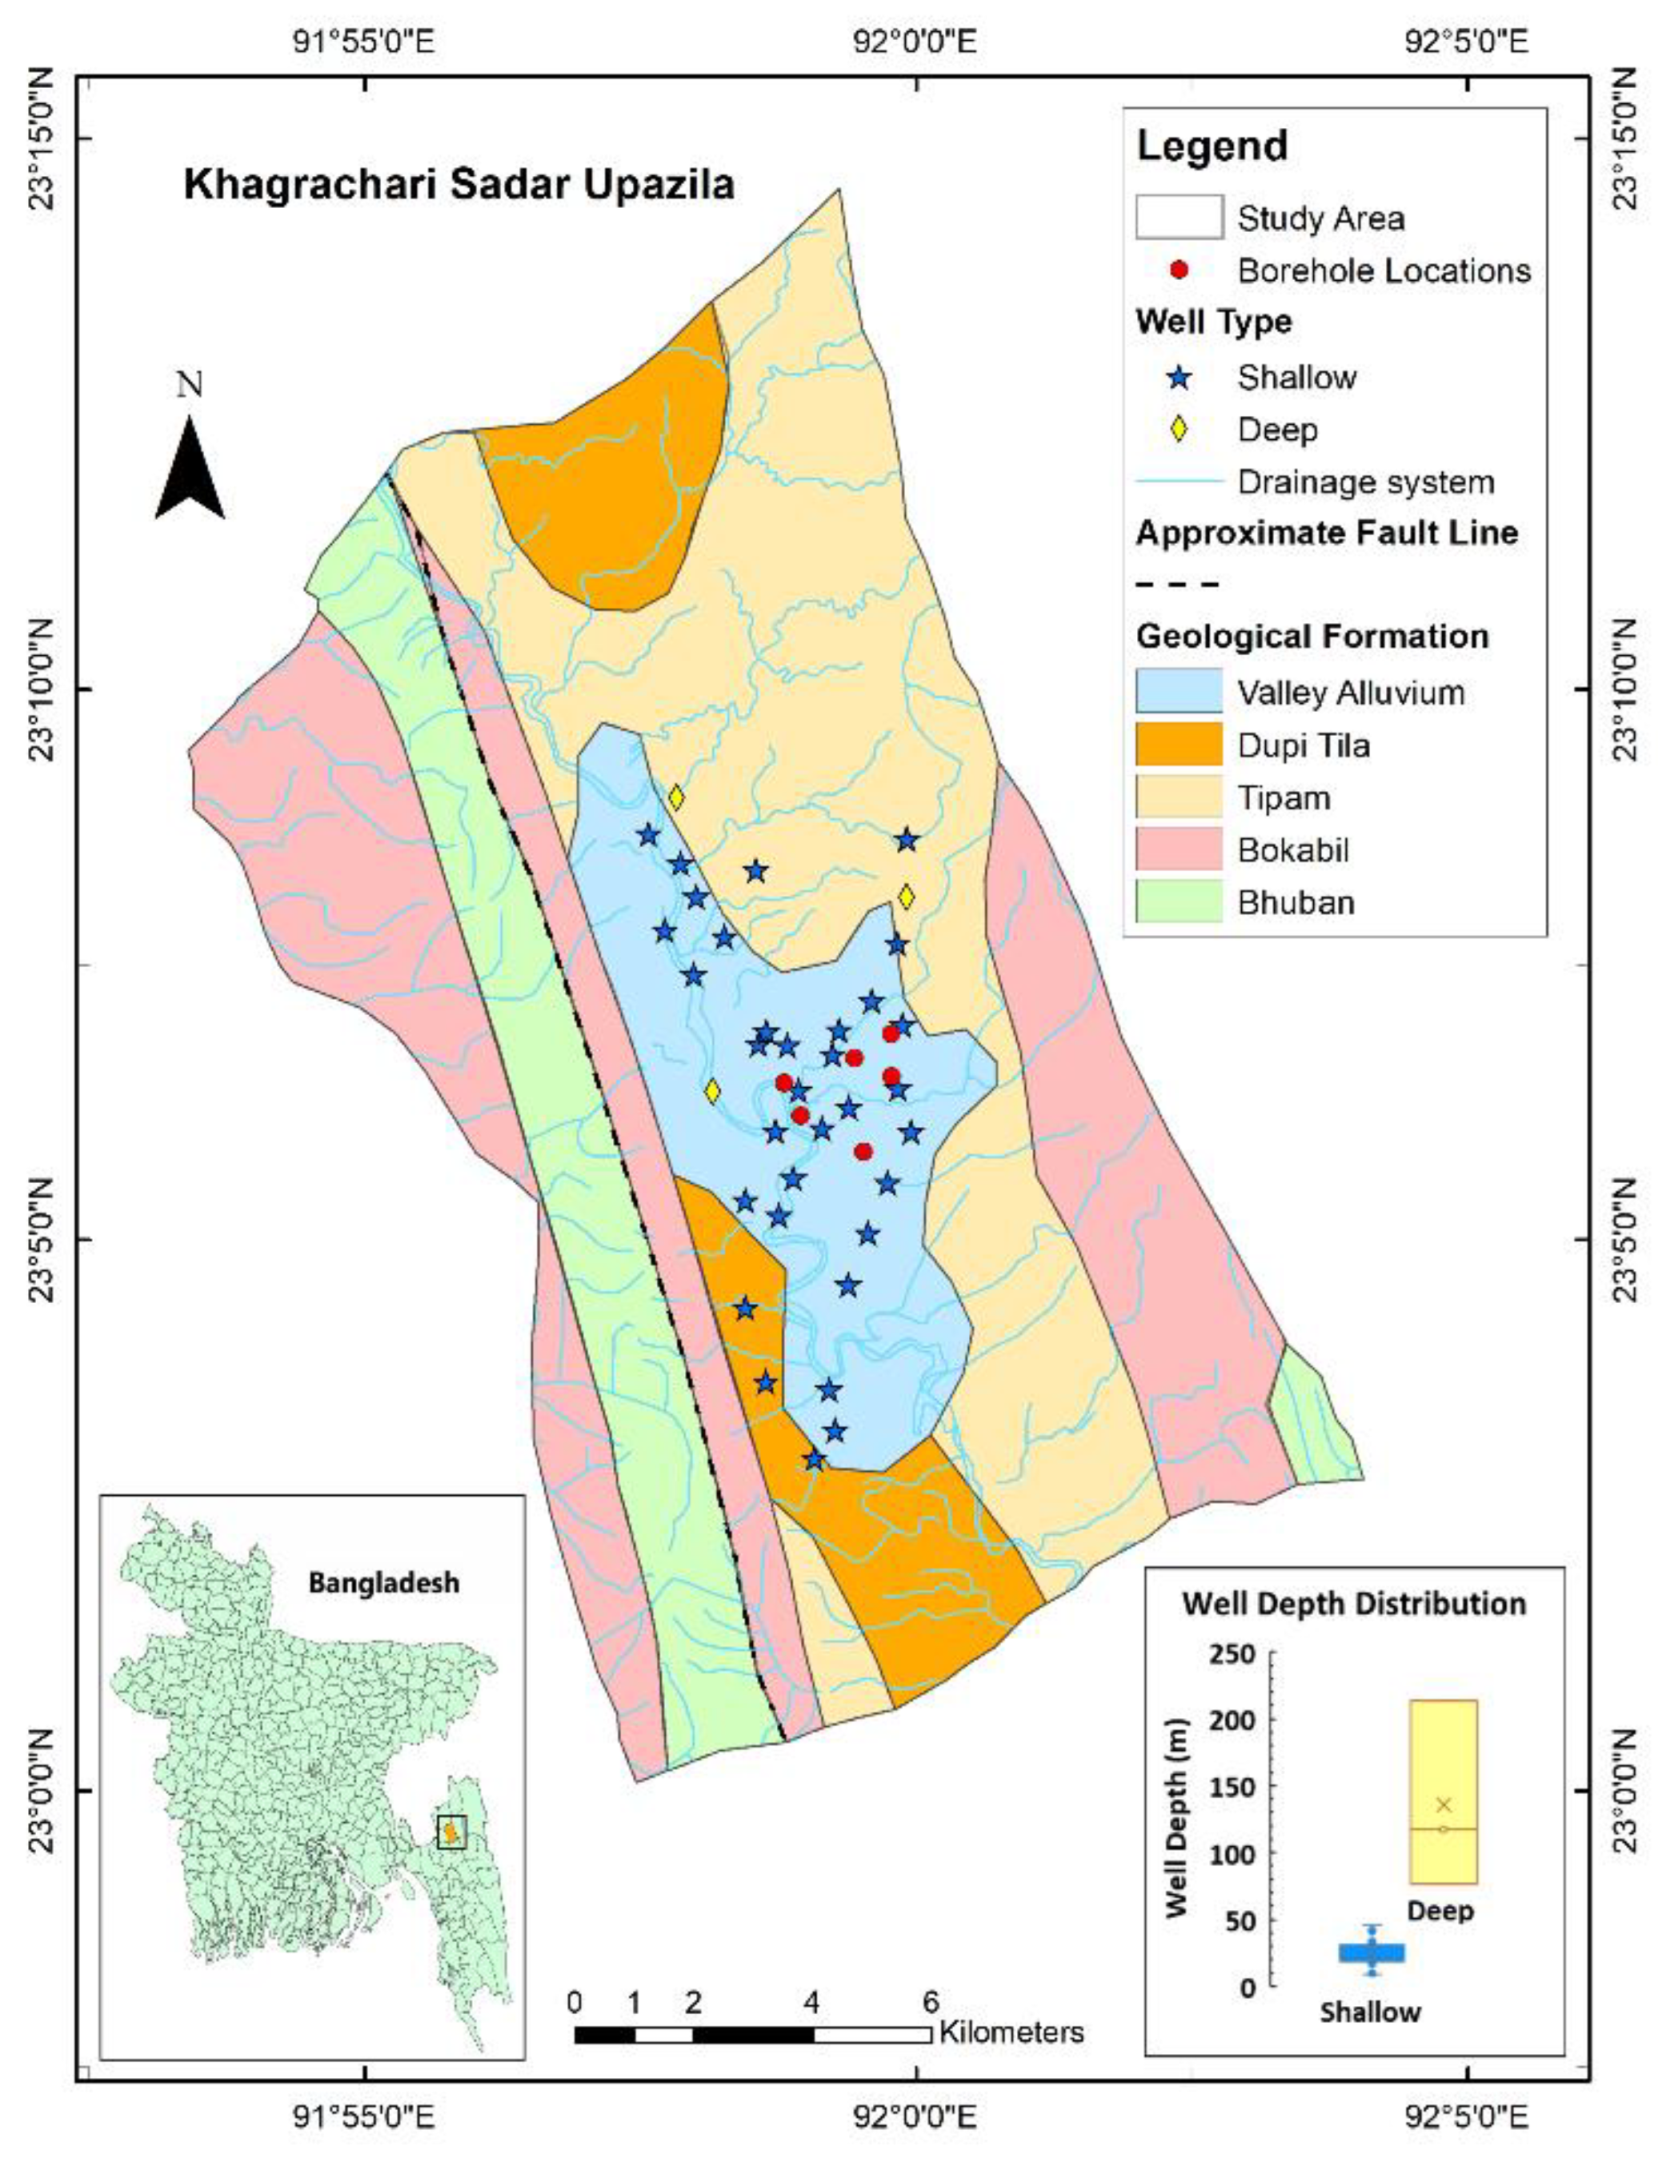
Khagrachhari Sadar is located in a syncline in the eastern Tertiary hilly regions in the Chattogram Division in south-eastern Bangladesh (
Figure 1) [
35]. The eastern Tertiary hilly regions of Bangladesh are composed of alternating anticlines and synclines trending in a north-to-south direction [
14]. The study area occupies a land area of 298 sq km, with 24,316 households [
3,
35]. The annual average rainfall in the study area is 3031 mm, and the annual average temperature varies from 34.6 °C (summer) to 13 °C (winter) [
3]. The Chengi River is the main river in Khagrachhari Sadar, and there are about 592 local ponds, which are sometimes used for domestic and agricultural water supply [
35]. According to the BWDB [
36], there is no available groundwater table hydrograph data for Khagrachhari Sadar. However, since these ponds contain water almost throughout the year [
35], it can be assumed that the fluctuation in groundwater levels between the wet and dry periods is not very high. About 78.3% of households obtain their drinking water supply from groundwater wells, 1.7% from the tap, and the rest from surface water bodies and springs [
3]. Both surface water irrigation, using the main river, canals, ponds, and other water bodies, as well as groundwater irrigation, with water lifted by shallow tube wells, deep tube wells, and other traditional devices, are common in the Khagrachhari area [
35].
2.2. Groundwater Sample Collection and Laboratory Analyses
Groundwater samples were collected in February 2020 (dry season) from 37 tube wells distributed in the study area (
Figure 1). The depth of the water wells ranged from 9 m to 213 m. Based on well depth, these 37 wells were divided into shallow (<50 m) and deep (>50 m) wells in this study. Before sampling, the wells were purged for a short duration to avoid stagnant water in the tube well. Sample bottles were washed properly, and a 0.45 μm membrane filter was used to remove colloidal substances and suspended particles from the water samples. From each well, an acidified (concentrated HNO
3−) and a non-acidified sample were collected in two 120 mL plastic bottles. Acidifying the water sample with concentrated HNO
3− is required to lower the pH value to slow down the precipitation of the dissolved constituents and to act as a preservative. The collected water samples, with appropriate labels, were transported to the Geochemistry Laboratory of the Department of Geology, University of Dhaka; this was performed cautiously, and samples were preserved in a temperature-controlled refrigerator before the lab analyses.
Several physicochemical parameters of the water, such as temperature, EC (electrical conductivity), Eh (oxidation–reduction potential), and pH (potential of hydrogen), were measured at the field site using a portable EC meter (HANNA, model DIST HI 198300/4) and a portable waterproof pH/°C meter (pHep by HANNA, model HI 98127). Total hardness (TH) was calculated in terms of the CaCO
3 equivalent by the following Equation (1) [
21], where Ca
2+ and Mg
2+ are measured in mg/L.
In the laboratory, cations, such as Na
+, K
+, Ca
2+, Mg
2+, Fe
2+, and Mn
2+, were analyzed using an atomic absorption spectrometer (AAS), and anions, such as SO
42−, NO
3−, NO
2−, F
−, Br
−, and PO
43−, were measured using ion chromatography from the acidified samples. The non-acidified samples were analyzed for HCO
3− and Cl
− ions through the acid–base titration method using standard H
2SO
4. The accuracy of the water analysis was estimated using the ionic charge balance error (ICBE) equation [
37], where all cation and anion concentrations are converted into milliequivalents per liter (meq/L).
All the water samples were estimated to have ICBE values within ±10%, which is generally considered an acceptable limit [
37].
2.3. Hydrogeochemical Characterization
The physicochemical parameters of the water samples were analyzed to characterize the groundwater. The chemical analyses of the groundwater samples can be represented using a variety of graphical methods, which help to show the groundwater types in an area based on chemical composition and chemical relationships among ions or groups of ions [
15]. In this study, Piper diagrams, Stiff diagrams, and box plots are used to understand the hydrochemical characteristics of the groundwater.
2.4. Groundwater Quality Assessment for Irrigation
The assessment of groundwater quality for irrigation depends on the dissolved salts and their concentrations. These dissolved salts have a great influence on the productivity and quality of crops. The evaluation of the water quality was performed based on various indicators, such as the sodium adsorption ratio (SAR), the residual sodium carbonate (RSC), and the sodium percentage (SP).
The sodium adsorption ratio (SAR) provides a useful index of the possible sodium hazard in irrigation water. Sodium hazard can reduce the permeability of the soil and hinder the absorption of water by crops [
38]. The SAR is related to the amount of Na
+ relative to Ca
2+ and Mg
2+, measured in meq/L, in water and is determined by the following Equation (3) [
18,
20]:
Groundwater can be classified based on SAR values as follows: excellent (<10), good (10–18), doubtful (18–26), and unsuitable for irrigation (>26) [
18,
20,
39,
40,
41,
42]. Water with a very high SAR value is considered to be unsuitable for irrigation because of the tendency toward long-term damage to the soil structure [
26,
39].
The residual sodium carbonate (RSC) index of the water defines the alkalinity hazard for the soil by measuring the relative concentrations of HCO
3− and CO
32− compared to the concentrations of Ca
2+ and Mg
2+ [
43,
44]. RSC values are calculated using the following Equation (4), as given by Eaton and Richards [
17,
18], where all ions are in meq/L:
Irrigation water can be classified based on RSC values as follows: <1.25 meq/L is good for irrigation, 1.25–2.5 meq/L is doubtful, and >2.5 meq/L is considered to be unsuitable for irrigation [
17,
18,
41,
45]. Water with an excess of CO
32− and HCO
3− that is over the levels of Ca
2+ and Mg
2+ and beyond permissible limits can be harmful to crops and is unsuitable for irrigation [
17,
18].
The sodium percentage (SP) (%Na) is another indicator that relates to sodium hazard. The SP plays a significant role in crop productivity as excess Na
+ ions in water may cause permeability reductions by being absorbed by clay particles and replacing Ca
2+ and Mg
2+ ions, which results in poor internal drainage within the soil [
40]. The SP is calculated by the following formula, which includes Na
+, K
+, Ca
2+, and Mg
2+ ions [
21].
According to Wilcox [
19], irrigation water can be classified based on the SP as follows: excellent (<20), good (20–40), permissible (40–60), doubtful (60–80), and unsuitable for irrigation (>80). A high %Na in the soil can have adverse effects on soil structure, aeration process, and water infiltration [
41,
46]. Agricultural activities, such as the application of fertilizer and pesticides, can increase the sodium content in irrigation water [
40].
Groundwater suitability for irrigation can also be assessed using the Riverside classification [
18] and the Wilcox classification [
19], which are based on water salinity (electrical conductivity) vs. SAR value and sodium percentage (%Na) vs. electrical conductivity, respectively.
2.5. Groundwater Quality Index (GWQI) for Drinking
To assess drinking water quality, GWQI was calculated using several water quality parameters. The calculation of GWQI involves several steps. First, the weight values were assigned for each parameter (pH, TDS, TH, Ca
2+, Mg
2+, Na
+, K
+, Fe
2+ Mn
2+, HCO
3−, SO
42−, Cl
−, F
−, Br
−, NO
3−, NO
2−, and PO
43−) depending on their importance for the water quality assessment and risk to human health; e.g., a value of 5 for health-based criteria, 3 for aesthetic criteria, and 1 for the criteria that pose less risk to health and aesthetic objectives (
Table 1) [
16].
Although arsenic is considered a significant water quality constituent, it was not included in the analysis and evaluation of GWQI in this study. Naturally occurring elevated levels of arsenic are often found in shallow Holocene aquifers in the Bengal basin [
47,
48,
49]; in contrast, despite the lack of sufficient data and testing, the hill districts of Bangladesh are known as a low-arsenic zone, perhaps due to the geological setting that differs from that of the delta part of the country. In addition, a recent environmental monitoring report published by the Chittagong Hill Tracts Rural Development Project-II showed that the arsenic concentrations in 12 tube wells from Khagrachhari Sadar Upazila were ≤0.001 mg/L, which is within the Bangladesh standard limit (<0.05 mg/L) [
50]. Microbial testing was also excluded from this study because the risk of bacteriological contamination in the groundwater of Bangladesh is more likely associated with the infrastructure of the hand tube wells and problems with the different stages of water collection and end-use, including the use of unhygienic containers for collection, transport, storage, and drinking [
51]; such issues do not necessarily connect to the actual aquifer water quality. However, a further study that includes arsenic and microbial testing should be undertaken before the drinking water is considered completely safe.
Table 1.
List of groundwater quality parameters, with their standards, according to recommended drinking water quality guidelines [
16,
52] and the assigned and relative weights that were used in the calculation of GWQI.
Table 1.
List of groundwater quality parameters, with their standards, according to recommended drinking water quality guidelines [
16,
52] and the assigned and relative weights that were used in the calculation of GWQI.
| Groundwater Quality Parameter | Unit | Standard (Si) | Weight (wi) | Relative Weight (Wi) |
|---|
| NO3− | mg/L | 10 | 5 | 0.102 |
| NO2− | mg/L | <1 | 5 | 0.102 |
| F− | mg/L | 1 | 5 | 0.102 |
| TDS | mg/L | 1000 | 3 | 0.061 |
| 1 TH | mg/L | 200–500 | 3 | 0.061 |
| 1 pH | - | 6.5–8.5 | 3 | 0.061 |
| SO42− | mg/L | 400 | 3 | 0.061 |
| Cl− | mg/L | 600 | 3 | 0.061 |
| Ca2+ | mg/L | 75 | 3 | 0.061 |
| Mg2+ | mg/L | 35 | 3 | 0.061 |
| Fe2+ | mg/L | 1 | 3 | 0.061 |
| Mn2+ | mg/L | 0.1 | 3 | 0.061 |
| Na+ | mg/L | 200 | 3 | 0.061 |
| PO43− | mg/L | 6 | 1 | 0.020 |
| HCO3− | mg/L | 200 | 1 | 0.020 |
| Br− | mg/L | 6 | 1 | 0.020 |
| K+ | mg/L | 12 | 1 | 0.020 |
| Total | | | 49 | 1.000 |
In the second step, the relative weights were calculated from the assigned weight for each parameter (wi) and the sum of the weights assigned for the parameters, using the following equation:
where Wi = relative weight, wi = weight for each parameter, i = individual parameter, and n = total number of parameters. In the third step, the quality rating (Qi) for each parameter was derived by taking its concentration in each water sample (Ci) divided by its respective standard and then multiplied by 100.
where Qi = quality rating, Ci = concentration of each groundwater quality parameter, Si = water quality standard for each parameter, and i = individual parameter. The standard for each parameter was chosen according to the water quality parameters in the Bangladesh Standards [
52], except bromide (Br
−). For Br
−, the WHO guideline for drinking water [
16] was used as this parameter was not included in the Bangladesh Standards.
The final GWQI score for each water sample was obtained by taking the sum of the quality rating scores of each parameter (Qi) multiplied by their relative weight (Wi).
where GWQI = groundwater quality index, Qi = quality rating, Wi = relative weight, n = total number of parameters, and i = individual parameter.
GWQI scores make it possible to categorize the suitability of groundwater for human consumption according to the following categories: excellent (<50), good (50–100), poor (101–200), very poor (201–300), and unsuitable for drinking purposes (>300) [
24,
33].
3. Results and Discussion
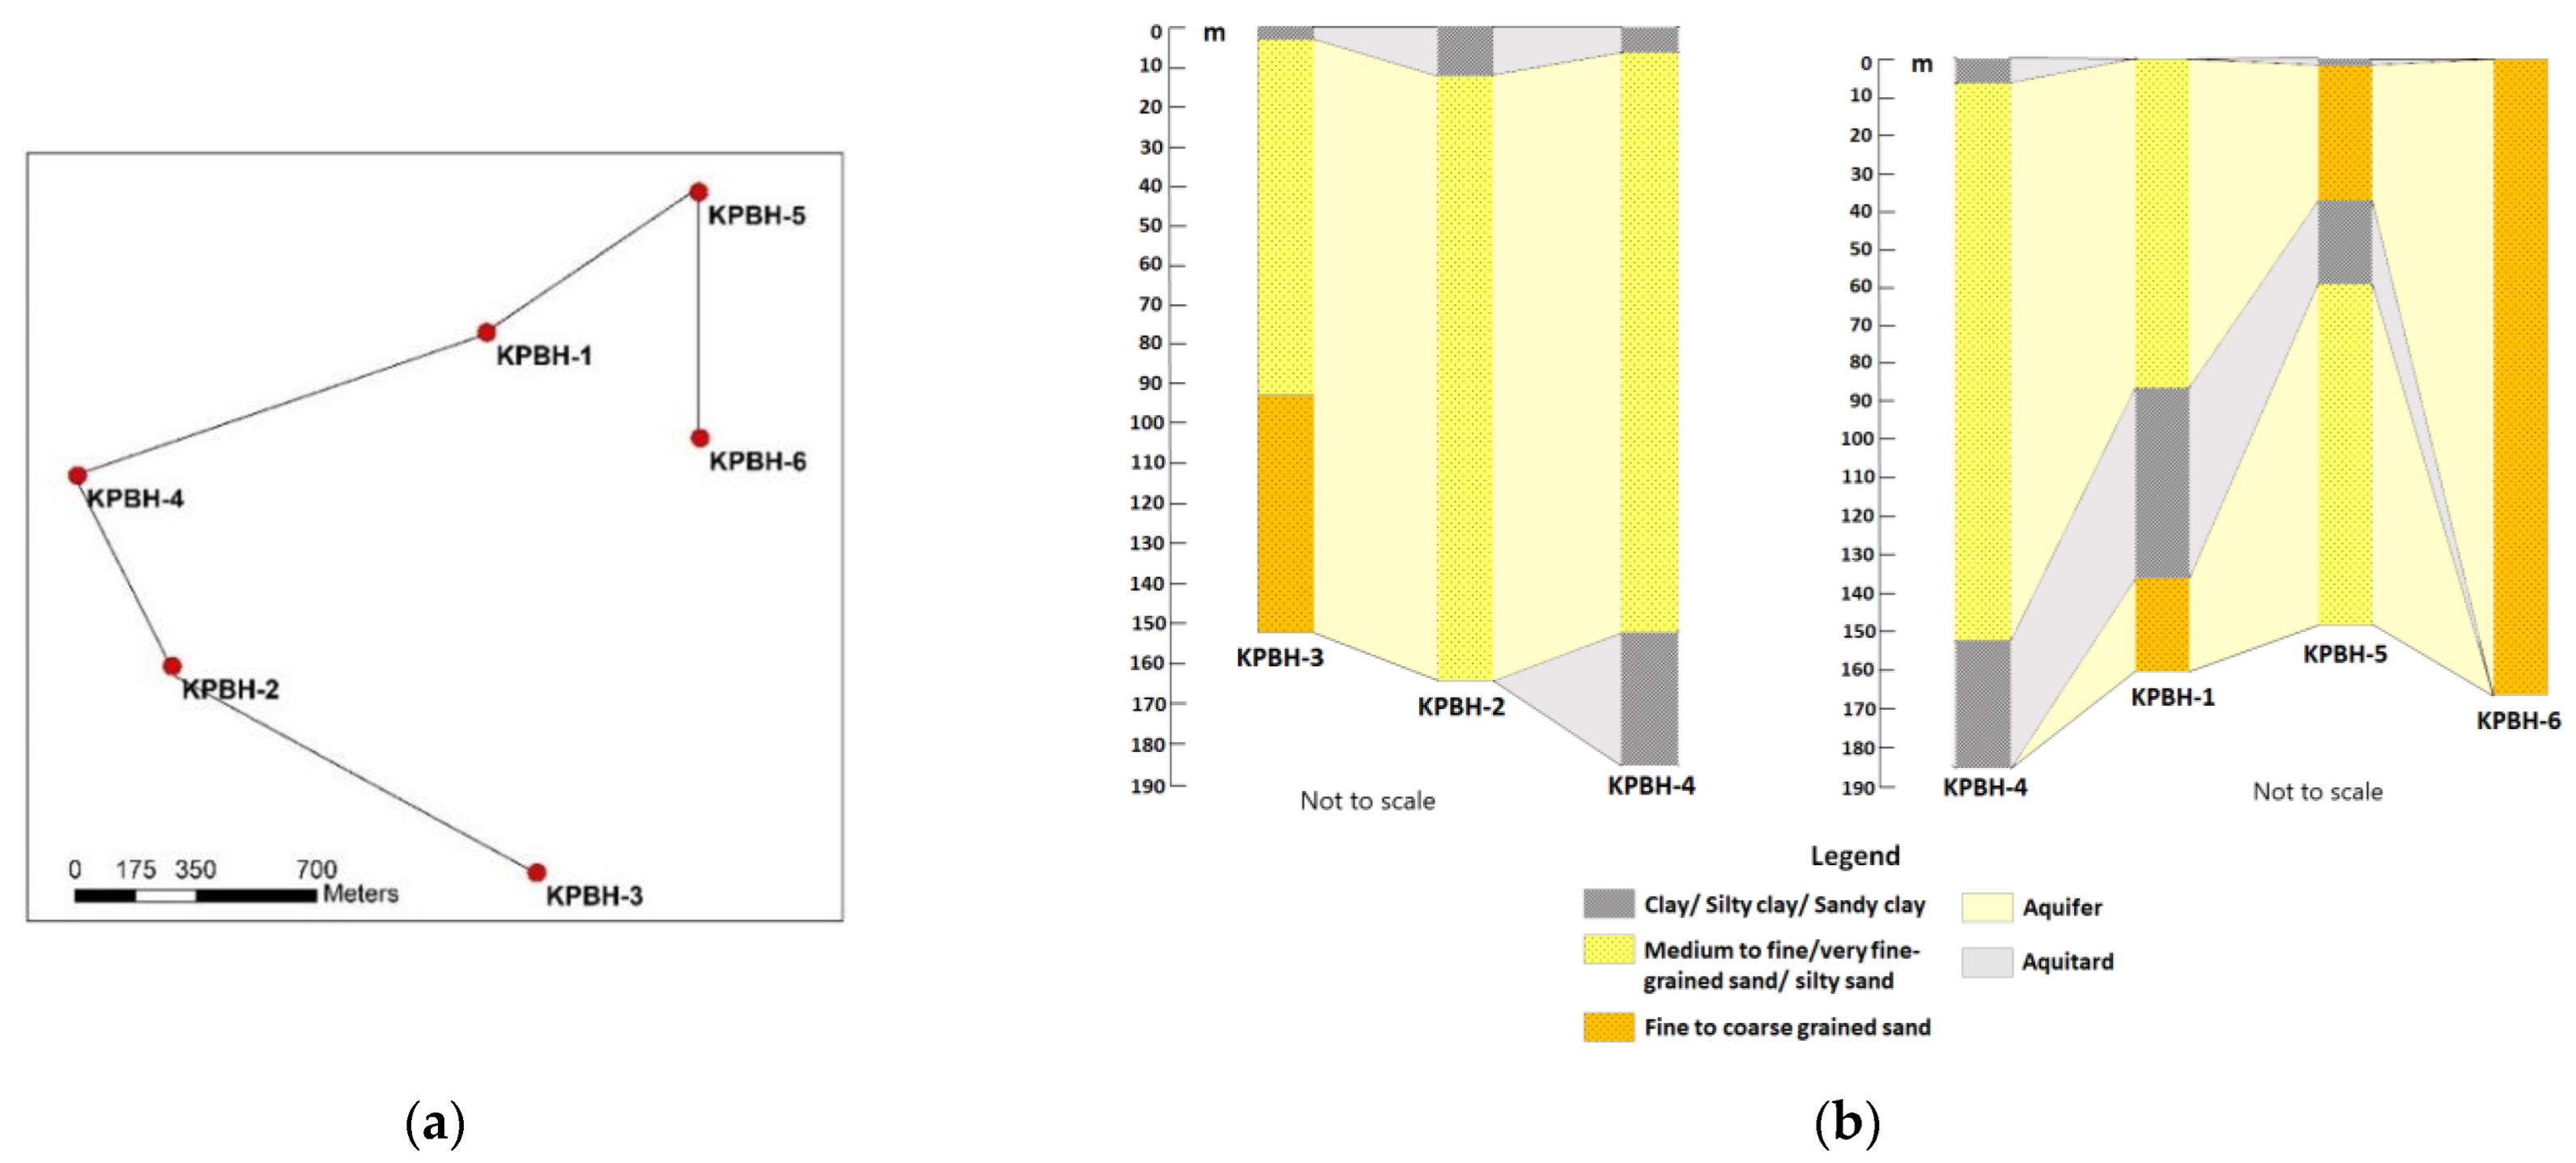
3.1. Aquifer Delineation
The aquifer was delineated based on data from six borehole logs from the Department of Public Health Engineering (DPHE) of Bangladesh (
Figure 1 and
Figure 2a). Based on the borehole logs, a very thick sandy aquifer dominates in the shallow subsurface ranging from 40 to 160 m, which is sometimes separated by a thin layer (20–45 m) of clayey deposits at variable depths (
Figure 2b). There are two major aquifers present in the study area: the Plio-Pleistocene-aged Dupi Tila sandstone formation and the Pliocene-aged Tipam sandstone formation (
Figure 1 and
Figure 2b) [
14,
53]. Although recent valley alluvium covers the central part of the Khagrachhari Sadar region, both sand-dominated formations are exposed in other parts of the area (
Figure 1). Moreover, the medium to fine-grained Dupi Tila aquifer and the fine to coarse-grained Tipam aquifer can both be found at shallow depths (
Figure 2b); however, it is often difficult to distinguish these two aquifers [
14]. At greater depths, interbeds of sandstone from the Bokabil or Bhuban formations may act as the deeper aquifer [
14]. However, the DPHE boreholes collected data for up to 183 m of the subsurface, which results in a focus mainly on the shallow aquifers (
Figure 2b).
3.2. Physicochemical Characterization of Groundwater
The results for each of the physicochemical parameters are discussed in the subsequent sections.
3.2.1. Electrical Conductivity (EC)
Electrical conductivity (EC) is the measurement of the ionic concentration of the groundwater samples; it varies according to the temperature and type of ions present [
15,
23]. EC is an important parameter in groundwater quality assessment for both drinking and irrigation. In general, the EC of groundwater increases with depth, but high EC in water samples from shallow aquifers may be an indicator of contamination due to anthropogenic activities [
54]. However, the maximum EC value found was 460 µS/cm (
Table A1 in
Appendix A), which is below the safe drinking water limit of 1500 µS/cm [
16]. All EC values for the water samples collected from the Khagrachhari Sadar ranged from excellent (81.1%) to good (18.9%) (
Table 2) [
19].
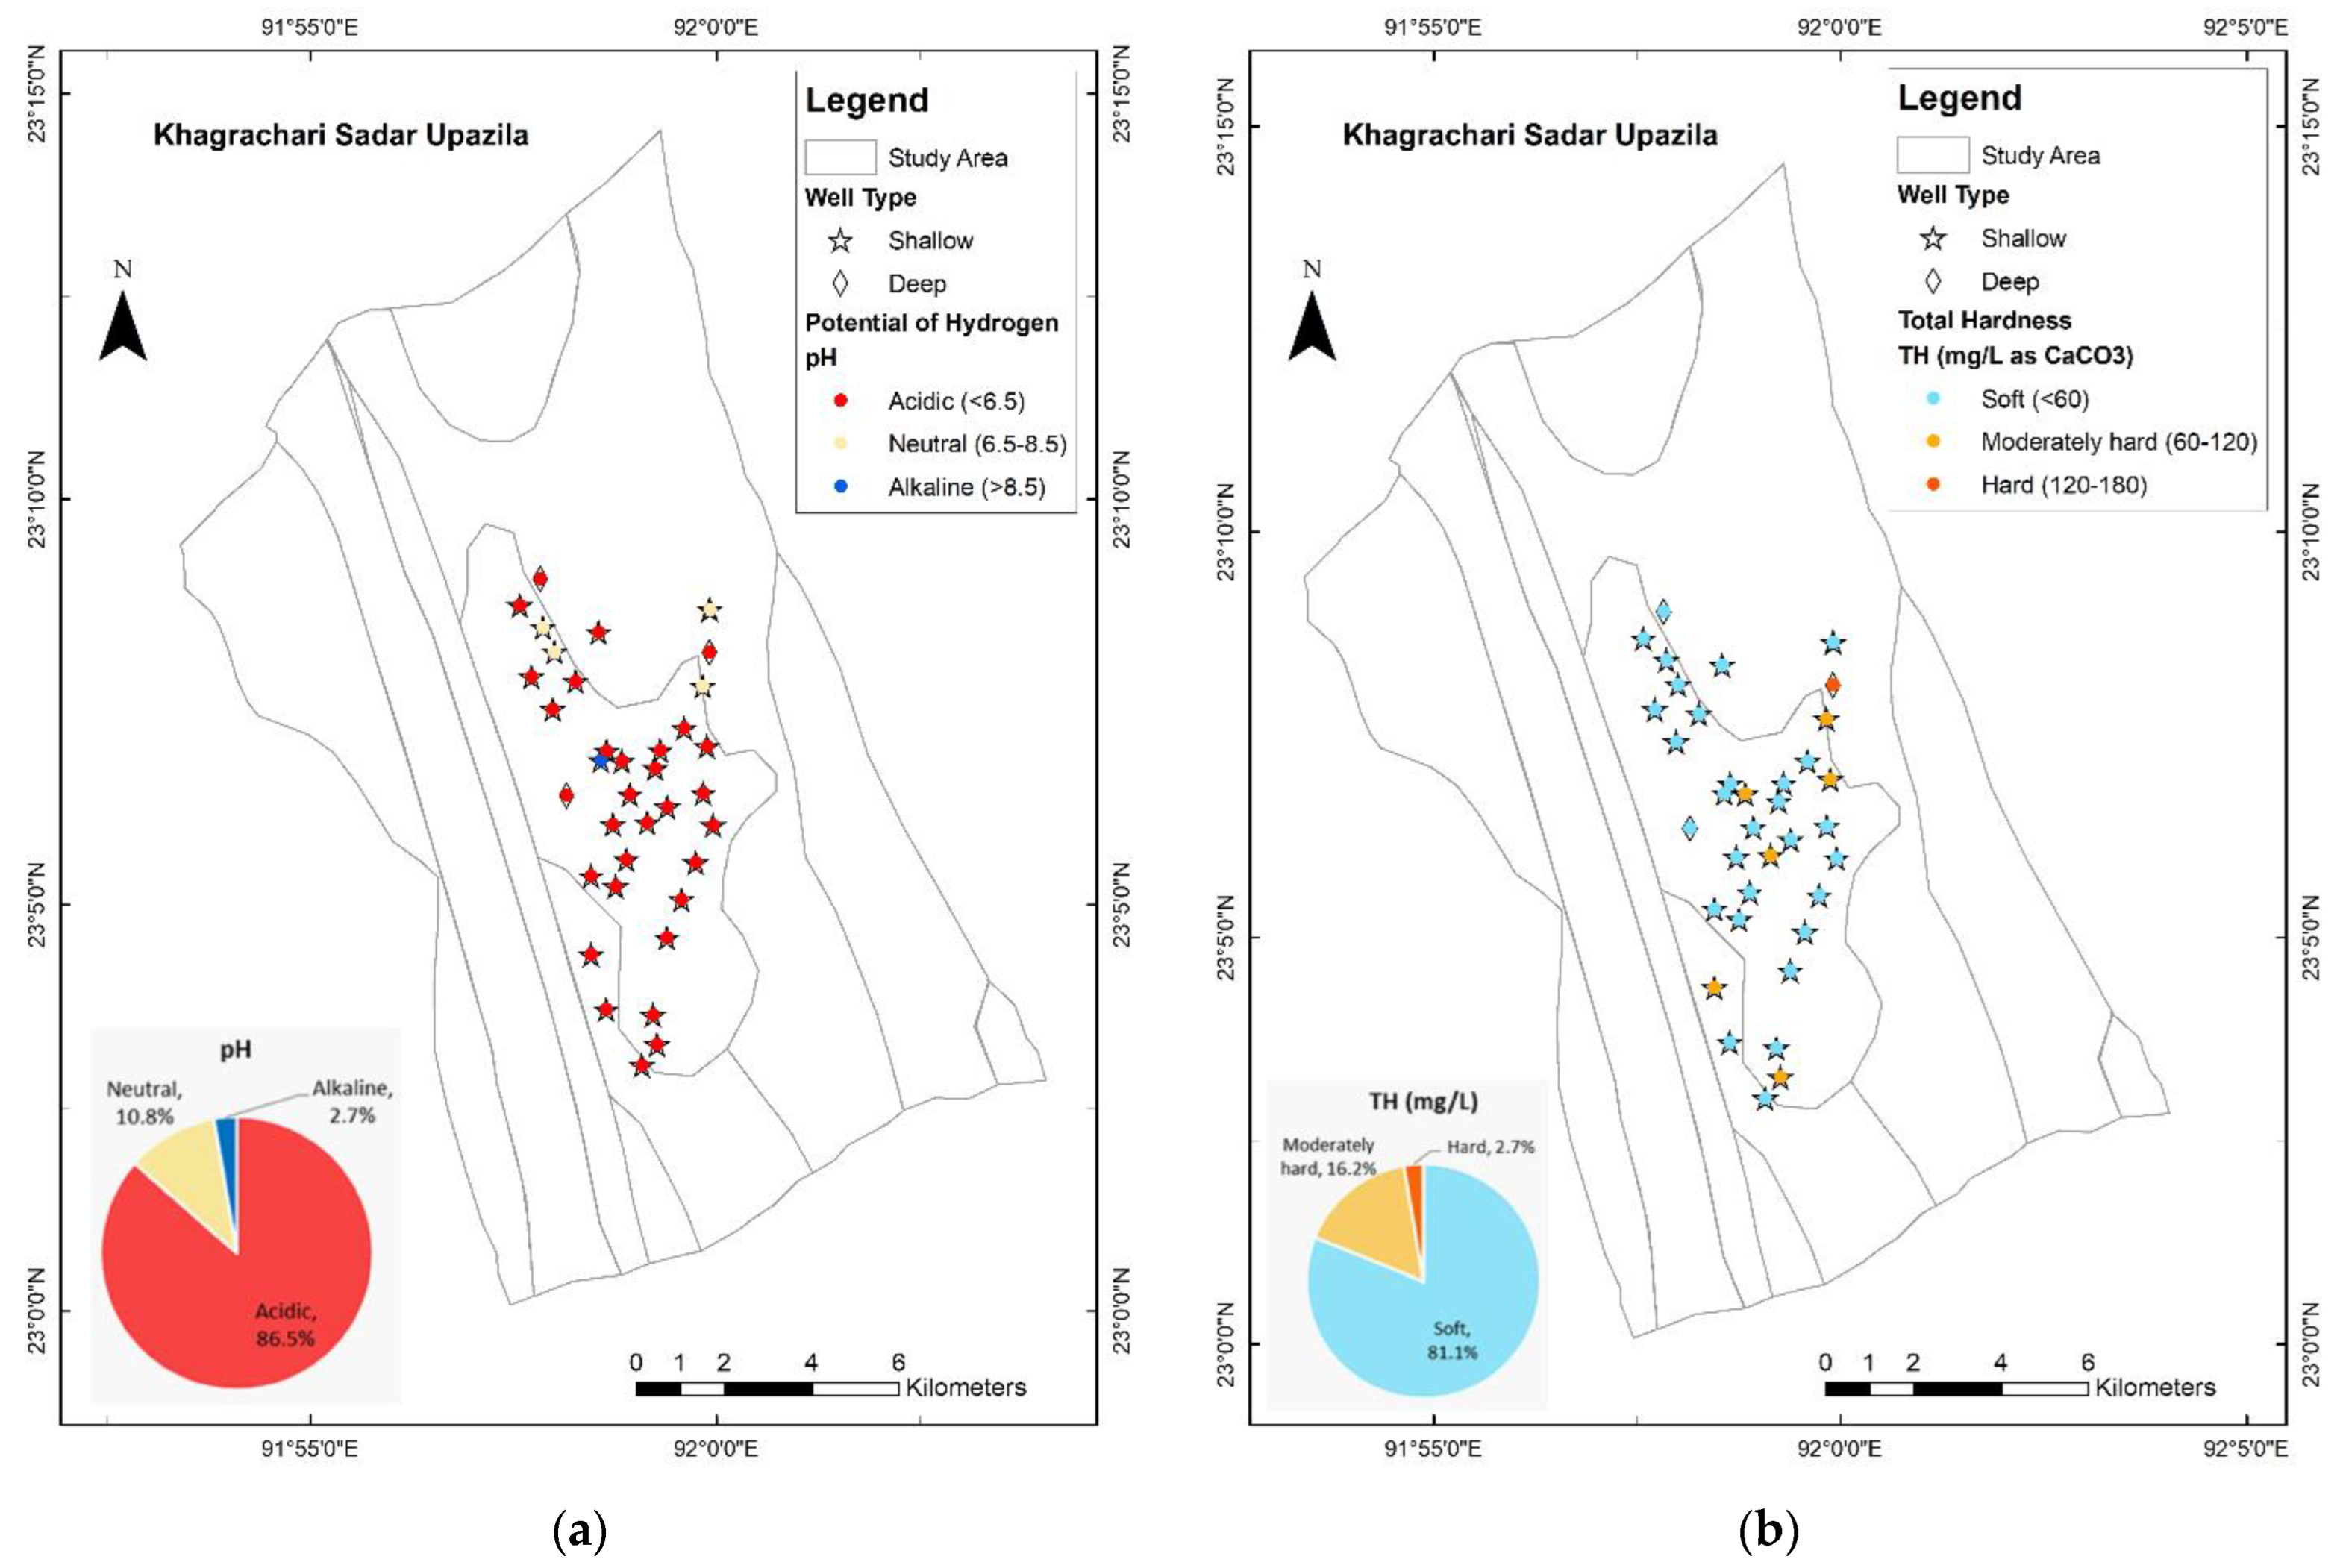
3.2.2. Potential of Hydrogen (pH)
pH is another important operational quality parameter of groundwater; it indicates the state of acidity and alkalinity of the water. The normal pH range for drinking water is considered to be between 6.5 and 8.5 [
16]. The mean pH value of the groundwater in the study area was 5.98, which indicates acidic groundwater; the maximum and minimum pH values were 8.55 and 4.08, respectively (
Table A1 in
Appendix A). A total of 86.5% of wells, including three deep wells, had acidic water, while 10.8% had neutral and 2.7% had alkaline water (
Table 2;
Figure A1a in
Appendix A). Although slightly acidic or alkaline water has no direct impact on health, lower pH (acidic) water has the tendency to be corrosive and can damage water pipes [
16].
3.2.3. Redox Potential (Eh)
The redox potential is a numerical index of the intensity of the oxidizing or reducing environments within an aquifer system, where positive and negative potentials indicate the relative oxidizing and reducing conditions of the system, respectively [
15]. This potential is measured as Eh, with the millivolt as its unit. The groundwater samples collected from the Khagrachhari Sadar all showed positive Eh values, ranging from 23 to 323 millivolts (
Table A1 in
Appendix A), indicating the presence of relatively oxidizing conditions in the aquifers.
3.2.4. Total Hardness (TH)
The maximum and minimum values for total hardness calculated from the concentration of Ca
2+ and Mg
2+ were 144.4 and 15.89 mg/L as CaCO
3, respectively (
Table A1 in
Appendix A). A TH above 200 mg/L, along with other interacting parameters, such as higher pH and alkalinity, may cause scale deposition in pipe distribution systems and water tanks [
16]. Hence, there are very low chances of scale accumulation in the pipelines in the study area.
In addition, based on the TH value, water can be categorized as soft (<60), moderately hard (60–120), hard (120–180), or very hard (>180) [
22]. According to this classification system, 81.1% of the water wells in Khagrachhari Sadar contain soft water, 16.2% moderately hard water, and 2.7% hard water (
Table 2;
Figure A1b in
Appendix A). The spatial map indicates that one deep well has hard water, and six shallow wells have moderately hard water, while the rest of the wells, including two deep wells, have soft water (
Figure A1b in
Appendix A). Corrosion is typically associated with soft and acidic water [
16]; therefore, wells containing both soft and low-pH water, shown in
Figure A1a,b in
Appendix A, should be under observation and monitoring.
3.2.5. Water Quality Constituents
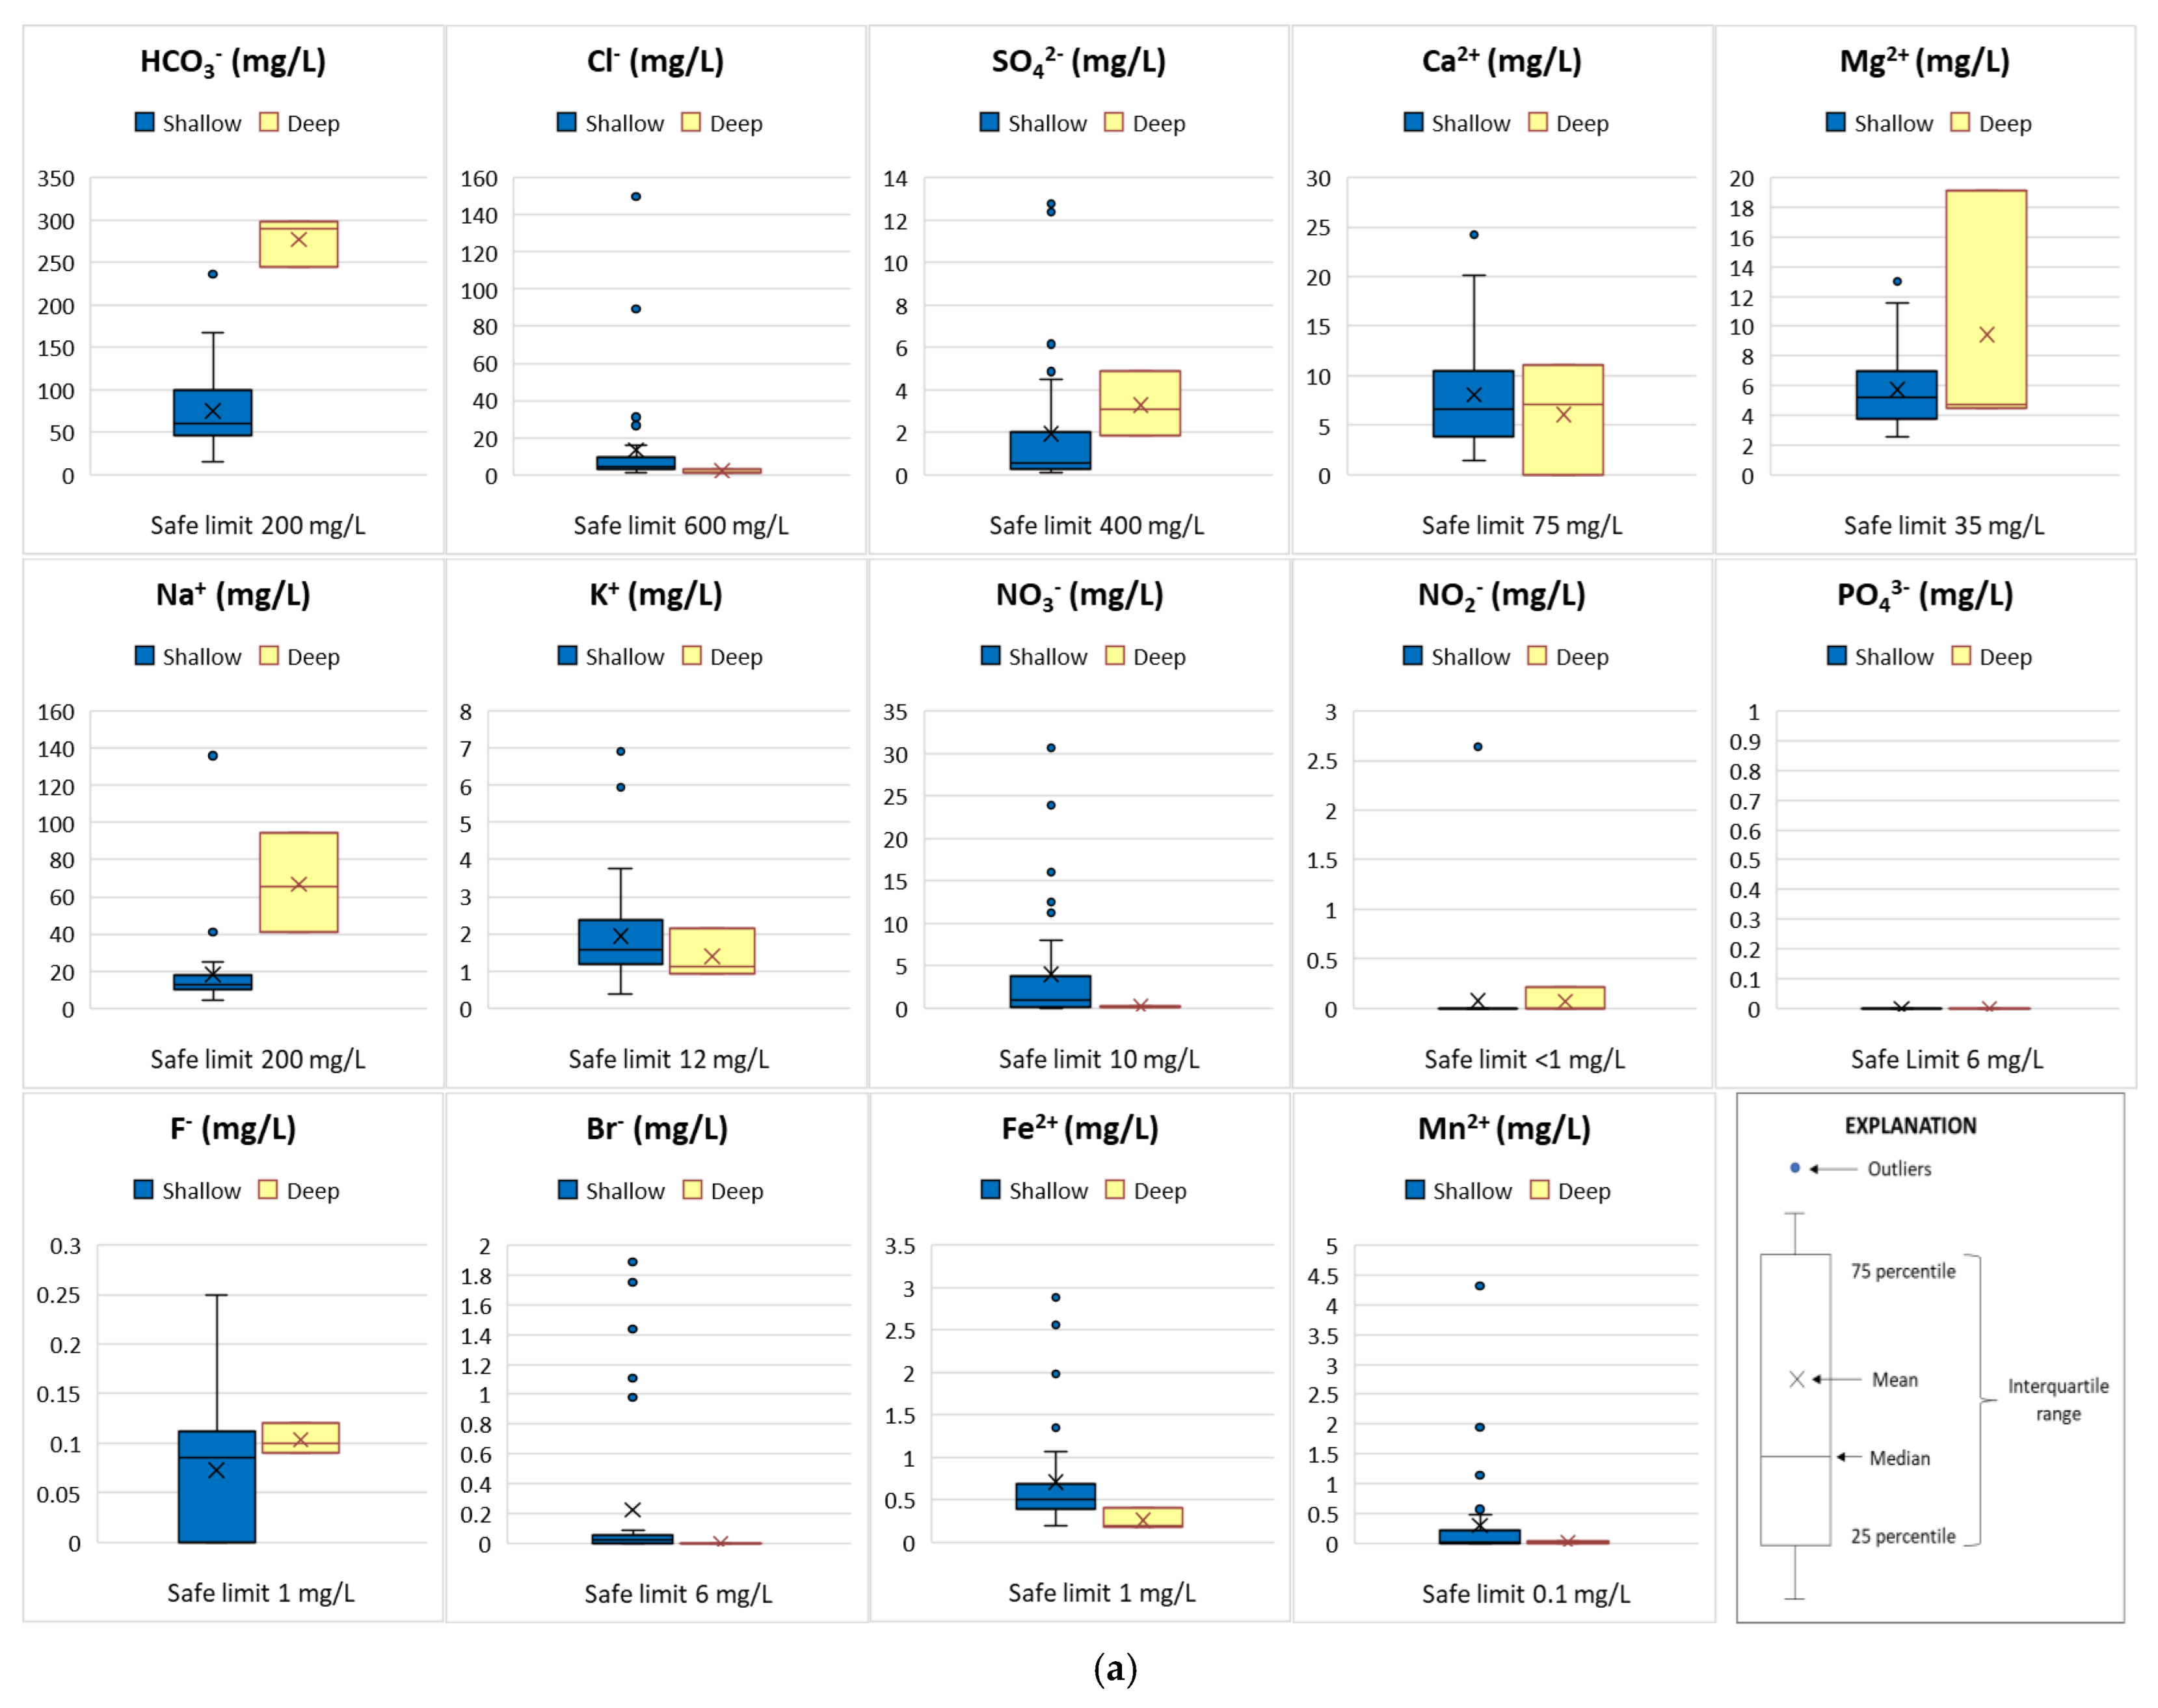
The box plots depict the statistical distributions of the concentration of different water quality constituents in shallow and deep wells, including major and trace ions, such as HCO
3−, Cl
−, SO
42−, Na
+, K
+, Mg
2+, Ca
2+, NO
3−, NO
2−, PO
43−, F
−, Br
−, Fe
2+, and Mn
2+ (
Figure 3a). These plots provide a visual representation of the interquartile range, mean, median, and outliers, i.e., the occurrence of disproportionate concentration values for the constituents [
55]. Water quality standards for each constituent [
16,
52] were also included in the plots to compare their concentrations against safe drinking water limits.
Among the measured samples, the concentrations of Cl
−, SO
42−, Ca
2+, Mg
2+, Na
+, K
+, NO
2−, PO
43−, F
−, and Br
− were found to be within safe limits in both shallow and deep wells (
Figure 3a). The distribution of relatively higher concentrations of Na
+ was noticeable in the deep wells compared to the shallow wells; this was possibly caused by the replacement of Ca
2+ ions through the cation exchange process at a greater depth. For HCO
3− ions, the interquartile range, mean, and median values from shallow wells were within safe limits; however, one outlier from a shallow well and all three values from deep wells exceeded the safe water limit of 200 mg/L (
Figure 3a). Higher concentrations of HCO
3− in deeper wells were probably due to either the presence of deeper aquifer materials [
56] through the weathering of carbonate and silicate minerals or the mixing of freshwater with ancient seawater. Although the interquartile range, mean, and median values for NO
3− concentrations were below the safe water limit (<10 mg/L) in the shallow wells, five outliers showed higher values (>10 mg/L) that could have been released into the groundwater by fertilizer application in the agricultural fields [
57]. Fe
2+ and Mn
2+ both had some outliers exceeding the safe water limit, with values of 1 mg/L and 0.1 mg/L, respectively, in the shallow wells (
Figure 3a). Such results are usually natural, due to the geochemical conditions of the aquifer, e.g., the acidic (low pH) and low-dissolved-oxygen conditions [
58].
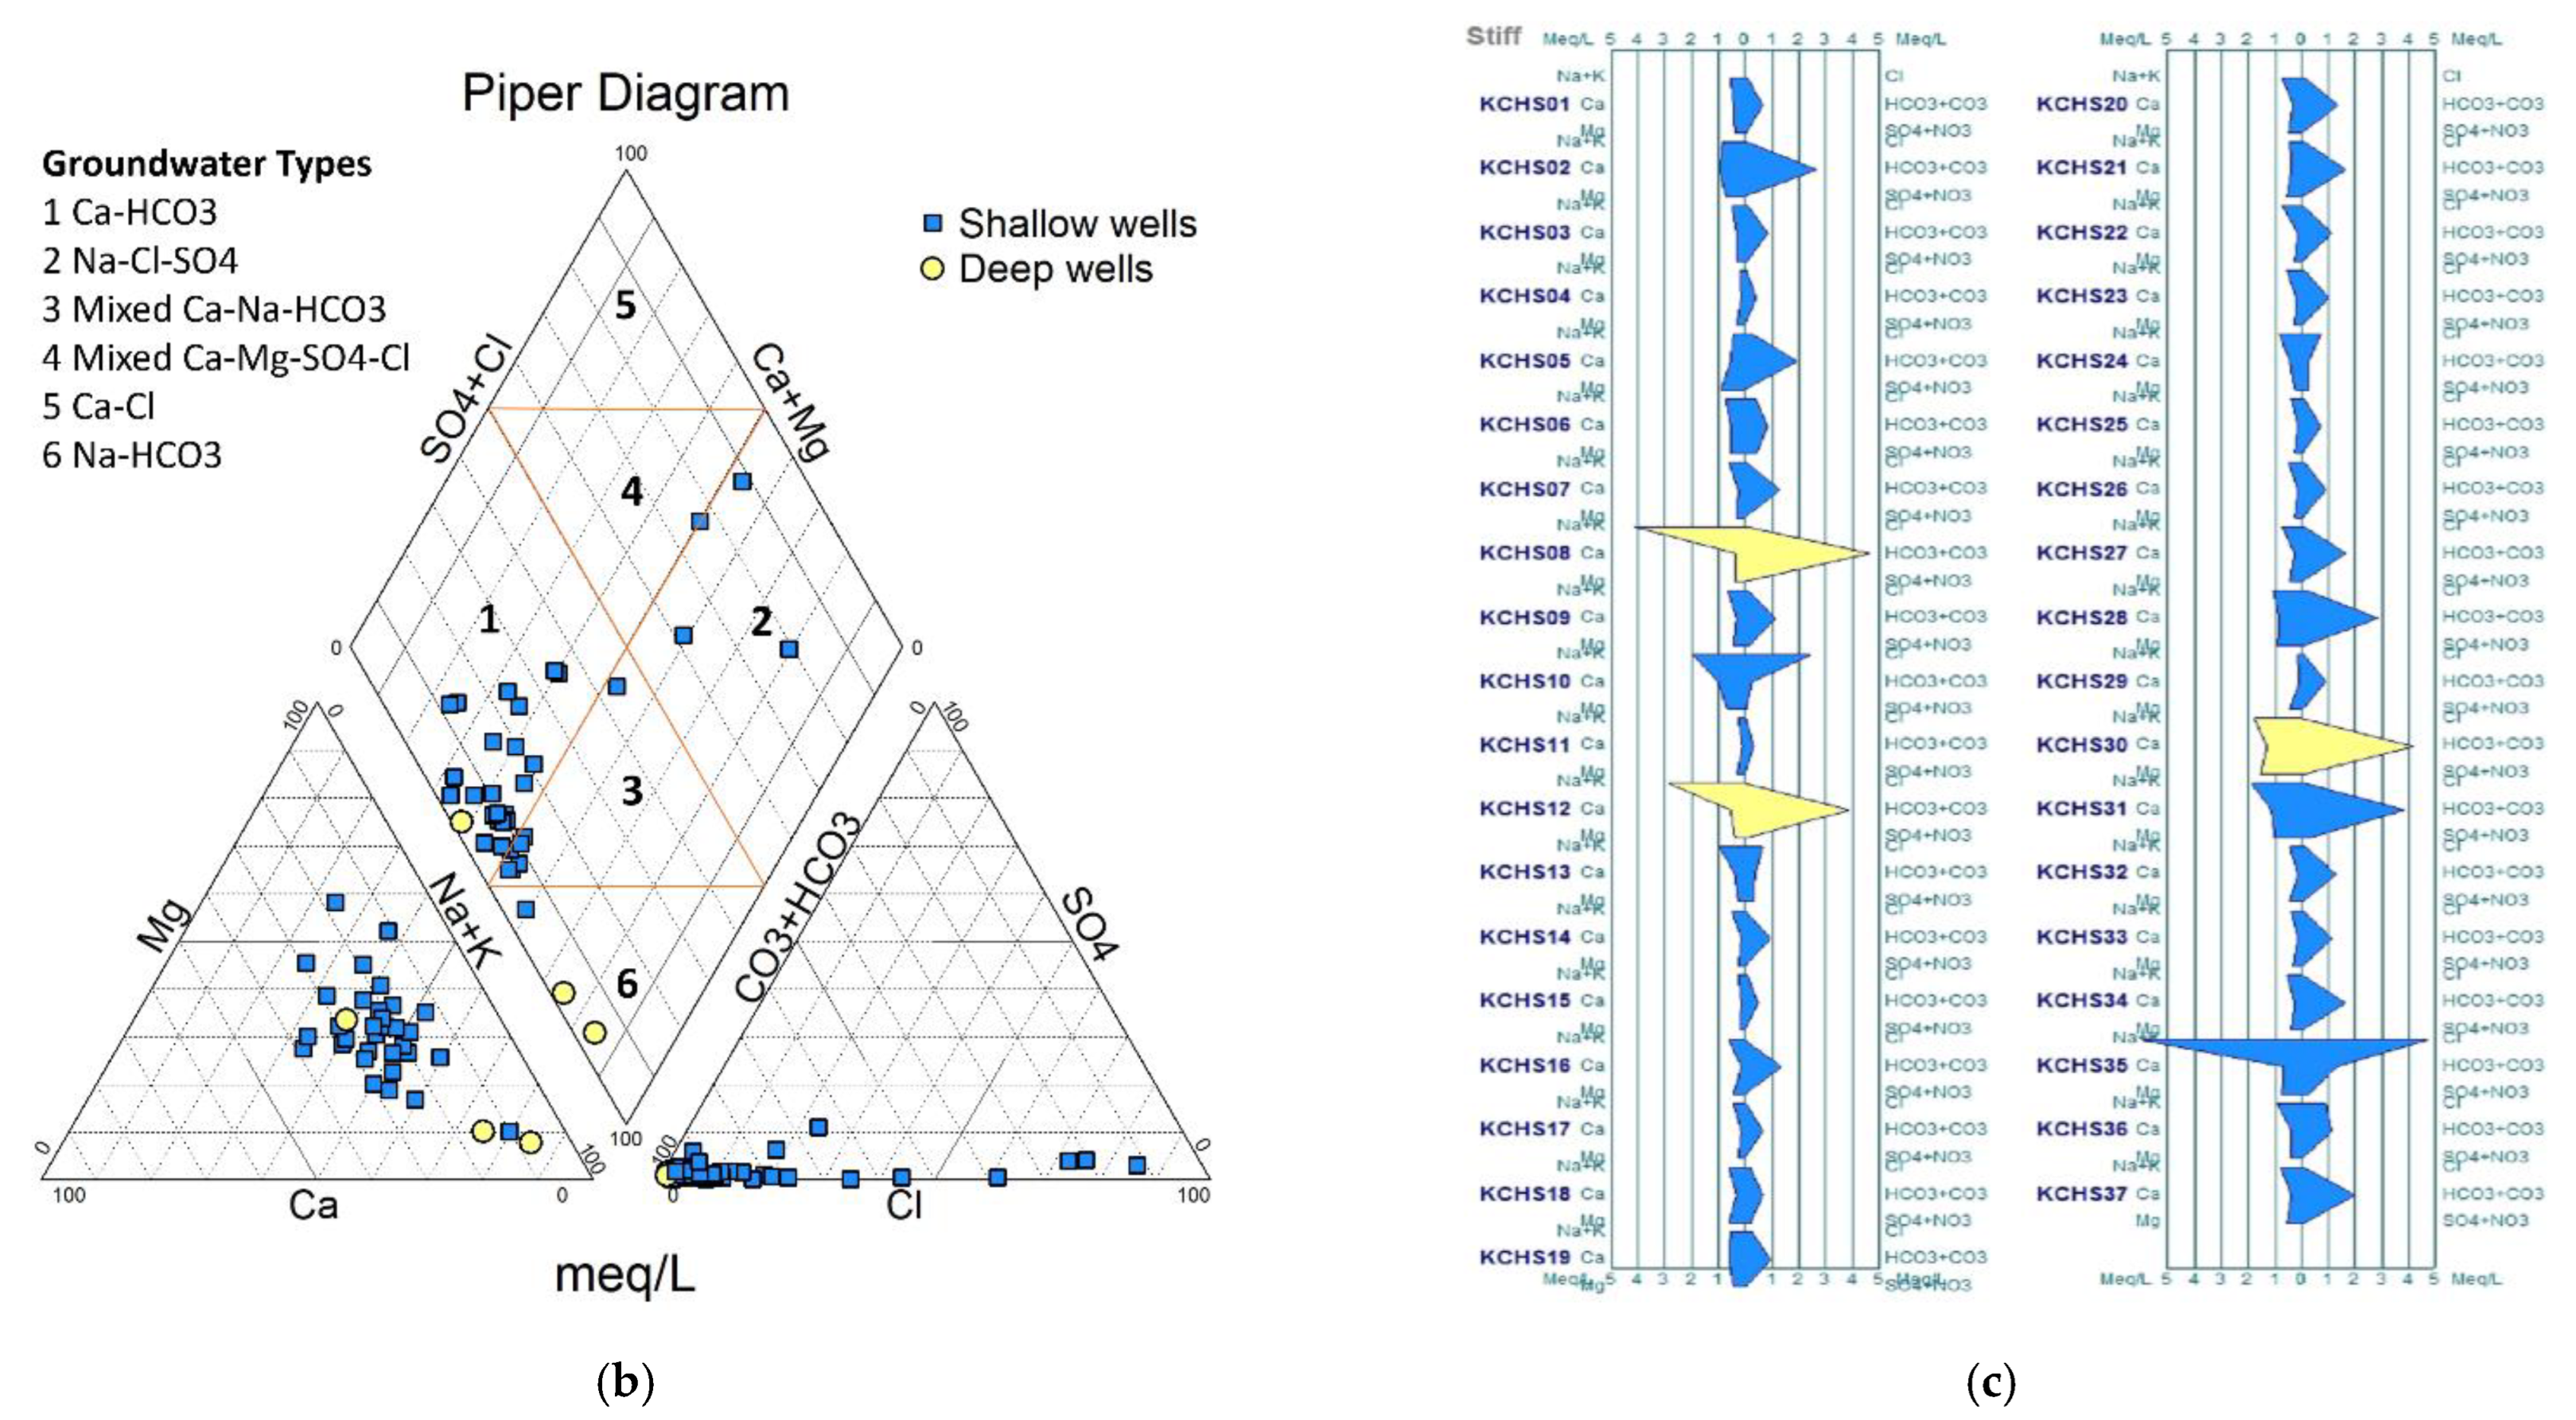
3.3. Hydrochemical Facies and Groundwater Types
In
Figure 3b, the plots of major ions from 37 wells show that water samples were dominated by the Ca–HCO
3 and mixed Ca–Na–HCO
3 types of groundwater, which are labeled as 1 and 3, respectively, in the diamond of the Piper plot [
59]. Samples from two deep wells and four shallow wells contained Na–HCO
3 and NaCl–SO
4 types of water, respectively (
Figure 3b).
Ca–HCO
3 water at a shallow depth is usually the result of the dissolution of aquifer materials through the action of CO
2 derived from the air and soil in the presence of organic matter [
56]. If shallower water is of the Ca–HCO
3 type, and clay minerals are present in the deeper formation with no organic matter, Na
+ ions adsorbed to the clay surfaces are successively replaced by Ca
2+ ions, and the groundwater alters to the Na–HCO
3 type at depths of not less than 30 m and sometimes more than 50 m [
56]. HCO
3− ions may also be released from carbonate minerals and the weathering of silicate minerals [
60]. In addition, there is another hypothesis to explain the presence of Na–HCO
3 water in the deeper aquifers due to marine transgression in the Bengal Basin during the Holocene epoch [
61,
62]. When fresh groundwater invades a deeper aquifer that previously contained seawater (NaCl) or an Na-rich brine derived from seawater, Na–HCO
3 type water can be naturally formed from the mixing of freshwater with saline water [
15,
63]. A study conducted on groundwater quality in different locations in Bangladesh included hydrochemical data for one deep tube well located in the Khagrachhari District [
11]. This study also showed that the groundwater collected from the deep well was of Na–HCO
3 type. In contrast, the NaCl-type water found in one of the shallow wells was likely due to the agricultural practices in the study area [
15,
64].
In
Figure 3c, most of the water samples display approximately the same polygonal shapes, with relatively low to moderate concentrations of cations (Na
+, K
+, Mg
2+, and Ca
2+) and anions (Cl
−, HCO
3−, CO
32−, and SO
42−) in meq/L. Stiff diagrams usually help in making a rapid visual comparison between groundwater samples with high ion concentrations [
65]. Water samples from all three deep wells, i.e., KCHS-08, 12, and 30, and from two shallow wells, i.e., KCHS-31 and 35, showed variations in major ion concentrations (
Figure 3c). Among them, the three deep wells had relatively high Na + K and HCO
3 + CO
3 concentrations that might have been released into the groundwater from the deeper aquifer materials. One of the shallow wells (KCHS-35) demonstrated remarkably high levels of Na + K and Cl, which may indicate surface contamination caused by agricultural activities.
3.4. Groundwater Quality Assessment for Irrigation
The results of the irrigation water quality assessment methods are discussed in the subsequent sections.
3.4.1. Sodium Adsorption Ratio (SAR)
The calculated SAR values for the water samples ranged from 0.350 to 6.737 (
Table A2 in
Appendix A). Therefore, all the groundwater samples collected from the Khagrachhari Sadar region were excellent for irrigation purposes (100%) (
Table 3), with low SAR values that result in a positive effect on soil permeability and crop yields [
40].
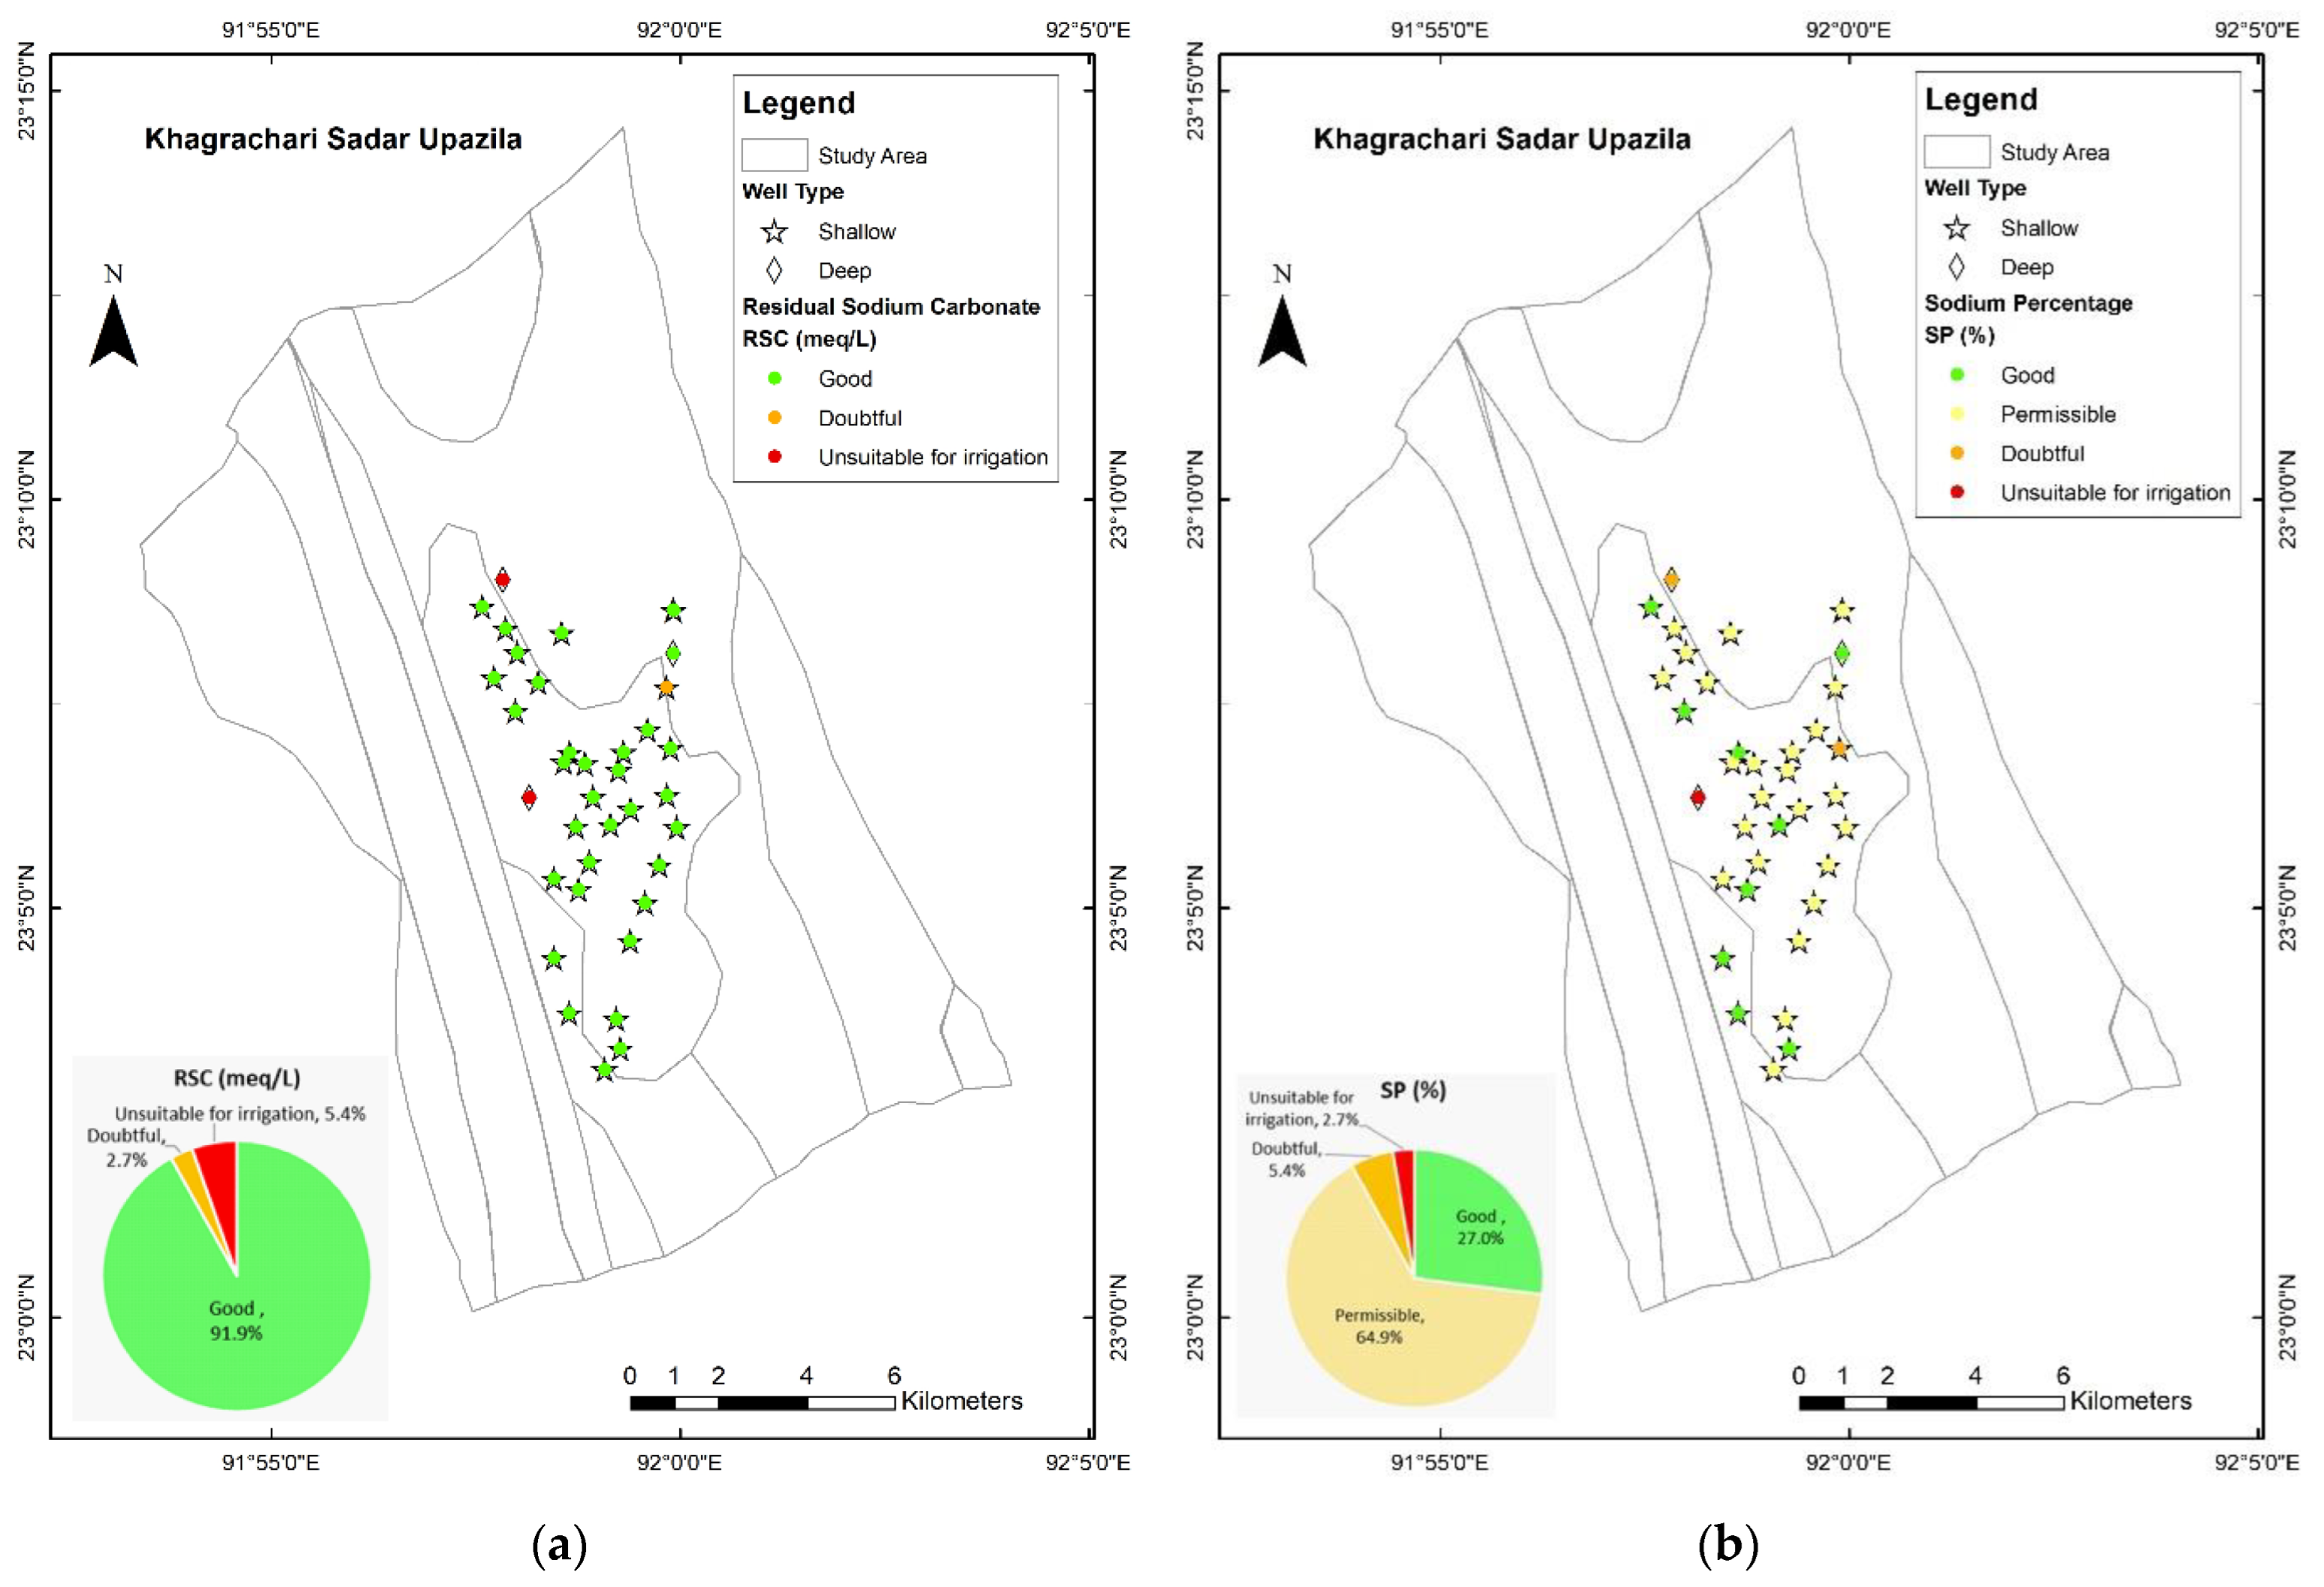
3.4.2. Residual Sodium Carbonate (RSC)
According to the RSC values calculated for the collected samples (
Table A2 in
Appendix A), 91.9% of the water samples were safe and good for irrigation, 2.7% were doubtful (one shallow well), and 5.4% (two deep wells) were unsuitable for irrigation purpose (
Table 3;
Figure 4a).
3.4.3. Sodium Percentage (SP)
Based on the calculated SP values (
Table A2 in
Appendix A), 27% of the groundwater samples from Khagrachhari Sadar were good for irrigation, around 64.9% were within the permissible range, 5.4% of wells (one shallow well and one deep well) were in doubtful condition, and 2.7% (one deep well) was unsafe and unsuitable for irrigation (
Table 3;
Figure 4b).
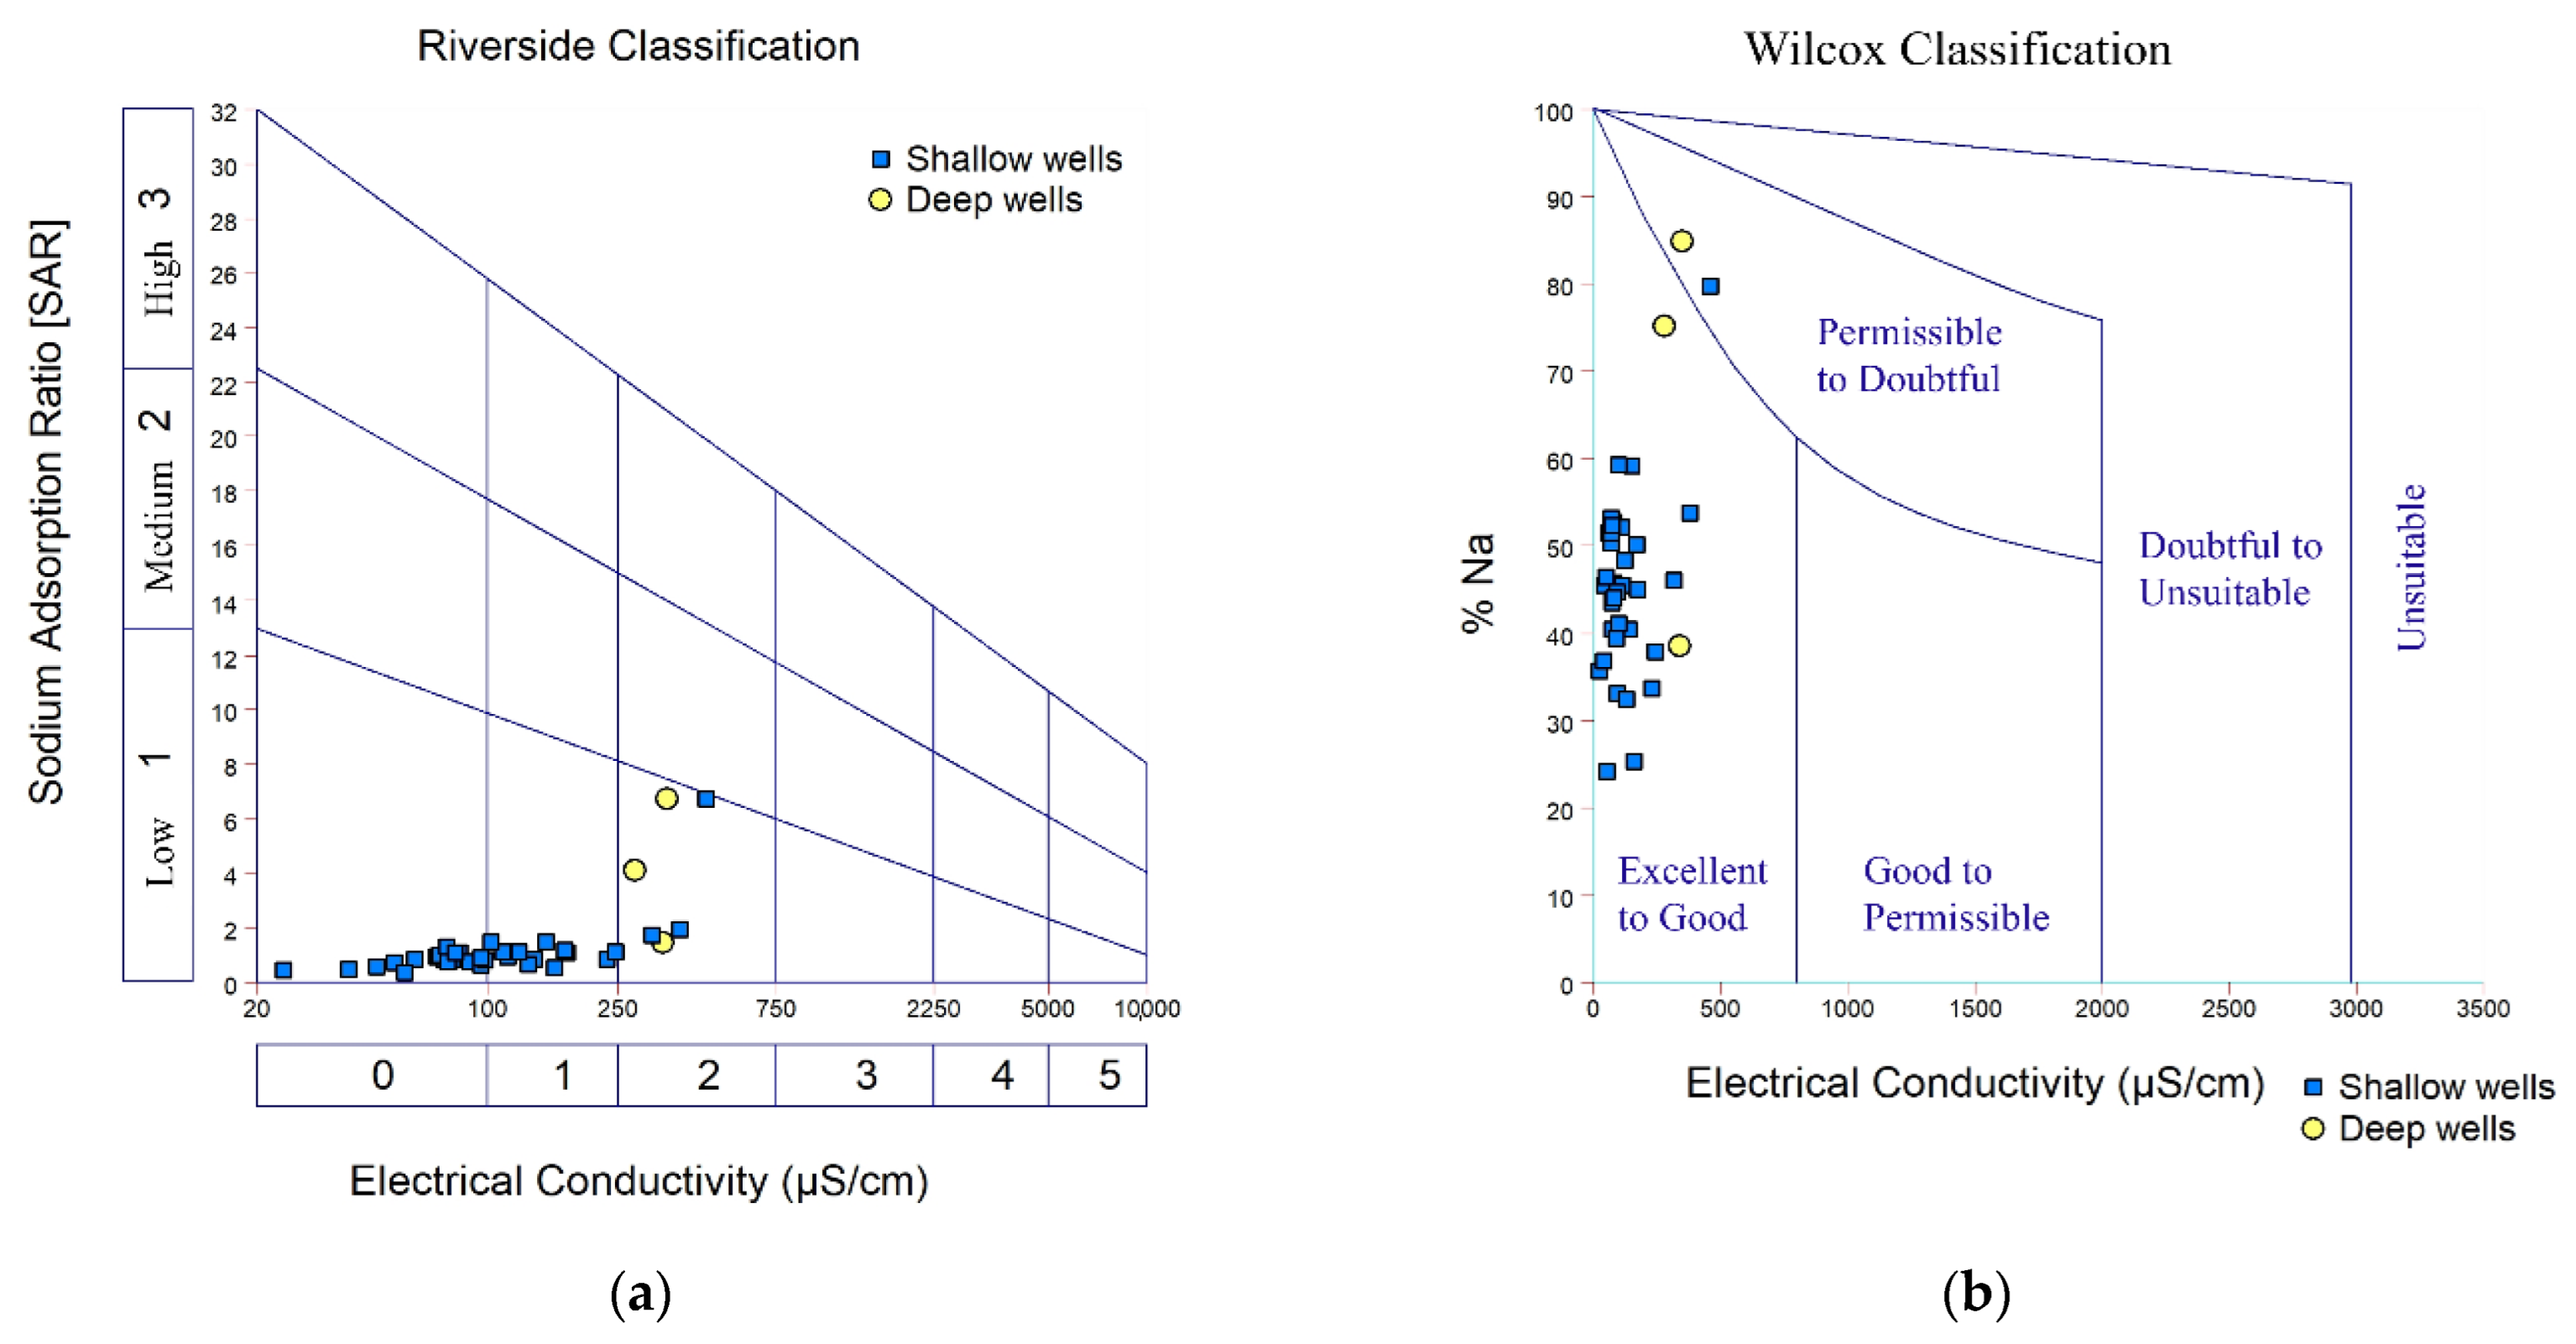
3.4.4. Riverside Classification
In
Figure 5a, all groundwater samples are located within the low SAR and low to medium EC areas in the Riverside graph, which is recommended for irrigation on almost all soils with little danger of sodium hazard [
18].
3.4.5. Wilcox Classification
In the Wilcox diagram (
Figure 5b), most of the water samples fall in the ‘Excellent to Good’ quality range with respect to salinity (EC) and sodium percentage (%Na). One shallow well and one deep well were within the ‘Permissible to Doubtful’ range. In addition, one deep well sample was located close to the border between the ‘Excellent to Good’ and ‘Permissible to Doubtful’ ranges. Incessant irrigation with these three water wells may lead to the accumulation of more Na
+, which may have negative effects on the soil and the sustainability of crop production in the long term [
44].
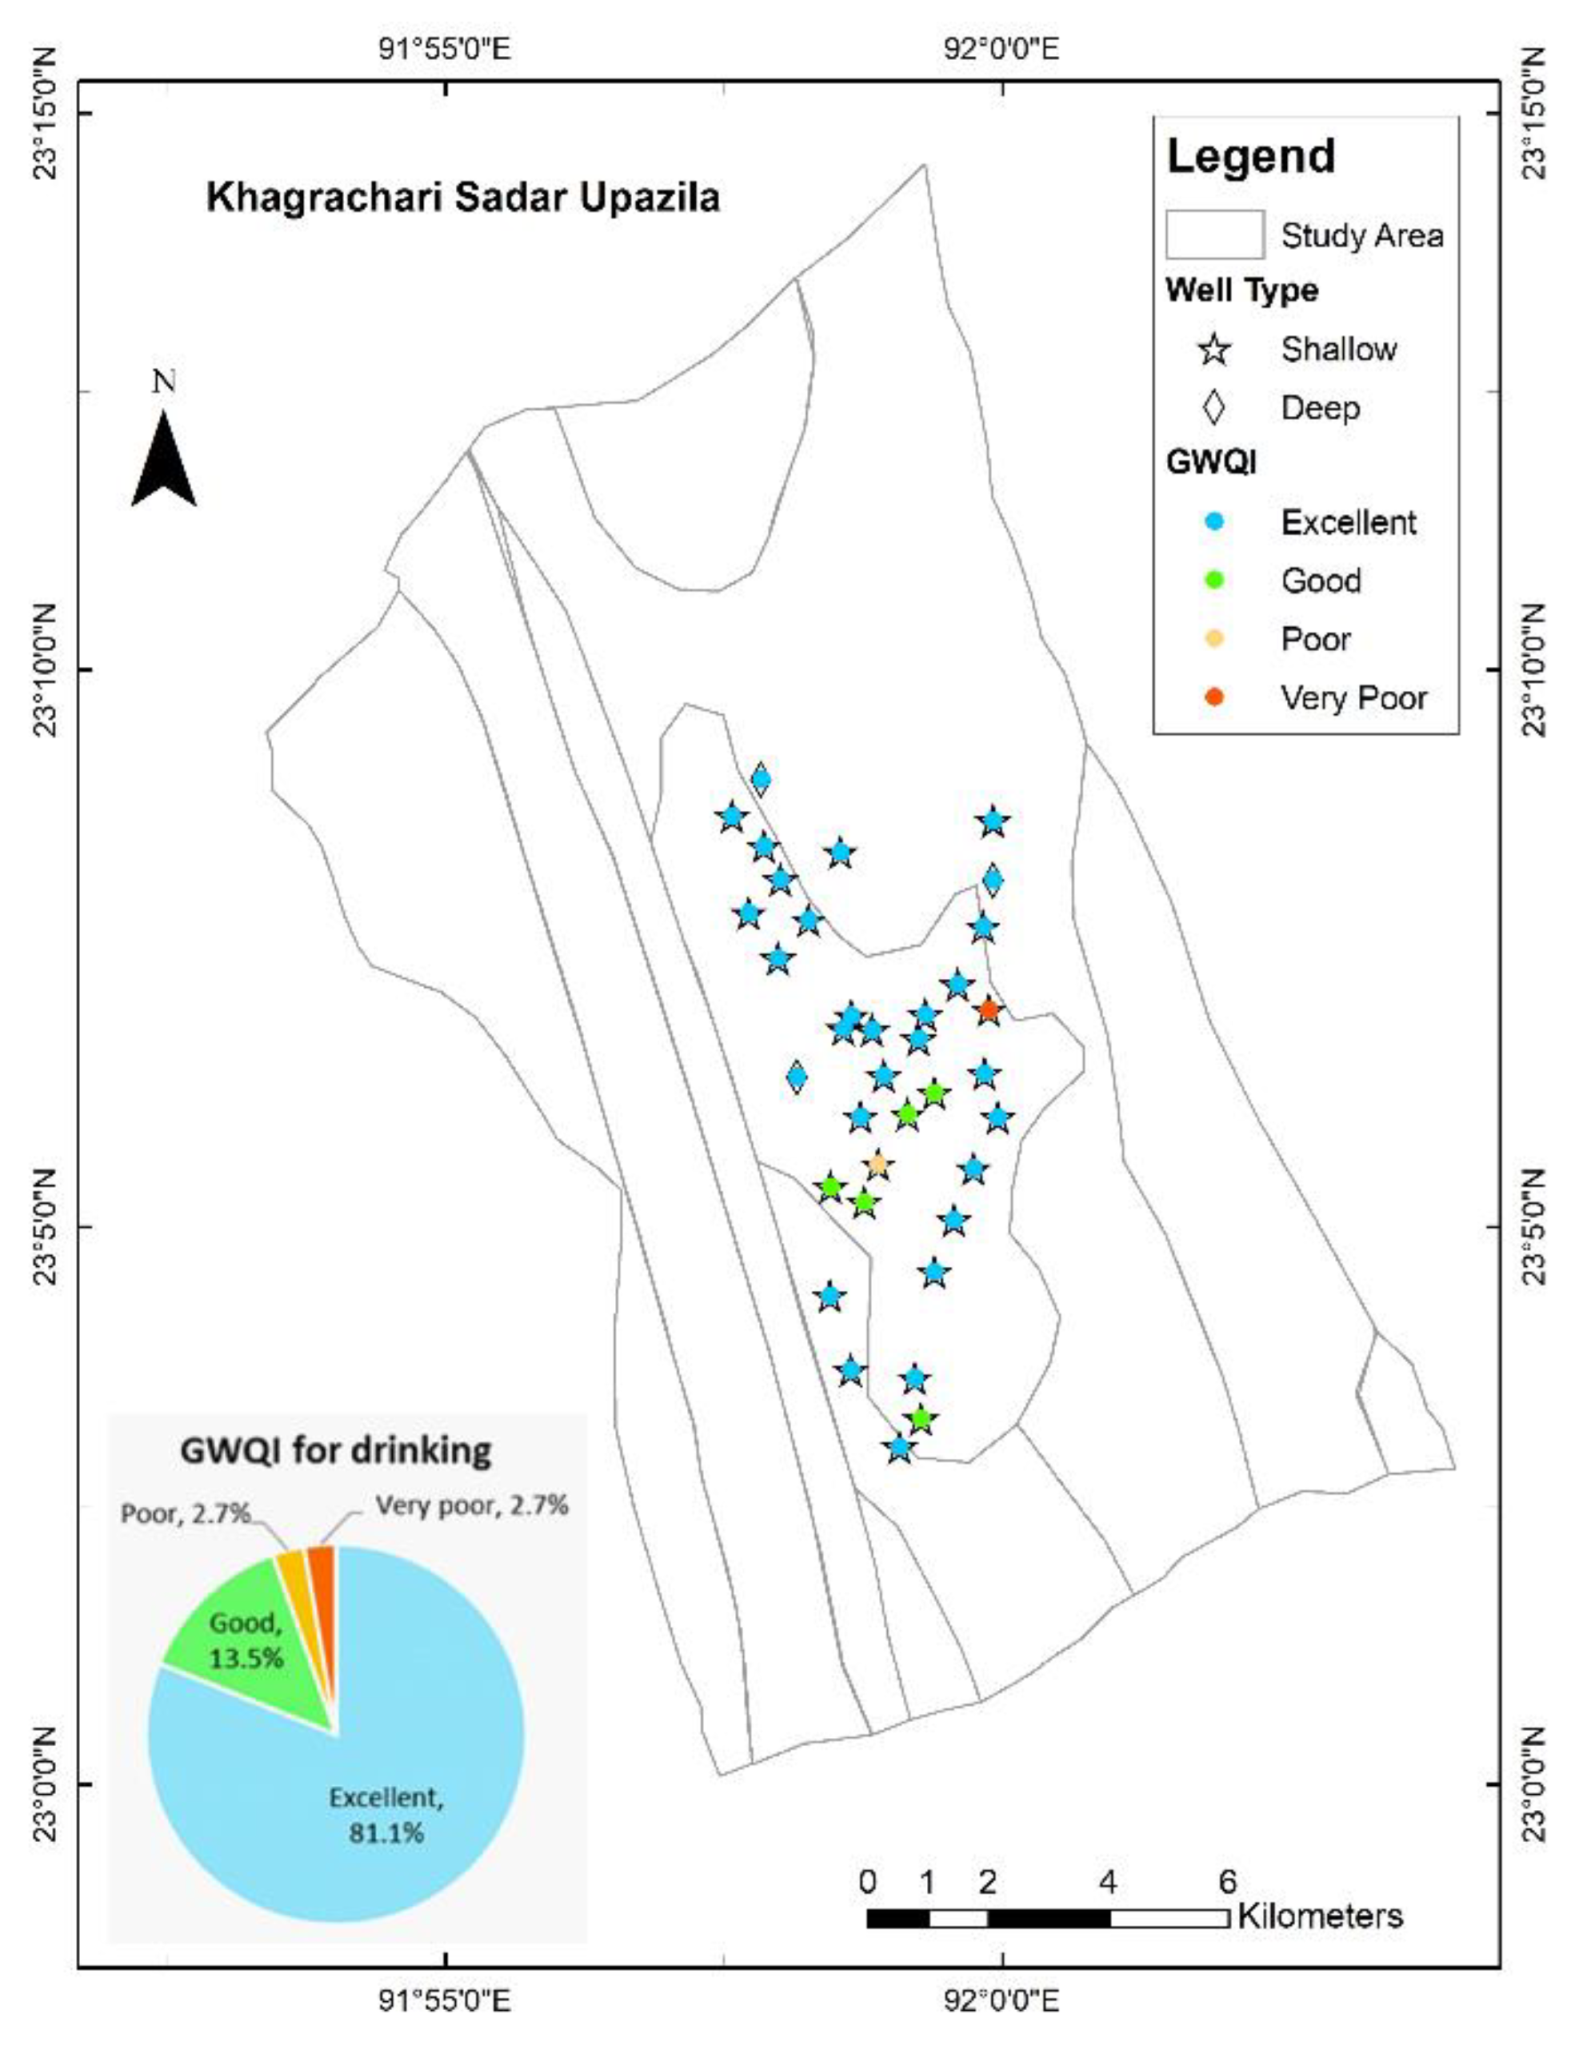
3.5. Groundwater Quality Index (GWQI) for Drinking
The calculated GWQI values for each groundwater sample are listed in
Table A3 in
Appendix A. According to the classification shown in
Table 4 and
Figure 6, 86.5% of the collected groundwater samples for the study region were excellent for drinking, 8.1% of the samples fell into the good quality groundwater category, and there were 2.7% of samples in both the poor and very poor water quality categories. The spatial map shows that the poor- and very-poor-quality water samples were both collected from shallow wells (
Figure 6), while the water from the three deep wells was excellent for drinking purposes.
The groundwater quality index (GWQI) for drinking purposes adopted in this paper is not an absolute indicator of safe water. Rather, it is a factor that a person may choose to consider in evaluating drinking water quality based on the chemical parameters of the water. Excellent or good quality groundwater may still not be safe to drink due to several factors that were not considered in the evaluation of GWQI, e.g., bacteriological effects, contamination due to poor infrastructure or poor maintenance of the tube wells, and other unexpected occurrences that may occur from time to time.
4. Conclusions
For water quality management in a particular area, it is primarily essential to understand the groundwater composition and characterize the hydrochemical facies. In this study, water samples were collected from 34 shallow wells and 3 deep wells in the Khagrachhari Sadar area, measured at the field site, and analyzed in the lab. Samples were also evaluated for drinking and irrigation water quality using different water quality assessment methods. Spatial distribution maps were produced to obtain a better understanding of the distribution of shallow and deep wells in the study area, along with their physicochemical parameters and water quality assessment results.
In this investigation, the groundwater EC values were observed to be within the excellent to good range. Water wells were dominated by low-pH acidic water (86.5%). Positive redox potential (Eh) values were found in all wells, ranging from 23 to 323 millivolts. Most of the wells contained soft water (81.1%) in terms of total hardness. Shallow wells in the study area were dominated by the Ca–HCO3 and mixed Ca–Na–HCO3 types of groundwater, while two out of three deep wells contained Na–HCO3-type water. In addition, box plots were used to display the statistical distribution of the major and trace ions present in the water samples, and the concentrations of Cl−, SO42−, Ca2+, Mg2+, Na+, K+, NO2−, PO43−, F−, and Br− were observed to be below the safe drinking water limit. Higher concentrations of HCO3-, exceeding the safe water limit (>200 mg/L), were found in deep wells; this result may be derived from either the weathering of carbonate and silicate minerals or the mixing of freshwater with ancient seawater. Na+ also showed relatively higher concentrations in the deep well water samples, but values were within safe water limits. Some of the shallow wells contained high levels of NO3−, Fe2+, and Mn2+ that were above the safe water limits, i.e., 10 mg/L, 1 mg/L, and 0.1 mg/L, respectively. Excess NO3- was possibly released from agricultural activities in the study region, and the slightly high values observed for Fe2+ and Mn2+ may be naturally present in shallow aquifers in favorable geochemical environments.
According to the SAR measurements, 100% of the water wells were in excellent condition for irrigation. The Riverside classification also showed that all the water samples were within the low SAR and low to medium EC range. A total of 91.9% of the water samples were found to be good in quality; groundwater results from one shallow well and two deep wells were doubtful and unsuitable for irrigation, respectively, based on the RSC method. The calculations associated with the SP method showed that one shallow well and two deep wells were not safe for irrigation since they fell into the doubtful and unsuitable categories. This result was also supported by the Wilcox classification, where SP (%Na) was measured against the EC of the water samples. According to the GWQI results, groundwater from 81.1% of the wells, including the three deep wells in the Khagrachhari Sadar, was of excellent quality for drinking purposes. Two shallow wells were found to contain only poor- or very-poor-quality groundwater for human consumption. The results can be summarized as follows: the groundwater of deep wells in the study area was less suitable, and more caution is needed before using it as irrigation water. However, deep groundwater was not found to be harmful for drinking purposes. In contrast, although some water samples from the shallow wells were of doubtful or poor quality, the majority of the shallow wells in the Khagrachhari Sadar area were relatively safe for both drinking and irrigation water uses. However, further investigation, including arsenic and microbiological tests, is recommended to obtain a more acceptable assessment of safe drinking water quality in the study region.
Author Contributions
Conceptualization, N.N., T.R.J. and M.R.K.; data curation, N.N. and T.R.J.; formal analysis, N.N. and T.R.J.; investigation, T.R.J., M.J.A., M.B.M. and K.M.A.; methodology, N.N. and T.R.J.; supervision, M.J.A., M.B.M. and K.M.A.; validation M.R.K.; writing—original draft preparation, N.N.; writing—review and editing, M.R.K. and K.M.A. All authors have read and agreed to the published version of the manuscript.
Funding
This research received no external funding. The APC (article processing charge) was partially funded by the University of Dhaka.
Data Availability Statement
Not applicable.
Acknowledgments
The authors would like to thank the individuals of the fourth-year B.S. (Honors) 2020 fieldwork team from the Department of Geology, University of Dhaka, who collected the data and water samples from the field sites and participated in the lab analyses. We would also like to thank the Department of Public Health Engineering (DPHE) of Bangladesh for providing the borehole logs for Khagrachhari Sadar Pourasava.
Conflicts of Interest
The authors declare no conflict of interest.
Appendix A
Table A1.
Physical parameters of the water samples collected from the shallow and deep wells in the Khagrachhari Sadar with the mean, maximum, minimum, standard deviation value, and water quality standard.
Table A1.
Physical parameters of the water samples collected from the shallow and deep wells in the Khagrachhari Sadar with the mean, maximum, minimum, standard deviation value, and water quality standard.
| Parameter | Unit | Mean | Maximum | Minimum | Std Deviation | Water Quality Standard |
|---|
| Temperature | °C | 27.08 | 29.3 | 24 | 1.23 | 25 |
| EC | µS/cm | 143.46 | 460 | 24 | 107.82 | 1500 |
| pH | - | 5.98 | 8.55 | 4.08 | 0.853 | 6.5–8.5 |
| Eh | millivolt | 182.16 | 323 | 23 | 69.78 | - |
| TH | mg/L as CaCO3 | 46.36 | 144.4 | 15.89 | 27.85 | 200 |
Figure A1.
Spatial distribution of (a) pH and (b) TH in shallow and deep wells of the Khagrachhari Sadar.
Figure A1.
Spatial distribution of (a) pH and (b) TH in shallow and deep wells of the Khagrachhari Sadar.
Table A2.
Calculated values of SAR, RSC, and SP along with the water classifications based on these three methods for irrigation water quality assessment in the study area.
Table A2.
Calculated values of SAR, RSC, and SP along with the water classifications based on these three methods for irrigation water quality assessment in the study area.
| SAMPLE ID | SAR | Comment-SAR | RSC (meq/L) | Comment-RSC | SP (%) | Comment-SP |
|---|
| KCHS01 | 0.831 | Excellent | −0.09 | Good | 40.45 | Permissible |
| KCHS02 | 0.882 | Excellent | 1.08 | Good | 33.69 | Good |
| KCHS03 | 0.832 | Excellent | 0.29 | Good | 45.77 | Permissible |
| KCHS04 | 0.466 | Excellent | 0.09 | Good | 35.74 | Good |
| KCHS05 | 0.535 | Excellent | 0.60 | Good | 25.30 | Good |
| KCHS06 | 0.878 | Excellent | −0.24 | Good | 40.42 | Permissible |
| KCHS07 | 1.086 | Excellent | 0.81 | Good | 52.65 | Permissible |
| KCHS08 | 6.737 | Excellent | 3.99 | Unsuitable for irrigation | 84.84 | Unsuitable for irrigation |
| KCHS09 | 0.981 | Excellent | 0.42 | Good | 45.49 | Permissible |
| KCHS10 | 1.944 | Excellent | −1.35 | Good | 53.65 | Permissible |
| KCHS11 | 0.512 | Excellent | −0.04 | Good | 36.88 | Good |
| KCHS12 | 4.129 | Excellent | 3.03 | Unsuitable for irrigation | 75.13 | Doubtful |
| KCHS13 | 1.502 | Excellent | −0.18 | Good | 59.19 | Permissible |
| KCHS14 | 0.980 | Excellent | 0.57 | Good | 53.07 | Permissible |
| KCHS15 | 0.597 | Excellent | 0.20 | Good | 45.47 | Permissible |
| KCHS16 | 1.125 | Excellent | 0.82 | Good | 52.09 | Permissible |
| KCHS17 | 0.877 | Excellent | 0.35 | Good | 51.48 | Permissible |
| KCHS18 | 0.789 | Excellent | −0.17 | Good | 39.46 | Good |
| KCHS19 | 0.653 | Excellent | −0.06 | Good | 33.19 | Good |
| KCHS20 | 1.078 | Excellent | 0.43 | Good | 45.03 | Permissible |
| KCHS21 | 0.675 | Excellent | 0.55 | Good | 32.431 | Good |
| KCHS22 | 1.492 | Excellent | 0.57 | Good | 59.33 | Permissible |
| KCHS23 | 1.017 | Excellent | 0.43 | Good | 50.27 | Permissible |
| KCHS24 | 1.174 | Excellent | −0.61 | Good | 50.16 | Permissible |
| KCHS25 | 0.752 | Excellent | 0.26 | Good | 46.47 | Permissible |
| KCHS26 | 1.002 | Excellent | 0.34 | Good | 51.39 | Permissible |
| KCHS27 | 1.142 | Excellent | 0.78 | Good | 48.24 | Permissible |
| KCHS28 | 1.122 | Excellent | 1.00 | Good | 37.90 | Good |
| KCHS29 | 0.350 | Excellent | 0.20 | Good | 24.12 | Good |
| KCHS30 | 1.468 | Excellent | 1.24 | Good | 38.55 | Good |
| KCHS31 | 1.756 | Excellent | 1.57 | Doubtful | 45.94 | Permissible |
| KCHS32 | 0.828 | Excellent | 0.57 | Good | 41.11 | Permissible |
| KCHS33 | 0.770 | Excellent | 0.54 | Good | 43.46 | Permissible |
| KCHS34 | 0.932 | Excellent | 0.88 | Good | 44.78 | Permissible |
| KCHS35 | 6.731 | Excellent | −0.24 | Good | 79.74 | Doubtful |
| KCHS36 | 1.329 | Excellent | 0.26 | Good | 52.28 | Permissible |
| KCHS37 | 1.088 | Excellent | 0.93 | Good | 44.00 | Permissible |
Table A3.
Calculated GWQI scores and types of groundwater for drinking water quality assessment in the study area.
Table A3.
Calculated GWQI scores and types of groundwater for drinking water quality assessment in the study area.
| SAMPLE ID | GWQI Score | Type of Groundwater | SAMPLE ID | GWQI Score | Type of Groundwater |
|---|
| KCHS01 | 20.45 | Excellent | KCHS20 | 17.27 | Excellent |
| KCHS02 | 67.01 | Good | KCHS21 | 137.14 | Poor |
| KCHS03 | 20.81 | Excellent | KCHS22 | 57.03 | Good |
| KCHS04 | 11.16 | Excellent | KCHS23 | 12.22 | Excellent |
| KCHS05 | 21.93 | Excellent | KCHS24 | 12.54 | Excellent |
| KCHS06 | 51.02 | Good | KCHS25 | 28.45 | Excellent |
| KCHS07 | 12.55 | Excellent | KCHS26 | 11.78 | Excellent |
| KCHS08 | 21.03 | Excellent | KCHS27 | 12.25 | Excellent |
| KCHS09 | 27.54 | Excellent | KCHS28 | 51.27 | Good |
| KCHS10 | 22.07 | Excellent | KCHS29 | 92.11 | Good |
| KCHS11 | 13.46 | Excellent | KCHS30 | 25.80 | Excellent |
| KCHS12 | 16.59 | Excellent | KCHS31 | 26.00 | Excellent |
| KCHS13 | 41.89 | Excellent | KCHS32 | 35.41 | Excellent |
| KCHS14 | 15.43 | Excellent | KCHS33 | 18.14 | Excellent |
| KCHS15 | 13.83 | Excellent | KCHS34 | 13.81 | Excellent |
| KCHS16 | 15.37 | Excellent | KCHS35 | 31.85 | Excellent |
| KCHS17 | 16.39 | Excellent | KCHS36 | 288.45 | Very Poor |
| KCHS18 | 33.20 | Excellent | KCHS37 | 17.23 | Excellent |
| KCHS19 | 20.45 | Excellent | | | |
References
- Foster, S.; Chilton, J.; Nijsten, G.J.; Richts, A. Groundwater—A global focus on the ‘local resource’. Curr. Opin. Environ. Sustain. 2013, 5, 685–695. [Google Scholar] [CrossRef]
- Shamsudduha, M. Impacts of human development and climate change on groundwater resources in Bangladesh. In Groundwater of South Asia; Mukherjee, A., Ed.; Springer Hydrogeology: Singapore, 2018; pp. 523–544. [Google Scholar] [CrossRef]
- Bangladesh Bureau of Statistics (BBS). Bangladesh Population and Housing Census 2011, Community Report on Khagrachhari Zila; Bangladesh Bureau of Statistics, Statistics and Informatics Division, Ministry of Planning, Government of the People’s Republic of Bangladesh: Dhaka, Bangladesh, 2011; 709p.
- Chakma, U.B.; Hossain, A.; Islam, K.; Hasnat, G.T.; Kabir, M.H. Water crisis and adaptation strategies by tribal community: A case study in Baghaichari Upazila of Rangamati District in Bangladesh. Int. J. Disaster Risk Manag. 2020, 2, 37–46. [Google Scholar] [CrossRef]
- Chakma, S.; Hossain, M.N.; Islam, M.K.; Hossain, M.M.; Sarker, M.N.I. Water Scarcity, Seasonal Variation and Social Conflict in Mountain Regions of Bangladesh. Grassroots J. Nat. Resour. 2021, 4, 62–79. [Google Scholar] [CrossRef]
- Karim, F.; Rafi, M. Drinking Water in the Hilly Region of Bangladesh: How Is the Quality? Int. J. Water Resour. Dev. 2002, 18, 439–452. [Google Scholar] [CrossRef]
- Islam, M.J.; Uddin, S.M.H.; Huda, S.; Rahman, M.S.; Hossain, M.F.; Laiju, N. Quality assessment of well and pond water for irrigation in different remote aquifers of Khagrachari in Bangladesh. Pak. J. Biol. Sci. 2003, 6, 1720–1724. [Google Scholar] [CrossRef]
- Islam, M.J.; Uddin, S.M.H.; Zaman, M.W.; Mahmood, R.I.; Rahman, M.S. Toxicity assessment of ground water in different aquifers of Khagrachari in Bangladesh. Asian J. Plant Sci. 2003, 2, 257–260. [Google Scholar] [CrossRef]
- Ahmed, M.J.; Ahsan, A.; Haque, M.R.; Siraj, S.; Bhuiyan, M.H.R.; Bhattacharjee, S.C.; Islam, S. Physicochemical Assessment of Surface and Groundwater Quality of the Greater Chittagong Region of Bangladesh. Pak. J. Anal. Environ. Chem. 2010, 11, 11. [Google Scholar]
- Karmakar, S.; Haque, S.M.S.; Hossain, M.M.; Shafiq, M. Water quality of Kaptai reservoir in Chittagong Hill Tracts of Bangladesh. J. For. Res. 2011, 22, 87–92. [Google Scholar] [CrossRef]
- Ali, M.H. Groundwater quality of different locations of Bangladesh. Sustain. Agri Food Environ. Res. 2017, 5, 1–21. [Google Scholar] [CrossRef]
- Latifa, G.A.; Majumder, A.K.; Kabir, M.H.; Chakma, A. Water quality and fish diversity of Chengi River of Khagrachari District. Bangladesh J. Zool. 2019, 47, 343–353. [Google Scholar] [CrossRef] [Green Version]
- Islam, M.S.; Azadi, M.A.; Nasiruddin, M.; Islam, M.S. Water Quality Index of Halda River, Southeastern Bangladesh. Am. J. Environ. Eng. 2020, 10, 59–68. [Google Scholar] [CrossRef]
- Khan, F.H. Geology of Bangladesh; Wiley Eastern: Hoboken, NJ, USA, 1991; 207p. [Google Scholar]
- Hem, J.D. Study and Interpretation of the Chemical Characteristics of Natural Water, 3rd ed.; U.S. Geological Survey Water Supply Paper 2254; US Government Printing Office: Washington, DC, USA, 1985; 272p.
- World Health Organization (WHO). Guidelines for Drinking-Water Quality, 4th ed.; Incorporating the First Addendum; World Health Organization: Geneva, Switzerland, 2017; 541p. [Google Scholar]
- Eaton, E.M. Significance of carbonate in irrigation water. Soil. Sci. 1950, 69, 123–133. [Google Scholar] [CrossRef]
- Richards, L.A. Diagnosis on improvement of saline and alkali soils. In Agriculture Handbook No. 60; US Department of Agriculture: Washington, DC, USA, 1954; p. 160. [Google Scholar]
- Wilcox, L. Classification and Use of Irrigation Waters; Circular 969; US Department of Agriculture: Washington, DC, USA, 1955; 19p.
- Todd, D.K. Groundwater Hydrology, 1st ed.; John Wiley and Sons, Inc.: New York, NY, USA, 1959; 336p. [Google Scholar]
- Todd, D.K. Groundwater Hydrology, 2nd ed.; John Wiley and Sons, Inc.: New York, NY, USA, 1980. [Google Scholar]
- World Health Organization (WHO). Hardness in Drinking-Water; Background Document for Preparation of WHO Guidelines for Drinking-Water Quality; World Health Organization: Geneva, Switzerland, 2010; 11p. [Google Scholar]
- Adimalla, N. Groundwater quality for drinking and irrigation purposes and potential health risks assessment: A case study from semi-arid region of south India. Expos. Health 2019, 11, 109–123. [Google Scholar] [CrossRef]
- Adimalla, N.; Taloor, A.K. Hydrogeochemical investigation of groundwater quality in the hard rock terrain of South India using Geographic Information System (GIS) and groundwater quality index (GWQI) techniques. Groundw. Sustain. Dev. 2020, 10, 100–288. [Google Scholar] [CrossRef]
- Baba, M.E.; Kayastha, P.; Huysmans, M.; Smedt, F.D. Evaluation of the Groundwater Quality Using the Water Quality Index and Geostatistical Analysis in the Dier al-Balah Governorate, Gaza Strip, Palestine. Water 2020, 12, 262. [Google Scholar] [CrossRef]
- Zaman, M.; Shahid, S.A.; Heng, L. Irrigation Water Quality. In Guideline for Salinity Assessment, Mitigation and Adaptation Using Nuclear and Related Techniques; Springer: Cham, Switzerland, 2018; pp. 113–131. [Google Scholar] [CrossRef]
- Horton, R.K. An index number system for rating water quality. J.-Water Pollut. Control. Fed. 1965, 37, 300–305. [Google Scholar]
- Harkins, R.D. An objective water quality index. J.-Water Pollut. Control. Fed. 1974, 46, 588–591. [Google Scholar] [PubMed]
- Walski, T.M.; Parker, F.L. Consumers water quality index. J. Environ. Eng. Div. 1974, 100, 259–611. [Google Scholar] [CrossRef]
- Inhaber, M. An approach to a water quality index for Canada. Water Resour. 1975, 9, 821–833. [Google Scholar] [CrossRef]
- Couillard, D.; Lefebvre, Y. Analysis of water quality indices. J. Environ. Manag. 1985, 21, 161–179. [Google Scholar]
- The United Nations Environment Programme Global Environment Monitoring System (UNEP GEMS). Global Drinking Water Quality Index Development and Sensitivity Analysis Report; The United Nations Environment Programme Global Environment Monitoring System/Water Programme: Burlington, ON, Canada, 2007; p. 58. Available online: https://wedocs.unep.org/20.500.11822/9439 (accessed on 12 September 2021).
- Ramakrishnaiah, C.R.; Sadashivaiah, C.; Ranganna, G. Assessment of water quality index for the groundwater in Tumkur Taluk, Karnataka State, India. E.-J. Chem. 2009, 6, 523–530. [Google Scholar] [CrossRef] [Green Version]
- Rao, K.N.; Latha, P.S. Groundwater quality assessment using water quality index with a special focus on vulnerable tribal region of Eastern Ghats hard rock terrain, Southern India. Arab. J. Geosci. 2019, 12, 267. [Google Scholar] [CrossRef]
- Bangladesh Bureau of Statistics (BBS). District Statistics 2011—Khagrachhari; Bangladesh Bureau of Statistics, Statistics and Informatics Division, Ministry of Planning, Government of the People’s Republic of Bangladesh: Dhaka, Bangladesh, 2011; 127p.
- Bangladesh Water Development Board (BWDB). Ground Water Table Hydrograph of 38 Districts for the Year 2008 to 2018; Bangladesh Water Development Board, Ground Water Processing Branch, Processing and Flood Forecasting Circle: Dhaka, Bangladesh, 2020; 62p.
- Domenico, P.A.; Schwartz, F.W. Physical and Chemical Hydrogeology; Wiley: New York, NY, USA, 1990. [Google Scholar]
- Gorine, M.; Benkhelifa, M.; Gacem, F.; Bellague, D. Evaluation of the quality of groundwater used for irrigation in the Mina plain, Algeria. J. Water Sci. 2019, 32, 223–234. [Google Scholar] [CrossRef]
- Todd, D.K.; Mays, L. Groundwater Hydrology, 3rd ed.; John Wiley and Sons, Inc.: Hoboken, NJ, USA, 2005; 652p. [Google Scholar]
- Ravikumar, P.; Somashekar, R.K.; Angami, M. Hydrochemistry and evaluation of groundwater suitability for irrigation and drinking purposes in the Markandeya River basin, Belgaum District, Karnataka State, India. Environ. Monit. Assess. 2011, 173, 459–487. [Google Scholar] [CrossRef]
- Xu, P.; Feng, W.; Qian, H.; Zhang, Q. Hydrogeochemical Characterization and Irrigation Quality Assessment of Shallow Groundwater in the Central-Western Guanzhong Basin, China. Int. J. Environ. Res. Public Health 2019, 16, 1492. [Google Scholar] [CrossRef]
- Balasubramani, K.; Murthy, K.R.; Gomathi, M.; Kumaraswamy, K. Integrated assessment of groundwater resources in a semi-arid watershed of South India: Implications for irrigated agriculture. GeoJournal 2020, 85, 1701–1723. [Google Scholar] [CrossRef]
- Mirza, A.T.M.; Rahman, T.; Saadat, A.H.M.; Islam, M.S.; Abdullah, A.M.A.S. Groundwater characterization and selection of suitable water type for irrigation in the western region of Bangladesh. Appl. Water Sci. 2017, 7, 233–243. [Google Scholar]
- Shah, M.; Sircar, A.; Varsada, R.; Vaishnani, S.; Savaliya, U.; Faldu, M.; Vaidya, D.; Bhattacharya, P. Assessment of geothermal water quality for industrial and irrigation purposes in the Unai geothermal field, Gujarat, India. Groundw. Sustain. Dev. 2019, 8, 59–68. [Google Scholar] [CrossRef]
- Yasmin, G.; Islam, D.; Islam, M.T.; Ullah, M.S.; Adham, A.K.M. Evaluation of groundwater quality for irrigation and drinking purposes in Barishal district of Bangladesh. Fundam. Appl. Agric. 2019, 4, 632–641. [Google Scholar] [CrossRef]
- Kawo, N.S.; Karuppannan, S. Groundwater quality assessment using water quality index and GIS technique in Modjo River Basin, central Ethiopia. J. Afr. Earth Sci. 2018, 147, 300–311. [Google Scholar] [CrossRef]
- Ahmed, K.M.; Bhattacharya, P.; Hasan, M.A.; Akhter, S.H.; Alam, S.M.M.; Bhuyian, M.A.H.; Imam, M.B.; Khan, A.A.; Sracek, O. Arsenic enrichment in groundwater of the alluvial aquifers in Bangladesh: An overview. Appl. Geochem. 2004, 19, 181–200. [Google Scholar] [CrossRef]
- Ravenscroft, P.; Burgess, W.G.; Ahmed, K.M.; Burren, M.; Perrin, J.; Melanie, A.; Jerome, B. Arsenic in groundwater of the Bengal Basin, Bangladesh: Distribution, field relations, and hydrogeological setting. Hydrogeol. J. 2005, 13, 727–751. [Google Scholar] [CrossRef]
- Ahmed, K.M. Groundwater contamination in Bangladesh. In Water Resources Planning and Management; Grafton, R.Q., Hussey, K., Eds.; Cambridge University Press: Cambridge, UK, 2011; pp. 529–560. [Google Scholar] [CrossRef]
- Islam, M.N. Chittagong Hill Tracts Rural Development Project-II, Project No. 42248-013; Environmental Monitoring Report; Ministry of Chittagong Hill Tracts Affairs, Government of the People’s Republic of Bangladesh: Dhaka, Bangladesh, 2016; 87p.
- Charles, K.J.; Ong, L.A.; Achi, N.E.; Ahmed, K.M.; Khan, M.H.; Hoque, S.; Nowicki, S. Bangladesh MICS 2019: Water Quality Thematic Report. Bangladesh Bureau of Statistics, Ministry of Planning, Government of the People’s Republic of Bangladesh and UNICEF Bangladesh: Dhaka, Bangladesh, 2021; 106p. [Google Scholar]
- Department of Public Health (DPHE). Water Quality Parameters Bangladesh Standards & WHO Guidelines. Available online: http://old.dphe.gov.bd/index.php?option=com_content&view=article&id=125&Itemid=133 (accessed on 21 October 2021).
- Bangladesh Water Development Board—United Nations Development Programme (BWDB-UNDP). Groundwater Survey: The Hydrogeological Conditions of Bangladesh; UNDP Technical Report DP/UN/BGD-74-009/1; Bangladesh Water Development Board—United Nations Development Programme: Dhaka, Bangladesh, 1982; 113p. [Google Scholar]
- World Health Organization (WHO). Developing Drinking-Water Quality Regulations and Standards: General Guidance with a Special Focus on Countries with Limited Resources; World Health Organization: Geneva, Switzerland, 2018; p. 57. [Google Scholar]
- United States Geological Survey (USGS). Water-Quality Characteristics and Trends for Selected Sites in or Near the Earth Resources Observation Systems (EROS) Data Center, South Dakota, 1973–2000; U.S. Geological Survey Water-Resources Investigations Report 03-4280; The United States Geological Survey: Reston, VA, USA, 2003; 64p. Available online: https://pubs.usgs.gov/wri/wri034280/wri034280.pdf (accessed on 8 June 2022).
- Foster, M.D. The origin of high sodium bicarbonate waters in the Atlantic and Gulf Coastal Plains. Geochim. Et Cosmochim. Acta 1950, 1, 33–48. [Google Scholar] [CrossRef]
- Spalding, R.F.; Exner, M.E. Occurrence of nitrate in groundwater: A review. J. Environ. Qual. 1993, 22, 392–402. [Google Scholar] [CrossRef]
- Kohl, P.M.; Medlar, S.J. Occurrence of Manganese in Drinking Water and Manganese Control; American Water Works Association: Denver, CO, USA, 2006; 184p. [Google Scholar]
- Piper, A.M. A Graphic Procedure in the Geochemical Interpretation of Water-Analyses. Eos Trans. Am. Geophys. Union 1944, 25, 914–928. [Google Scholar] [CrossRef]
- Gastmans, D.; Chang, H.K.; Hutcheon, I. Groundwater geochemical evolution in the northern portion of the Guarani aquifer system (Brazil) and its relationship to diagenetic features. Appl. Geochem. 2010, 25, 16–33. [Google Scholar] [CrossRef]
- Afroza, R.; Mazumder, Q.H.; Jahan, C.S.; Kazi, M.A.I.; Ahsan, M.A.; Al-Mansur, M.A. Hydrochemistry and origin of salinity in groundwater in parts of lower Tista floodplain, Northwest Bangladesh. J. Geol. Soc. India 2009, 74, 223–232. [Google Scholar] [CrossRef]
- Goodbred, S.L., Jr.; Kuehl, S.A. The significance of large sediment supply, active tectonism, and eustasy on margin sequence development: Late Quaternary stratigraphy and evolution of the Ganges–Brahmaputra delta. Sediment. Geol. 2000, 133, 227–248. [Google Scholar] [CrossRef]
- Saha, S.; Reza, A.H.M.S.; Roy, M.K. Hydrochemical evaluation of groundwater quality of the Tista floodplain, Rangpur, Bangladesh. Appl. Water Sci. 2019, 9, 198. [Google Scholar] [CrossRef]
- Sultana, S. Hydrogeochemistry of the Lower Dupi Tila Aquifer in Dhaka City, Bangladesh; TRITA-LWR Degree Project 09-35; KTH Royal Institute of Technology: Stockholm, Sweden, 2009; 42p. [Google Scholar]
- Stiff, H.A., Jr. The interpretation of chemical water analysis by means of patterns. J. Pet. Technol. 1951, 3, 15–17. [Google Scholar] [CrossRef]
| Publisher’s Note: MDPI stays neutral with regard to jurisdictional claims in published maps and institutional affiliations. |
© 2022 by the authors. Licensee MDPI, Basel, Switzerland. This article is an open access article distributed under the terms and conditions of the Creative Commons Attribution (CC BY) license (https://creativecommons.org/licenses/by/4.0/).

 ,
, 


