Article

Hydraulically Controlled Bottom Flow in the Orkney Passage

by
Eugene G. Morozov
1,*,
Dmitry I. Frey
1,
Oleg A. Zuev
1,
Manuel G. Velarde
2,3,
Viktor A. Krechik
1 and
Rinat Z. Mukhametianov
1,4
1
Shirshov Institute of Oceanology, Nakhimovsky 36, 117997 Moscow, Russia
2
Instituto Pluridisciplinar, Universidad Complutense, Paseo Juan XXIII, 1, 28040 Madrid, Spain
3
Escuela de Arquitectura, Ingenieria y Diseno, Universidad Europea, 28670 Villaviciosa de Odon, Spain
4
Moscow Institute of Physics and Technology, Institutsky per. 9, Dolgoprudny, 141700 Moscow, Russia
*
Author to whom correspondence should be addressed.
Water 2022, 14(19), 3088; https://doi.org/10.3390/w14193088
Submission received: 22 August 2022 / Revised: 24 September 2022 / Accepted: 27 September 2022 / Published: 1 October 2022

Abstract

:
Supercritical hydraulically controlled overflow of Antarctic Bottom Water from the Weddell Sea has been observed in the Orkney Passage during field measurements in February 2022. The Orkney Passage is the main pathway for the densest layer of Antarctic Bottom Water flow from the Weddell Sea to the Scotia Sea. The bottom current overflows the sill across the passage and flows down from the crest of the sill at 3600 m deeper than 4000 m. The descending flow accelerates because of the difference in the height of the sill and its foot. An estimate of the Froude number of this flow was greater than unity. Near the foot of the slope the kinetic energy of the flow becomes insufficient to continue moving in this regime. The flow slows down, and strong mixing and warming of the bottom water occurs due to the exchange with the surrounding waters. This hydrodynamic phenomenon is called supercritical hydraulically controlled flow. However, the flow of bottom water continues further and eventually fills the abyssal depths of the Atlantic.

1. Introduction

The study site is located in the Weddell Gyre, which is a region in the Weddell Sea with specific properties that controls the deep and bottom ocean circulation and affects the global climate with the capability of influencing the global climate on time scales of hundreds to thousands of years [1]. The waters of the Weddell Sea deeper than 3000 m are connected with the Scotia Sea by the passages in the South Scotia Ridge.
Antarctic Bottom Water (AABW) that occupies the bottom layer of the Atlantic Ocean is generally formed in the Weddell Sea. Sinking of this dense water plays a key role in driving the lower limb of the global overturning circulation [2,3,4]. A major part of the AABW formation occurs in the Weddell Sea [5]. Formation of AABW generally occurs in the southern and western parts of the Weddell Sea over the ice shelves. Low temperatures and saline shelf waters are formed as a result of surface water cooling during ice freezing and brine rejection in coastal polynyas. Formation of highly dense water is maintained by cyclonic circulation in the Weddell Sea, which is driven by western winds in the north and eastern winds in the south of the Weddell Sea. The flow over the South Scotia Ridge represents a significant component of the AABW export from the Weddell Sea [6].
Weddell Sea Deep Water (WSDW) is the coldest part of AABW. Weddell Sea Deep Water is defined as water with potential temperatures between ~0°C and −0.7 °C. This water is formed due to the air–sea–ice interaction at the periphery of the Weddell Sea combined with the upwelling of Weddell Sea Bottom Water [7,8]. The main pathway for the export of WSDW from the Weddell Sea is the Orkney Passage [9]. Part of the bottom water is exported from the Weddell Sea through the South Sandwich Trench and other fractures of the South Scotia Ridge [2].

2. Hydraulic Control

We shall explain the physical phenomenon of hydraulic control following [10,11]. Fluids can transmit a signal by advection or wave propagation. We consider a water flow over an underwater ridge or dam. The flow from a deep reservoir overflows the crest of a dam or underwater ridge and spills down the spillway. A hydraulic jump is formed at the base of the spillway, which is an abrupt increase in the fluid depth (or depth of isopycnals) accompanied by turbulence, wave generation and mixing.
If perturbations of the flow appear upstream of the ridge (dam) crest, the waves (surface or internal) are generated, which can propagate in either direction. The flow downstream from the crest is so rapid that waves cannot propagate upstream. In other words, the velocity of the waves is smaller than the velocity of the descending flow. This type of flow is called supercritical. As the flow reaches the hydraulic jump, its velocity decreases and it returns to a subcritical state. In addition, the regime of the flow at the crest is critical, i.e., changing from subcritical to supercritical. Thus, the outflow from the reservoir is said to be choked or hydraulically controlled by the ridge (dam). The size of the dam, water depth and stratification are parameters that control the flow. A scheme of the phenomenon is shown in Figure 1a.
If the dam is low and the flow is slow the current just overflows the dam (Figure 1b).
Whitehead et al. [12] and Pratt and Whitehead [11] gave examples of hydraulic control in the passage between the Virgin Islands and in the Strait of Denmark; other examples were found in the Strait of Gibraltar [13,14].
This phenomenon has also been studied in laboratory experiments [15]. Even if the flow is subcritical, the flow entrains surrounding waters depending not only on the Froude number but also on the Reynolds number, as shown in [16]. The authors demonstrated this on the example of laboratory experiments and overflow in the Denmark Strait. Field measurements of a bolus of cold water overflowing the sill in the Denmark Strait and properties of the flow with variable velocity of the overflowing water were reported in [17]. Overflow in the Faroe Bank Channel was studied in [18].
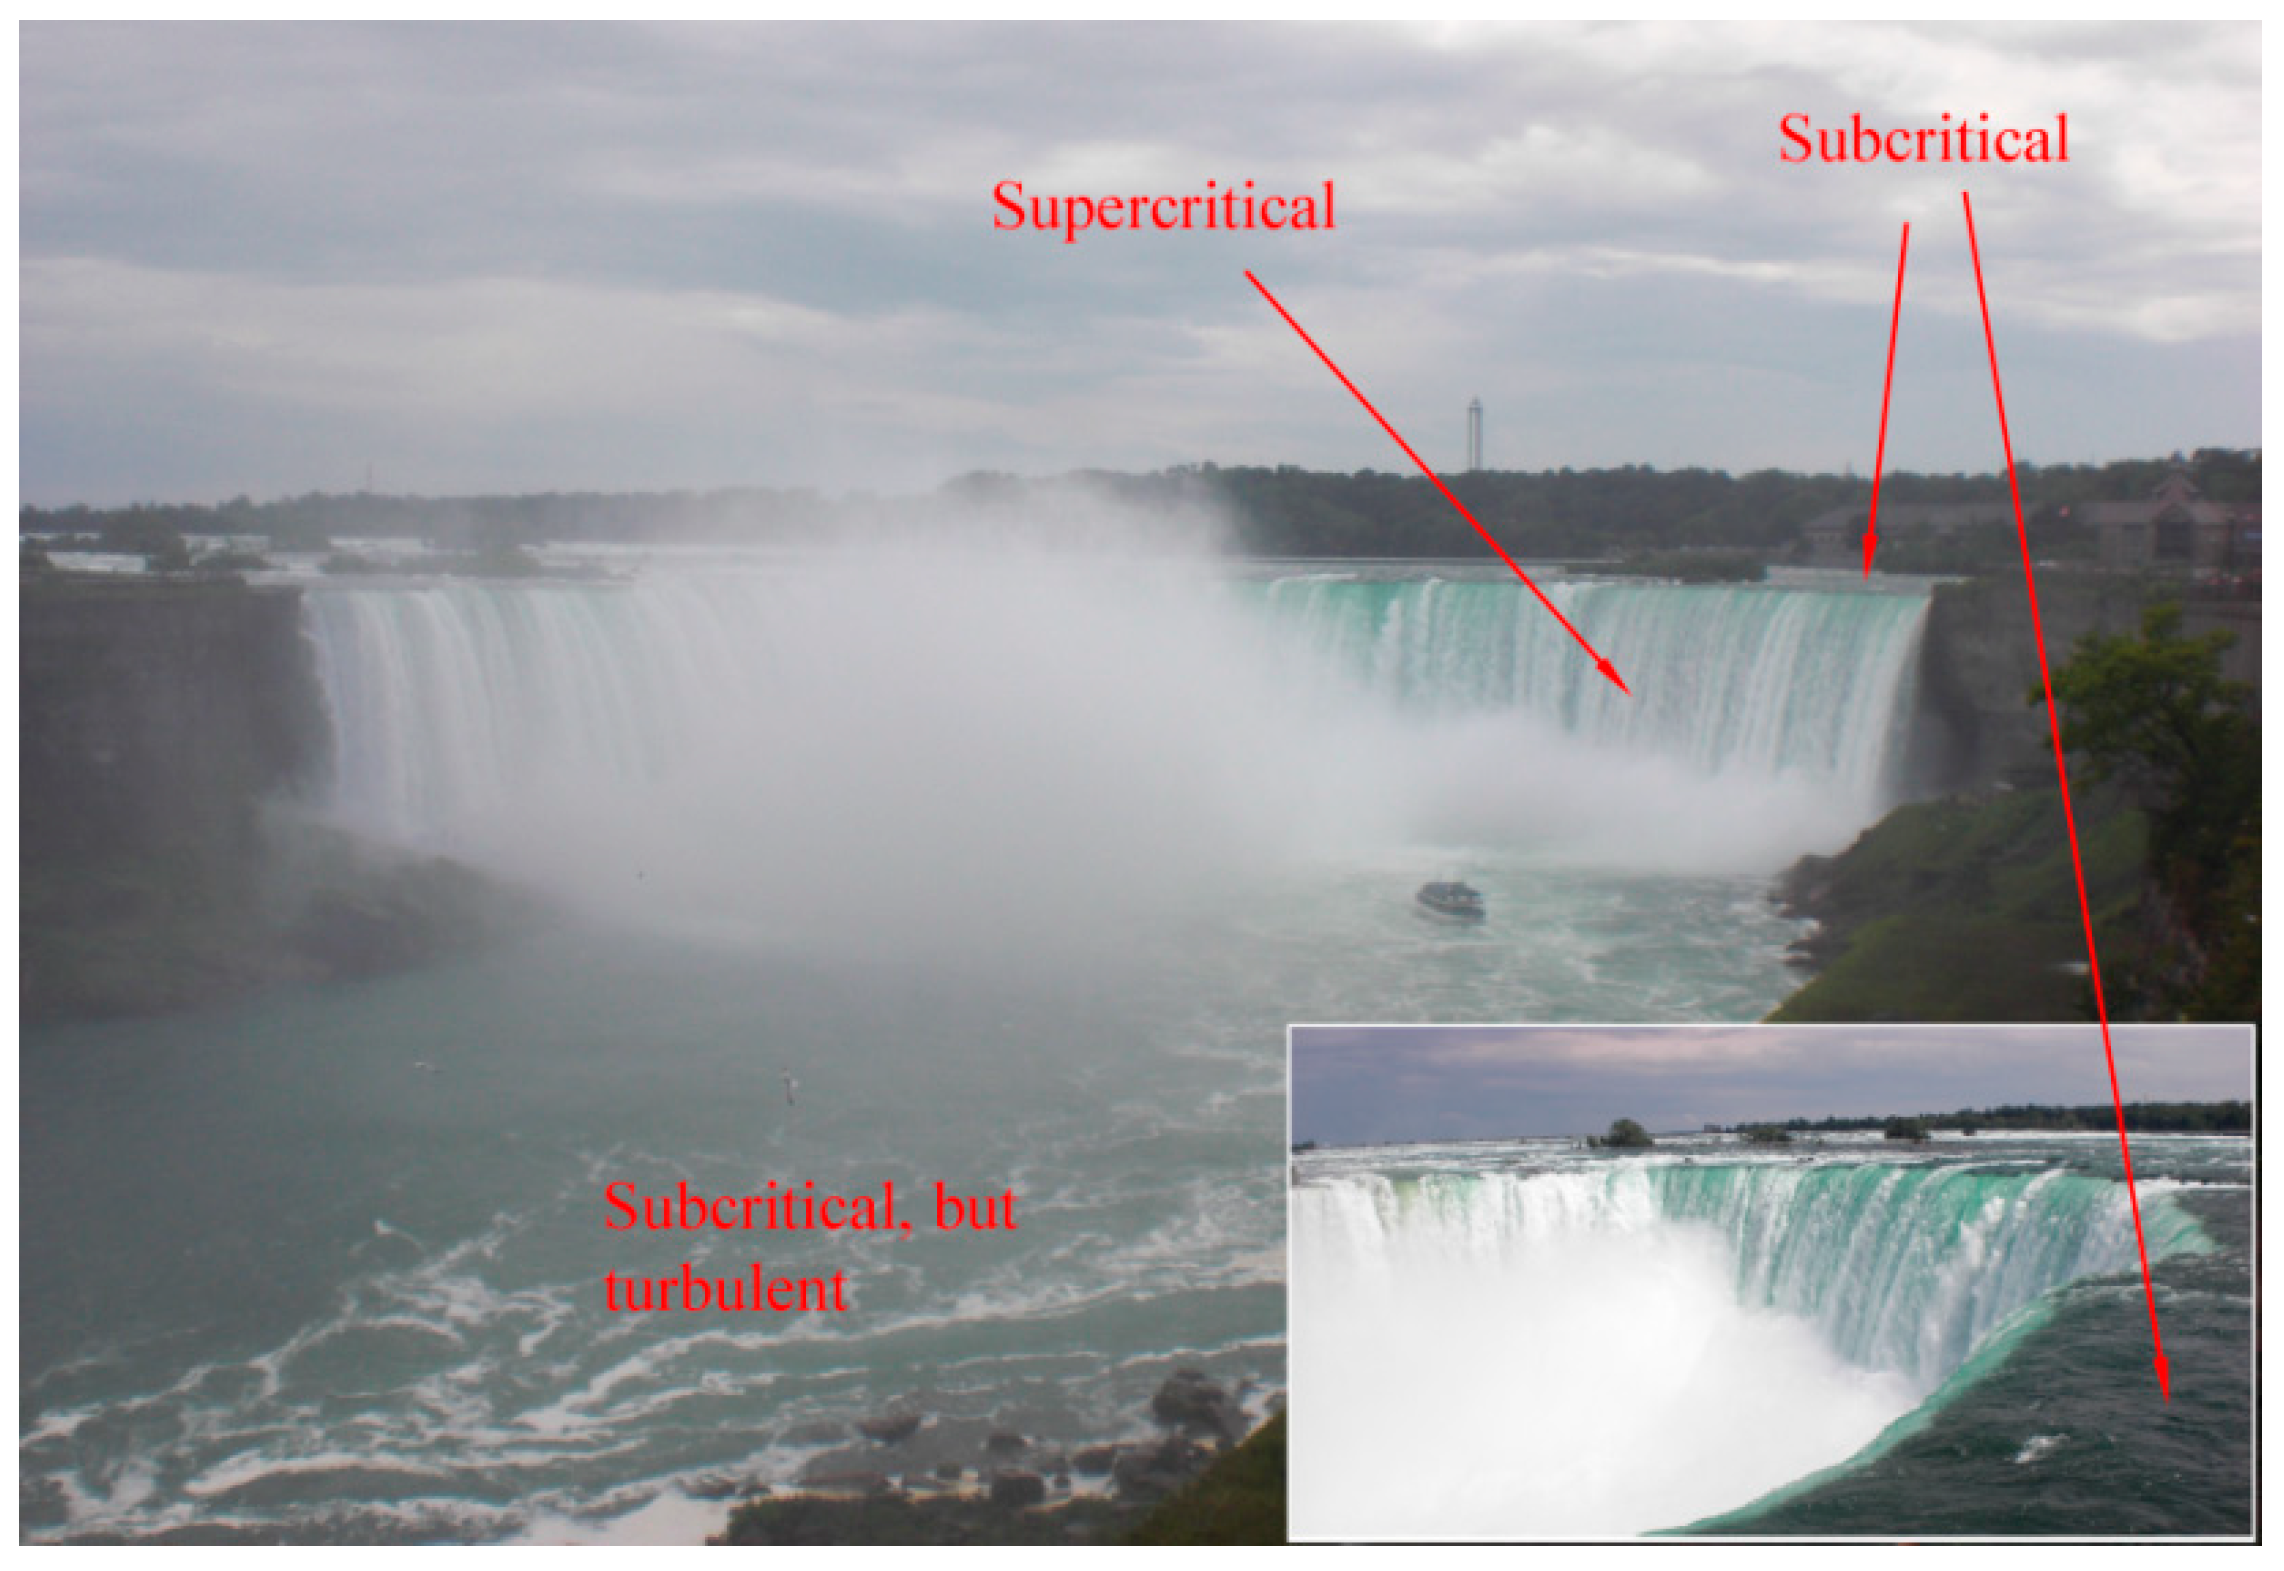
We will show some more illustrative examples. First is the well-known Niagara Falls, which is a surface flow (Figure 2).
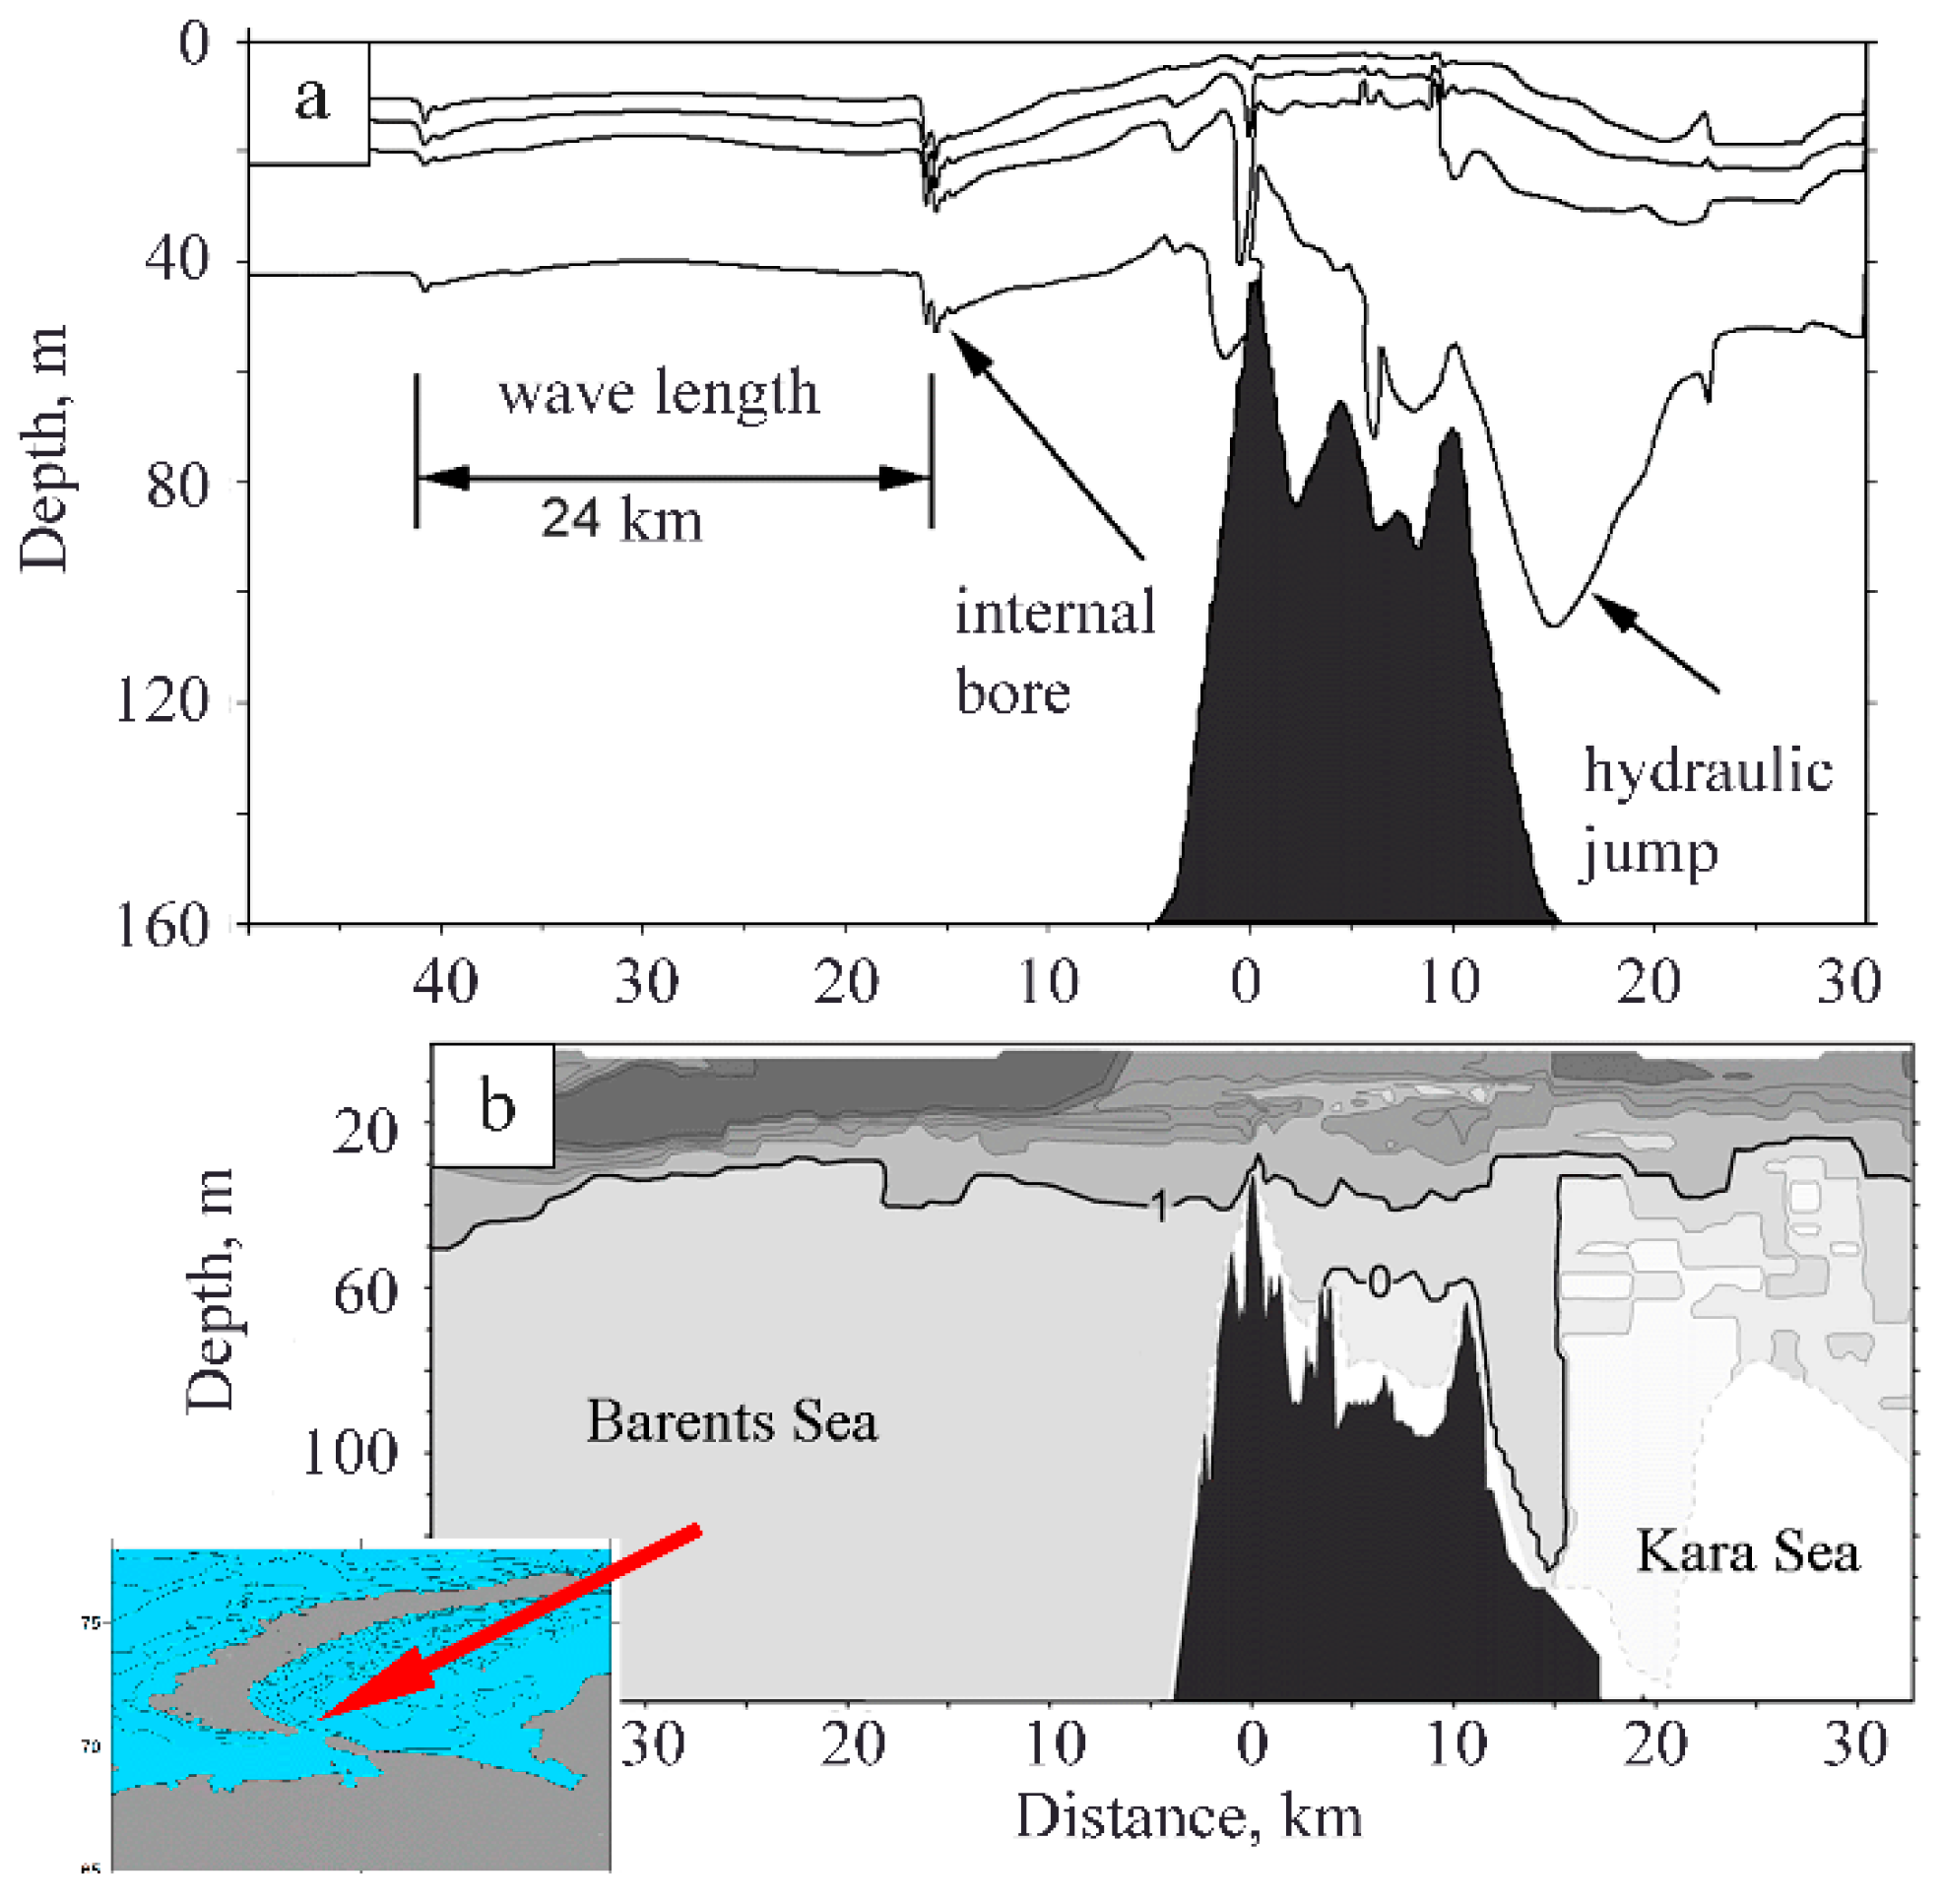
Another example is a flow over an underwater ridge in a less known region in the Kara Gates Strait between the Barents and Kara seas [19]. The phenomenon of the flow is very similar to that in the Strait of Gibraltar. A surface flow from the Barents Sea to the Kara Sea forms a hydraulic jump, whereas strong tidal currents over a sill generate large-amplitude internal tides [19,20,21] (Figure 3).
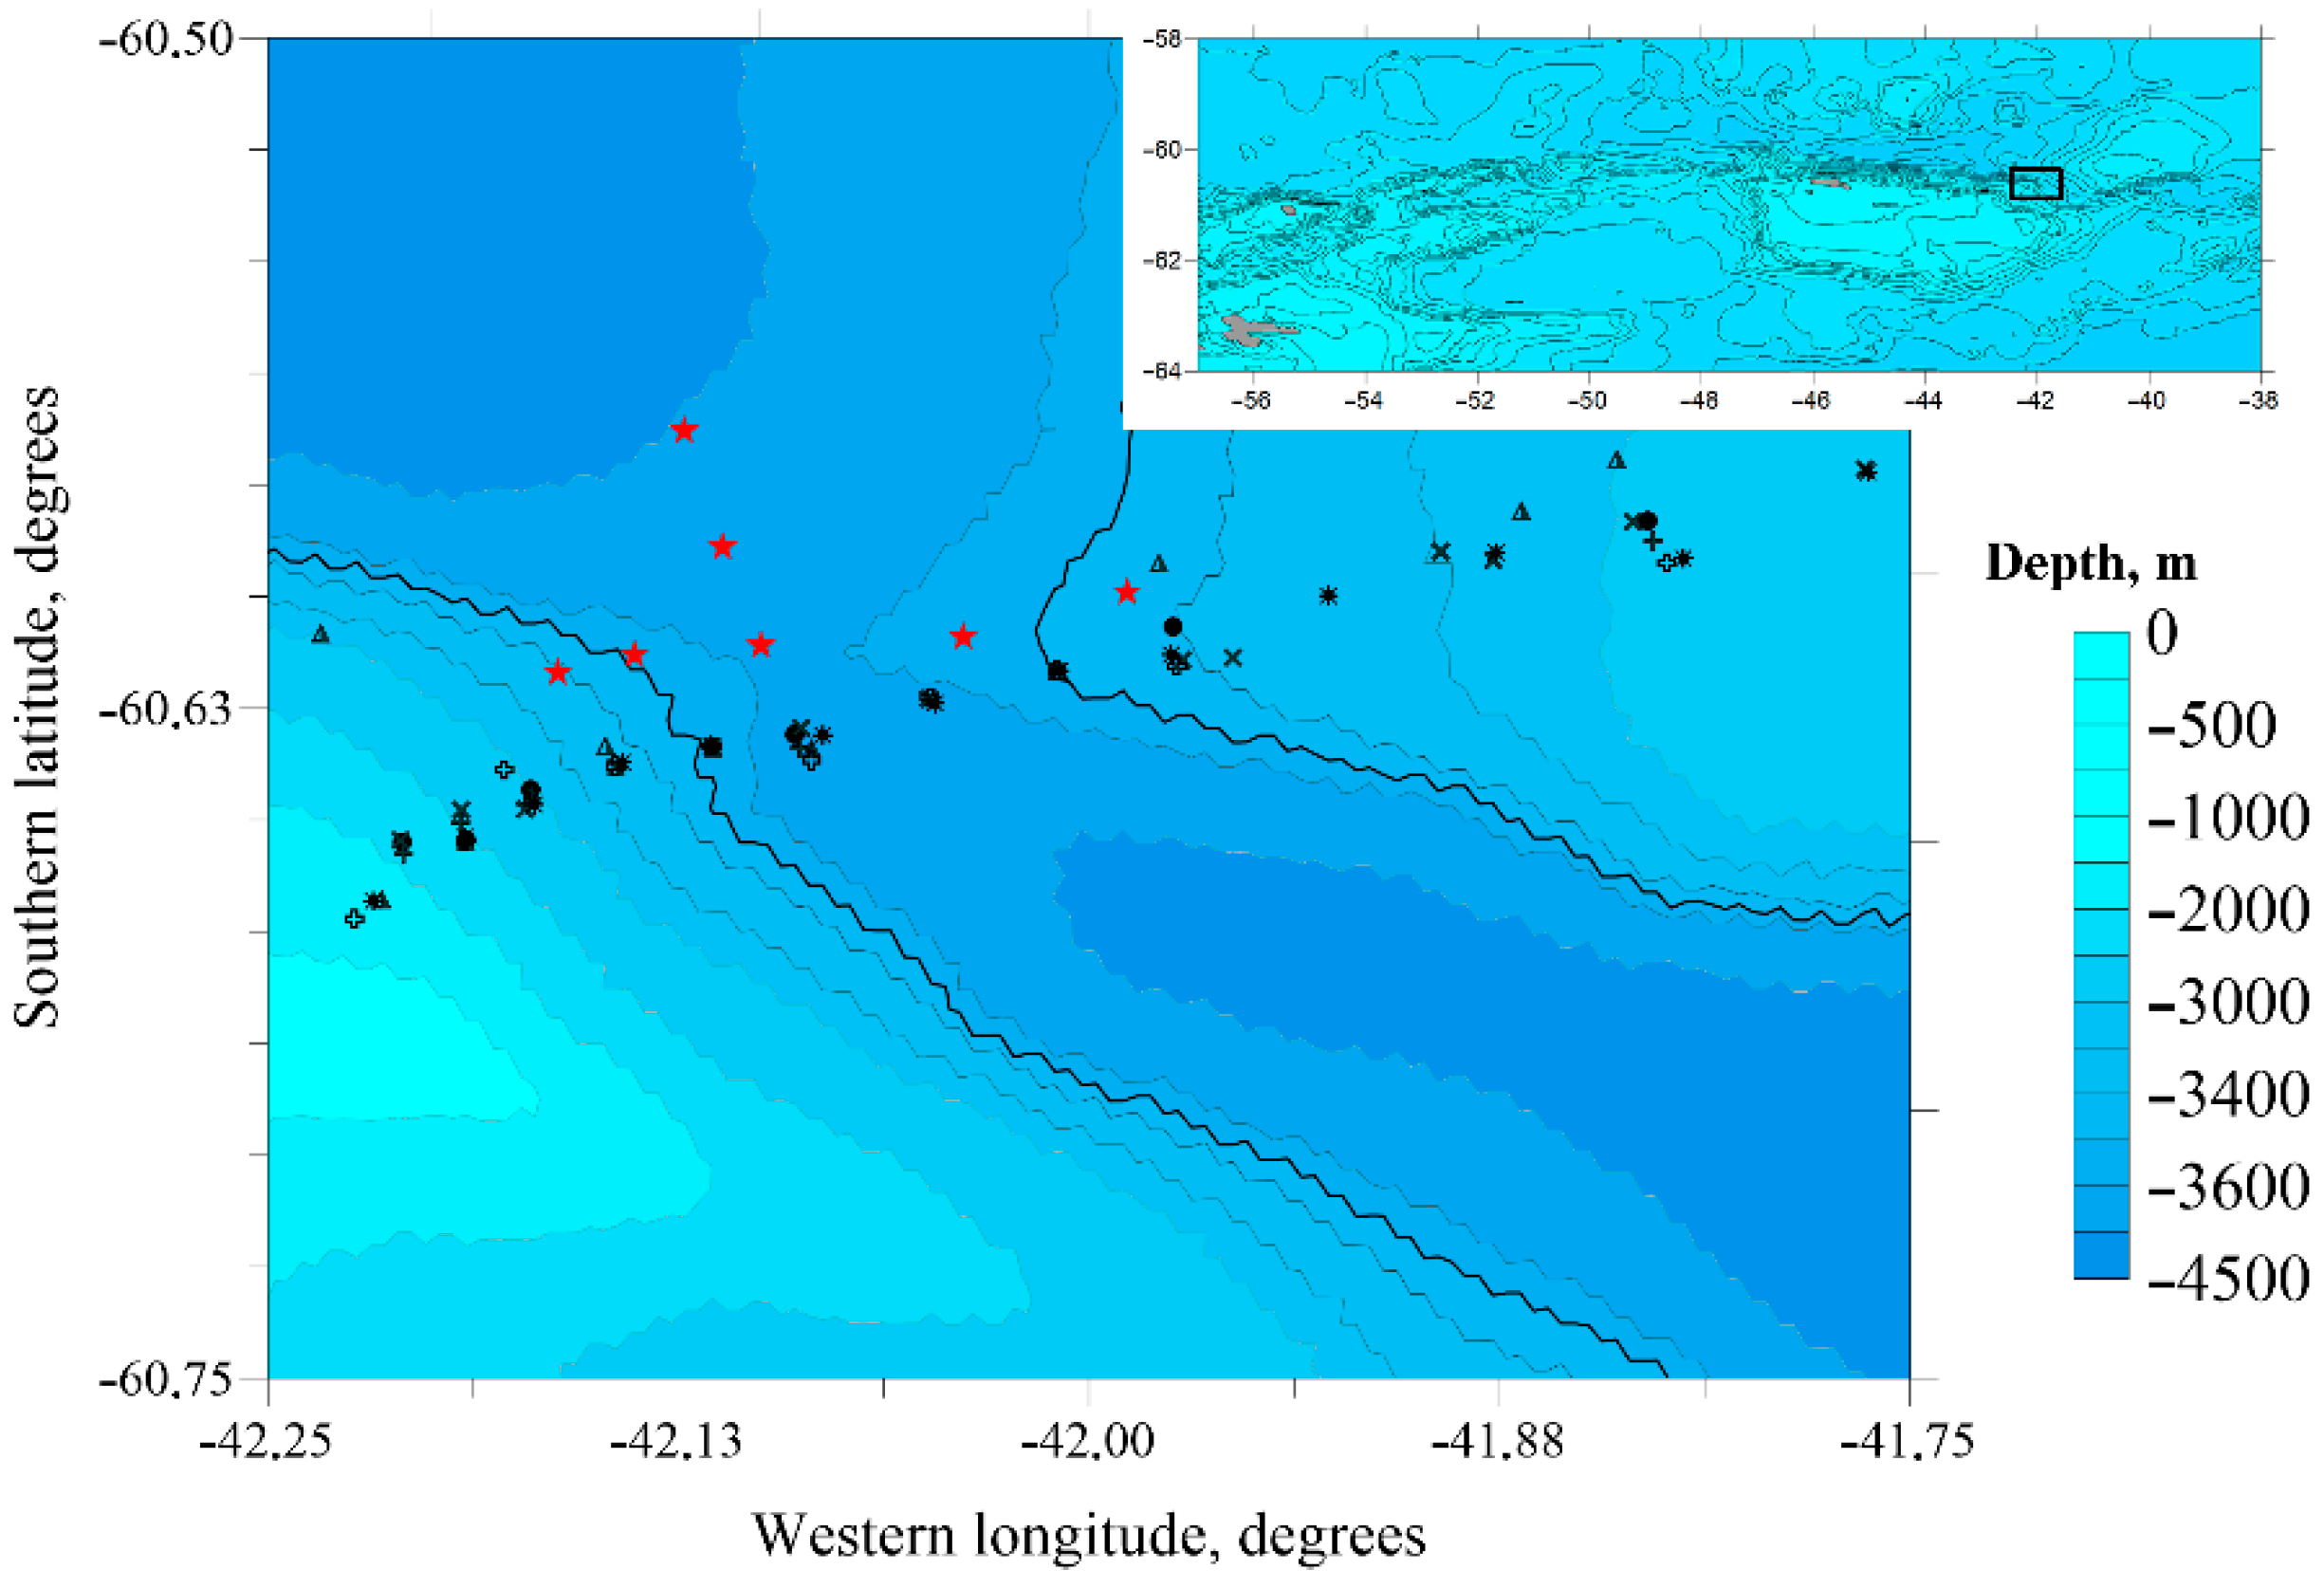
The flow of AABW through the Orkney Passage has been previously studied based on CTD/LADCP casts. A map of stations in different years is shown in Figure 4.

3. Data and Methods

Seven CTD casts with velocity profiling (LADCP) were made in the cruise in 2022 in the Orkney Passage region. Five stations were made across the passage and two stations down into the Laurie Depression from the central station. The depth of the ridge across the passage is about 3600 m. The sounding stations were displaced to the north relative to the repeated section in order to exclude possible interference with moorings that could be placed in this area.
The stations were performed using a lowered acoustic doppler current profiler (LADCP) and conductivity, temperature, and depth (CTD) profilers mounted on a General Oceanics GO1018 rosette water sampler. The water sampler was equipped with a Valeport VA500 altimeter allowing measurements close to the ocean bottom (3–7 m above the seafloor). An Idronaut Ocean Seven 320plus CTD probe was used for the measurements together with an MKplus Deck Unit. The CTD data were collected using the standard package REDAS5. The declared accuracy of CTD measurements is 0.001 °C for temperature and 0.001 mS/cm for conductivity sensors. The LADCP data measured by the TRDI WorkHorse Monitor 300 kHz profiler were processed using the programming package LDEO Software version IX.10 [23]. The accuracy of velocity measurements estimated by the processing program is usually 3–4 cm/s. In the bottom layers due to the bottom track signals, the errors decrease to 1–2 cm/s.
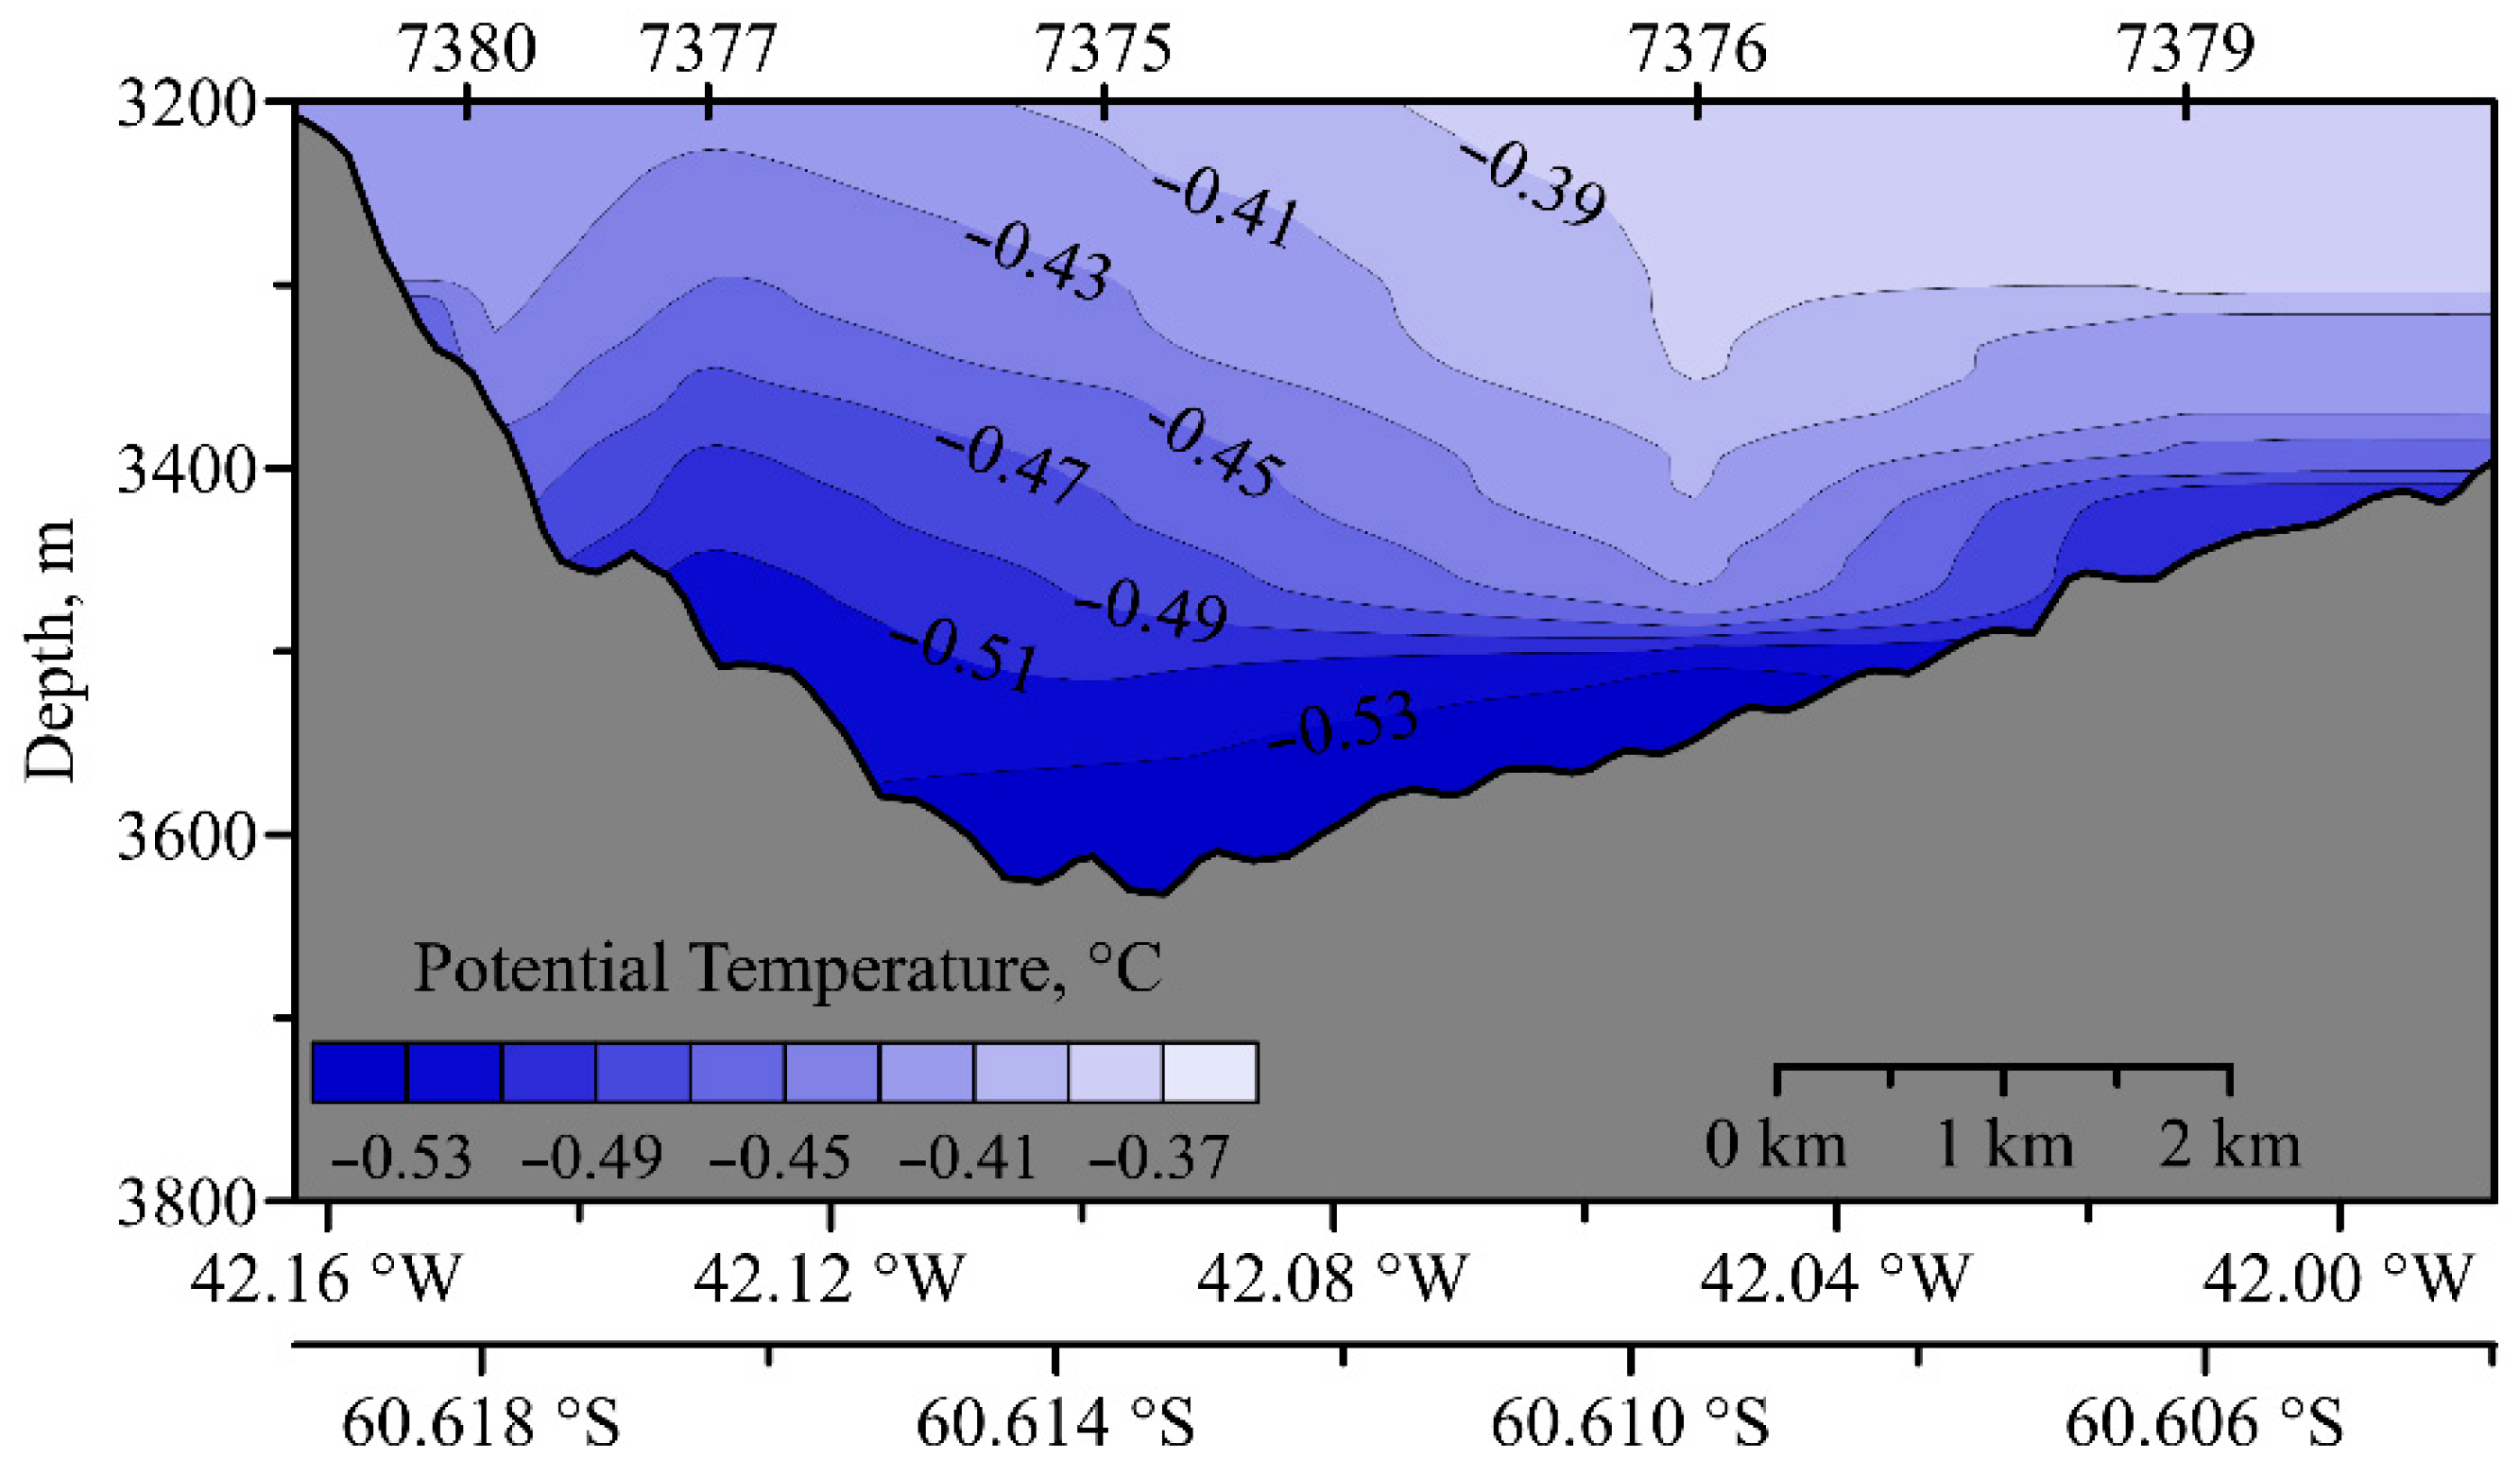
The temperature section is shown in Figure 5.
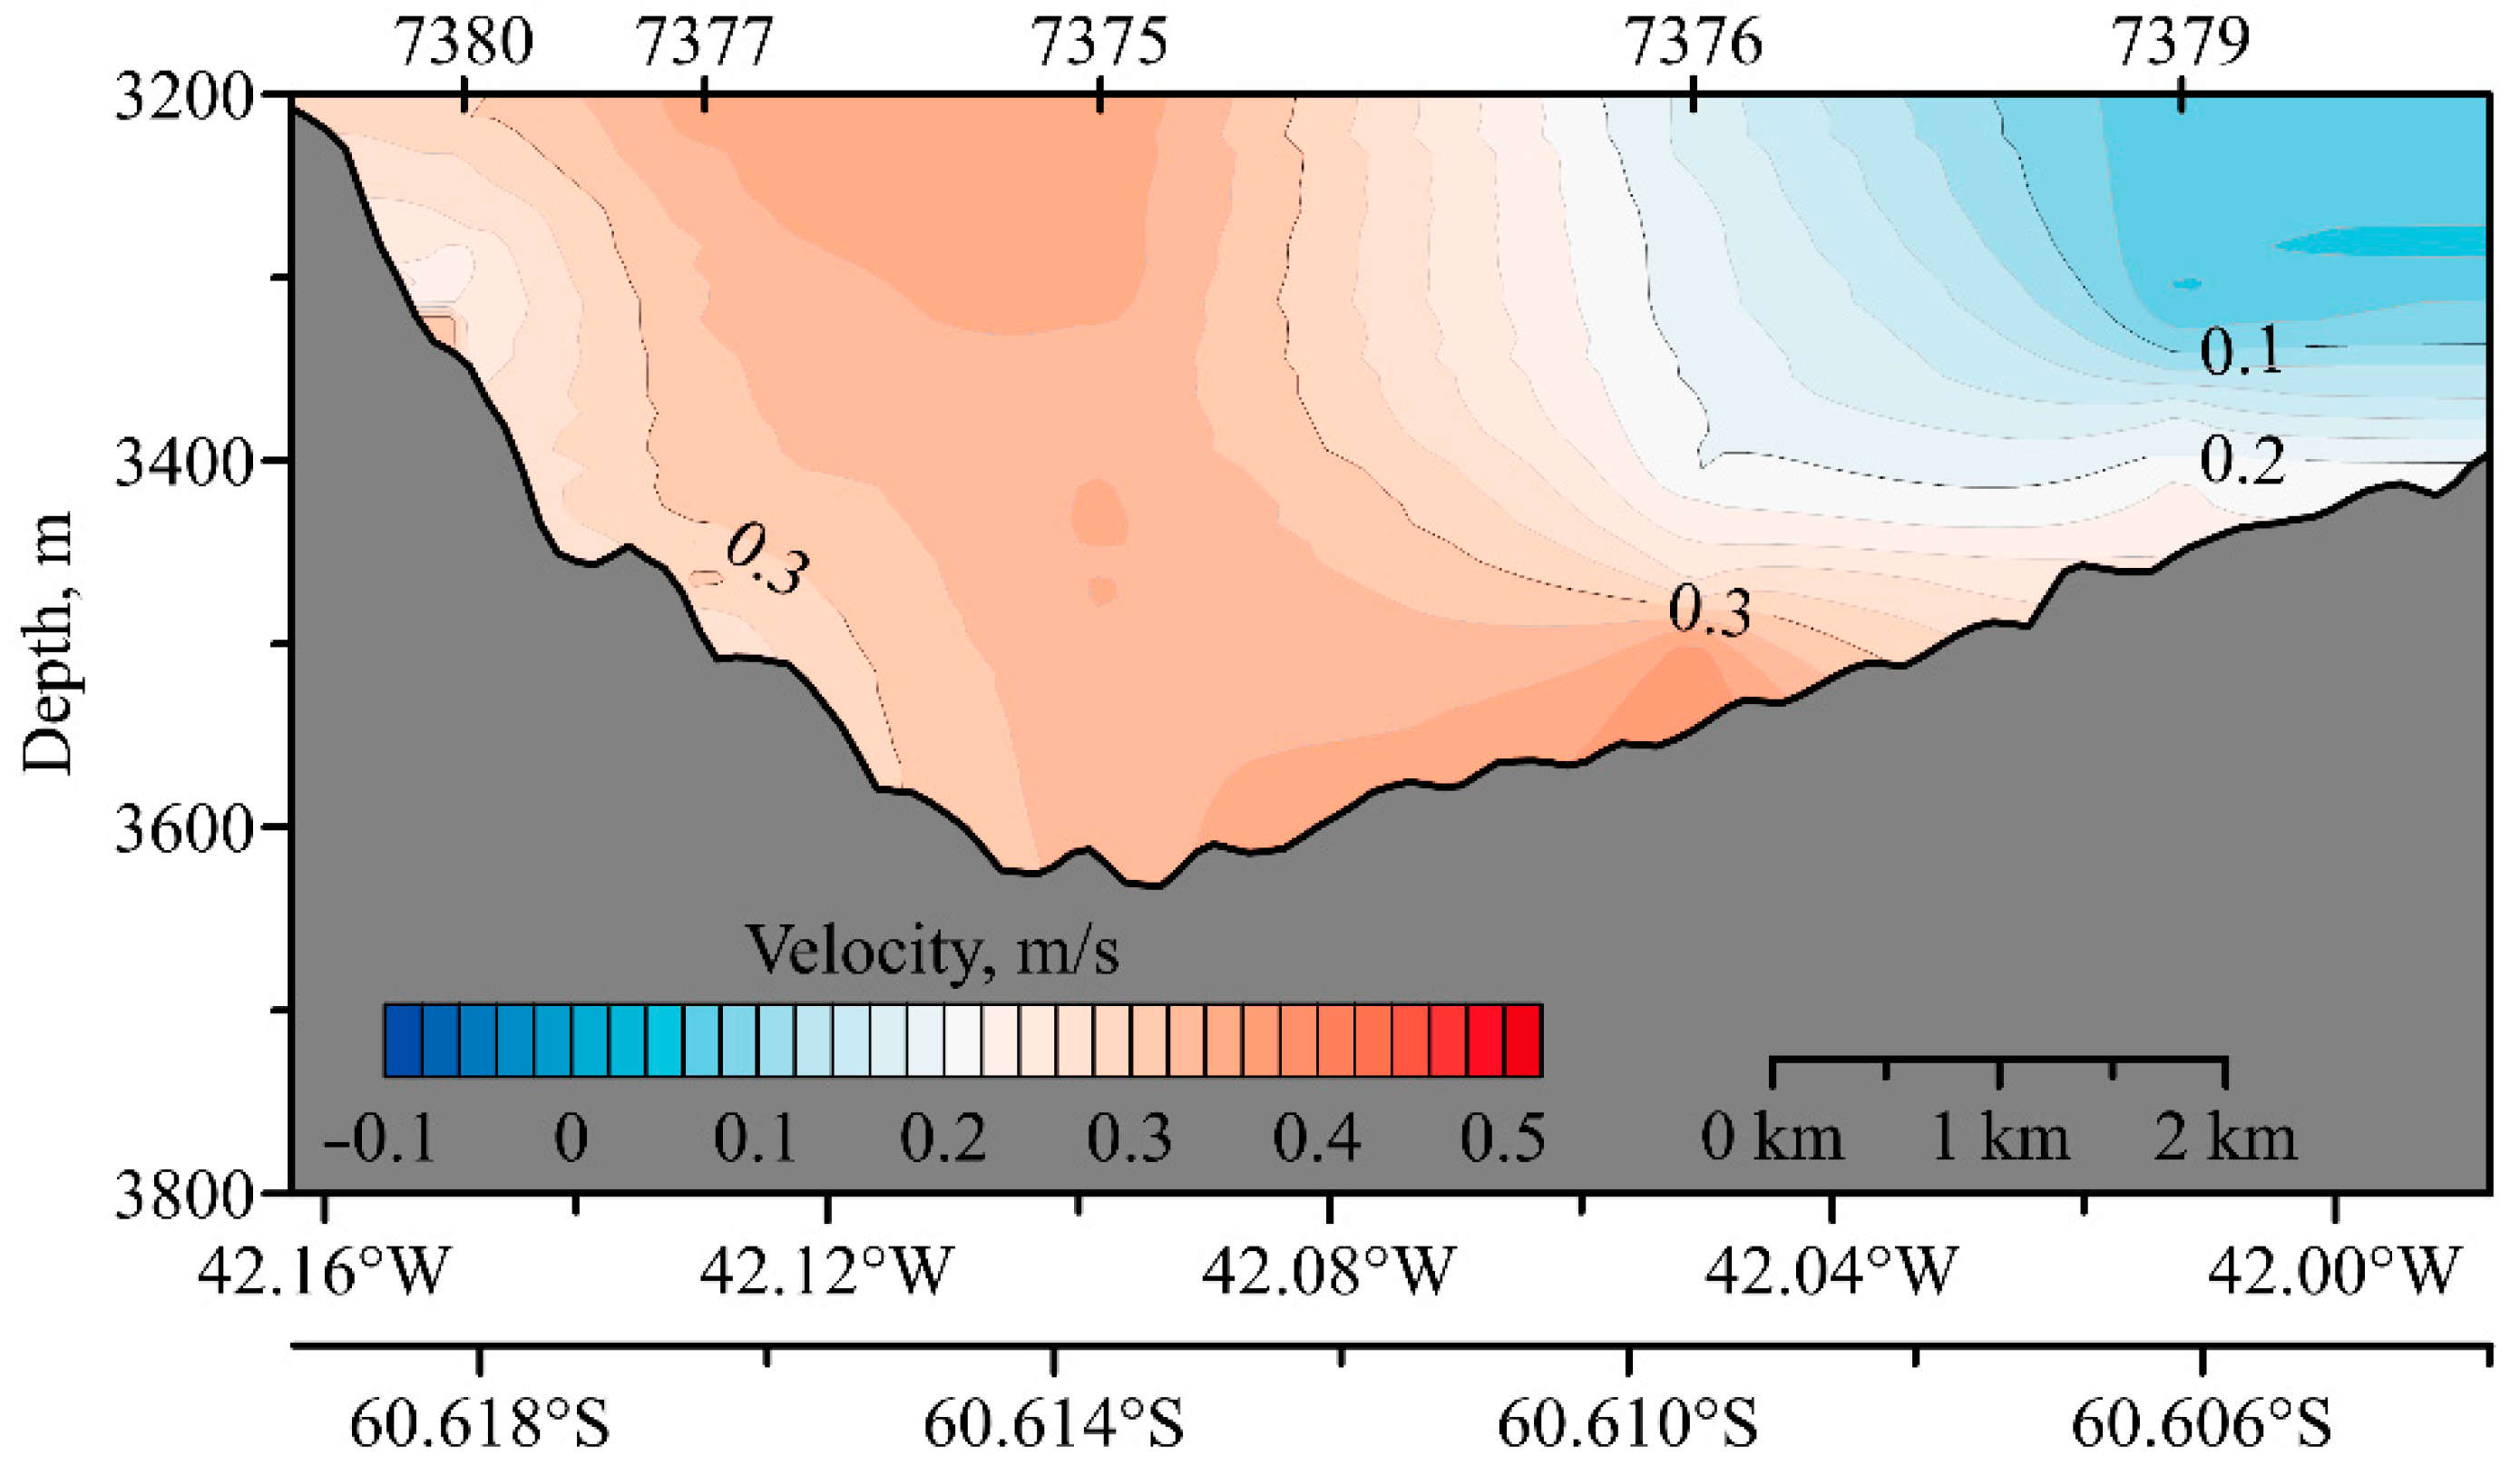
One can see in Figure 5 and Figure 6 two characteristic features that are common to all flows in underwater channels. The cold core is displaced to the right side of the channel along the flow. This occurs due to the Ekman circulation, which arises from the bottom friction when the current flows in a narrow channel. A second core appears in the western (left) part of the passage above the bottom, which is displaced to the left of the flow and is located over the western wall of the channel [24]. The minimum potential temperature is −0.54 °C, which is close to the previous estimates [6].
The velocities of the flow in the passage correspond to similar flows in the southern hemisphere and in particular the flow in the Vema Channel. The core of the maximum velocity is displaced to the left side relative to the flow.
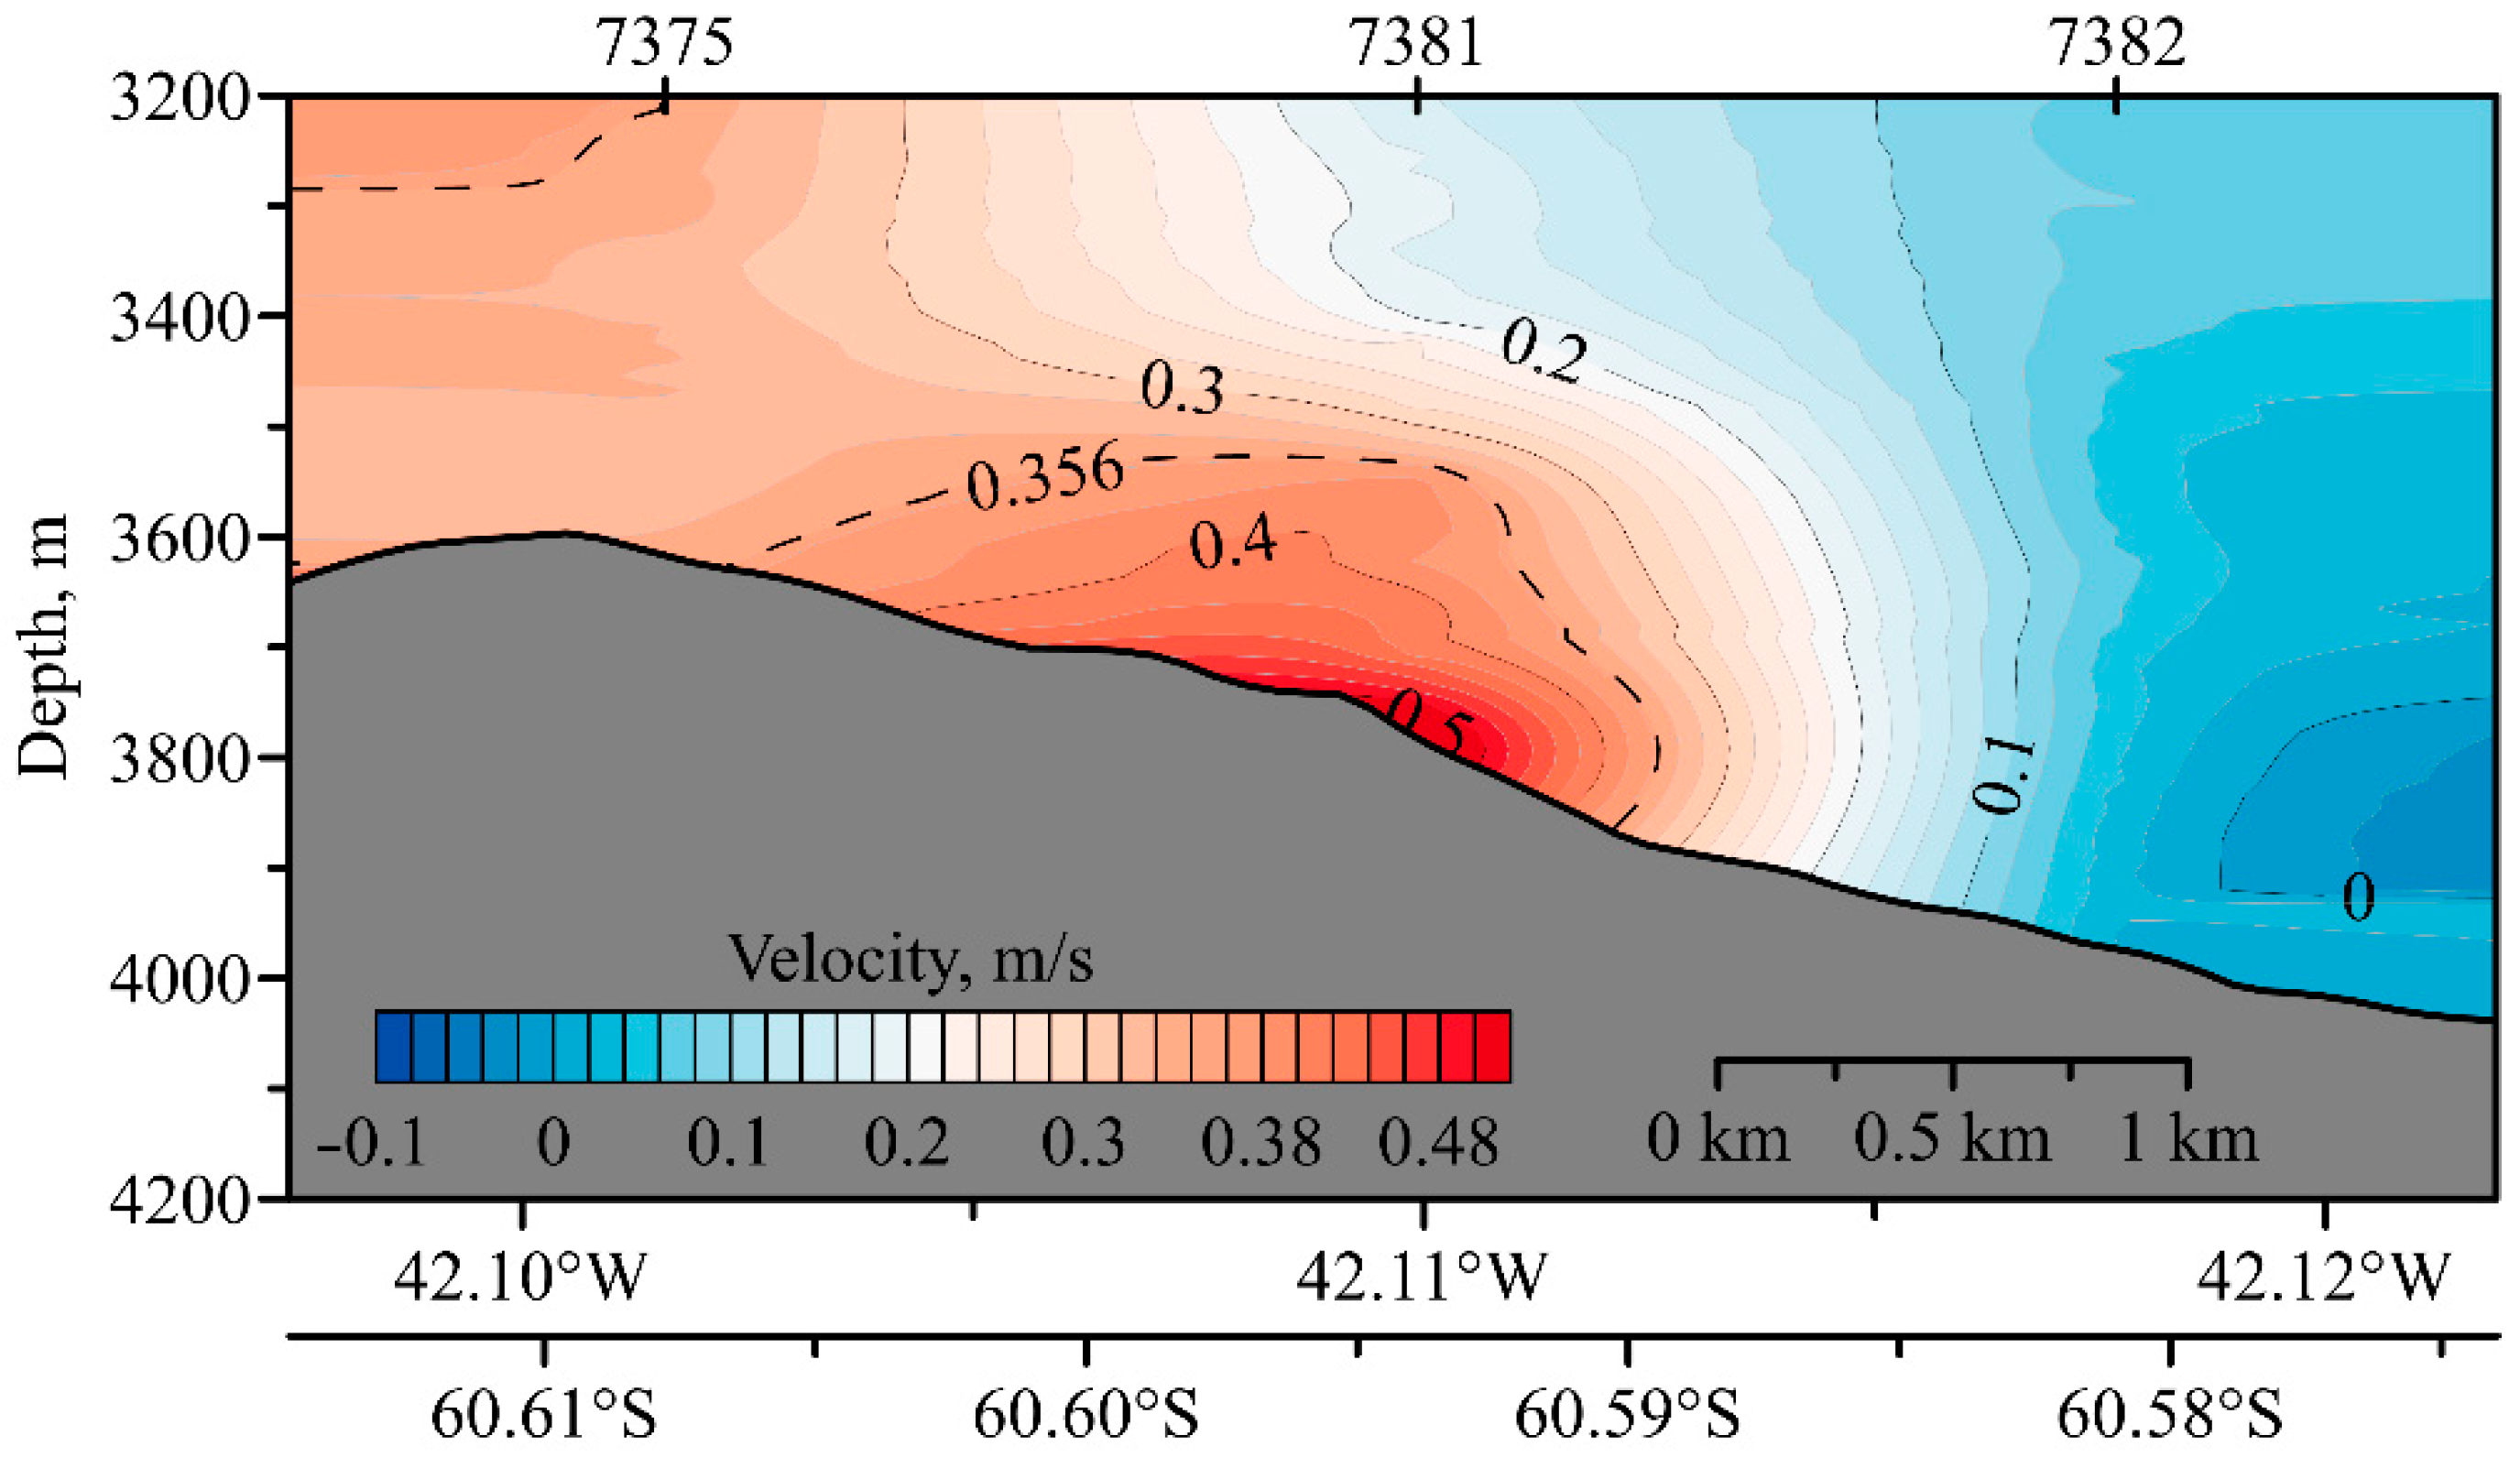
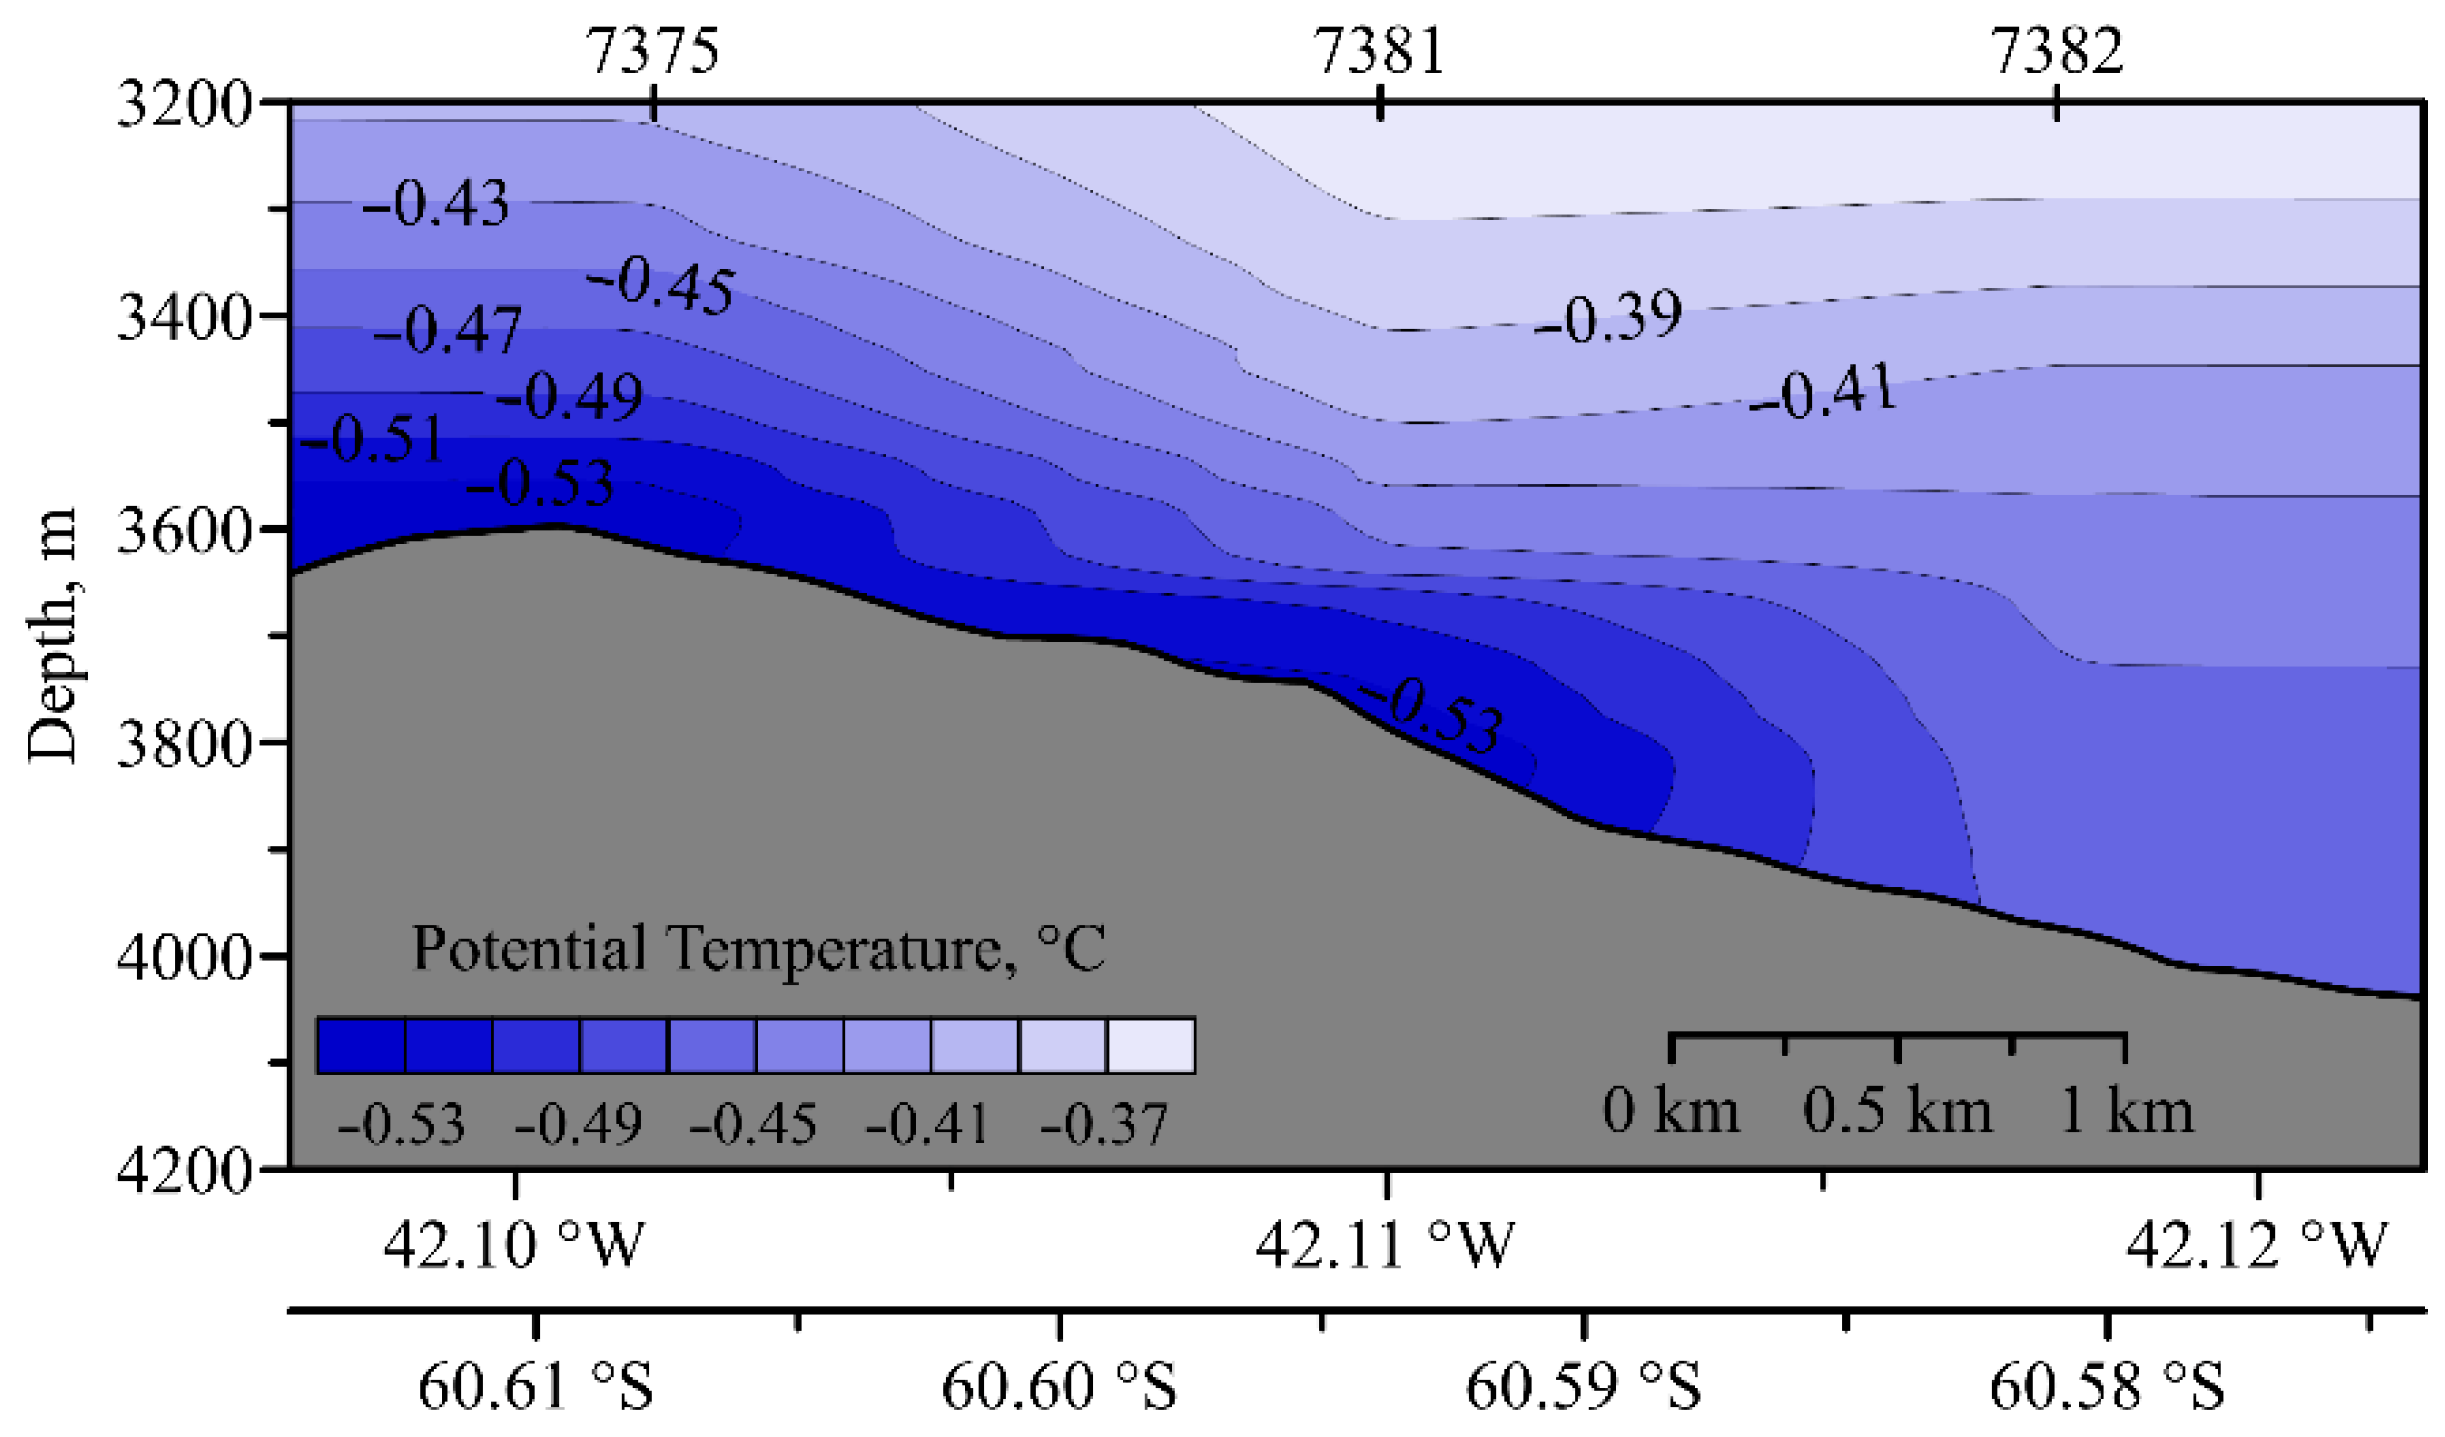
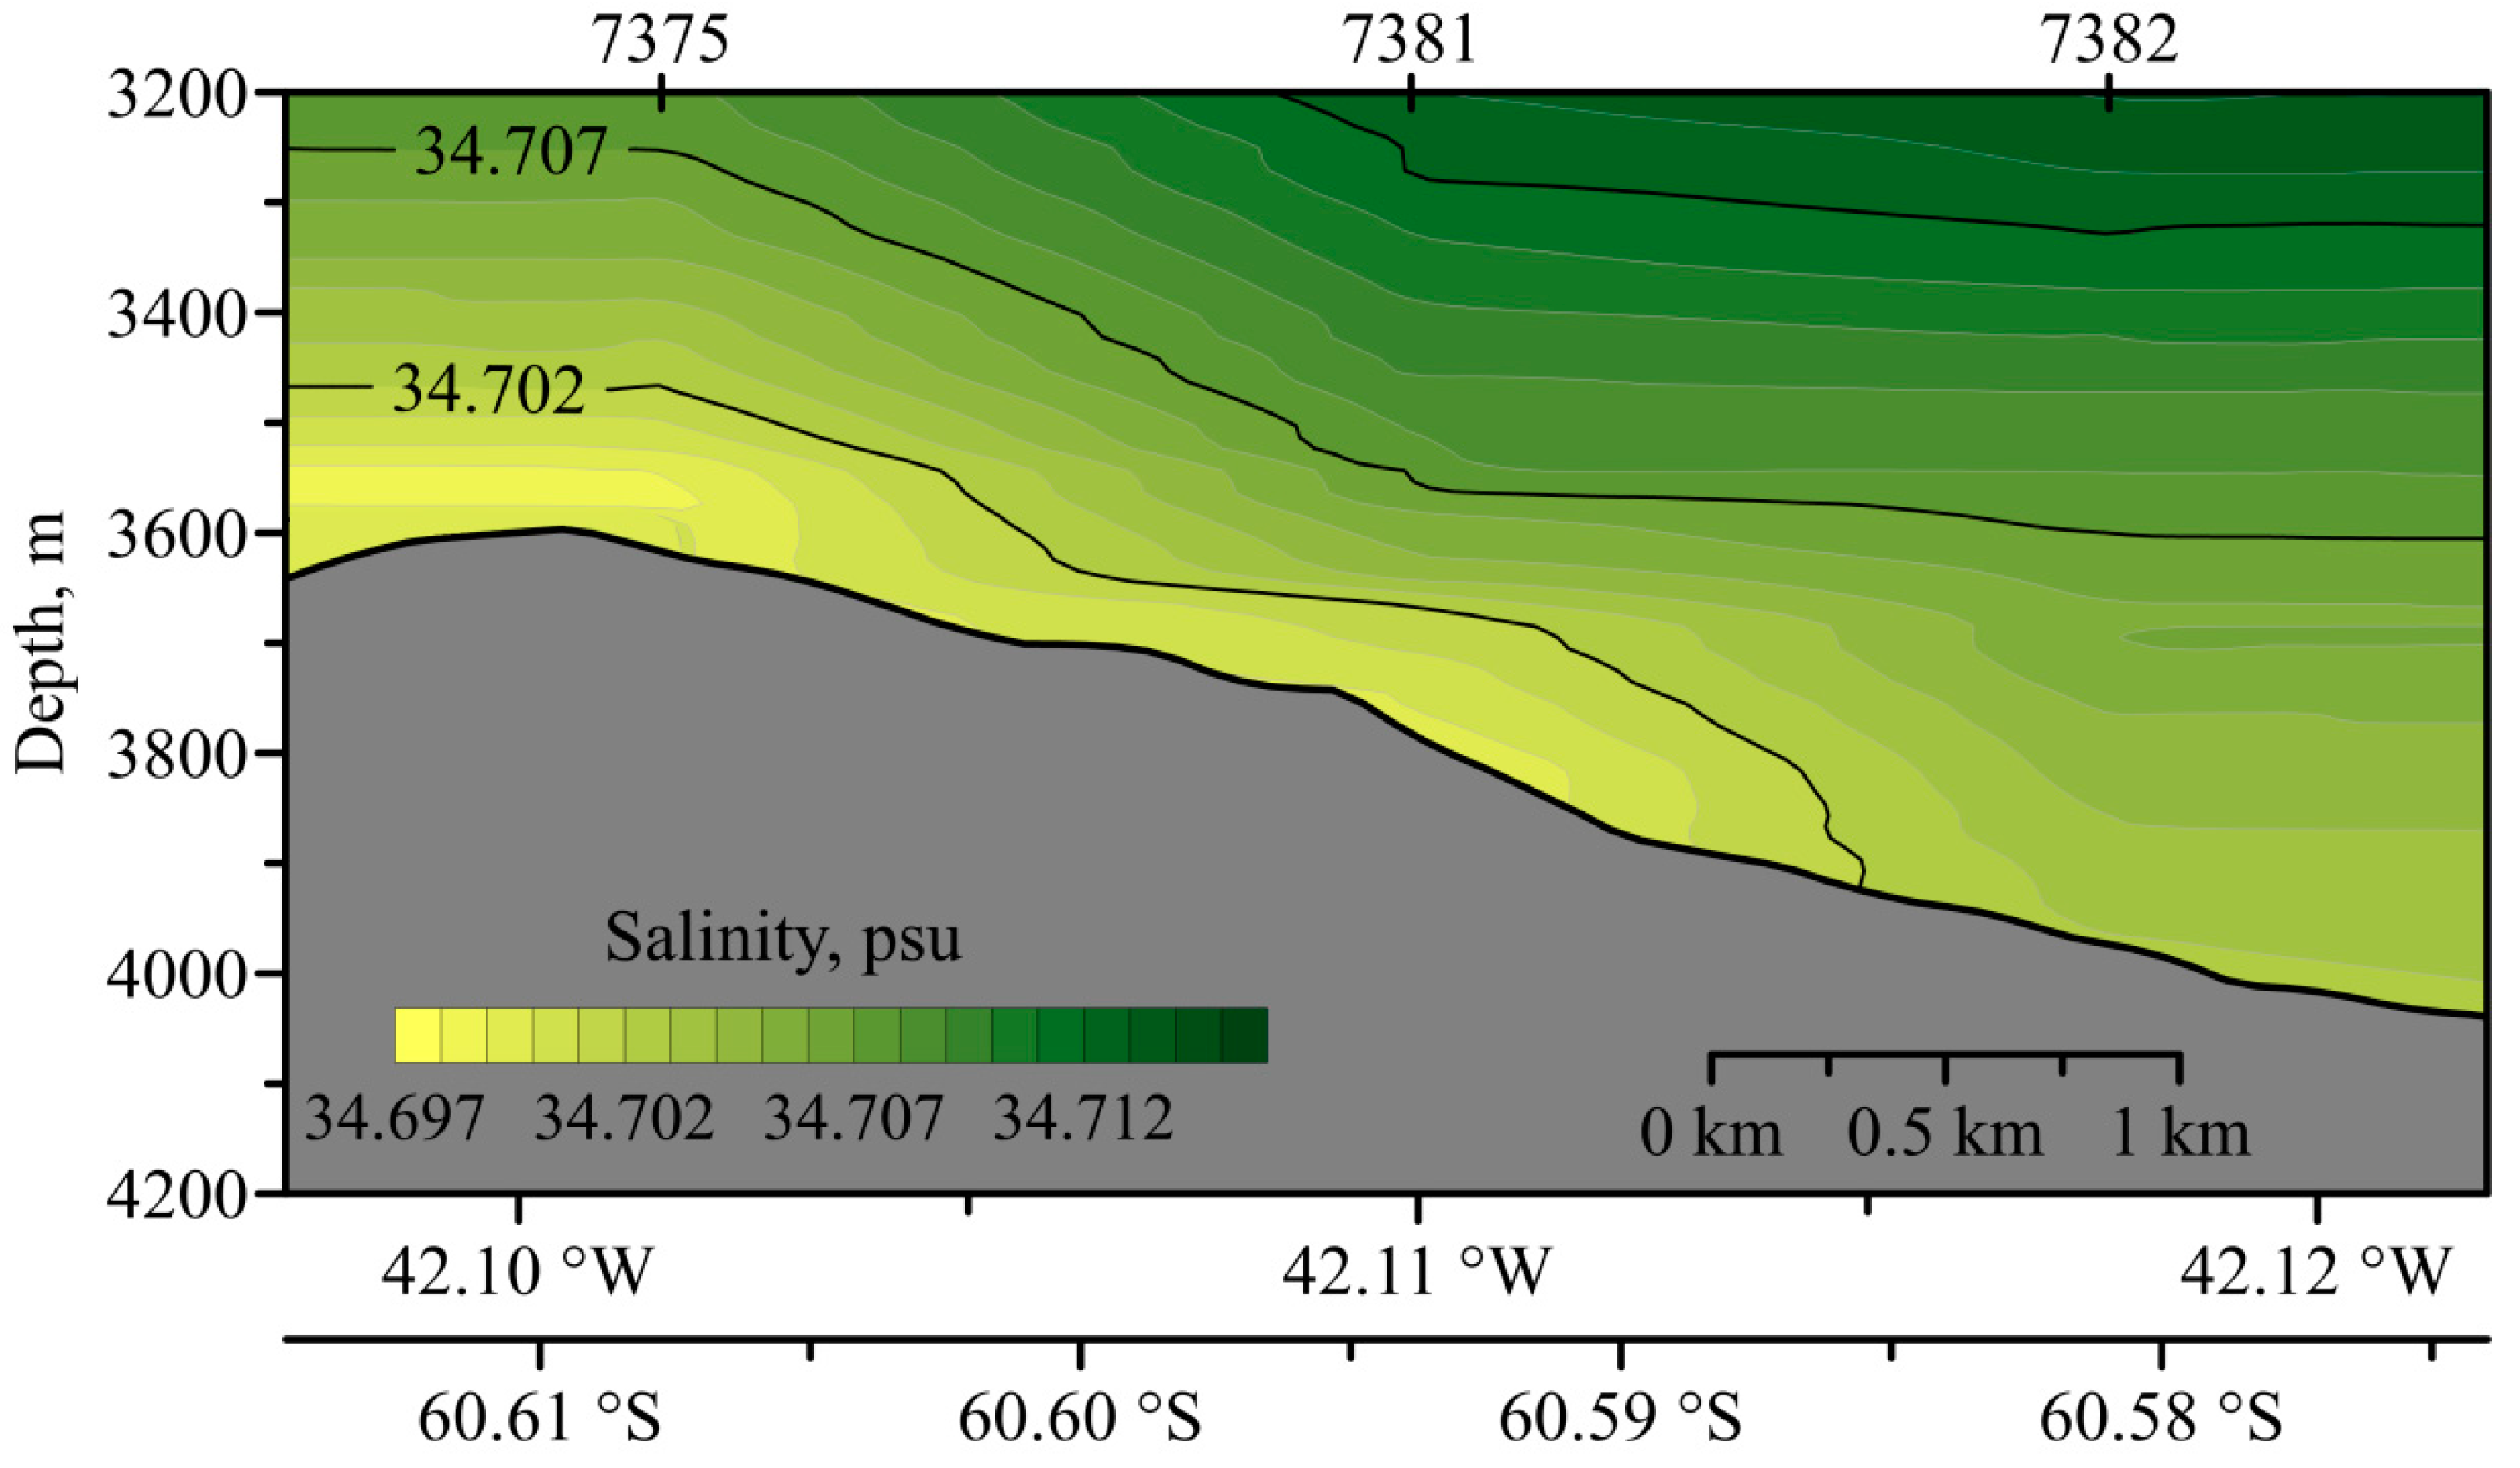
Let us now consider the downflow of bottom water after overflowing the ridge. Figure 7 shows the flow velocities down the slope. The flow accelerates due to the transition of potential energy on the crest of the ridge into kinetic energy. Due to the expansion of the passage, the flow becomes wider and after flowing down by more than 200 m at a distance of about 3500 m, the flow slows down, descending into the deep layers of the ocean and not having enough energy to continue the fast flow. The maximum flow velocities are close to 50 cm/s. The potential temperature behaves similarly, forming a tongue of cold water flowing down the slope (Figure 8). In the tongue of cold water, which rolls down the slope, the temperature gradually increases from −0.54 to −0.45 °C. Salinity distribution downslope in the direction of the descending flow is shown in Figure 9. Contour lines of salinity that show the further propagation of the flow downslope are more illustrative than the isotherms because bottom water is warming due to the contact with the overlying waters. The salinity increase is due only to mixing.
It was reported in [25] that hydraulically controlled flow over the sills is responsible for bottom mixing above the slope. A local overturning circulation cell is formed over the slope with increasing vertical velocity that mixes the bottom flow [25,26]. The flow regime changes as the velocity increases and the Froude number exceeds unity. The critical regime appears when the Froude number is Fr > 1. When the current overflows the sill of the Orkney Passage the Froude number is calculated as:
F r = v / g H
where v is the meridional component of velocity, g H is the velocity of gravity waves in the shallow flow, H = 100 m is the thickness of the flow, g = g Δ ρ / ρ is reduced acceleration due to gravity, ρ = 1 g/cm3 is the in situ density, g = 9.8 m s−1, and Δρ = 0.00013 g/cm3 in the overflowing current. The critical regime of overflowing appears when the bottom current exceeds v = 0.356 m s−1:
F r = 0.356 9.8 × 100 × 0.00013 1         1.0  

4. Conclusions

We studied the flow of Antarctic Bottom Water from the Weddell Sea to the Scotia Sea through the Orkney Passage. This passage is considered the main pathway for the outflow of Antarctic Bottom Water from the Weddell Sea; hence, it is the main source of Antarctic Bottom Water in the Atlantic. The transport of bottom water through this passage is 5 Sv based on reports in many publications. We made five CTD/LADCP casts to the bottom over the sill of the passage and three casts along the slope downstream. During the overflow of Antarctic Bottom Water from the Weddell Sea over the ridge in the Orkney Passage, a supercritical regime with a Froude number greater than unity was noted. The flow accelerates when descending the slope. Near the foot of the slope there is not enough kinetic energy of the flow to continue moving in this regime. The flow slows down; strong mixing and warming of the bottom water occur due to the exchange with the surrounding waters. This mode is called hydraulically controlled flow.

Author Contributions

E.G.M., D.I.F., M.G.V.: Conceptualization, original draft preparation, writing; V.A.K., O.A.Z.: original draft preparation; R.Z.M.: data procerssing. All authors have read and agreed to the published version of the manuscript.

Funding

The work was supported by the Russian Science Foundation grant 21-77-20004 (ship measurements). Field data processing was supported by the Russian Foundation for Basic Research grant no 20-08-00246.

Institutional Review Board Statement

Not applicable.

Informed Consent Statement

No studies involving humans were performed. Birds and mammals were observed using binoculars and photo cameras. No experiments with animals have been carried out.

Data Availability Statement

Data are available upon request.

Conflicts of Interest

The authors declare no conflict of interest.

Abbreviations

AABWAntarctic bottom water
WSDWWeddell Sea deep water
LADCPLowered acoustic Doppler current profiler
CTDConductivity, temperature, and depth profiler
FrFroude number
vMeridional component of velocity
g = g Δ ρ / ρ Reduced acceleration due to gravity
HThickness of the flow
ρ = 1 g/cm3In situ density
g = 9.8 m s−1Acceleration due to gravity
ΔρDensity difference between layers

References

  1. Vernet, M.; Geibert, W.; Hoppema, M.; Brown, P.J.; Haas, C.; Hellmer, H.H.; Jokat, W.; Jullion, L.; Mazloff, M.; Bakker, D.C.E.; et al. The Weddell Gyre, Southern Ocean: Present Knowledge and Future Challenges. Rev. Geophys. 2019, 57, 623–708. [Google Scholar] [CrossRef] [Green Version]
  2. Abrahamsen, E.P.; Meijers, A.J.S.; Polzin, K.L.; Garabato, A.C.N.; King, B.; Firing, Y.L.; Sallée, J.-B.; Sheen, K.L.; Gordon, A.L.; Huber, B.A.; et al. Stabilization of dense Antarctic water supply to the Atlantic Ocean overturning circulation. Nat. Clim. Chang. 2019, 9, 742–746. [Google Scholar] [CrossRef]
  3. Meredith, M.P.; Gordon, A.L.; Garabato, A.C.N.; Abrahamsen, E.P.; Huber, B.A.; Jullion, L.; Venables, H.J. Synchronous intensification and warming of Antarctic Bottom Water outflow from the Weddell Gyre. Geophys. Res. Lett. 2011, 38, L03603. [Google Scholar] [CrossRef] [Green Version]
  4. Sloyan, B.; Rintoul, S. The Southern Ocean Limb of the Global Deep Overturning Circulation*. J. Phys. Oceanogr. 2001, 31, 143–173. [Google Scholar] [CrossRef]
  5. Orsi, A.H.; Johnson, G.C.; Bullister, J.L. Circulation, mixing and production of Antarctic Bottom Water. Prog. Oceanogr. 1999, 43, 55–109. [Google Scholar] [CrossRef]
  6. Garabato, A.C.N.; McDonagh, E.L.; Stevens, D.P.; Heywood, K.J.; Sanders, R.J. On the export of Antarctic Bottom Water from the Weddell Sea. Deep Sea Res. Part II: Top. Stud. Oceanogr. 2002, 49, 4715–4742. [Google Scholar] [CrossRef]
  7. Gordon, A.L.; Visbeck, M.; Huber, B. Export of Weddell Sea deep and bottom water. J. Geophys. Res. Earth Surf. 2001, 106, 9005–9017. [Google Scholar] [CrossRef]
  8. Meredith, M.P.; Locarnini, R.A.; Van Scoy, K.A.; Watson, A.; Heywood, K.; King, B.A. On the sources of Weddell Gyre Antarctic Bottom Water. J. Geophys. Res. Earth Surf. 2000, 105, 1093–1104. [Google Scholar] [CrossRef] [Green Version]
  9. Schodlok, M.P.; Hellmer, H.H.; Beckmann, A. On the transport, variability and origin of dense water masses crossing the South Scotia Ridge. Deep Sea Res. Part II: Top. Stud. Oceanogr. 2002, 49, 4807–4825. [Google Scholar] [CrossRef] [Green Version]
  10. Pratt, L.J.; Lundberg, P.A. Hydraulics of rotating strait and sill flow. Annu. Rev. Fluid Mech. 1991, 23, 81–106. [Google Scholar] [CrossRef]
  11. Pratt, L.J.; Whitehead, J.A. Rotating Hydraulics: Nonlinear Topographic Effects in the Ocean and Atmosphere; Springer: New York, NY, USA, 2007; p. 550. [Google Scholar] [CrossRef]
  12. Whitehead, J.A.; Leetmaa, A.; Knox, R.A. Rotating hydraulics of strait and sill flows. Geophys. Fluid Dyn. 1974, 6, 101–125. [Google Scholar] [CrossRef]
  13. Fratantoni, D.M.; Zantopp, W.E.; Johns, E.; Miller, J.L. Updated bathymetry of the Anegada-Jungfern passage complex and implications for Atlantic inflow to the abyssal Caribbean Sea. J. Mar. Res. 1997, 55, 847–860. [Google Scholar] [CrossRef]
  14. Armi, L.; Farmer, D.M. The flow of Mediterranean water through the Strait of Gibraltar. Prog. Oceanogr. 1988, 21, 1–105. [Google Scholar]
  15. Cenedese, C.; Whitehead, J.A.; Ascarelli, T.A.; Ohiwa, M. A Dense Current Flowing down a Sloping Bottom in a Rotating Fluid. J. Phys. Oceanogr. 2004, 34, 188–203. [Google Scholar] [CrossRef]
  16. Cenedese, C.; Adduce, C. A New Parameterization for Entrainment in Overflows. J. Phys. Oceanogr. 2010, 40, 1835–1850. [Google Scholar] [CrossRef] [Green Version]
  17. Morozov, E.G.; Frey, D.I.; Gladyshev, S.V.; Gladyshev, V.S. Hydrodynamics of the Bottom-Water Flow from the Arctic to the Atlantic through the Strait of Denmark. Izv. Atmospheric Ocean. Phys. 2020, 56, 479–487. [Google Scholar] [CrossRef]
  18. Fer, I.; Voet, G.; Seim, K.S.; Rudels, B.; Latarius, K. Intense mixing of the Faroe Bank Channel overflow. Geophys. Res. Lett. 2010, 37, L026042. [Google Scholar] [CrossRef]
  19. Morozov, E.G.; Parrilla-Barrera, G.; Velarde, M.G.; Scherbinin, A.D. The Straits of Gibraltar and Kara Gates: A Comparison of internal tides. Oceanol. Acta 2003, 26, 231–241. [Google Scholar] [CrossRef] [Green Version]
  20. Morozov, E.; Trulsen, K.; Velarde, M.G.; Vlasenko, V.I. Internal Tides in the Strait of Gibraltar. J. Phys. Oceanogr. 2002, 32, 3193–3206. [Google Scholar] [CrossRef]
  21. Morozov, E.G.; Paka, V.T.; Bakhanov, V.V. Strong internal tides in the Kara Gates Strait. Geophys. Res. Lett. 2008, 35, L16603. [Google Scholar] [CrossRef]
  22. Vlasenko, V.I. Nonlinear model for the generation of baroclinic tides over extensive inhomogeneities of bottom topography. Phys. Oceanogr. 1992, 3, 417–424. [Google Scholar]
  23. Visbeck, M. Deep Velocity Profiling Using Lowered Acoustic Doppler Current Profilers: Bottom Track and Inverse Solutions*. J. Atmospheric Ocean. Technol. 2002, 19, 794–807. [Google Scholar] [CrossRef]
  24. Morozov, E.G.; Tarakanov, R.Y.; Frey, D.I. Bottom Gravity Currents and Overflows in Deep Channels of the Atlantic. Observations, Analysis, and Modeling; Springer Nature: Berlin/Heidelberg, Germany, 2021; 483p. [Google Scholar]
  25. Thurnherr, A.M.; Speer, K.G. Boundary Mixing and Topographic Blocking on the Mid-Atlantic Ridge in the South Atlantic*. J. Phys. Oceanogr. 2003, 33, 848–862. [Google Scholar] [CrossRef]
  26. Thurnherr, A.M.; Clément, L.; Laurent, L.S.; Ferrari, R.; Ijichi, T. Transformation and Upwelling of Bottom Water in Fracture Zone Valleys. J. Phys. Oceanogr. 2020, 50, 715–726. [Google Scholar] [CrossRef] [Green Version]
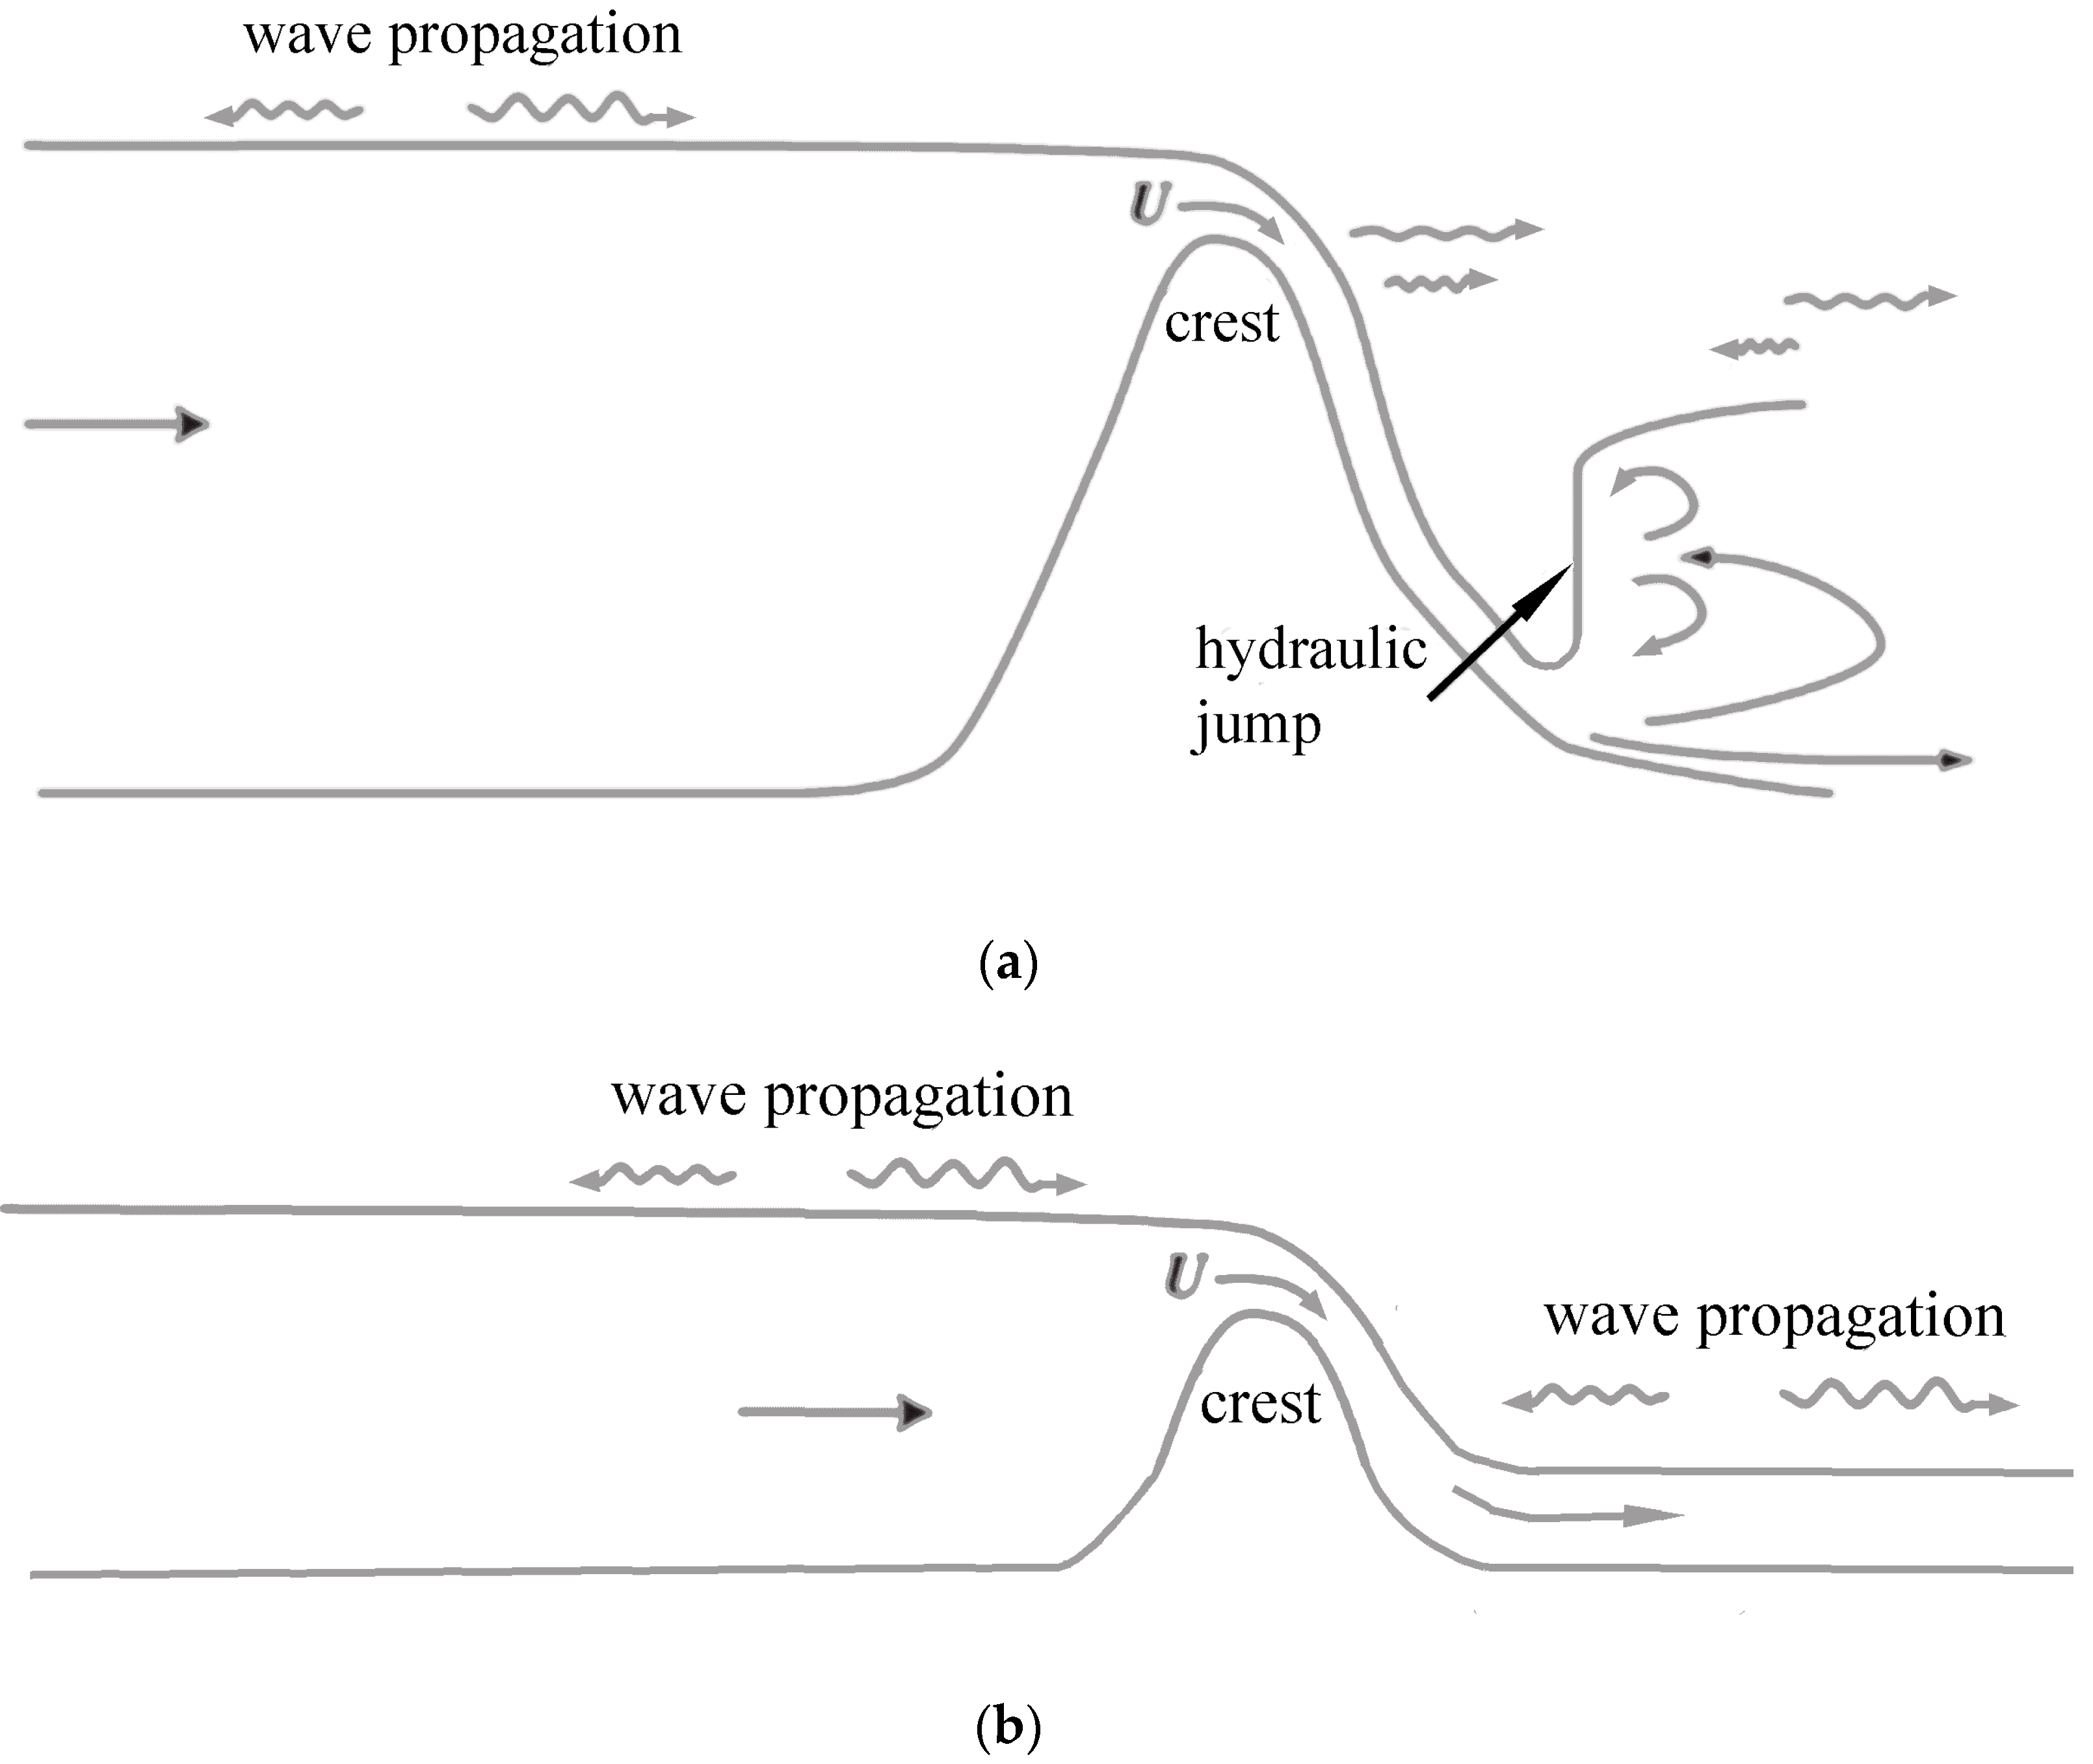
Figure 1. (a). Scheme of hydraulic control. Modified from [11]. (b). Scheme of laminar current overflowing an obstacle.
Water 14 03088 g001
Figure 2. Subcritical and supercritical regimes in the Niagara Falls.
Water 14 03088 g002
Figure 3. Field of isopycnals 23.5, 24.5, 25.5, and 26.5 perturbed by the flow in the Kara Gates Strait and internal waves based on numerical calculations using the model in [21,22]. The black color shows the bottom topography as specified in the model (a). Distribution of temperature over the towed section (b). Isotherms are shown with an interval of 1 °C. Thicker lines show isotherms of 1 and 0 °C to emphasize the observed effect. The black color shows the bottom profile. Location of the region on a larger scale is shown in the inset.
Water 14 03088 g003
Figure 4. CTD/LADCP casts in the Orkney Passage in different years. Red stars indicate our stations in 2022. A chart of the region is shown in the inset. Black symbols indicate previous stations of CTD-casts in different years.
Water 14 03088 g004
Figure 5. Section of potential temperature across the Orkney Passage.
Water 14 03088 g005
Figure 6. Longitudinal velocity component (normal to the section) across the Orkney Passage.
Water 14 03088 g006
Figure 7. Longitudinal velocity (through flow) section downslope the Orkney Passage. Contour line of 0.356 m/s is additionally shown.
Water 14 03088 g007
Figure 8. Potential temperature distribution over the downslope section of the Orkney Passage.
Water 14 03088 g008
Figure 9. Salinity distribution over the downslope section of the Orkney Passage.
Water 14 03088 g009
Publisher’s Note: MDPI stays neutral with regard to jurisdictional claims in published maps and institutional affiliations.