

Statistical Analysis for Water Quality Assessment: A Case Study of Al Wasit Nature Reserve


Abstract
:1. Introduction
2. Literature Review
2.1. Importance of Wetlands
2.2. Water Quality of Wetlands and Statistical Analysis Techniques
3. Materials and Methods
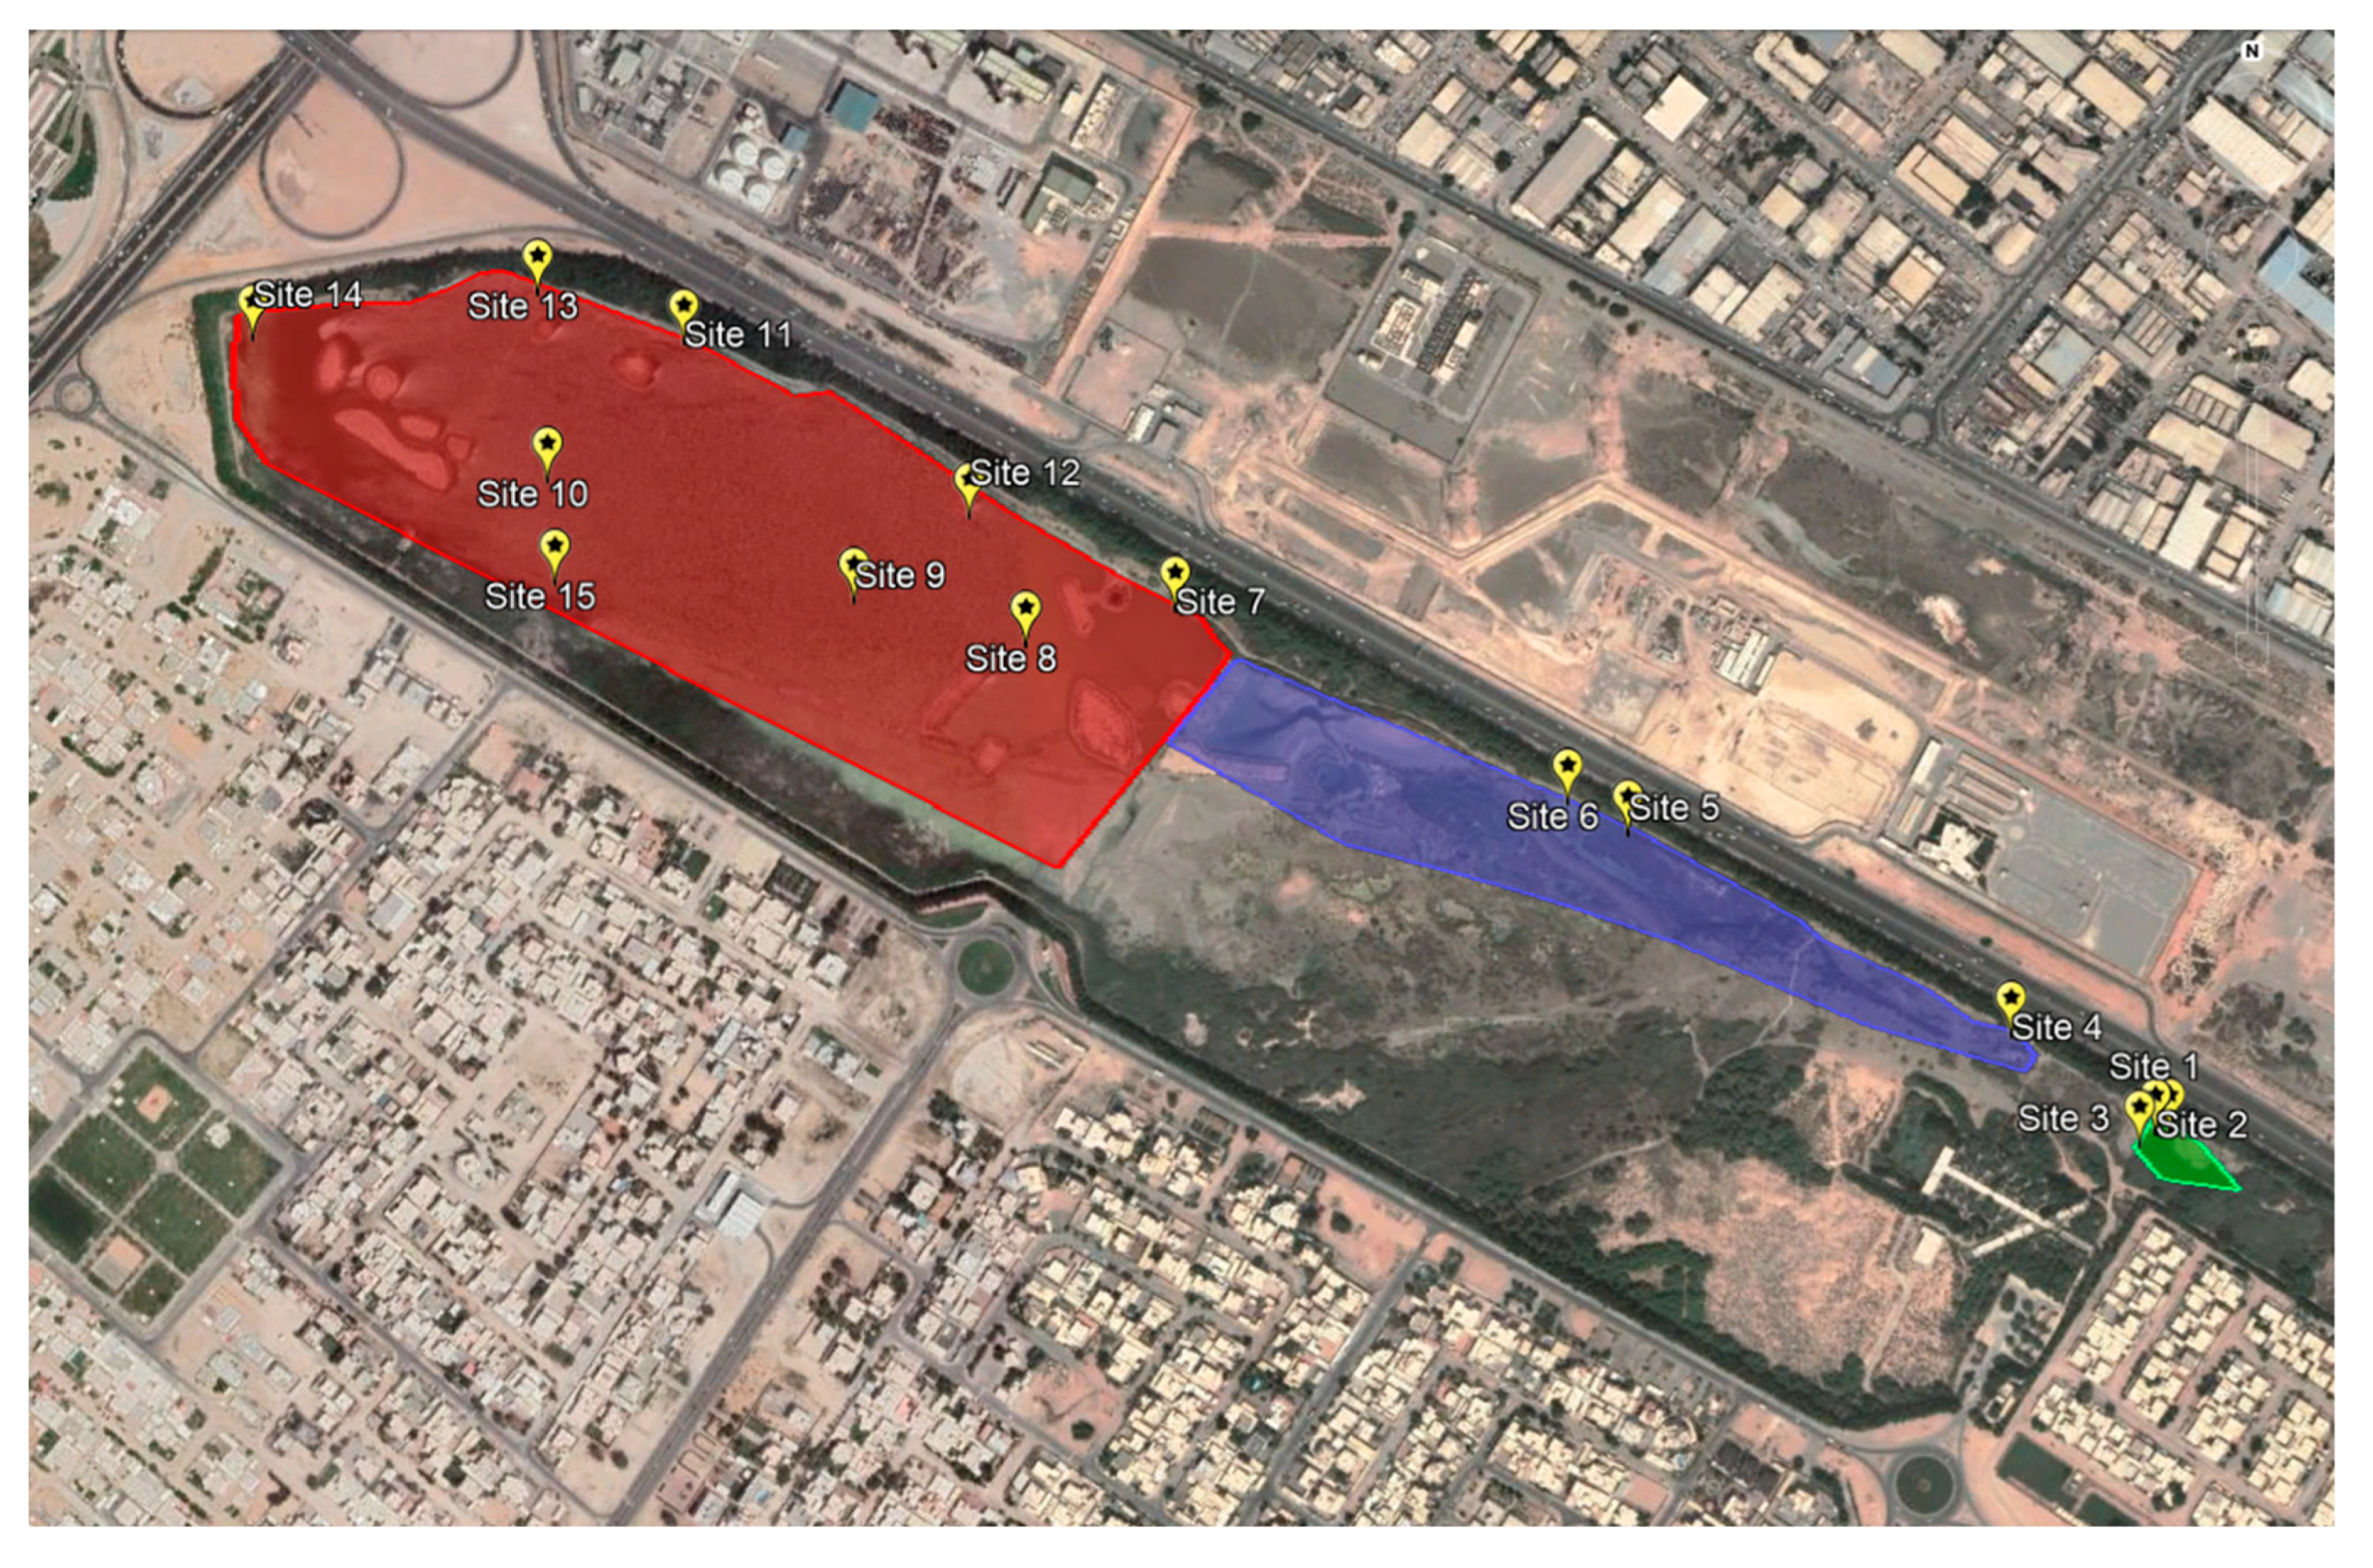
3.1. Study Area
3.2. Sampling and Water Quality Assessments
3.3. Statistical Analysis
4. Results
4.1. Pearson Correlation Analysis
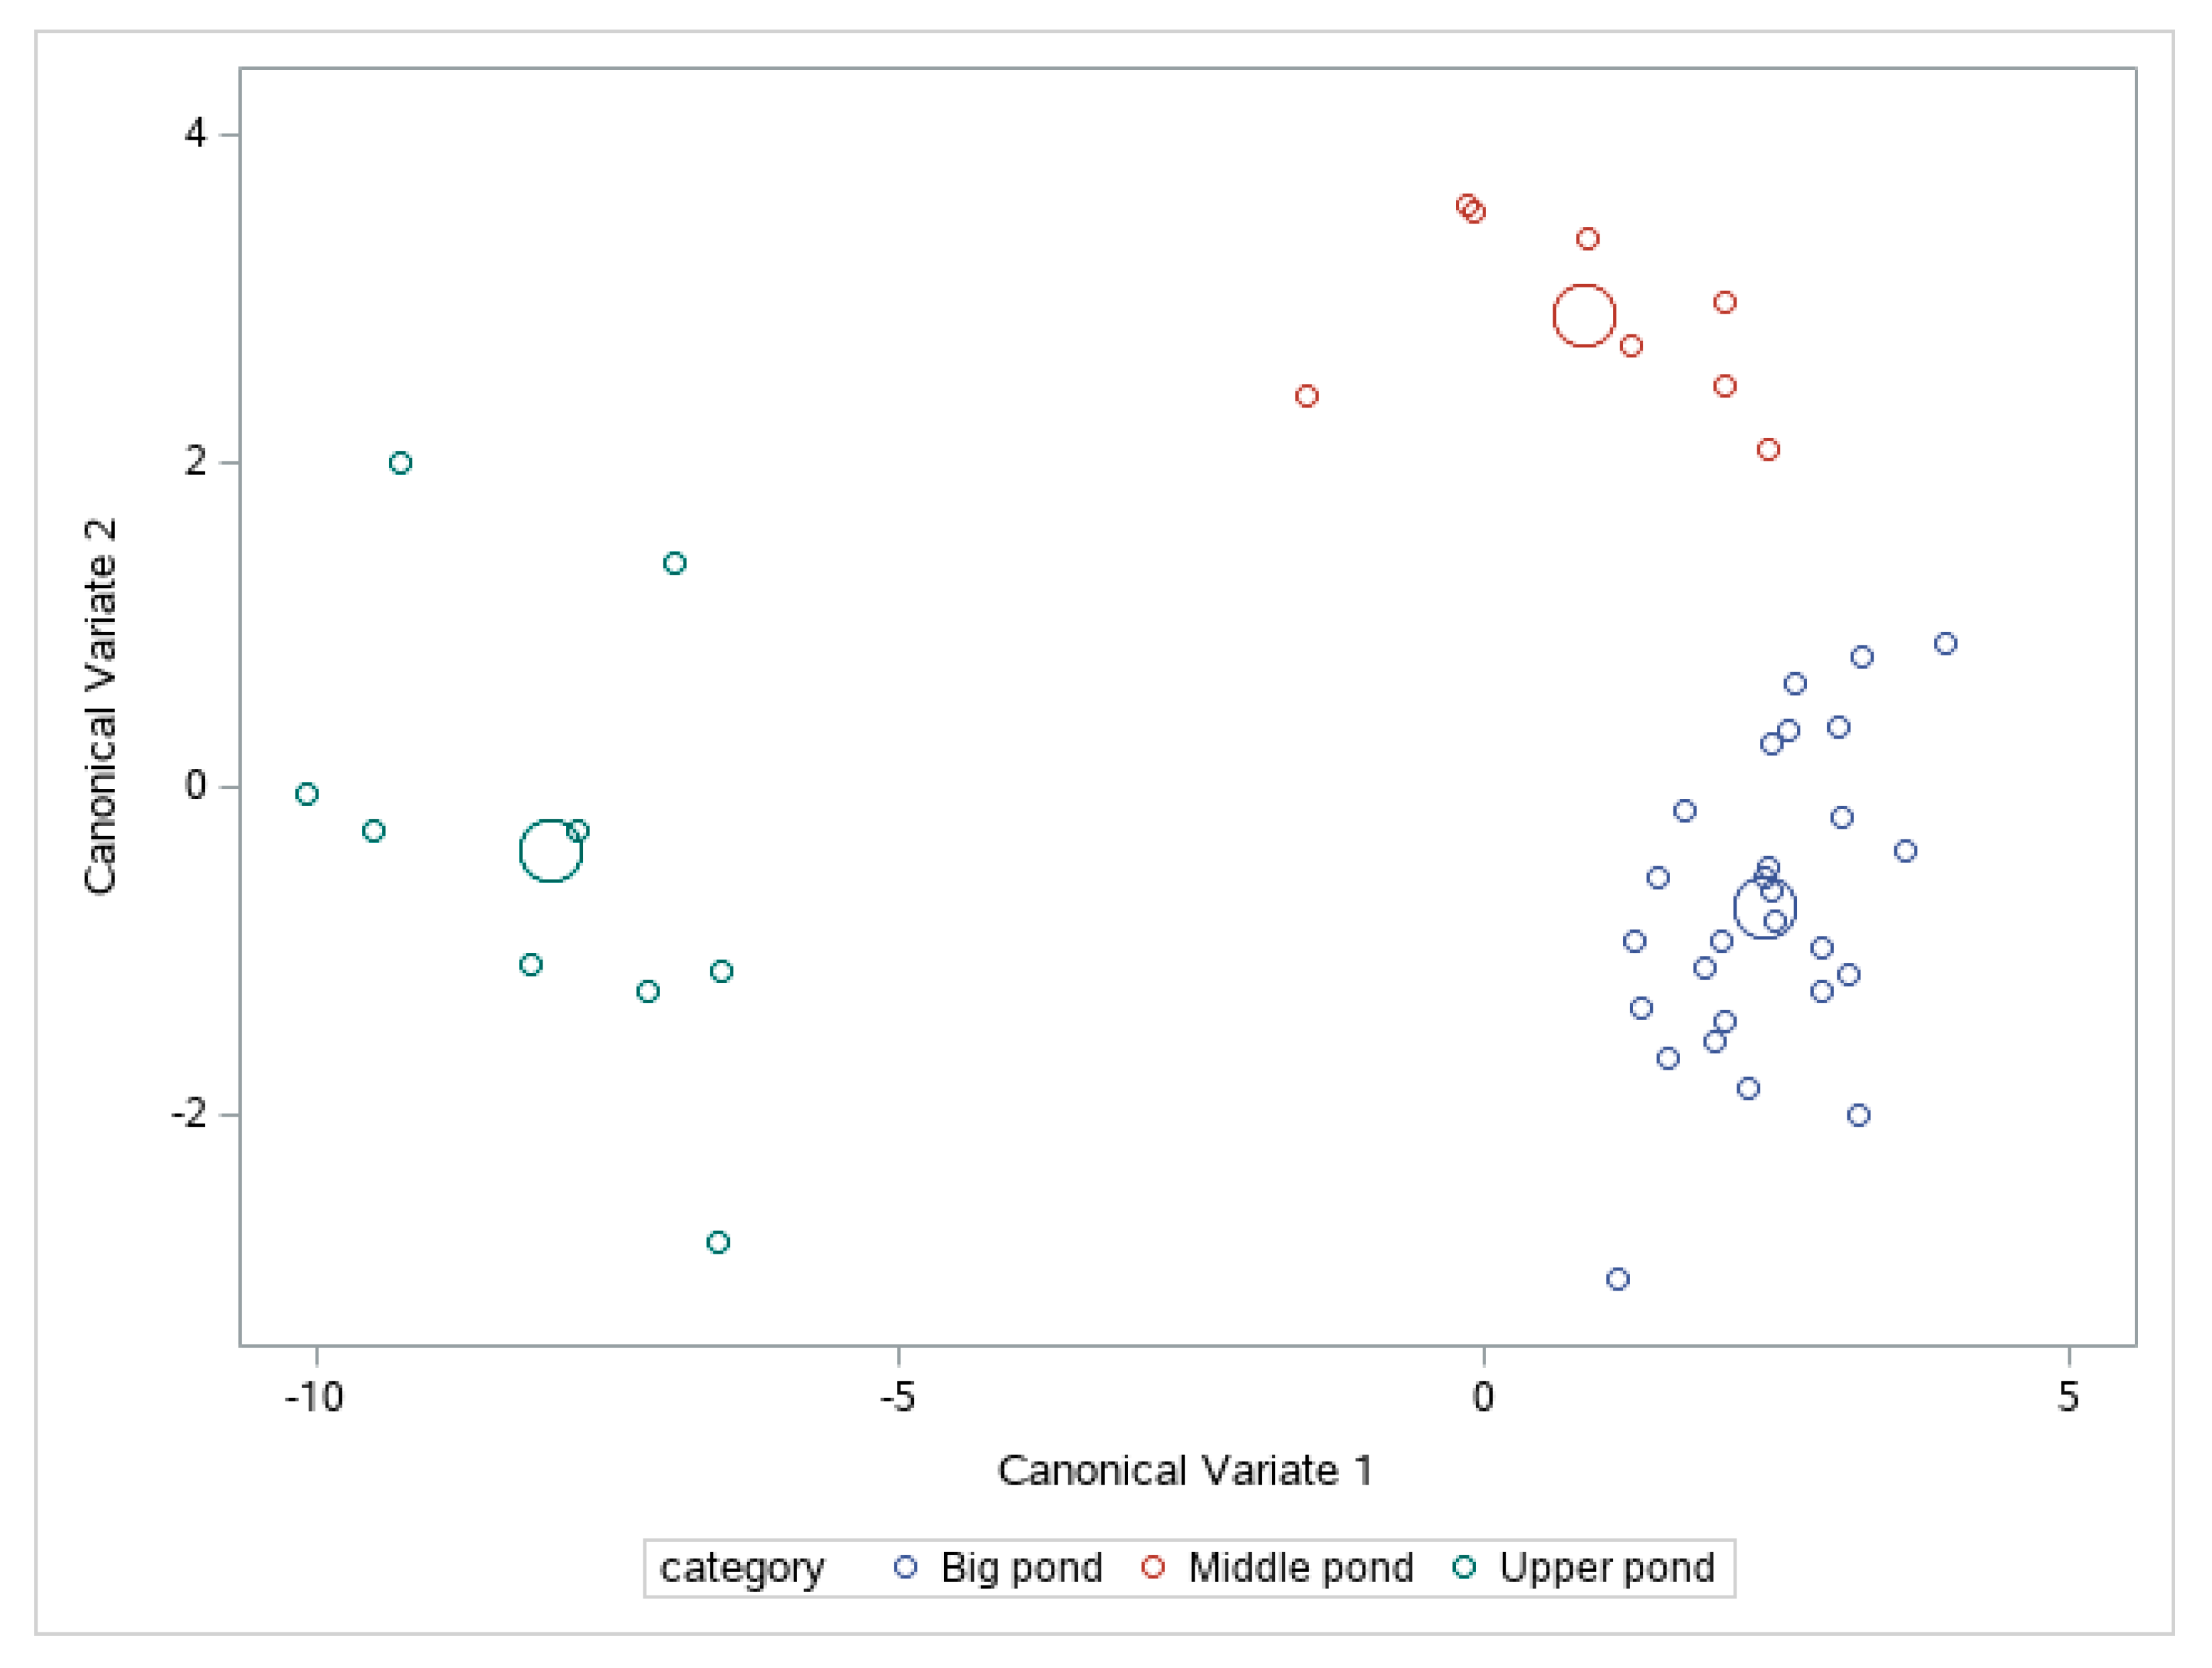
4.2. Multivariate Statistical Analysis
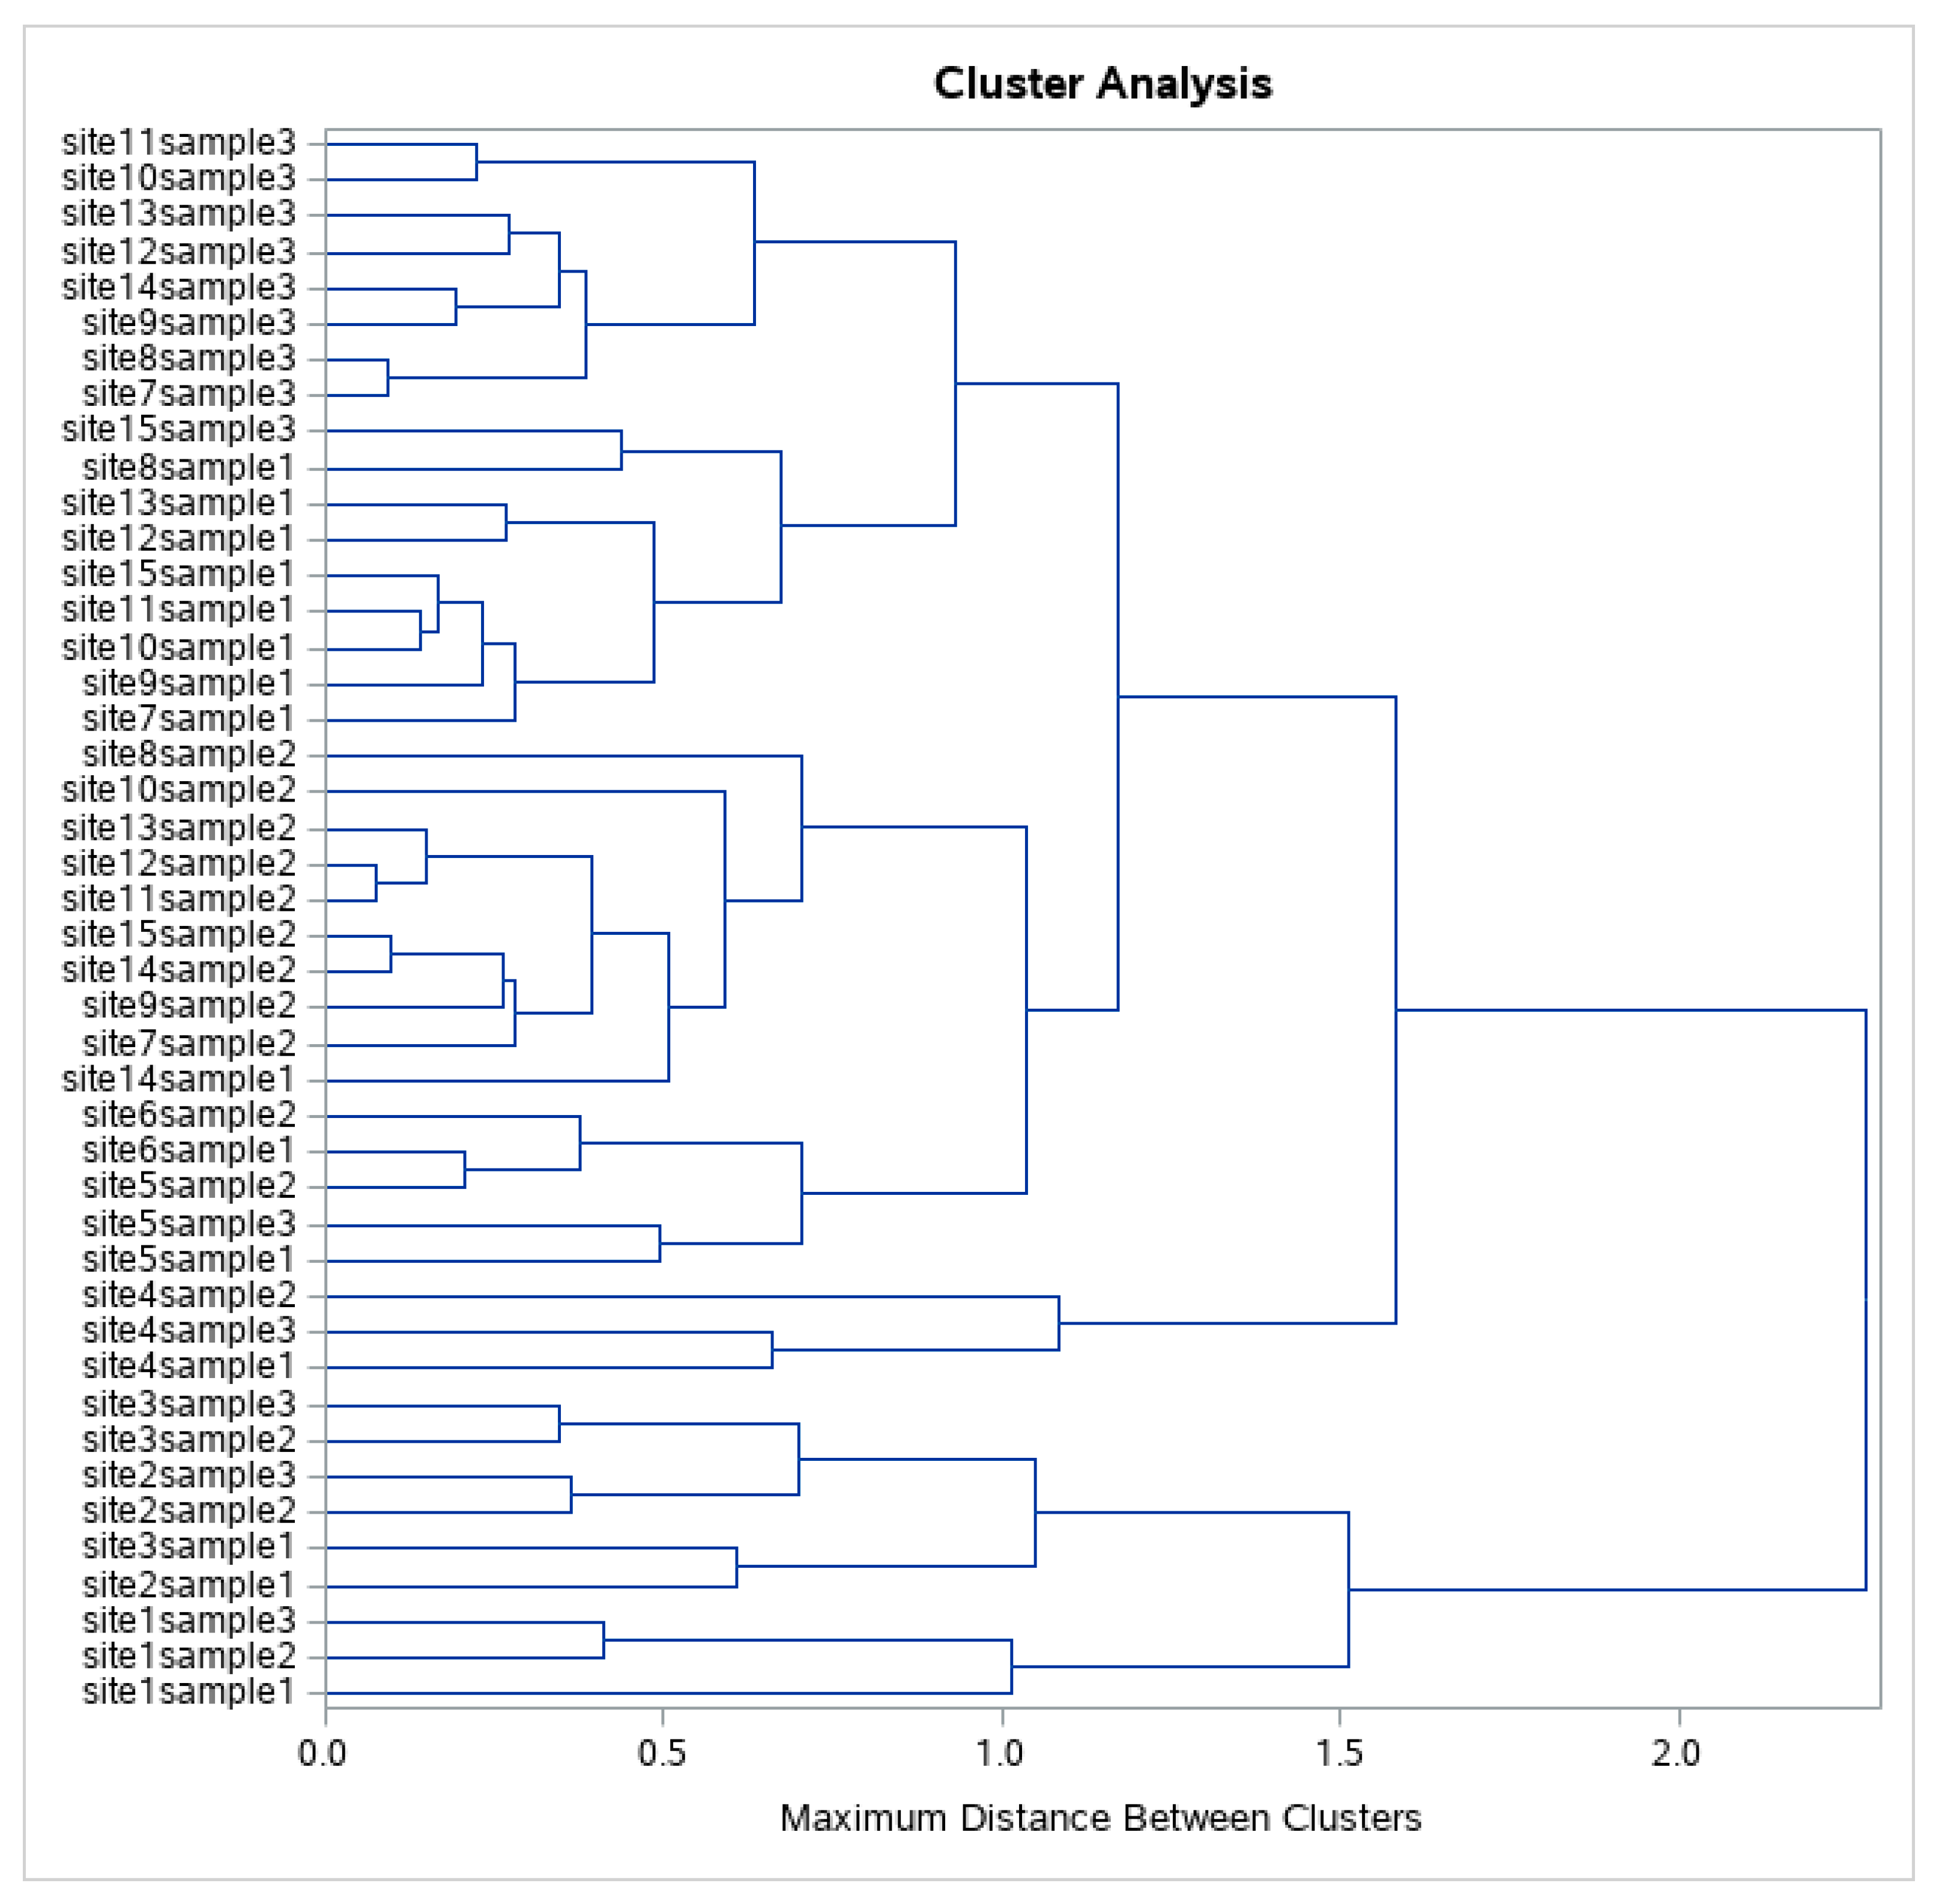
4.3. Cluster Segmentation
4.4. Univariate Statistical Tests
5. Discussion
6. Conclusions
Author Contributions
Funding
Institutional Review Board Statement
Informed Consent Statement
Acknowledgments
Conflicts of Interest
References
- About the Convention on Wetlands. Available online: https://www.ramsar.org/about-the-convention-on-wetlands-0 (accessed on 4 April 2022).
- Wetlands and Agriculture: Private Interests and Public Benefit. Economic Research Service. Available online: https://www.ers.usda.gov/webdocs/publications/40845 (accessed on 4 April 2022).
- Barot, C.; Patel, V. Comparative Study of Seasonal Variation in Physicochemical Properties of Selected Wetlands of Mehsana Districts, North Gujarat. Indian J. Appl. Res. 2021, 4, 44–47. [Google Scholar] [CrossRef]
- Wilcox, D.; Nichols, S. The effects of water-level fluctuations on vegetation in a Lake Huron wetland. Wetlands 2008, 28, 487–501. [Google Scholar] [CrossRef]
- Dorche, E.E.; Fathi, P.; Ofogh, A.E. Wetland water quality assessment in cold and dry regions (Case study: Choghakhor wetland, Iran). Limnol. Rev. 2019, 19, 57–75. [Google Scholar] [CrossRef] [Green Version]
- Davidson, N.C.; Fluet-Chouinard, E.; Finlayson, C.M. Global extent and distribution of wetlands: Trends and issues. Mar. Freshw. Res. 2018, 69, 620–627. [Google Scholar] [CrossRef] [Green Version]
- Jaramillo, F.; Desormeaux, A.; Hedlund, J.; Jawitz, J.W.; Clerici, N.; Piemontese, L.; Rodríguez-Rodriguez, J.A.; Anaya, J.A.; Blanco-Libreros, J.F.; Borja, S.; et al. Priorities and interactions of sustainable development goals (SDGs) with focus on wetlands. Water 2019, 11, 619. [Google Scholar] [CrossRef] [Green Version]
- Evers, S.; Yule, C.M.; Padfield, R.; O’Reilly, P.; Varkkey, H. Keep wetlands wet: The myth of sustainable development of tropical peatlands–implications for policies and management. Glob. Change Biol. 2017, 23, 534–549. [Google Scholar] [CrossRef]
- Darrah, S.E.; Shennan-Farpón, Y.; Loh, J.; Davidson, N.C.; Finlayson, C.N.; Gardner, R.C.; Walpole, M.J. Improvements to the Wetland Extent Trends (WET) index as a tool for monitoring natural and human-made wetlands. Ecol. Indic. 2019, 99, 294–298. [Google Scholar] [CrossRef]
- Convention, R. Global Wetland Outlook. Available online: https://static1.squarespace.com/static/5b256c78e17ba335ea89fe1f/t/61b8a904f3ceb458e9b5ca44/1639491853578/Ramsar+GWO_Special+Edition+2021%E2%80%93ENGLISH_WEB.pdf (accessed on 4 April 2022).
- United Arab Emiirates Ministry of Climate Change & Environment. Biodiversity. Available online: https://www.moccae.gov.ae/en/knowledge-and-statistics/biodiversity.aspx (accessed on 27 March 2022).
- United Arab Emirates Ministry of environment & Water. National Biodiversity Strategy. Available online: https://www.moccae.gov.ae/assets/download/d962a50/National%20Biodiversity%20Strategy%202014-2021.pdf.aspx?view=true (accessed on 2 April 2022).
- UAE Ministry of Climate Change & Environment. UAE National Red List of Birds. Available online: https://www.moccae.gov.ae/assets/download/1ac96bd6/UAE%20National%20Red%20List%20Birds%20Policy%20Brief.pdf.aspx?view=true (accessed on 27 March 2022).
- Authority. Wasite Nature Reserve. Available online: https://epaashj.ae/protected-areas/wasit-nature-reserve/ (accessed on 27 March 2022).
- Samara, F.; Ali, T.; Twyford, J.; Knuteson, S. Investigation of Fecal Contamination of Groundwater and Surface Water at Al Wasit Nature Reserve, Sharjah, United Arab Emirates . Asian J. Microbiol. Biotechnol. Environ. Sci. 2016, 18, 35–45. [Google Scholar]
- Fathi, P.; Dorcheh, E.E.; Mirghaffari, N.; Esmaeili, A.R. Water quality assessment in Choghakhor Wetland using water quality index (WQI). Iran. J. Fish. Sci. 2007, 15, 508–523. [Google Scholar]
- Shrestha, S.; Kazama, F. Assessment of surface water quality using multivariate statistical techniques: A case study of the Fuji river basin, Japan. Environ. Model. Softw. 2022, 22, 464–475. [Google Scholar] [CrossRef]
- Boyacioglu, H.; Boyacioglu, H. Water pollution sources assessment by multivariate statistical methods in the Tahtali Basin, Turkey. Environ. Geol. 2008, 54, 275–282. [Google Scholar] [CrossRef]
- Chen, P.-Y.; Lee, P.-F.; Ko, J.C.-J.; Ko, C.-H.; Chou, T.-C.; Teng, C.-J. Associations Between Water Quality Parameters and Planktonic Communities in Three Constructed Wetlands, Taipei. Wetlands 2011, 31, 1–8. [Google Scholar] [CrossRef]
- Apollaro, C.; Curzio, D.D.; Fuoco, I.; Buccianti, A.; Dinelli, E.; Vespasiano, G.; Castrignanò, A.; Rusi, S.; Barca, D.; Figoli, A.; et al. A multivariate non-parametric approach for estimating probability of exceeding the local natural background level of arsenic in the aquifers of Calabria region (Southern Italy). Sci. Total Environ. 2022, 806, 150345. [Google Scholar] [CrossRef] [PubMed]
- Fuoco, I.; de Rosa, R.; Barca, D.; Figoli, A.; Gabriele, B.; Apollaro, C. Arsenic polluted waters: Application of geochemical modelling as a tool to understand the release and fate of the pollutant in crystalline aquifers. J. Environ. Manag. 2022, 301, 113796. [Google Scholar] [CrossRef]
- Brix, H. Do macrophytes play a role in constructed treatment wetlands? Water Sci. Technol. 1997, 35, 11–17. [Google Scholar] [CrossRef]
- Johari, N.; Chang, C.K.; Ghani, A.A.; Abwahid, M.; Abdul-Talib, S. Performance of Constructed Wetland on Stormwater Quality Control. In Proceedings of the 2016 APD IAHR Congress, Colombo, Sri Lanka, 29–30 August 2016. [Google Scholar]
- Gibbons, J.W.; Scott, D.E.; Ryan, T.J.; Buhlmann, K.A.; Tuberville, T.D.; Metts, B.S.; Greene, J.L.; Mills, T.; Leiden, Y.; Poppy, S.; et al. The global decline of reptiles, Déjà Vu Amphibians: Reptile species are declining on a global scale. Six significant threats to reptile populations are habitat loss and degradation, introduced invasive species, environmental pollution, disease, unsustainable use, and global climate change. Bioscience 2000, 50, 653–666. [Google Scholar]
- Jenkins, D.G.; Grissom, S.; Miller, K. Consequences of prairie wetland drainage for crustacean biodiversity and metapopulations. Conserv. Biol. 2003, 17, 158–167. [Google Scholar] [CrossRef]
- Zedler, J.; Kercher, S. Wetland Resources: Status, Trends, Ecosystem Services, and Restorability. Annu. Rev. Environ. Resour 2005, 15, 39–74. [Google Scholar] [CrossRef] [Green Version]
- United Nations. SDG Goals. Available online: https://www.un.org/site-search/?query=SDG+GOALS (accessed on 4 April 2022).
- Juffe-Bignoli, D.; Harrison, I.; Butchart, S.H.M.; Flitcroft, R.; Hermoso, V.; Jonas, H.; Lukasiewicz, A.; Thieme, M.; Turak, E.; Bingham, H.; et al. Achieving Aichi Biodiversity Target 11 to improve the performance of protected areas and conserve freshwater biodiversity: Elements needed to meet a global target for protected areas. Aquat. Conserv. Mar. Freshw. Ecosyst. 2016, 26, 133–151. [Google Scholar] [CrossRef]
- UNEP/CBD. Conference of The Parties to The Convention on Biological Diversity. Available online: https://www.cbd.int/doc/decisions/cop-10/cop-10-dec-02-en.pdf (accessed on 4 April 2022).
- United Nations. UN Convention to Combat Desertification. Available online: https://www.unwomen.org/en/how-we-work/intergovernmental-support/climate-change-and-the-environment/united-nations-convention-to-combat-desertification#:~:text=The%20United%20Nations%20Convention%20to,development%20to%20sustainable%20land%20management (accessed on 4 April 2022).
- United Nations. Paris Agreement. Available online: https://www.un.org/en/climatechange/paris-agreement (accessed on 4 April 2022).
- Collen, B.; Whitton, F.; Dyer, E.; Baillie, J.E.M.; Cumberlidge, N.; Darwall, W.; Pollock, C.; Dewhurst-Richman, N.; Soulsby, A.-M.; Böhm, M.; et al. Global patterns of freshwater species diversity, threat and endemism, (in eng). Glob. Ecol. Biogeogr. A J. Macroecology 2014, 23, 40–51. [Google Scholar] [CrossRef] [Green Version]
- Horwitz, P.; Finlayson, C.M.; Weinstein, P. Healthy Wetlands, Healthy People A Review of Wetlands and Human Health Interactions. In Secretariat of the Ramsar Convention on Wetlands; Ramsar Technical Report No. 6/World Health Organization Report; World Health Organization: Geneva, Switzerland, 2012. [Google Scholar]
- Russi, D.; Brink, P.T.; Farmer, A.; Badura, T.; Coates, D.; Forster, J.; Kumar, R.; Davidson, N. The Economics of Ecosystems and Biodiversity for Water and Wetlands; IUCN: Gland, Switzerland, 2013.
- Sato, T.; Qadir, M.; Yamamoto, S.; Endo, T.; Zahoor, A. Global, regional, and country level need for data on wastewater generation, treatment, and use. Agric. Water Manag. 2013, 130, 1–13. [Google Scholar] [CrossRef]
- United Nations. UN World Water Development Report 2012. Available online: https://www.unwater.org/publications/managing-water-uncertainty-risk/ (accessed on 5 April 2022).
- United Nations. UN World Water Development Report 2017. Available online: https://www.unwater.org/publications/world-water-development-report-2017/ (accessed on 5 April 2022).
- Jones, J.I.; Murphy, J.F.; Collins, A.L.; Sear, D.A.; Naden, P.S.; Armitage, P.D. The Impact of Fine Sediment on Macro-Invertebrates. River Res. Appl. 2022, 28, 1055–1071. [Google Scholar] [CrossRef]
- Kemp, P.; Sear, D.; Collins, A.; Naden, P.; Jones, I. The Impacts of fine sediment on riverine fish. Hydrol. Process. 2022, 25, 1800–1821. [Google Scholar] [CrossRef]
- UN Environment Programme. The Snapshot Report of the World’s Water Quality. Available online: https://www.unep.org/resources/publication/snapshot-report-worlds-water-quality (accessed on 5 April 2022).
- Development. OECD Environmental Outlook to 2050: The Consequences of Inaction-Key Facts and Figures. Available online: https://www.oecd.org/env/indicators-modelling-outlooks/oecdenvironmentaloutlookto2050theconsequencesofinaction-keyfactsandfigures.htm (accessed on 5 April 2022).
- OECD. Drying Wells, Rising Stakes. Available online: https://www.oecd.org/publications/drying-wells-rising-stakes-9789264238701-en.htm (accessed on 5 April 2022).
- Bennett, S.J.; Barrett-Lennard, E.G.; Colmer, T.D. Salinity and waterlogging as constraints to saltland pasture production: A review. Agric. Ecosyst. Environ. 2009, 129, 349–360. [Google Scholar] [CrossRef]
- Saccò, M.; White, N.E.; Harrod, C.; Salazar, G.; Aguilar, P.; Cubillos, C.F.; Meredith, K.; Baxter, B.K.; Oren, A.; Anufriieva, E.; et al. Salt to conserve: A review on the ecology and preservation of hypersaline ecosystems. Biol. Rev. 2021, 96, 2828–2850. [Google Scholar] [CrossRef]
- Zadereev, E.; Lipka, O.; Karimov, B.; Krylenko, M.; Elias, V.; Pinto, I.S.; Alizade, V.; Anker, Y.; Feest, A.; Kuznetsova, D.; et al. Overview of past, current, and future ecosystem and biodiversity trends of inland saline lakes of Europe and Central Asia. Inland Waters 2020, 10, 438–452. [Google Scholar] [CrossRef]
- Delaney, J.; Shiel, R.J.; Storey, A.W. Prioritising wetlands subject to secondary salinisation for ongoing management using aquatic invertebrate assemblages: A case study from the Wheatbelt Region of Western Australia. Wetl. Ecol. Manag. 2016, 24, 15–32. [Google Scholar] [CrossRef] [Green Version]
- Chuang, I.; Yang, H.-H.; Lin, H.-J. Effects of a thermal discharge from a nuclear power plant on phytoplankton and periphyton in subtropical coastal waters. J. Sea Res. 2012, 61, 197–205. [Google Scholar] [CrossRef]
- Gazzaz, D.N. Characterization of Spatial Patterns in River Water Quality Using Chemometric Pattern Recognition Techniques. Mar. Pollut. Bull. 2012, 64, 688–698. [Google Scholar] [CrossRef]
- Mohammadpour, R.; Shaharuddin, S.; Chang, C.K.; Zakaria, N.; Ghani, A.A. Spatial pattern analysis for water quality in free-surface constructed wetland. Water Sci. Technol. A J. Int. Assoc. Water Pollut. Res. 2014, 70, 1161–1167. [Google Scholar] [CrossRef]
- Service, R.S.I. Wasit Nature Reserve. Available online: https://rsis.ramsar.org/ris/2386 (accessed on 2 April 2022).
- ENH Group. In Sharjah, score one for nature! Focus. Available online: http://enhg.org/ (accessed on 2 April 2022).
- MOCCAE. Guiding Standards for Marine Water Properties in the United Arab Emirates. Available online: https://www.moccae.gov.ae/assets/download/d6b99426/brand_%D8%A7%D9%84%D9%85%D8%B9%D8%A7%D9%8A%D9%8A%D8%B1%20%D8%A7%D9%84%D8%A7%D8%B3%D8%AA%D8%B1%D8%B4%D8%A7%D8%AF%D9%8A%D8%A9%20%D9%84%D8%AE%D9%88%D8%A7%D8%B5%20%D8%A7%D9%84%D9%85%D9%8A%D8%A7%D9%87%20%D8%A7%D9%84%D8%A8%D8%AD%D8%B1%D9%8A%D8%A9_En[2].pdf.aspx#:~:text=The%20guiding%20standards%20list%20includes,nutrients%2C%20microbial%20bacteria%20and%20hydrocarbons (accessed on 31 August 2020).
- Taher, M.M.; Mohamed, A.R.M.; Al-Ali, A.K.H. Some Ecological Characteristics and Ichthyofauna of Surrounding Sammaliah Island, Abu Dhabi, UAE. Basrah J. Sci. 2012, 30, 31–49. [Google Scholar]
- Ustaoğlu, F.; Tepe, Y. Water quality and sediment contamination assessment of Pazarsuyu Stream, Turkey using multivariate statistical methods and pollution indicators. Int. Soil Water Conserv. Res. 2019, 7, 47–56. [Google Scholar] [CrossRef]
- McKenna, J.E. An enhanced cluster analysis program with bootstrap significance testing for ecological community analysis. Environ. Model. Softw. 2003, 18, 205–220. [Google Scholar] [CrossRef]
- Huberty, C.J.; Olejnik, S. Applied Manova and Discriminant Analysis; John Wiley & Sons: Hoboken, NJ, USA, 2006. [Google Scholar]
- Lix, L.; Sajobi, T. Discriminant Analysis for Repeated Measures Data: A Review, (in English). Front. Psychol. 2010, 1, 146. [Google Scholar] [CrossRef]
- Dar, S.A.; Bhat, S.U.; Dar, S.A. Wetland Ecosystem Monitoring Through Water Quality Perspectives. In Handbook of Research on Monitoring and Evaluating the Ecological Health of Wetland; Rathoure, A.K., Ed.; IGI Global: Hershey, PA, USA, 2022; pp. 51–70. [Google Scholar]
- Dar, S.A.; Rashid, I.; Bhat, S.U. Land system transformations govern the trophic status of an urban wetland ecosystem: Perspectives from remote sensing and water quality analysis. Land Degrad. Dev. 2021, 32, 4087–4104. [Google Scholar] [CrossRef]
- Banerjee, T.; Kumar, V.; Sarkar, D.J.; Devi, M.; Behera, B.; Das, B. Pollution assessment and mapping of potentially toxic elements (PTE) distribution in urban wastewater fed natural wetland, Kolkata, India. Environ. Sci. Pollut. Res. 2022, 29, 67801–67820. [Google Scholar] [CrossRef]
- Mabwoga, S.; Chawla, A.; Thukral, A. Assessment of Water Quality Parameters of the Harike Wetland in India, a Ramsar Site, Using IRS LISS IV Satellite Data. Environ. Monit. Assess. 2018, 170, 117–128. [Google Scholar] [CrossRef]
- Hasab, H.; Jawad, H.; Dibs, H.; Hussain, H.; Hussain, M.; Al-Ansari, N. Evaluation of Water Quality Parameters in Marshes Zone Southern of Iraq Based on Remote Sensing and GIS Techniques. Water Air Soil Pollut. 2020, 231, 183. [Google Scholar] [CrossRef] [Green Version]
- Tepe, Y.; Temel, F.A. Treatment of effluents from fish and shrimp aquaculture in constructed wetlands. In Constructed Wetlands for Industrial Wastewater Treatment; John Wiley & Sons Ltd.: Hoboken, NJ, USA, 2018; pp. 105–125. [Google Scholar] [CrossRef]


| Parameter Name | Representation | Unit of Measurement | Guiding Standards |
|---|---|---|---|
| Electrical conductivity | EC | µS/cm | >50,000 ** |
| Dissolved oxygen | DO | mg/L | >5 * |
| Oxidation-Reduction Potential | ORP | mv | - |
| Potential Hydrogen | pH | - | 6.0–9.0 * |
| Turbidity | turb | FNU (Formazin Nephelometric Units) | <75 * |
| Temperature | Temp | °C | 19–35 * |
| Chemical oxygen demand | COD | mg/L | <40 * |
| Chloride | Cl | mg/L | 26,000 *** |
| Ammonia | NH3 | mg/L | <0.06 * |
| Nitrate | NO3 | mg/L | <50 * |
| Temp | pH | ORP | EC | DO | Turb | NH3 | NO3 | Cl | COD | |
|---|---|---|---|---|---|---|---|---|---|---|
| Temp | ||||||||||
| pH | −0.313 * | |||||||||
| ORP | −0.084 | −0.507 * | ||||||||
| EC | 0.259 | −0.580 * | 0.528 * | |||||||
| DO | −0.015 | 0.527 * | −0.367 * | −0.414 * | ||||||
| Turb | 0.137 | −0.402 * | 0.458 * | 0.598 * | −0.324 * | |||||
| NH3 | −0.023 | 0.398 * | −0.243 | −0.598 * | 0.369 * | −0.541 * | ||||
| NO3 | −0.198 | 0.439 * | 0.025 | 0.320 * | 0.179 | 0.291 | −0.247 | |||
| Cl | 0.305 * | −0.421 * | 0.512 * | 0.860 * | −0.529 * | 0.565 * | −0.534 * | 0.300 * | ||
| COD | 0.175 | −0.404 * | 0.333 * | 0.805 * | −0.192 | 0.375 * | −0.472 * | 0.387 * | 0.649 * |
| Monitoring Ponds | %Correct | Pond Assigned by DA | ||
|---|---|---|---|---|
| Upper Pond | Middle Pond | Big Pond | ||
| Training model | ||||
| Upper pond | 100% | 9 | 0 | 0 |
| Middle pond | 100% | 0 | 8 | 0 |
| Big pond | 100% | 0 | 0 | 27 |
| Total | 100% | 9 | 8 | 27 |
| Cross-validated model | ||||
| Upper pond | 100% | 9 | 0 | 0 |
| Middle pond | 87.5% | 0 | 7 | 1 |
| Big pond | 100 | 0 | 0 | 27 |
| Total | 95.83% | 9 | 7 | 28 |
| Parameters | Upper Ponds | Middle Ponds | Big Ponds | Min | Mean | Max |
|---|---|---|---|---|---|---|
| Temperature (°C) | 26.75 ± 1.48 | 30.01 ± 0.86 | 27.44 ±0.97 | 24.61 | 27.76 | 30.81 |
| pH | 8.45 ± 0.12 | 8.19 ± 0.12 | 8.16 ± 0.11 | 8.00 | 8.22 | 8.60 |
| ORP (mv) | 41.12 ± 30.31 | 50.57 ± 4.92 | 80.34 ± 7.72 | −20.67 | 66.91 | 95.17 |
| EC (µS/cm) | 27,606 ± 560 | 74,358 ± 36,806 | 86,379 ± 4220 | 26,960 | 72,172 | 134,700 |
| DO (mg/L) | 9.50 ± 1.88 | 8.03 ± 1.27 | 7.46 ± 1.05 | 5.90 | 7.98 | 11.59 |
| Turbidity (FNU) | 4.04 ± 2.62 | 14.21 ± 4.90 | 15.58 ± 4.13 | 1.00 | 12.97 | 19.83 |
| Ammonia (ppm) | 1.79 ± 1.48 | 0.40 ± 0.06 | 0.18 ± 0.08 | 0.04 | 0.55 | 4.71 |
| Nitrate (ppm) | 50.7 ± 16.6 | 54.3 ± 26.1 | 57.5 ± 16.0 | 30.6 | 55.5 | 106.0 |
| Chloride (ppm) | 12,642 ± 5728 | 33,788 ± 14721 | 36,043 ± 3731 | 8320 | 30,846 | 55,200 |
| COD (mg/L) | 122 ± 72 | 1297 ± 988 | 1523 ± 690 | 88 | 1195 | 2924 |
| Clusters | ||||
|---|---|---|---|---|
| Upper Ponds | Middle Ponds | Big Pond | ||
| Parameters | Temperature | 26.75 | 30.01 | 27.44 |
| pH | 8.45 | 8.19 | 8.16 | |
| ORP | 41.12 | 50.56 | 80.34 | |
| EC | 27606 | 7436 | 86379 | |
| DO | 9.50 | 8.03 | 7.46 | |
| Turbidity | 4.04 | 14.21 | 15.58 | |
| Ammonia | 1.79 | 0.40 | 0.18 | |
| Nitrate | 50.69 | 54.26 | 57.46 | |
| Chloride | 12642 | 33788 | 36043 | |
| COD | 123 | 1297 | 1523 | |
| Parameter | p-Value | Adjusted p-Value |
|---|---|---|
| Temperature | <0.0001 | <0.0009 |
| pH | <0.0001 | <0.0009 |
| ORP | <0.0001 | <0.0009 |
| EC | <0.0001 | <0.0009 |
| DO | 0.008 | 0.0720 |
| Turbidity | <0.0001 | <0.0009 |
| Ammonia | <0.0001 | <0.0009 |
| Nitrate | 0.1360 | 1.0000 |
| Chloride | <0.0001 | <0.0009 |
| COD | <0.0001 | <0.0009 |
| Parameter | Class Comparisons | Difference between Least-Squares Means LSMean(i)-LSMean(j) | Simultaneous 95% Confidence Limits for Difference | Adjusted p-Value | Significance | ||
|---|---|---|---|---|---|---|---|
| i | j | Lower Limit | Upper Limit | ||||
| Temperature | Big | Middle | −2.57 | −3.65 | −1.50 | <0.0001 | Yes |
| Big | Upper | 0.69 | −0.34 | 1.72 | 0.3050 | No | |
| Middle | Upper | 3.27 | 1.96 | 4.57 | <0.0001 | Yes | |
| pH | Big | Middle | −0.029 | −0.14 | 0.087 | 1.0000 | No |
| Big | Upper | −0.29 | −0.40 | −0.18 | <0.0001 | Yes | |
| Middle | Upper | −0.26 | −0.40 | −0.12 | 0.0001 | Yes | |
| ORP | Big | Middle | 29.78 | 14.83 | 44.72 | <0.0001 | Yes |
| Big | Upper | 39.22 | 24.93 | 53.51 | <0.0001 | Yes | |
| Middle | Upper | 9.44 | −8.60 | 27.48 | 0.5958 | No | |
| EC | Big | Middle | 12,021 | −3630 | 2767 | 0.1866 | No |
| Big | Upper | 58,774 | 43,808 | 73,740 | <0.0001 | Yes | |
| Middle | Upper | 46,752 | 27,859 | 65,646 | <0.0001 | Yes | |
| Turbidity | Big | Middle | 1.37 | −2.68 | 5.43 | 1.000 | No |
| Big | Upper | 11.54 | 7.66 | 15.42 | <0.0001 | Yes | |
| Middle | Upper | 10.17 | 5.27 | 15.07 | <0.0001 | Yes | |
| Ammonia | Big | Middle | −0.23 | −0.88 | 0.43 | 1.000 | No |
| Big | Upper | −1.61 | −2.24 | −0.98 | <0.0001 | Yes | |
| Middle | Upper | −1.38 | −2.18 | −0.59 | 0.0003 | Yes | |
| Chloride | Big | Middle | 2255 | −5006 | 9517 | 1.000 | No |
| Big | Upper | 23,401 | 16,457 | 30,344 | <0.0001 | Yes | |
| Middle | Upper | 21,145 | 12,379 | 29,911 | <0.0001 | Yes | |
| COD | Big | Middle | 226 | −462 | 914 | 1.0000 | No |
| Big | Upper | 1399 | 741 | 2058 | <0.0001 | Yes | |
| Middle | Upper | 1173 | 342 | 2005 | 0.0032 | Yes | |
Publisher’s Note: MDPI stays neutral with regard to jurisdictional claims in published maps and institutional affiliations. |
© 2022 by the authors. Licensee MDPI, Basel, Switzerland. This article is an open access article distributed under the terms and conditions of the Creative Commons Attribution (CC BY) license (https://creativecommons.org/licenses/by/4.0/).
Share and Cite
Mohammed, A.; Samara, F.; Alzaatreh, A.; Knuteson, S.L. Statistical Analysis for Water Quality Assessment: A Case Study of Al Wasit Nature Reserve. Water 2022, 14, 3121. https://doi.org/10.3390/w14193121
Mohammed A, Samara F, Alzaatreh A, Knuteson SL. Statistical Analysis for Water Quality Assessment: A Case Study of Al Wasit Nature Reserve. Water. 2022; 14(19):3121. https://doi.org/10.3390/w14193121
Chicago/Turabian StyleMohammed, Areej, Fatin Samara, Ayman Alzaatreh, and Sandra L. Knuteson. 2022. "Statistical Analysis for Water Quality Assessment: A Case Study of Al Wasit Nature Reserve" Water 14, no. 19: 3121. https://doi.org/10.3390/w14193121
APA StyleMohammed, A., Samara, F., Alzaatreh, A., & Knuteson, S. L. (2022). Statistical Analysis for Water Quality Assessment: A Case Study of Al Wasit Nature Reserve. Water, 14(19), 3121. https://doi.org/10.3390/w14193121