Article

Analysis of the Runoff Component Variation Mechanisms in the Cold Region of Northeastern China under Climate Change

1
State Key Laboratory of Simulation and Regulation of Water Cycle in River Basins, China Institute of Water Resources and Hydropower Research, Beijing 100038, China
2
Planning, Design and Administration Bureau of South-to-North Water Diversion Project, Ministry of Water Resources, Beijing 100038, China
3
China Three Gorges Corporation, Beijing 100038, China
4
The School of Environmental Science and Engineering, Suzhou University of Science and Technology, Suzhou 215009, China
*
Authors to whom correspondence should be addressed.
Water 2022, 14(19), 3170; https://doi.org/10.3390/w14193170
Submission received: 11 September 2022 / Revised: 26 September 2022 / Accepted: 5 October 2022 / Published: 8 October 2022
(This article belongs to the Special Issue China Water Forum 2022)

Abstract

:
Climate change alters hydrological processes in cold regions. However, the mechanisms of runoff component variation remain obscure. We implemented a WEP-N model to estimate monthly runoff in the Songhua River Basin (SRB) between 1956 and 2018. All flow simulations were accurate (NSE > 0.75 and RE < 5%). The annual runoff was attenuated in 1998, and the hydrological series (1956–2018) was divided into base and change periods in that year. Relative to the BS (base scenario), annual production flow reduction was −28.2% under climate change and water use. A multifactor attribution analysis showed that climate change and water use contributed 77.0% and 23.0% to annual runoff reduction, respectively. Decreases in annual surface and base flow explained 62.1% and 35.7% of annual production flow reduction, respectively. The base flow increased by 8.5% and 6.5% during the freezing and thawing periods, respectively. Relative to the BS, groundwater recharge increased by 9.2% and 4.1% during the freezing and thawing periods, respectively, under climate change conditions. Climate change was the dominant factor attenuating production flow. The change in production flow occurred mainly during the non-freeze-thaw period. The decrease in total production flow in the SRB was caused mainly by the decrease in the surface flow, where the reduction in base flow accounted for a relatively small proportion. Production flow attenuation aggravated water shortages. The utilization rate of groundwater resources is far below the internationally recognized alarm line. Therefore, attention should be directed towards certain areas of the SRB and other regions with minimal groundwater exploitation.

1. Introduction

Global climate change and human activity significantly affect the hydrological cycle in cold regions [1,2,3,4]. Trends in runoff and the factors that influence them regionally include runoff trends that are positive in certain cold areas. Runoff may be influenced by glacier melt in response to increasing temperature. This phenomenon occurs in the Upper Khovd River Basin of Central Asia [5,6]. Runoff may also be influenced by increasing precipitation. This process occurs in most of Russia and on the south slope of the Altai Mountains in Northwestern China [5,7]. Runoff may also be influenced by the increases in precipitation, glacial meltwater, and permanently frozen soil meltwater that occur with rising temperatures. These effects are observed in the Yangtze River source region, the Nagqu River Basin in the southern part of the Qinghai-Tibet Plateau, the north and south slopes of the Tianshan Mountains, and the north slope of Qilian Mountain in Northwestern China [4,5,8,9,10].
Runoff has been decreasing in response to climate change and human activity in the alpine mountains of Northern Eurasia, Central Asia, South Africa, South America, and elsewhere. Runoff has also decreased as a result of high water consumption in areas such as the inland rivers downstream of the Buqtyrma River Basin in Central Asia [11] and the midstream region of the Heihe River Basin in the arid inland river basins of Northwestern China [12]. Runoff into the rivers of cold regions has been decreasing in response to climate change. Some of these rivers were affected mainly by precipitation. They include the rivers of Mount Kilimanjaro in Tanzania, the tropical Andes of South America, and the south slope of the Altai Mountains. In these cases, the proportions of runoff recharge from glacial meltwater are small [5,13,14,15,16,17]. Certain rivers are affected mainly by temperature, such as those in the Northern Rocky Mountains, where flow attenuation may be caused by a reduction in snowpack accumulation at lower altitudes [18,19]. Certain rivers are affected by both temperature and precipitation, such as those in Northwestern China, the northern part of the Qinghai-Tibet Plateau, and the Songhua River Basin (SRB) in Northeastern China [4,5,20,21]. In regions with few glaciers and minimal rainfall, glacial meltwater decreases and evaporation increases with rising temperature. This phenomenon occurs in the headwater region of the Manas River, the north slopes of the Qilian and Kunlun Mountains, the south slope of the Tianshan Mountains in Northwestern China, and the source regions of the Yellow River Basin in the northern part of the Qinghai-Tibet Plateau [4,5,22,23].
Earlier studies [11,12] have investigated variations in runoff in response to climate change and water use in cold regions. Nevertheless, the mechanisms of runoff component variation are poorly understood. The present study used the Songhua River Basin (SRB) in Northeastern China as an example. We analyzed the mechanisms of runoff component variation during the annual freezing, thawing, and non-freeze-thaw periods of the year based on simulations of the soil freeze-thaw and water cycle processes.

2. Materials and Methods
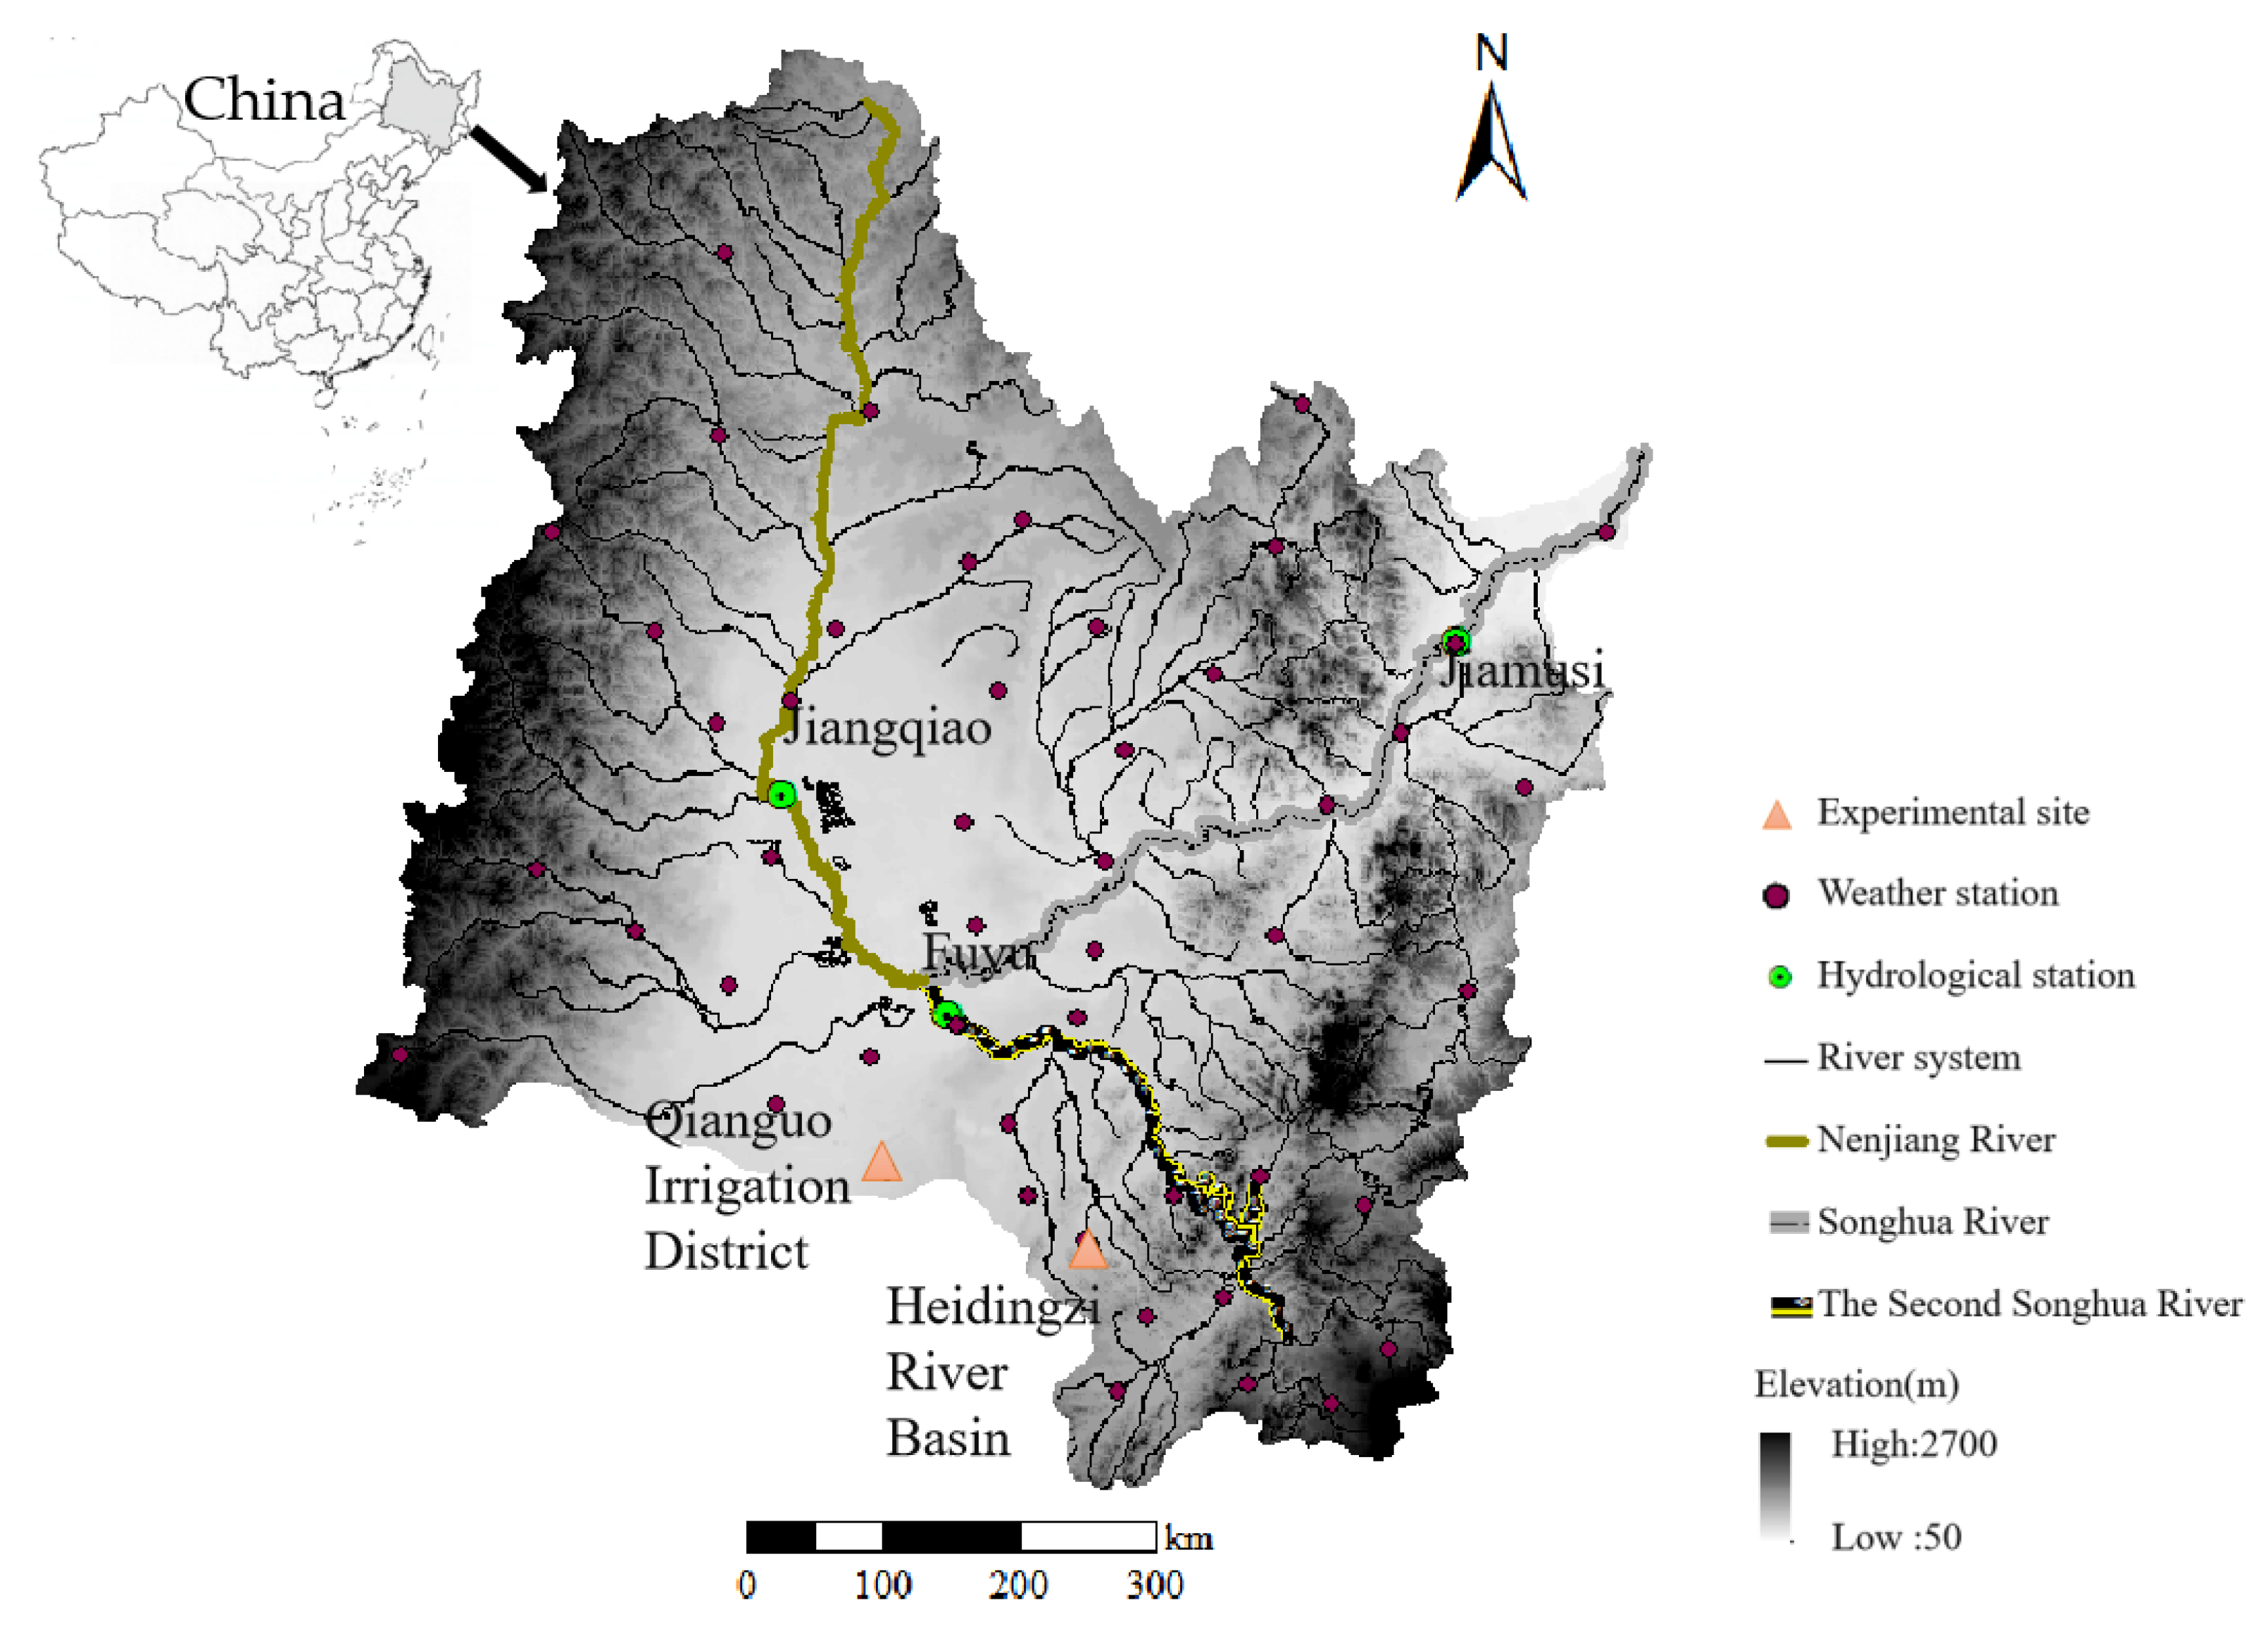
2.1. Study Area

The SRB is located in Northeastern China between 41°42′–51°38′ N and 119°52′–132°31′ E (Figure 1). Its elevation is in the range of ~50–2700 m. The SRB covers 557,000 km2 and spans Heilongjiang, Jilin, Liaoning, and Inner Mongolia Provinces. The Songhua River is the main tributary of Heilongjiang, and it has two sources to the north and the south. The Nenjiang River to the north originates from Yilehuli Mountain, which is a branch of the Daxing’an Mountains. The second source to the south originates from Tianchi Lake in Changbai Mountain. Precipitation dominates the hydroclimatologic regime of the area, and there is no glaciation. The SRB is characterized by seasonally frozen soil. The maximum freezing depth is >200 cm in the basin. The longest freezing period is from October to July of the following year [24]. The average annual precipitation, temperature, and runoff in the SRB were 533.18 mm, 2.95 °C, and 629.9 billion m3, respectively, between 1956 and 2018.

2.2. Data Collection

Several parameters could be directly measured for each basin. (a) The digital elevation method (DEM) was implemented at an accuracy of 30 m. (b) Daily precipitation, temperature, humidity, wind speed, and sunshine hours were compiled for 51 national meteorological stations in the Songhua River Basin. These meteorological data were released by the National Meteorological Information Center (2019). (c) Land use data for 1990, 2000, and 2005 were measured at 30-m resolution and provided by the Institute of Geography of the Chinese Academy of Sciences, Xinjiang, China. (d) Soils and their characteristic properties were derived from the Second National Soil Census (NSCO, 1979). (e) Water use data for 2000–2018 were acquired from the SRB Water Resources Bulletin (http://www.slwr.gov.cn/, (10 July 2022)). Water use data for 1956–1999 were extrapolated from the data for population (1956–2018), irrigated area (1956–2018), gross domestic product (GDP) (1956–2018), and water use (1980–2018). (f) Population, irrigated area, and GDP data for the SRB (1956–2018) were obtained from the Statistical Yearbooks of Heilongjiang, Jilin, Liaoning, and Inner Mongolia Provinces (http://tjj.hlj.gov.cn/tjsj, (10 July 2022), http://tjj.jl.gov.cn/tjsj/tjnj/, (10 July 2022), http://tjj.ln.gov.cn/tjsj/sjcx/ndsj, (10 July 2022), http://tj.nmg.gov.cn/tjyw/jpsj/, (10 July 2022)). (g) Groundwater resources data for 1980–2018 were acquired from the SRB Water Resources Bulletin (http://www.slwr.gov.cn/, (10 July 2022)).
The model was verified using measured flow data for the Jiangqiao, Fuyu (1956–2000, 2006–2018), and Jiamusi (1956–2018) Stations.

2.3. Research Method

The Mann–Kendall trend and Pettitt mutation analyses [25,26] were used to identifying the trends and detect abrupt changes in the measured runoff. The distributed dualistic water cycle model WEP-N was used to simulate the water cycle process in the SRB. WEP-N is driven by multiple factors. A multifactor attribution analysis [27] was used to determine water use and climate change contribution rates to runoff variation in the SRB.

2.3.1. Principles of the WEP-N Model Hydrological Cycle

The Water and Energy Transfer Processes and Nitrogen Cycle Processes Model in cold regions (WEP-N) [28] was developed based on the distributed hydrological model in cold regions known as WEP-COR, which couples simulations of natural hydrological and water use processes [24]. The model considered the influences of meteorology, underlying surfaces, and human activity on the water cycle process. The social water cycle simulation included water storage, intake, delivery, use, consumption, and drainage. Water intake and drainage connect the natural and social water cycles.
The model was calculated using the contour bands inside sub-watersheds. Each contour band was divided according to the land use of the underlying surface, namely, water body, impervious area, soil vegetation, irrigated farmland, or non-irrigated farmland [24,29]. The runoff was calculated based on the proportions of the underlying surface area for each group. Each unit included seven vertical layers. From top to bottom, they were: vegetation canopy or building interception layer, surface depression storage layer, root zone comprised of three layers, transition zone layer, and groundwater layer. The soil below the ground was divided into 11 layers for the soil water and heat coupling calculations. Simulation of the natural water cycle process in the watershed included runoff generation and confluence and comprised the water cycle processes in the surface soil, soil, groundwater, slope ditch, and river channel. The water cycle in the surface soil included precipitation, snow melting, evaporation, infiltration, and surface runoff. The snow melting process was calculated by the temperature-index method [30]. The evapotranspiration values of the surface soil, soil, and water were calculated using the Penman formula [31]. Evaporation from the vegetation canopy was calculated using the Penman–Monteith formula [31]. Infiltration was calculated on the basis of the rainfall intensity and using the Green–Ampt model or the Richards equation [32]. The surface runoff was calculated by the Hortonian or saturation overland flow theory when the precipitation intensity exceeded the infiltration capacity [33]. The soil hydrothermal cycle included heat and water transport during the freezing and thawing periods. Soil heat transport was determined using the basic one-dimensional vertical heat flow movement equation (Equation (1)). Soil water transport was determined using the one-dimensional vertical water flow equation (Equation (2)). The movement of liquid water in the soil was driven by the soil water potential, including pressure, gravity, temperature, and solute potentials (Equations (4)–(6)). The relationship between water and heat transport in frozen soil was characterized as the dynamic balance between the moisture content of the unfrozen water and the negative temperature of the soil. Groundwater movement was calculated with the Boussinesq equation [34]. The exchange between river and groundwater was calculated by Darcy’s law and was based on the differences in the water level and the characteristics of the riverbed material [35]. Soil freezing would hinder the exchange between the groundwater and river channels when the temperature exceeds a certain critical value during the freeze-thaw period. The overland confluence was calculated by the kinematic wave method and from the uppermost to the lowermost contour zone of each sub-watershed [36]. Each river channel confluence was calculated using one-dimensional motion waves from upstream to downstream according to the elevation, slope, and Manning roughness coefficient of each contour zone [24]. The influences of temperature on ice formation and river melting were considered.
The temperature difference between the atmosphere and the surface was the heat conduction source. The surface temperature was determined, and the heat flux and temperature of each layer were calculated as follows [37,38]:
z λ s T z = C v T t L i ρ i θ i t
where z is the soil layer thickness (m), T is the temperature of each soil layer (°C), λs and Cv are the soil thermal conductivity (W/[m·°C]) and volumetric heat capacity (J/[m3·°C]), respectively, t is the time (s), and Li, ρi, and θi are the latent heat of ice melting (3.35 × 10⁵ J/kg), the ice density (920 kg/m3), and the volumetric ice content (m3/m3) in the soil, respectively.
The soil liquid water movement was calculated using the Richards equation [39].
θ t = ρ i ρ l θ i t z K θ H z
where ρl and θ are the soil density (kg/m3) and volumetric water content (m3/m3), respectively, K(θ) is hydraulic conductivity of the unsaturated soil (m/s), and H is the soil water potential (m).
Temperature drives the changes in the water phase. Hydrothermal coupling was calculated as follows:
θ l = θ m t
where θm(t) is the maximum liquid water content corresponding to a negative soil temperature.
The soil water potential H was calculated as follows [40]:
H = z + h m + h s + h t
where hm is the pressure potential (m), hs is the solute potential (m), and ht is the temperature potential (m).
The solute potential is a function of temperature and was calculated as follows [40]:
h s = c R μ T K
where c is the mass of a solute in the unit volume of the solution (kg/m3), R is the molar gas constant (8.3145 J/[mol·k]), μ is the molar mass of the solute (g/mol), and Tk is the thermodynamic temperature (K).
The temperature potential was calculated as follows [41]:
h t = h m G W T 1 γ 0 d γ d t
where GWT is the gain factor (dimensionless), γ0 (γ0 = 71.89 g/s2) is the surface tension of the soil at 25 °C (g/s2), and γ is the surface tension of the soil (g/s2). Note that γ = 75.6 − 0.1425Tk − 2.38 × 10⁻⁴Tk2.

2.3.2. Multifactor Attribution Analysis

Multifactor attribution analysis decomposed the impact contribution according to the fixing-changing method and was calculated as follows [27,42].
Δ X j = 1 2 n 1 i = 1 2 n α i , j × S i j = 1 , , n
A = j = 1 n Δ X j = 1 2 n 1 i = 1 2 n β n i × S i
β n i = j = 1 n α i , j
where Δ X j is the influence contribution of the jth factor, α i , j is the weight coefficient of the jth factor corresponding to the ith scenario, S i is the simulated result corresponding to scenario i, n is the number of factors considered, A is the sum of the contributions of all factors, and β n i is the sum of the weight coefficients of all factors in the ith scenario under the premise of considering n influencing factors.
The contribution rate of each factor to the change in the water cycle elements was calculated with the following equation:
η i = Δ X i j = 1 n Δ X j i = 1 , , n

3. Results and Discussion

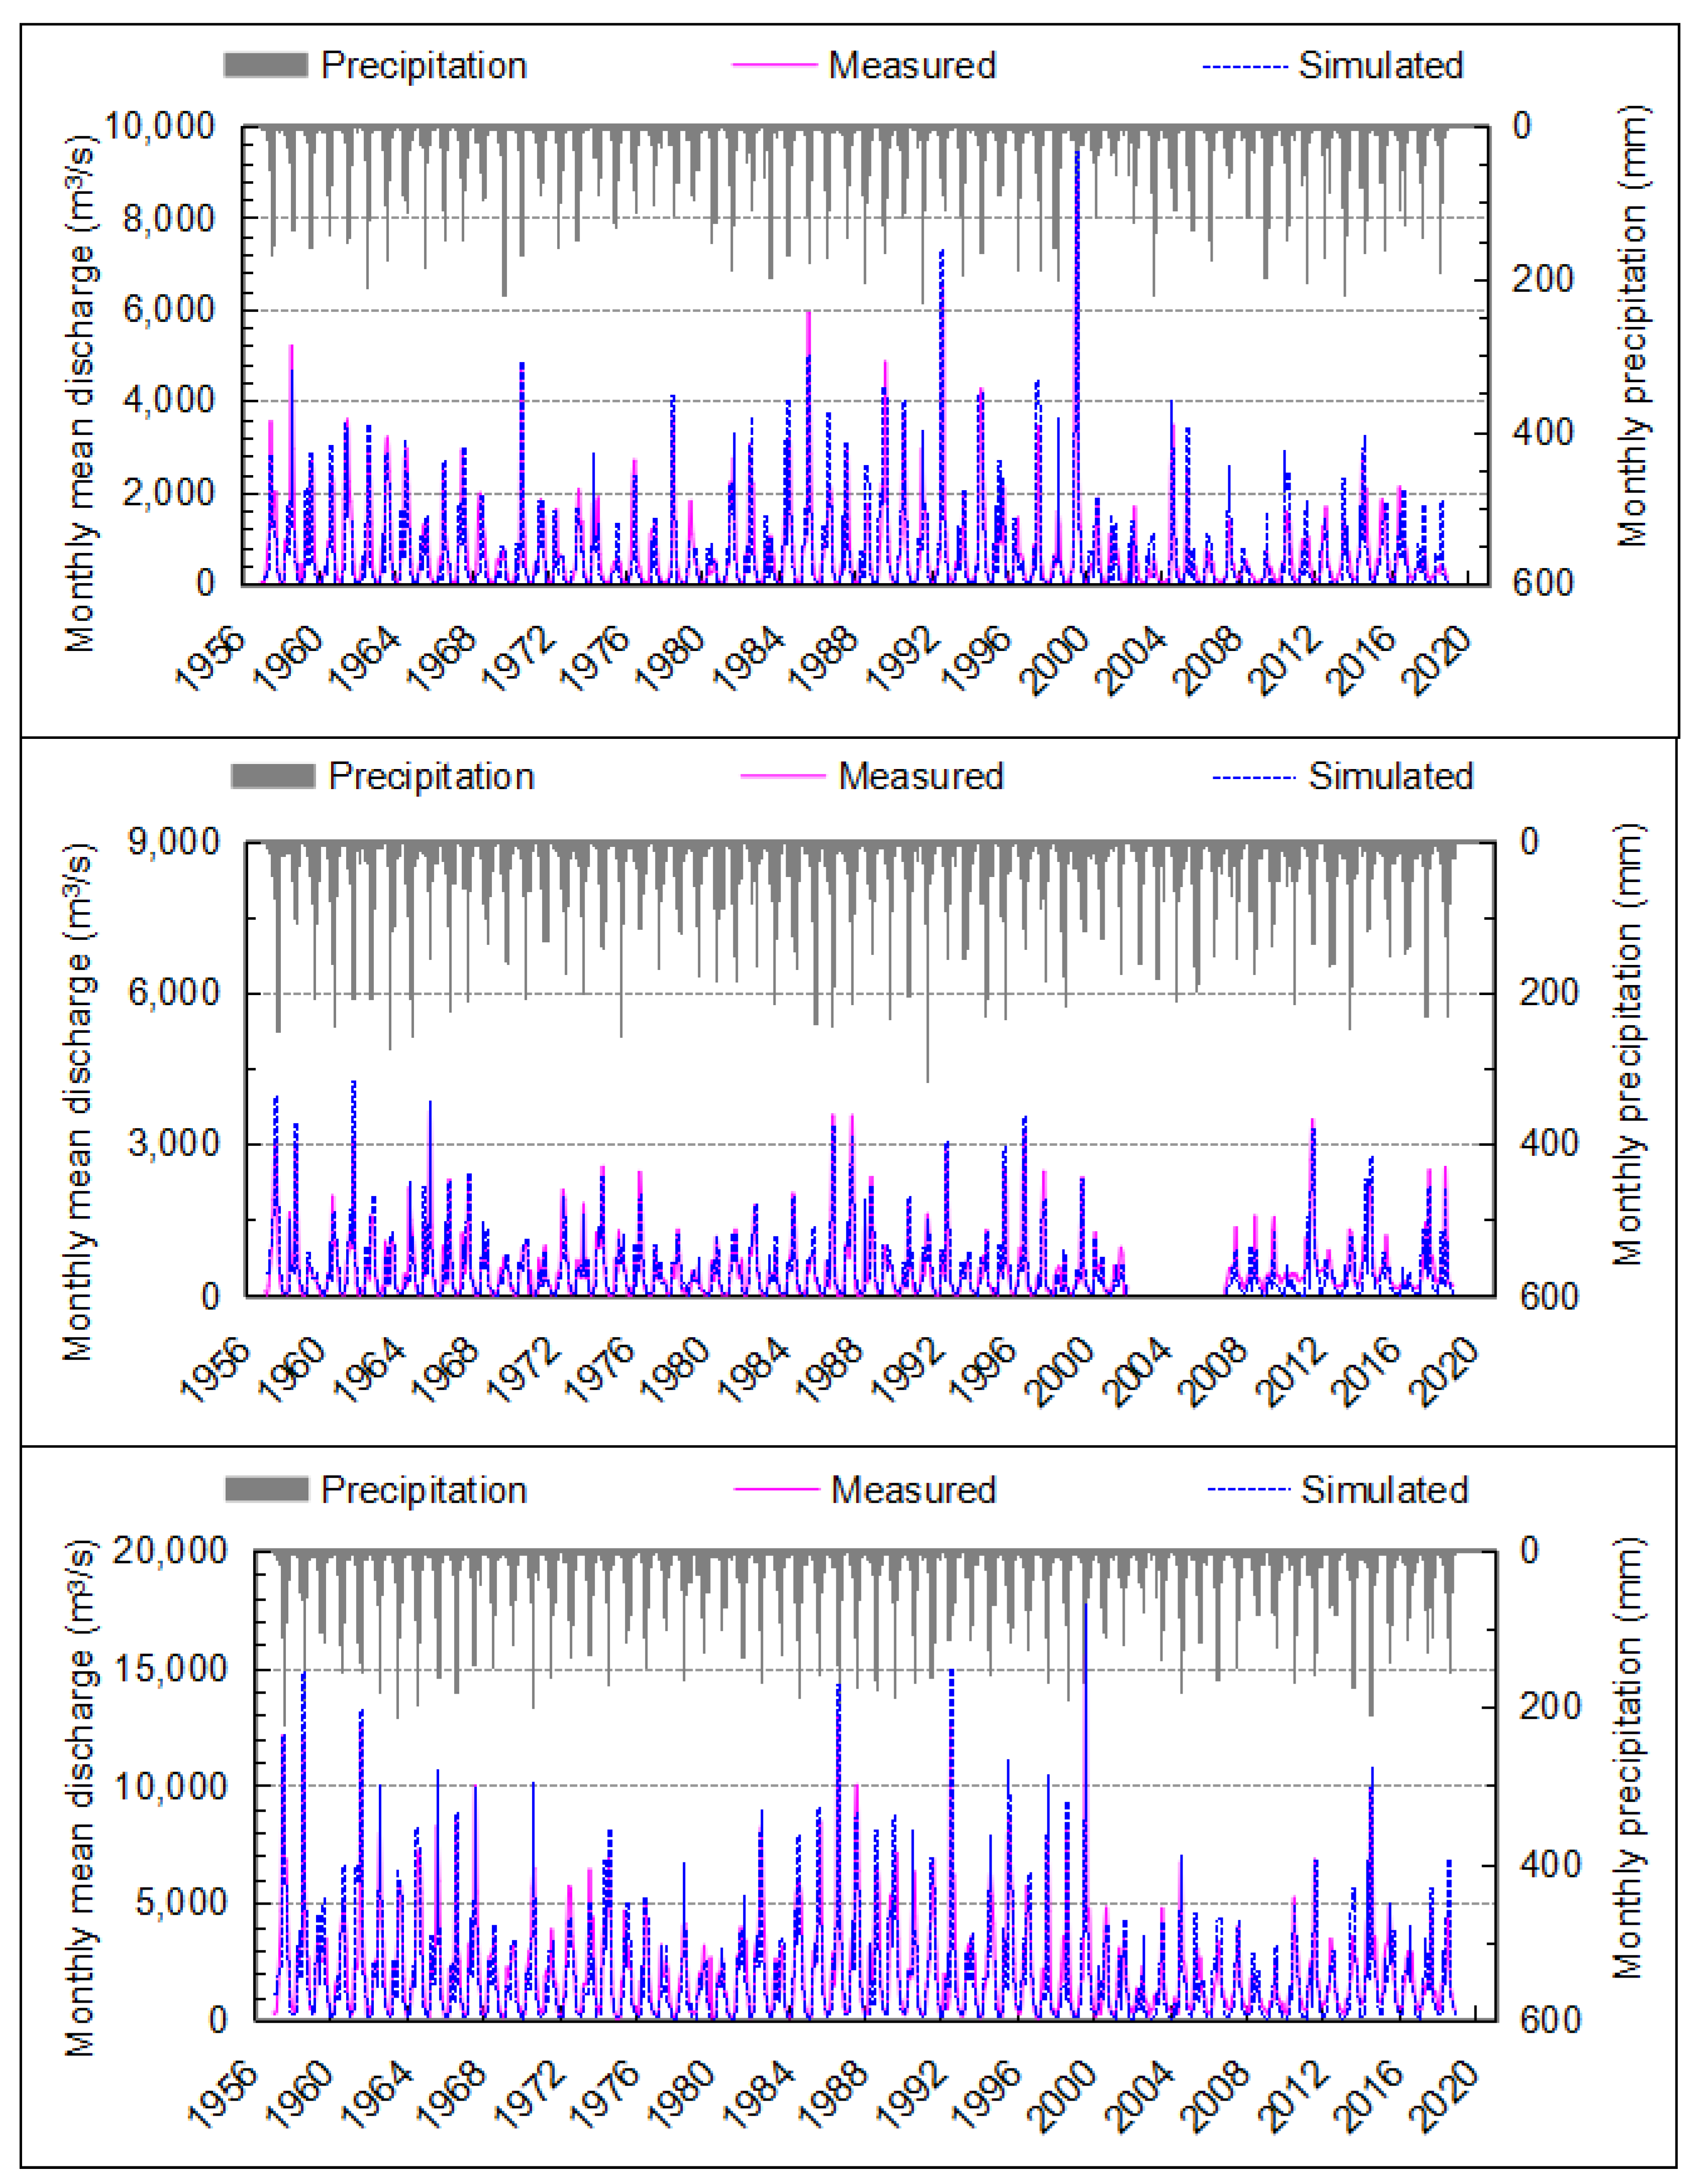
3.1. Model Calibration and Validation

The WEP-N model in the SRB was constructed according to a previously published method [28]. The SRB was partitioned into 9544 sub-basins and 29,488 contour zones based on DEM data and river observations. WEP-COR, the predecessor of the WEP-N model, was verified using the stratified soil temperature and liquid water content of the Qianguo Irrigation District and the monthly mean discharge between 1956 and 2000 at the Jiangqiao, Fuyu, Jiamusi Stations in the main streams of the Songhua River [24]. The WEP-N model was validated using the stratified soil temperature and liquid water content, the daily discharge based on the hydrothermal coupling experiment, and the river flow monitoring experiment during two freeze-thaw periods (2017–2018 and 2018–2019) in the Heidingzi River Basin [28]. The WEP-N model was calibrated and validated using the discharge measured monthly between 1956 and 2018 at the Jiangqiao, Fuyu, and Jiamusi Stations in the main streams of the Songhua River. Data from the Jiangqiao, Fuyu, and Jiamusi Stations were divided into two parts. The data for the period 1956–1990 were used for calibration, and those for 1991–2018 were used for validation. The results of the monthly mean discharge simulations at the Jiangqiao, Fuyu, and Jiamusi Stations are shown in Figure 2. In general, the WEP-N model performed satisfactorily for the SRB and achieved efficiency coefficients of NSE > 0.75 and RE < 5 % for the validation period (Table 1). The simulated flow was suitable for application in the subsequent analyses.

3.2. Influence of Climate Change and Water Use on the Annual Runoff Variation in the SRB

The trends in measured annual runoff in the SRB were analyzed by the Mann–Kendall test method and abrupt changes were detected by the Pettitt test method (Figure 3). The measured annual runoff decreased by 20.3 billion in 63 years A significant abrupt change in the measured annual runoff appeared ca. 1998 (p < 0.01). To analyze the impact of climate change and water use on the water cycle, the data series were segregated into two periods using the abrupt change in measured annual runoff ca. 1998 as the dividing line. The data for the period 1956–1998 served as the base period, while those for 1999–2018 served as the change period.
Climate change and water use were the main factors contributing to runoff reduction in the SRB. The influences of climate change and water use on the annual runoff variation were then analyzed. A base scenario (BS) was created to represent the pre-1998 configuration. The meteorological and water use data for the base period were replaced with those of the change period. The other inputs remained unchanged, and four different scenarios were modeled (Table 2).
Table 3 shows relative changes in temperature, precipitation, and water use. The annual runoff decreased in response to climate change and water use. Compared with the BS scenario, the water use was 8.5 billion m3 higher, the precipitation was 26.0 mm lower, and the temperature was 1.3 °C higher in the BSWM scenario.
For the BS and BSWM scenarios, the annual runoff volumes in the SRB were 73.7 billion m3 and 52.9 billion m3, respectively (Table 4). The rate of change in the annual runoff was −28.2% in the BSWM scenario relative to that of the BS scenario. The contribution rates of water use and climate change to the annual runoff reduction in the SRB were 23.0% and 77.0%, respectively. These values were determined by multifactor attribution analysis, revealing that climate change was the dominant factor attenuating annual runoff.
We analyzed the influence of climate change on the reduction in the annual production flow components. Only climate change sets the scenarios for the comparative analyses based on the BS (Table 5).
The annual average temperature increased by 1.3 °C while the precipitation decreased by 26.0 mm. Hence, there was a 26.9-mm decrease in annual production flow (Table 3 and Table 6).
We then analyzed the annual production flow components (Table 6). Annual surface, soil, and base flow decreased by 16.7 mm, 0.6 mm, and 9.6 mm, respectively, in the BSTP scenario relative to the BS scenario. The rate of change in the annual surface flow in the BSTP scenario was −12.7% to that of the BS scenario, which was the minimal rate of change in the annual surface, soil, and base flows. Nevertheless, the annual surface flow reduction accounted for 62.1% of the annual production flow reduction. The rate of change in the annual base flow was −36.6%, but the annual base flow reduction accounted for 35.7%. The change in annual soil flow was minimal and accounted for only 2.2%. The observed decrease in total annual production flow in the SRB was caused mainly by the decrease in the annual surface flow. The decrease in annual base flow accounted for a relatively small proportion.

3.3. Effect of Climate Change on Production Flow Variation during Different Periods in the SRB

3.3.1. Production Flow Variation during Different Periods

The non-freeze-thaw was the main annual production flow reduction period. Production flow reduction during the non-freeze-thaw period accounted for 80.7% of the annual total under the influence of climate change (Table 7 and Table 8). The production flow reduction during the thawing period accounted for 20.4% of the annual total. The production flow during the freezing period slightly increased and accounted for −1.1% of the annual total.

3.3.2. Production Flow Component Variation during Freezing Period

The freezing period temperature/precipitation data series for the base period were replaced with those for the change period to study the influence of climate change on runoff component variation during the freezing period. The temperature and precipitation increased by 1.1 °C and 5.5 mm, respectively (Table 7). Hence, there was a 1-mm increase in the total production flow during the freezing period (Table 9). Relative to the BS scenario, the rate of change in the total production flow during the freezing period was 13.9% in the BSTP scenario.
The increase in the base flow accounted for most of the increase in the total production flow. The rate of change in the base flow during the freezing period was 8.5%. Nevertheless, the increase in base flow explained 60.0% of the increase in total production flow during the freezing period. The increase in surface flow accounted for 40.0% of the increase in total production flow during the freezing period. However, the rate of change in the surface flow was 99.3% during the freezing period. There were minimal changes in the soil flow, and increases in it explained 0% of the increase in total production flow during the freezing period.

3.3.3. Production Flow Component Variation during the Thawing Period

The thawing period temperature/precipitation data series for the base period were replaced with those for the change period to study the influence of climate change on runoff component variation during the thawing period. Increases of 1.57 °C and 10.3 mm precipitation caused a 3.2-mm decrease in runoff during the thawing period (Table 10). Relative to the BS scenario, the rate of change in the total production flow during the thawing period was −8.4% in the BSTP scenario.
The rate of change in the surface flow was −11.4%, but the reduction in the surface flow accounted for 112.5% of the total reduction in the production flow during the thawing period. The reduction in the surface flow explained most of the reduction in the total production flow during the thawing period. The soil and base flow increased during the thawing period. The increases in soil and base flow accounted for −3.1% and −9.4% of the change in the total production flow during the thawing period, respectively.

3.3.4. Variations in Production Flow Components during the Non-Freeze-Thaw Period

The temperature/precipitation data series for the non-freeze-thaw period were replaced with those for the change period to study the influence of climate change on runoff component variation during the non-freeze-thaw period. The temperature increased by 1.4 °C while the precipitation decreased by 41.7 mm. Thus, there was a decrease of 17.7 mm in the total production flow during the non-freeze-thaw period (Table 11). Relative to the BS scenario, the rate of change in the total production flow during the non-freeze-thaw period was −15.3% in the BSTP scenario.
The rate of change in the surface flow was −11.6%, but the reduction in surface flow accounted for 65.0% of the reduction in the total production flow during the non-freeze-thaw period. The rate of change in the base flow was −40.5%, and the reduction in the base flow accounted for 33.9%. The changes in the soil flow were minimal, and the reduction in the soil flow accounted for 1.1% of the total production flow during the non-freeze-thaw period.

3.4. Effects of Climate Change on Groundwater Recharge

The foregoing analysis demonstrated that under climate change, the surface flow caused most of the reduction in production flow in the SRB. In contrast, the reduction in base flow accounted for a relatively small proportion of the reduction in production flow in the SRB. The base flow increased during the freezing and thawing periods. Relative to the BS scenario, the rates of change in the groundwater recharge during the freezing and thawing periods increased by 9.2% and 4.1%, respectively, in the BSTP scenario (Table 12).
The water use was 27.5 billion m3, the groundwater exploitation was 9.4 billion m3, and the groundwater exploitation accounted for 34.3 % of water use and 29.1% of groundwater resources in the SRB between 1980 and 2018. The utilization rate of groundwater resources is far below the red line for development and utilization of 40%, the internationally recognized alarm line, which shows potential for development [43]. The groundwater exploitation was much less in the SRB compared with the Yellow River Basin and Haihe River Basin in northern China. The attenuation of the production flow aggravates water resource shortages. Appropriate attention should be given to groundwater utilization in areas with relatively less groundwater exploitation.

4. Conclusions

The WEP-N model was used to simulate the SRB’s hydrological cycle, and its overall performance was acceptable. The flow simulation was accurate, NSE > 0.75 and RE < 5 % for three hydrological stations and close to the actual measurements.
Climate change and water use were the main factors influencing the SRB’s reduction in the annual production flow. Compared with the BS scenario, the rate of change in the annual production flow was −28.2% under the BSWM scenario. According to a multifactor attribution analysis, the rates of the contribution of climate change and water use to the reduction in annual production flow were 77.0% and 23.0%, respectively. Thus, climate change was the dominant factor attenuating runoff. The decrease in annual surface flow caused a 62.1% reduction in the annual production flow in the SRB. By contrast, the decrease in annual base flow accounted for only 35.7% of the reduction in the annual production flow in the SRB.
The change in annual production flow occurred mainly during the non-freeze-thaw period. The reductions in production flow during the non-freeze-thaw and thawing periods accounted for 80.7% and 20.4% of the annual reduction in the production flow, respectively. The production flow slightly increased during the freezing period. The change in the production flow occurred mainly during the non-freeze-thaw period. The increases in surface, soil, and base flow accounted for 60.0%, 0%, and 40.0% of the total increase in the production flow under the influences of increasing temperature and precipitation during the freezing period. The variations in surface, soil, and base flow accounted for 112.5%, −3.1%, and −9.4% of the total reduction in production flow during the thawing period. The reductions in surface, soil, and base flow accounted for 65.0%, 1.1%, and 33.9% of the total reduction in production flow during the non-freeze-thaw period. The foregoing analysis showed that surface flow caused the reduction in production flow in the SRB, where reduction in base flow accounted for a relatively small proportion under climate change. The base flow increased during the freezing and thawing periods.
Relative to the BS scenario, the rates of change in groundwater recharge during the freezing and thawing periods increased by 9.2% and 4.1%, respectively, in the BSTP scenario. The attenuation of the production flow aggravated the water resource shortage. Attention should be directed towards certain areas of SRB with less groundwater exploitation and similar areas in northern Eurasia and northern North America.

Author Contributions

S.L. performed the model programming and simulations. Z.Z., J.L. (Jiajia Liu), P.W., C.L. and J.L. (Jia Li) contributed to the model programming. S.L. and Z.Z. performed the writing. X.X., Y.J. and H.W. also contributed to the writing of the paper. All authors have read and agreed to the published version of the manuscript.

Funding

This research was funded by the National Natural Science Foundation of China (51679257, 51779270) and the National Key Research and Development Program of China (2016YFC0402405).

Institutional Review Board Statement

Not applicable.

Informed Consent Statement

Not applicable.

Data Availability Statement

The datasets and model codes relevant to the current study are available from the corresponding author upon reasonable request.

Acknowledgments

The authors are grateful to the editors and reviewers; the comments and suggestions have contributed significantly to the improvement of the manuscript.

Conflicts of Interest

The authors have no relevant financial or non-financial interests to disclose.

References

  1. Oyler, J.W.; Dobrowski, S.Z.; Ballantyne, A.P.; Klene, A.E.; Running, S.W. Artificial amplification of warming trends across the mountains of the western United States. Geophys. Res. Lett. 2015, 42, 153–161. [Google Scholar] [CrossRef] [Green Version]
  2. Gao, H.; Li, H.; Duan, Z.; Ren, Z.; Meng, X.; Pan, X. Modelling glacier variation and its impact on water resource in the Urumqi Glacier No. 1 in Central Asia. Sci. Total Environ. 2018, 644, 1160–1170. [Google Scholar] [CrossRef]
  3. Yang, D.; Ye, B.; Kane, D.L. Streamflow changes over Siberian Yenisei River Basin. J. Hydrol. 2004, 296, 59–80. [Google Scholar] [CrossRef]
  4. Yang, W.; Jin, F.; Si, Y.; Li, Z. Runoff change controlled by combined effects of multiple environmental factors in a headwater catchment with cold and arid climate in northwest China. Sci. Total Environ. 2021, 756, 143995. [Google Scholar] [CrossRef]
  5. Li, B.; Chen, Y.; Chen, Z.; Li, W. Trends in runoff versus climate change in typical rivers in the arid region of northwest China. Quat. Int. 2012, 282, 87–95. [Google Scholar] [CrossRef]
  6. Pan, C.G.; Kamp, U.; Munkhjargal, M.; Halvorson, S.J.; Dashtseren, A.; Walther, M. An estimated contribution of glacier runoff to Mongolia’s Upper Khovd River Basin in the Altai Mountains. Mt. Res. Dev. 2019, 39, R12–R20. [Google Scholar] [CrossRef] [Green Version]
  7. Tang, Q.; Oki, T. Historical and future changes in streamflow and continental runoff. In Terrestrial Water Cycle and Climate Change: Natural and Human-Induced Impacts; John Wiley & Sons: Hoboken, NJ, USA, 2016; Volume 221, pp. 17–37. [Google Scholar] [CrossRef]
  8. Zhang, Y.; Liu, S.; Xu, J.; Shangguan, D. Glacier change and glacier runoff variation in the Tuotuo River basin, the source region of Yangtze River in western China. Environ. Geol. 2008, 56, 59–68. [Google Scholar] [CrossRef]
  9. Shiyin, L.; Yong, Z.; Yingsong, Z.; Yongjian, D. Estimation of glacier runoff and future trends in the Yangtze River source region, China. J. Glaciol. 2009, 55, 353–362. [Google Scholar] [CrossRef] [Green Version]
  10. Yang, Y.; Weng, B.; Man, Z.; Yu, Z.; Zhao, J. Analyzing the contributions of climate change and human activities on runoff in the Northeast Tibet Plateau. J. Hydrol. Reg. Stud. 2020, 27, 100639. [Google Scholar] [CrossRef]
  11. Rakhimova, M.; Liu, T.; Bissenbayeva, S.; Mukanov, Y.; Gafforov, K.S.; Bekpergenova, Z.; Gulakhmadov, A. Assessment of the impacts of climate change and human activities on runoff using climate elasticity method and general circulation model (GCM) in the Buqtyrma River Basin, Kazakhstan. Sustainability 2020, 12, 4968. [Google Scholar] [CrossRef]
  12. Qiu, L.; Peng, D.; Xu, Z.; Liu, W. Identification of the impacts of climate changes and human activities on runoff in the upper and middle reaches of the Heihe River basin, China. J. Water Clim. Chang. 2016, 7, 251–262. [Google Scholar] [CrossRef]
  13. Thompson, L.G.; Brecher, H.H.; Mosley-Thompson, E.; Hardy, D.R.; Mark, B.G. Glacier loss on Kilimanjaro continues unabated. Proc. Natl. Acad. Sci. USA 2009, 106, 19770–19775. [Google Scholar] [CrossRef] [Green Version]
  14. Otte, I.; Detsch, F.; Mwangomo, E.; Hemp, A.; Appelhans, T.; Nauss, T. Multidecadal trends and interannual variability of rainfall as observed from five lowland stations at Mt. Kilimanjaro, Tanzania. J. Hydrol. Meteorol. 2017, 18, 349–361. [Google Scholar] [CrossRef]
  15. Hemp, A. Climate change-driven forest fires marginalize the impact of ice cap wasting on Kilimanjaro. Glob. Chang. Biol. 2005, 11, 1013–1023. [Google Scholar] [CrossRef]
  16. Bozkurt, D.; Rojas, M.; Boisier, J.P.; Valdivieso, J. Climate change impacts on hydroclimatic regimes and extremes over Andean basins in central Chile. Hydrol. Earth Syst. Sci. Discuss. 2017, 1–29. [Google Scholar] [CrossRef] [Green Version]
  17. Crespo, P.J.; Feyen, J.; Buytaert, W.; Bücker, A.; Breuer, L.; Frede, H.; Ramírez, M. Identifying controls of the rainfall–runoff response of small catchments in the tropical Andes (Ecuador). J. Hydrol. 2011, 407, 164–174. [Google Scholar] [CrossRef]
  18. St. Jacques, J.M.; Sauchyn, D.J.; Zhao, Y. Northern Rocky Mountain streamflow records: Global warming trends, human impacts or natural variability? Geophys. Res. Lett. 2010, 37, 1–5. [Google Scholar] [CrossRef] [Green Version]
  19. Arrigoni, A.S.; Greenwood, M.C.; Moore, J.N. Relative impact of anthropogenic modifications versus climate change on the natural flow regimes of rivers in the Northern Rocky Mountains, United States. Water Resour. Res. 2010, 46, 1–16. [Google Scholar] [CrossRef] [Green Version]
  20. Miao, C.; Yang, L.; Liu, B.; Gao, Y.; Li, S. Streamflow changes and its influencing factors in the mainstream of the Songhua River basin, Northeast China over the past 50 years. Environ. Earth Sci. 2011, 63, 489–499. [Google Scholar] [CrossRef]
  21. Chu, H.; Wei, J.; Qiu, J.; Li, Q.; Wang, G. Identification of the impact of climate change and human activities on rainfall-runoff relationship variation in the Three-River Headwaters region. Ecol. Indic. 2019, 106, 105516. [Google Scholar] [CrossRef]
  22. Meng, F.; Su, F.; Yang, D.; Tong, K.; Hao, Z. Impacts of recent climate change on the hydrology in the source region of the Yellow River Basin. J. Hydrol. Reg. Stud. 2016, 6, 66–81. [Google Scholar] [CrossRef] [Green Version]
  23. Song, C.; Wang, G.; Sun, X.; Hu, Z. River runoff components change variably and respond differently to climate change in the Eurasian Arctic and Qinghai-Tibet Plateau permafrost regions. J. Hydrol. 2021, 601, 126653. [Google Scholar] [CrossRef]
  24. Li, J.; Zhou, Z.; Wang, H.; Liu, J.; Jia, Y.; Hu, P.; Xu, C. Development of WEP-COR model to simulate land surface water and energy budgets in a cold region. Hydrol. Res. 2019, 50, 99–116. [Google Scholar] [CrossRef]
  25. Burn, D.H.; Elnur, M. Detection of hydrologic trends and variability. J. Hydrol. 2002, 255, 107–122. [Google Scholar] [CrossRef]
  26. Pettitt, A.N. A Non-Parametric Approach to the Change-Point Problem. Appl. Statist. 1979, 28, 126–135. [Google Scholar] [CrossRef]
  27. Liu, J.J.; Zhou, Z.H.; Jia, Y.W.; Wang, H. A new method to quantitatively separate the effects of multi-factors on the water cycle evolution. J. Hydraul. Eng. 2014, 45, 658–665. [Google Scholar] [CrossRef]
  28. Liu, S.; Zhou, Z.; Liu, J.; Wang, K.; Li, J.; Wang, P.; Xie, X.; Jia, Y.; Wang, H. Simulation of water and nitrogen movement mechanism in cold regions during freeze-thaw period based on a distributed nonpoint source pollution model closely coupled water, heat, and nitrogen processes at the watershed scale. Environ. Sci. Pollut. Res. Int. 2022. [CrossRef]
  29. Flerchinger, G.N.; Saxton, K.E. Simultaneous heat and water model of a freezing snow-residue-soil system I. Theory and development. Trans. ASAE. 1989, 32, 573–576. [Google Scholar] [CrossRef]
  30. Hock, R. A distributed temperature-index ice-and snowmelt model including potential direct solar radiation. J. Glaciol. 1999, 45, 101–111. [Google Scholar] [CrossRef]
  31. Monteith, J.L. Principles of Environmental Physics; Edward Arnold: London, UK, 1973; Volume 214. [Google Scholar]
  32. Jia, Y.; Tamai, N. Integrated analysis of water and heat balances in Tokyo metropolis with a distributed model. J. Jpn. Soc. Hydrol. Water Resour. 1998, 11, 150–163. [Google Scholar] [CrossRef]
  33. Jia, Y.; Wang, H.; Zhou, Z.H.; Qiu, Y.Q.; Luo, X.Y.; Wang, J.H.; Yan, D.H.; Qin, D.Y. Development of the WEP-L distributed hydrological model and dynamic assessment of water resources in the Yellow River basin. J. Hydrol. 2006, 331, 606–629. [Google Scholar] [CrossRef]
  34. Zaradny, H. Groundwater Flow in Saturated and Unsaturated Soil; A. A. Balkema Uitgevers: Rotterdam, The Netherlands, 1993. [Google Scholar]
  35. Hubbert, M.K. Darcy’s law and the field equations of the flow of underground fluids. Trans. AIME. 1956, 207, 222–239. [Google Scholar] [CrossRef]
  36. Ponce, V.M. Diffusion wave modeling of catchment dynamics. J. Hydraul. Eng. 1986, 112, 716–727. [Google Scholar] [CrossRef]
  37. Shang, S. Numerical simulation of soil moisture and thermal regime in winter. Irrig. Drain. 1997, 16, 12–17. (In Chinese) [Google Scholar]
  38. Wang, S.; Prasher, S.O.; Patel, R.M.; Yang, C.; Kim, S.; Madani, A.; Macdonald, P.M.; Robertson, S.D. Fate and transport of nitrogen compounds in a cold region soil using DRAINMOD. Comput. Electron. Agric. 2006, 53, 113–121. [Google Scholar] [CrossRef]
  39. Wang, A.W.; Xie, Z.H.; Feng, X.; Tian, X.; Qin, P. A soil water and heat transfer model including changes in soil frost and thaw fronts. Sci. China Earth Sci. 2014, 57, 1325–1339. [Google Scholar] [CrossRef]
  40. Lei, Z.D.; Yang, S.X.; Xie, C.S. Soil Hydrodynamics; Tsinghua University Press: Beijing, China, 1988; pp. 8–12. (In Chinese) [Google Scholar]
  41. Hansson, K.; Šimůnek, J.; Mizoguchi, M.; Lundin, L.C.; Van Genuchten, M.T. Water flow and heat transport in frozen soil: Numerical solution and freeze-thaw applications. Vadose Zone J. 2004, 3, 692–704. [Google Scholar] [CrossRef] [Green Version]
  42. Sun, Y.; Tian, F.; Yang, L.; Hu, H. Exploring the spatial variability of contributions from climate variation and change in catchment properties to streamflow decrease in a mesoscale basin by three different methods. J. Hydrol. 2014, 508, 170–180. [Google Scholar] [CrossRef]
  43. Falkenmark, M.; Widstrand, C. Population and water resources: A delicate balance. Popul. Bull. 1992, 47, 1–36. [Google Scholar] [PubMed]
Figure 1. Overview of the SRB.
Water 14 03170 g001
Figure 2. Validation of the WEP-N model at the Jiangqiao, Fuyu, and Jiamusi Stations.
Water 14 03170 g002
Figure 3. Trend and mutation analyses of measured annual runoff in the SRB.
Water 14 03170 g003
Table 1. Validation of the WEP-N model at the Jiangqiao, Fuyu, and Jiamusi Stations.
Hydrological SiteNSERE/%
1956–19901991–20181956–19901991–2018
Jiangqiao0.800.774.984.85
Fuyu0.860.734.26−0.41
Jiamusi0.810.764.510.83
Table 2. Settings of scenarios for the multifactor attribution analysis.
ScenarioDescription
BSBase scenario
BSWChange base period water use data to that of the change period
BSMChange base period meteorological data to that of the change period
BSWMChange base period water use and meteorological data to those of the change period
Table 3. Changes in each impact factor.
PeriodTemperature
(°C)
Precipitation
(mm)
Water Use
(Billion m3)
Base2.5540.219.2
Change3.8514.227.7
Variation1.326.08.5
Table 4. Contributions of various factors to annual runoff reduction in the SRB.
ItemAnnual Runoff
BS73.7 billion m3
BSWM52.9 billion m3
BSWM-BS−20.7 billion m3
Rate of change−28.2%
Contribution rateWater use23.0%
Climate change77.0%
Table 5. Scenario settings for multifactor attribution analysis.
ScenarioDescription
BSBase scenario
BSTChange base period air temperature to that of the change period
BSPChange base period precipitation data to that of the change period
BSTPChange base period air temperature and precipitation data to those of the change period
Table 6. Annual production flow influenced by climate change.
ItemAnnual Production Flow
Production FlowSurface FlowSoil FlowBase Flow
BS160.2 mm131.2 mm2.8 mm26.2 mm
BSTP133.3 mm114.5 mm2.2 mm16.6 mm
BSTP-BS−26.9 mm−16.7 mm−0.6 mm−9.6 mm
Rate of change−16.8%−12.7%−21.4%−36.6%
Annual   production   flow   component Total   annual   production   flow 100.0%62.1%2.2%35.7%
Table 7. Changes in meteorological factors.
PeriodMeteorological FactorWhole YearFreezing PeriodThawing PeriodNon-Freeze-Thaw Period
BasePrecipitation (mm)540.123.671.5445.0
Temperature (°C)2.5−14.94.215.5
ChangePrecipitation (mm)519.329.586.5403.3
Temperature (°C)3.9−13.85.816.9
VariationPrecipitation (mm)−20.86.015.0−41.7
Temperature (°C)1.31.11.61.4
Table 8. Production flow variation during different periods.
ItemProduction Flow during Different Periods of Year
Whole YearFreezing PeriodThawing PeriodNon-Freeze-Thaw Period
BS160.2 mm7.4 mm37.2 mm115.6 mm
BSTP133.3 mm7.7 mm31.8 mm93.8 mm
BSTP-BS−27.0 mm0.3 mm−5.5 mm−21.8 mm
BSTP BS   during   different   periods Annual   BSTP BS 100.0%−1.1%20.4%80.7%
Table 9. Influences of temperature and precipitation on the runoff component variation during the freezing period.
ItemProduction Flow during Freezing Period
Total Production FlowSurface FlowSoil FlowBase Flow
BS7.4 mm0.4 mm0.1 mm6.9 mm
BSTP8.4 mm0.8 mm0.1 mm7.5 mm
BSTP-BS1.0 mm0.4 mm0.0 mm0.6 mm
Rate of change13.9%99.3%31.2%8.5%
Variation   in   production   flow   component Variation   in   total   production   flow 100.0%40.0%0%60%
Table 10. Influences of temperature and precipitation on runoff component variation during the thawing period.
ItemProduction Flow during Thawing Period
Total Production FlowSurface FlowSoil FlowBASE flow
BS37.2 mm31.7 mm1.0 mm4.6 mm
BSTP31.8 mm28.1 mm1.1 mm4.9 mm
BSTP-BS−3.2 mm−3.6 mm0.1 mm0.3 mm
Rate of change−8.4%−11.4%10.0%6.5%
Variation   in   production   flow   component Variation   in   total   production   flow 100.0%112.5%−3.1%−9.4%
Table 11. Influences of temperature and precipitation on the variation in runoff component during the non-freeze-thaw period.
ItemProduction Flow during Non-Freeze-Thaw Period
Total Production FlowSurface FlowSoil FlowBase Flow
BS115.6 mm99.1 mm1.7 mm14.8 mm
BSTP97.9 mm87.6 mm1.5 mm8.8 mm
BSTP-BS−17.7 mm−11.5 mm−0.2 mm−6.0 mm
Rate of change−15.3%−11.6%−11.8%−40.5%
Variation   in   production   flow   component Variation   in   total   production   flow 100.0%65.0%1.1%33.9%
Table 12. Influences of temperature and precipitation on groundwater recharge variation.
ItemGroundwater Recharge during Different Periods
Freezing PeriodThawing PeriodNon-Freeze-Thaw Period
BS6.1 mm12.2 mm37.1 mm
BSTP6.7 mm12.7 mm27.9 mm
BSTP-BS0.6 mm0.5 mm−9.2 mm
Rate of change9.2%4.1%−24.8%
Publisher’s Note: MDPI stays neutral with regard to jurisdictional claims in published maps and institutional affiliations.

