Abstract
Disposal sites without adequate engineering controls pose a significant risk to the environment. In the present study, the environmental hazards of an abandoned and unrecultivated liquid waste disposal are investigated with a special focus on soil and shallow groundwater contamination. After a period of operation from 1994 to 2010, when the wastewater collection of the municipality was regulated, the disposal site was subsequently decommissioned without further action. Eight monitoring wells have been established in the disposal basins and in the surrounding area to determine the contamination of the site. Sampling took place in the summers of 2020 and 2021. The results of the analysis of the soil and water samples collected showed a high level of contamination in the area. In the borehole profile of the infiltration basin, a well-developed leachate nitrate profile was observed, with a concentration above 3000 mg/kg NO3−. The soil phosphate content was also significant, with a value of over 1900 mg/kg in the upper 40 cm layer. Extremely high concentrations of ammonium (>45 mg/L) and organic matter (>90 mg/L) were detected in the groundwater of the basins, indicating that contaminated soil remains a major source of pollutants more than 10 years after closure. For all micro- and macroelements present in detectable concentrations, a significant increase was observed in the infiltration basin. Our results have revealed that the surroundings are also heavily contaminated. NO3− concentrations above the contamination limit were measured outside the basins. Recultivation of liquid waste disposal sites of similar characteristics is therefore strongly recommended.
1. Introduction
Inadequate or non-existent wastewater collection and treatment has resulted in considerable contamination of soil and groundwater resources [1,2,3]. Proper management of municipal wastewater is essential for sustainability and human health [4,5]. In addition, eliminating sources of pollution and protecting aquifers has become a major challenge of the 21st century, even in the more developed regions of the world [6,7]. Therefore, the potential risk assessment of soil and groundwater contamination due to liquid landfills is of paramount importance [8].
During the last few decades, dump sites without adequate engineering controls were used as the final disposal sites for different types of waste, such as solid and liquid municipal or industrial waste [9,10,11]. These sites often operated without environmental permits and illegally, while the authorities failed to take action to ensure proper operation [12,13]. Uncontrolled, badly sited and improperly designed liquid waste sites are considered serious potential sources of pollution [14,15,16]. However, the level of pollution depends on a number of factors such as the quantity and composition of the leachate, the operation time of the site, soil type, groundwater level, and distance from agricultural land or a water environment [17,18].
The vulnerability of groundwater to landfill leakage has been established by several studies [19,20]. High levels of dissolved organic matter, and inorganic nitrogen and phosphorous compounds of municipal wastewaters pose a significant threat to the environment [21,22,23]. Ammonium (NH4+) is commonly present in municipal wastewater and landfill leachate at very high concentrations compared to drinking water or environmental quality standards. It is also a relatively mobile pollutant under certain conditions. For these reasons, NH4+ is commonly used as a key pollutant species in environmental risk assessments of solid and liquid landfills, sewers and contaminated sites [24]. Oxidation of NH4+ results in the generation of nitrite (NO2−) and—in the final stage of nitrification—nitrate (NO3−), which is extremely mobile due to its high solubility in water. In terms of estimating the temporal and spatial changes of NO3− in groundwater, the greatest uncertainty is associated with the amount of nitrogen that is accumulated in the soil, which is continuously oxidised and leached into groundwater [25,26,27]. Significant uncertainty can also surround the estimation of natural infiltration rates from excess precipitation [28]. A similar environmental problem is the adsorption of significant amounts of phosphorus in wastewater. Stollenwerk’s (1996) [29] investigations in Cape Cod, Massachusetts have shown that large amounts of phosphate are bound in aquifer sediments. Computer simulations suggested that desorption of phosphate could contaminate the area for decades, despite the fact that wastewater disposal was scheduled to be stopped.
Several studies have been conducted on disposal sites worldwide with a focus on environmental impacts. In developed countries, studies have been carried out since the end of the last century, while in developing countries the environmental impacts of liquid landfills have only recently become a focus of research [30,31,32]. Appleyard (1996) [33], investigating a liquid waste disposal site near Perth in Western Australia, found that the contamination plume of the leachate with high ammonium, iron and bacteria content spread for about 1000 m in the direction of groundwater flow at an average speed of about 40 m/year. Szabó and colleagues (2016) [34] modelled the spread of contamination in the environment of a recultivated dumpsite using Na+ ions. They found that effluent from the site had reached a depth of 70 m over a 30-year operational period, which is considered to be significant. Ringo (2016) [35], investigated a sewage disposal environment in Tanzania, with results showing high levels of pollution in the sewage disposal environment. The author suggests immediate multi-stage measures and the application of new techniques to alleviate contamination.
The European Union (EU) Council Directive concerning urban wastewater treatment (91/271/EEC) has resulted in major changes in the wastewater treatment practices of the member states over the last few decades. The UWWTD is a key legislative element of the water protection policy of the Union, and its full implementation is a prerequisite for achieving the objectives of the EU Water Framework Directive (2000/60/EC) [36]. The implementation of the UWWTD imposes substantial financial costs on EU member states, requiring extensive financial investments to modernise and construct new wastewater treatment plants to ensure low nitrogen and phosphorus emissions.
In Hungary, significant steps have been taken since the early 1990s to remediate the damage caused under socialism, and new laws on water quality have rapidly been adopted to bring Hungary into alignment with EU standards [37]. The European integration process greatly influenced water and wastewater management in Hungary, and was very much needed, as infrastructure development was at a low level and unbalanced, since in parallel with the construction of the drinking water network the sewerage networks and wastewater treatment plants were not established [38,39]. In accordance with the EU legislation, the establishment of the sewerage network of municipalities with pollutant loads above 2000 inhabitant equivalents (IE) is currently ongoing. Very significant progress has been made in the collection and purification of municipal wastewater in Hungary in the last decade. The difference in the proportion of homes connected to the water and sewerage network decreased from 41.1% in 2000 to 12.2% in 2020 [40].
In Hungary, it was common practice that in settlements without a sewerage network, inhabitants stored their communal wastewater in sewage tanks located within the household, and after it was filled, sewage was transported to an on-site liquid waste disposal established near the boundary of the municipality. At present, there are still municipalities without a sewerage network, but the wastewater generated is typically transported to a wastewater treatment plant where it undergoes more significant purification. In recent years, a sewerage network has been established in a large number of municipalities, and disposal sites have been closed and, in favourable cases, recultivated. However, in several cases, recultivation has not been carried out, as in the case of the liquid waste disposal site under examination. There are no official data on the number of similar abandoned sites, as abandonment without recultivation is considered a so-called shadow zone.
The deterioration of groundwater quality of the investigated area has been stated by several studies. Mester et al. [39] assessed the groundwater quality of the settlement Báránd using GIS and different water quality indicators. They found that, as a result of the pollution that has been going on for decades, the groundwater supply of the municipality has become heavily polluted. The construction of the sewerage network in 2014 resulted in marked positive changes in the quality of groundwater resources, although purification processes will continue for years to come [6]. In the present study, the environmental hazards of an abandoned and unrecultivated liquid waste disposal are investigated with a special focus on soil and shallow groundwater contamination. Since the literature focuses mainly on the environmental impacts of solid waste landfills because of their wider application, and significantly fewer studies examine the impacts of communal liquid landfills, our study could therefore be an important addition to the literature in this field. In addition, the significance of the present study is to highlight the environmental challenges associated with liquid waste disposals, which exist in many parts of the world and remains unsolved in numerous cases due to the high costs of recultivation.
2. Materials and Methods
2.1. Site Location and Characteristics
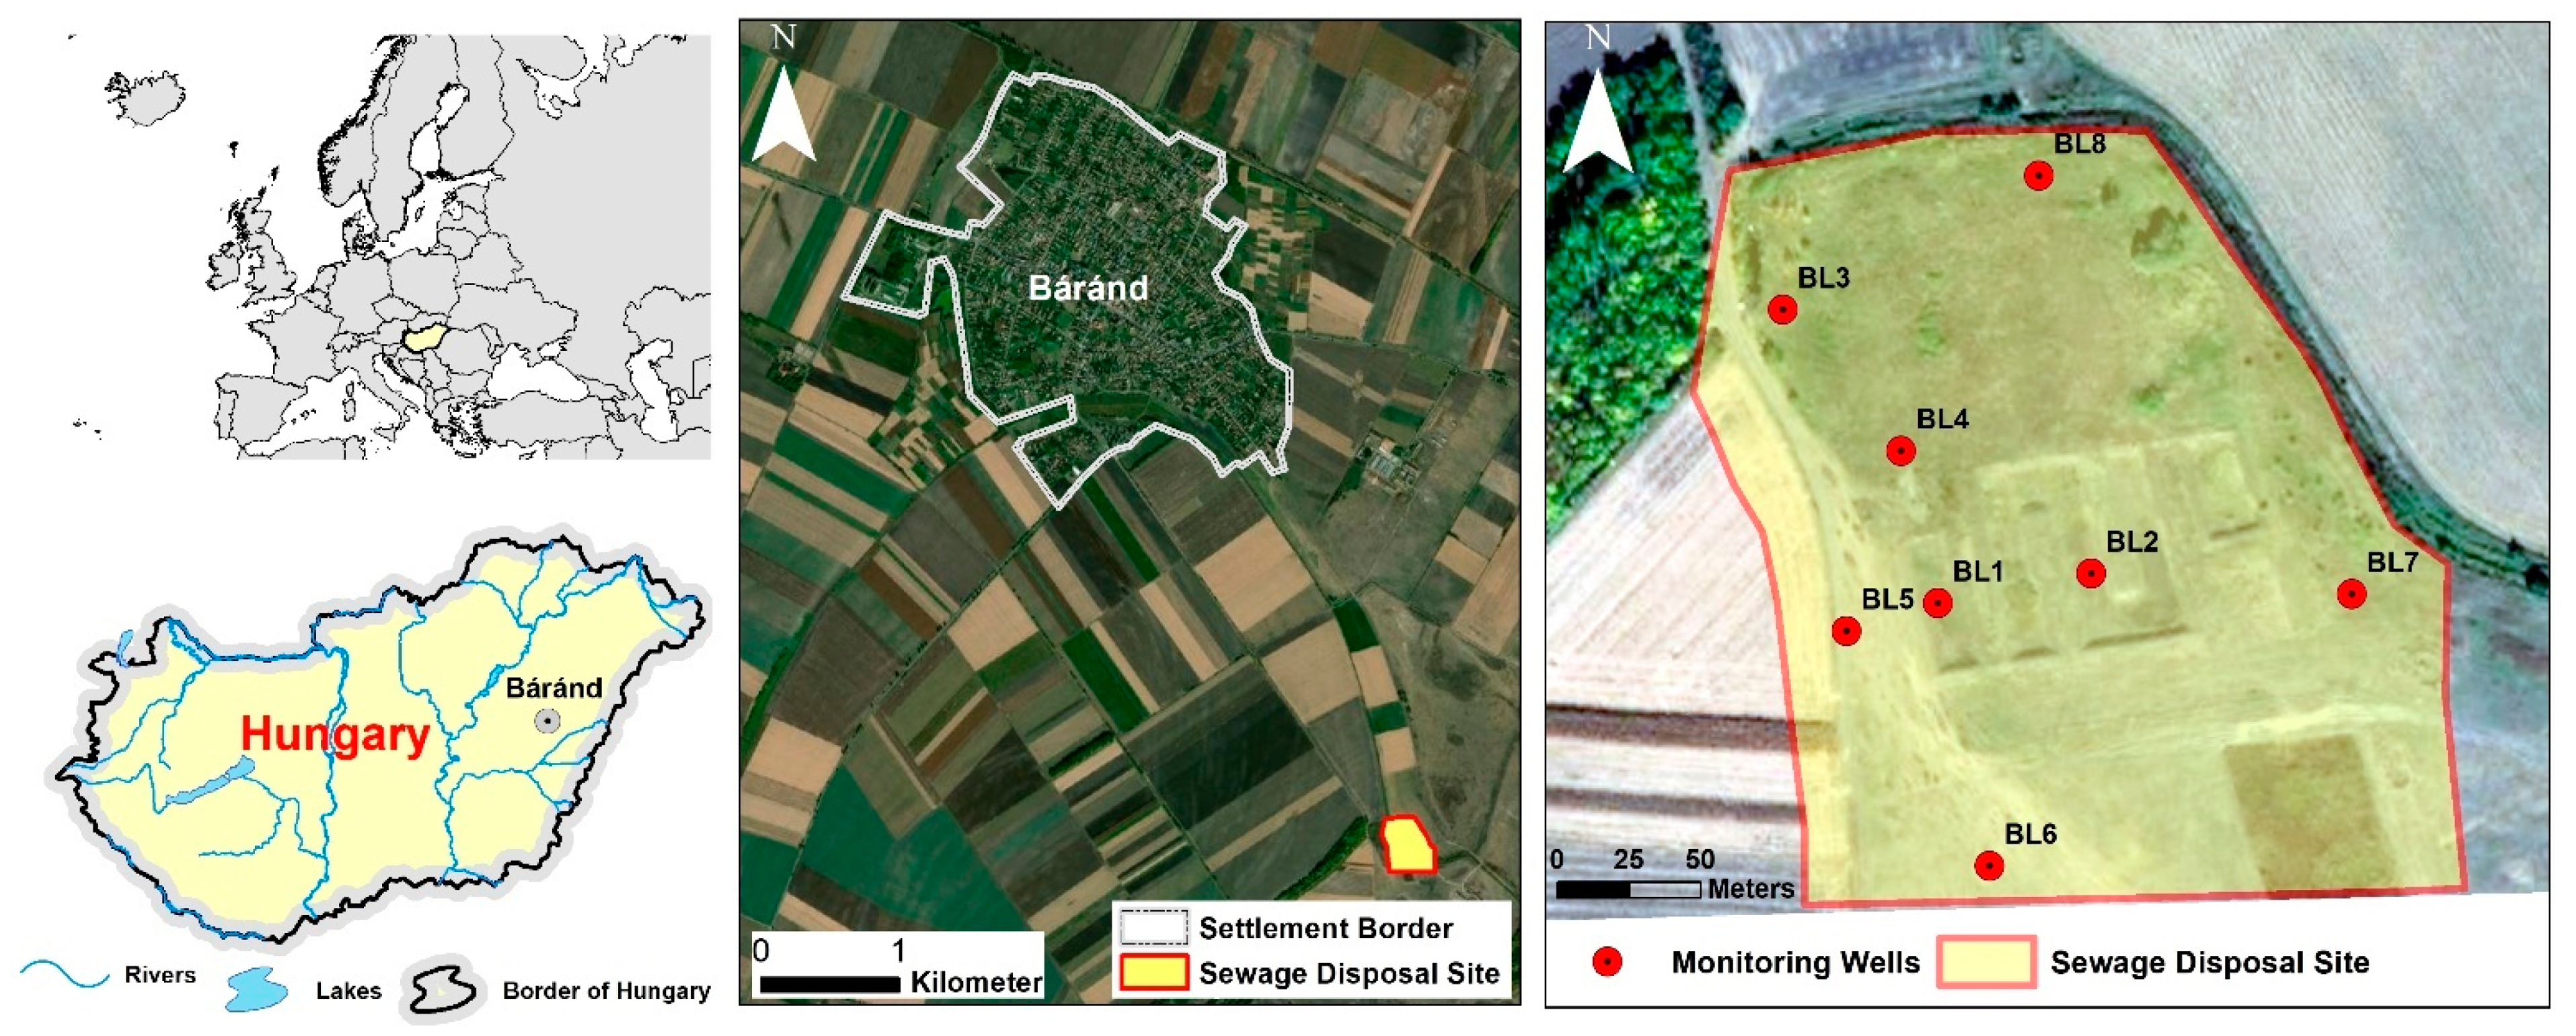
The municipal liquid waste disposal of the settlement at Báránd is located in the eastern part of the Great Hungarian Plain, in the Nagy-Sárrét region (Figure 1). The area is part of the alluvial deposit of the Sebes-Körös River, which is classified as a flat plain, with an average altitude of 85–89 m above sea level. Due to the closeness of the groundwater level to the surface, the majority of the soils in the area (Vertisol, Solonetz, Chernozem, Kastanozem according to WRB) were formed under the influence of water [40]. Among the soils under direct influence of water, saline soils are extensive, covering 36% of the total area. Meadow chernozem soils not under direct groundwater influence cover 16% of the area. The climate (Cfb) is moderately warm and dry, with an average precipitation of 520–540 mm per year [41].
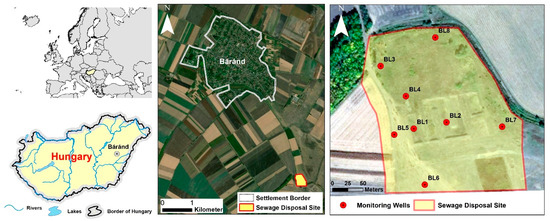
Figure 1.
Location of the liquid waste disposal site and the monitoring wells.
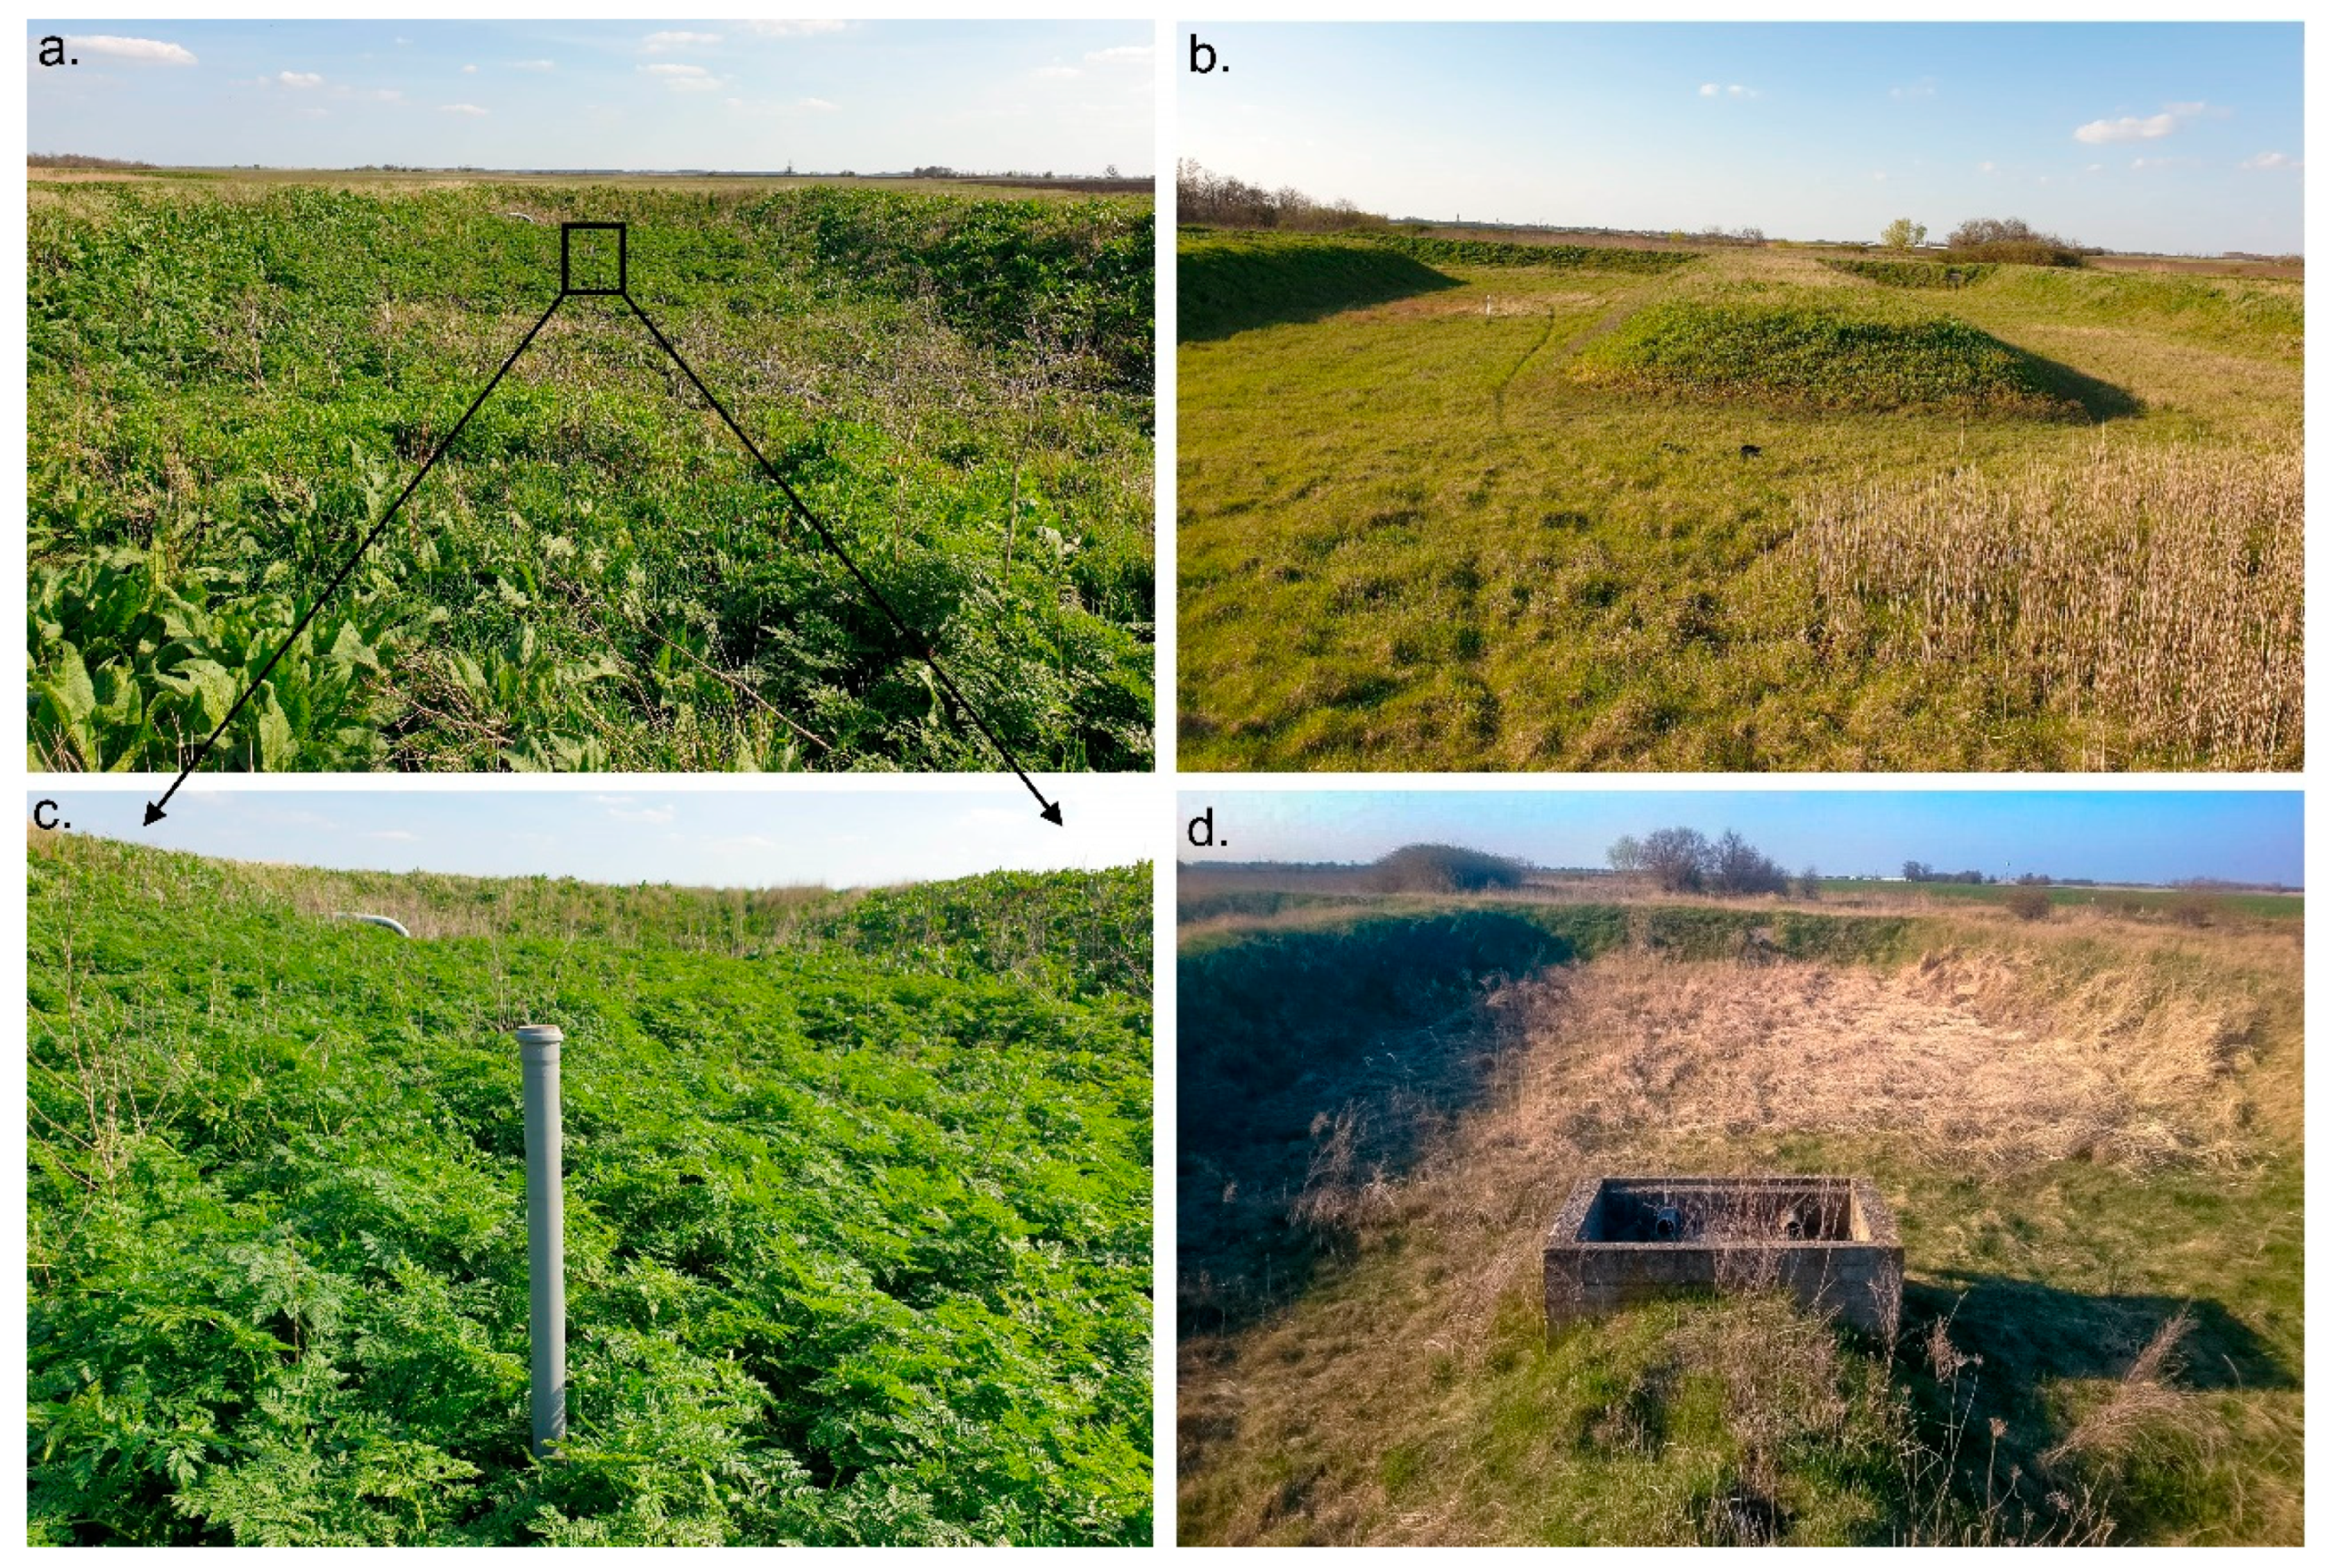
As regards the flora of the area, perennial and annual herbaceous plants that are nitrophilic and indicative of disturbance are typical. Plant cover is close to 100%, with negligible annual weeds. Typical dicots are stinging nettle (Urtica dioica), poison hemlock (Conium maculatum), broad-leaved dock (Rumex obtusifolius) and greater burdock (Arctium lappa) (Figure 2). Woody shrubs such as dog rose (Rosa canina) and Populus seedlings are also present in the area.
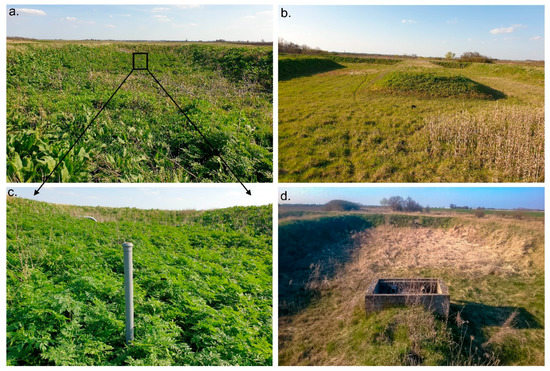
Figure 2.
The present state of the liquid waste disposal. (a) Infiltration basin; (b) oxidation basin; (c) nitrophilic vegetation in the infiltration basin. (d) last oxidation basin.
Between 1990 and 2020, the population of the municipality ranged between 2907 and 2611 inhabitants, with a continuous decreasing tendency [42]. The annual water extraction of the municipality has been between 90,000 and 120,000 m3 over the last decade, of which 70,000–90,000 m3 was supplied for domestic use. Since the municipality has sewage discharges of more than 2000 inhabitants’ equivalent, a sewerage system was constructed in 2014 in accordance with the relevant legislation.
The liquid waste disposal, located approx. 1.5 km southeast of the municipality, was authorized in 1992 and operation started in 1994 (Figure 2). During the operating period between 1994 and 2010, wastewater generated in the settlement was transported to the site and disposed in the basins without any insulation, which resulted in wastewater leaking directly into the soil and reaching the groundwater without proper treatment. In accordance with environmental legislation, from 2010 the wastewater generated in the municipality was transferred to the wastewater treatment plant in the neighbouring town. The liquid waste disposal was subsequently decommissioned, and the site has not been restored to its original state, so the established infrastructure is still in situ at present.
The wastewater was discharged into the infiltration basin at a volume of 100 m3. After the separation and sedimentation phases, the liquid phase was transferred to the oxidation basin by the gravity method. A wide oxidation basin with a volume of 3600 m3 provided a large water surface for the necessary oxygen required for the biological purification processes. The biologically treated wastewater flowed to the third basin for further treatment, from where it was discharged into the area through drainage pipes. Concrete and reliable data on the volume of disposed wastewater are not available—only approximations can be made. One municipal report estimated the annual volume at 4000 m3, which is certainly a significant underestimation compared to the approximately 100,000 m3 of wastewater generated in the municipality, even if a considerable amount of wastewater leaks from uninsulated household sewage tanks [43].
2.2. Field Sampling and Laboratory Analysis
In order to identify the environmental impact of the landfill, 8 monitoring wells were established in its vicinity at a depth of 5 m (Figure 1). The well BL1 was located in the middle of the infiltration basin, which was expected to be the most contaminated part of the area. The well BL2 was located in the oxidation basin and the other six wells were constructed in the vicinity of the disposal site. The BL7 monitoring well was selected as a control due to its considerable distance from the BL1 well and the absence of nitrophilic vegetation. The wells were designed with a filtered part in the lower 1-metre section of the PVC pipe. Soil samples were collected at every 20 cm in the borehole profile during construction using Eijkelkamp (Eijkelkamp Soil & Water, Giesbeek, The Netherlands) hand auger. Water sampling from the monitoring wells in the summers of 2020 and 2021 was carried out following the extraction of water three times the well volume, according to the MSZ ISO 21464:1998 standard using Eijkelkamp peristaltic pump 12 Vdc.
The results of field measurements with a Satlab SL300 GPS device (SatLab Geosolutions, Vastra Frolunda, Sweden) were used to create a digital elevation model for the disposal site and its surroundings and to determine the absolute height of groundwater levels.
Concentrations of inorganic parameters were determined by standard procedures according to Hungarian Standards (HS ISO 7150-1:1992; HS 1484-13:2009): determination of NH4+ was carried out with Nessler reagent, NO2− with α-naphthyl amine reagent, NO3− with sodium salicylate method, PO43− with ammonium molybdate, SO42− with BaCl2 and K2CrO4 in aqueous solutions by UV-Vis spectrophotometer. Measurement of Cl− was performed by the AgNO3-based colorimetric method. Electrical conductivity (μS/cm) and pH were determined with a Consort C3010 multi-parameter analyser, (Consort bvba, Turnhout, Belgium). The Chemical Oxygen Demand (COD) was determined using the KMnO4 method. The results were assessed on the basis of the relevant limits of the Joint Regulation KvVM-EüM-FVM No 6/2009 (IV. 14) (Table 1).

Table 1.
Contamination limit of the investigated parameters according to Hungarian legislation (Joint Regulation KvVM-EüM-FVM No 6/2009 (IV. 14).
In the course of soil analysis, the soil texture was determined based on the Köhn pipette method [44]. Electrical conductivity (EC) was measured in the 1:2.5 soil:water extract with a Consort C3010 multi-parameter analyser, (Consort bvba, Turnhout, Belgium). Soil organic matter content was determined by the bichromate oxidation method (by Tyurin). Soil phosphate content was measured by ammonium lactate extraction and nitrate content was measured by distilled water extraction using UV-Vis spectrophotometer based on the relevant standard (MSZ 20135:1999).
The quantitative analysis of the element content of the water samples from BL1 and BL2 monitoring wells was carried out by microwave plasma atomic emission spectrometry (MP-AES 4200, Agilent Technologies, Santa Clara, CA, USA). The plasma gas was continuously supplied during measurement by a nitrogen generator (Agilent Technologies 4107, Santa Clara, CA, USA). The MP-AES instrument operates with a vertical torch alignment together with an axial observation position. Standards, as well as sample solutions, were introduced by an autosampler (SPS, Agilent Technologies, Santa Clara, CA, USA) with 30 s of rinsing between each by 0.1 M HNO3 prepared in ultrapure water. Standard solutions of the macro elements (Ca, K, Mg, Na) were prepared from the mono element spectroscopic standard of 1000 mg/L (Scharlau), while the micro elements (Al, Ba, Cu, Co, Cr, Fe, Mn, Ni, Pb, Sr, Zn) were from the multi element spectroscopic standard solution of 1000 mg/L (ICP IV, Merck, Kenilworth, NJ, USA). In both cases, a 5-point calibration process was used for which standard solutions were diluted with 0.1 M HNO3 prepared in ultrapure water.
2.3. Statistical Analysis and GIS
The geo-visualization of the results was performed with SPSS 26 (IBM Corp., Armonk, NY, USA) and ArcGIS 10.4.1 (Esri, Redlands, CA, USA) software, while the spatial distribution of the contaminants was with Kriging interpolation using the software Surfer 19 (Esri, Redlands, CA, USA). The anion–cation composition of groundwater was evaluated on the basis of a semi-logarithmic Schöeller–Berkaloff diagram.
Geographic information system (GIS) applications are becoming widespread for determining the spatial distribution of various water quality indicators by integrating spatial data with other geographic information [45,46]. Visualization of the results was performed using ArcGIS 10.4.1 software, and spatial distribution of pollutants was determined by Kriging interpolation using Surfer 19 software. Ordinary kriging is among the most frequently used interpolation techniques in geostatistics for unsampled sites, to create interpolated (predictive) maps. The semivariogram is used to quantify spatial dependence:
(h) indicates the semivariogram as a function of the lag distance or separation vector h between two points, N(h) represents the number of observation pairs divided by distance h, and Z(Xi) represents the random variable at position Xi [47].
The spatial distribution of different parameters can be determined according to the equation below [47]:
is the predictable value at X0 points, while n is the number of the sampled points, is the recognized value at sampled Xi points, and is the weight assigned to the sampled point.
3. Results and Discussion
3.1. Digital Elevation Model of the Disposal Site
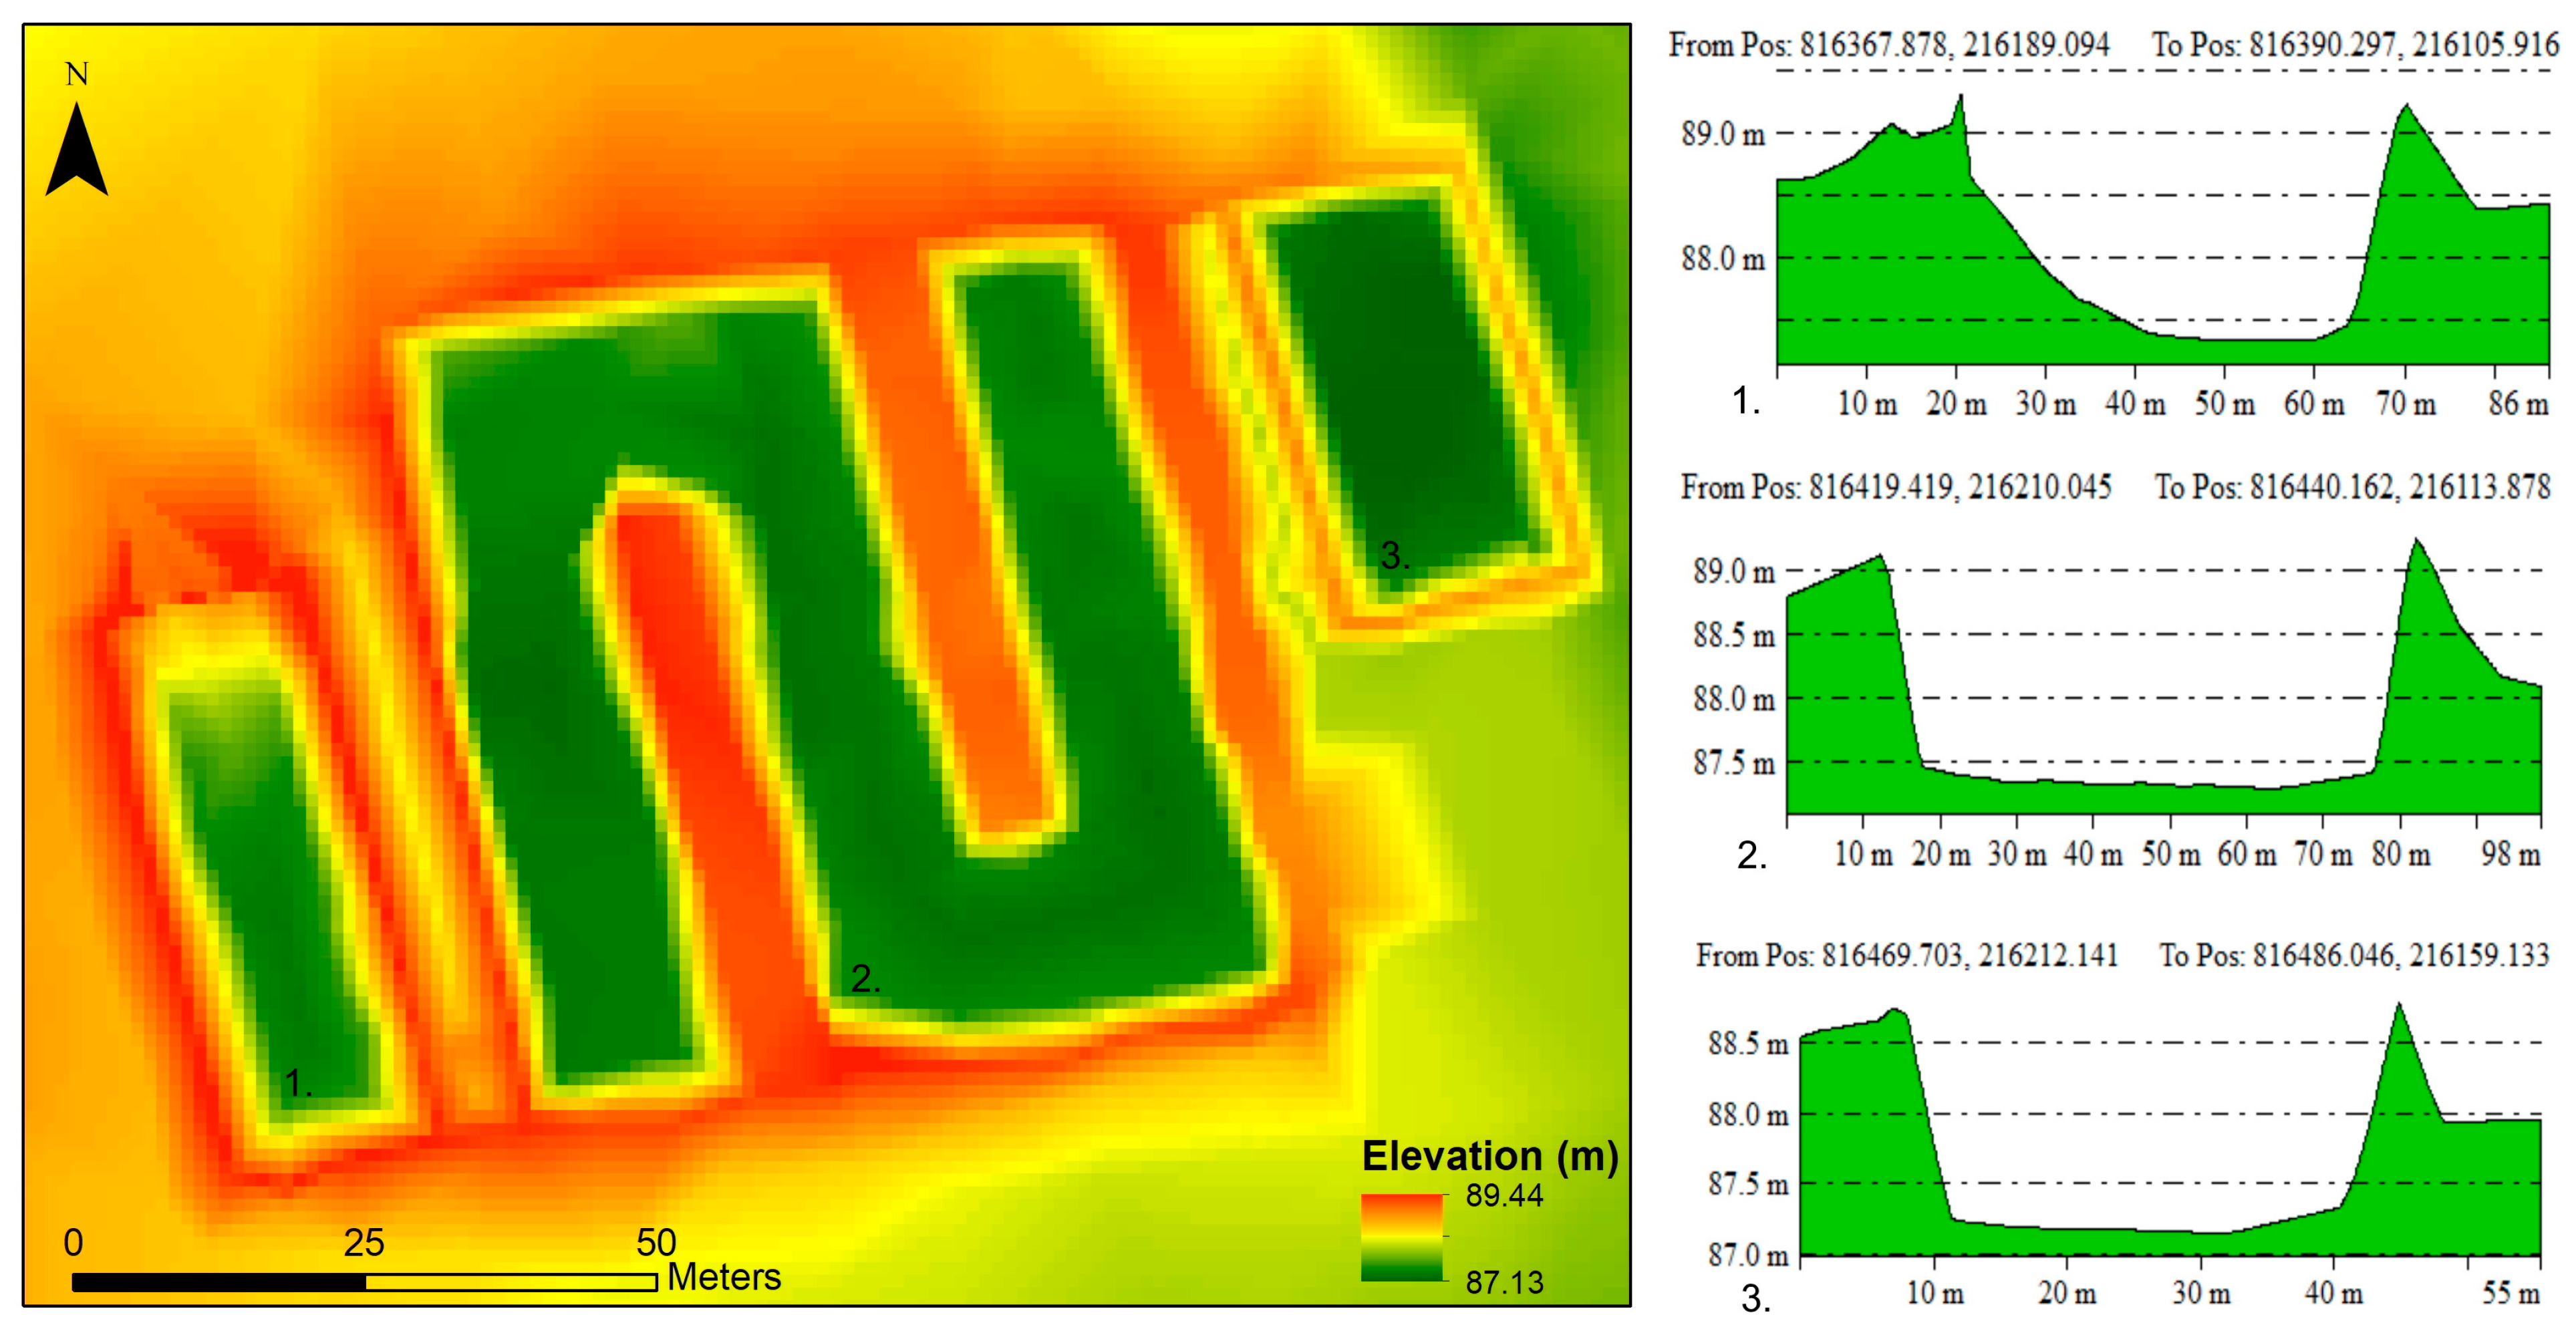
The digital elevation model created for the disposal site and its surroundings is shown in Figure 3. A longitudinal cross section was created for each basin. A significant accumulation of disposed sewage sludge on the receiving side of the first basin is clearly observable, making the shape of the basin asymmetrical. The current depth of almost 2 m is only reached in the middle of the basin. The cross section of the central stem of the second basin shows that the walls of the basin are steep on both sides, without significant accumulation. The third pool is considered the shallowest, with a depth of approximately 1.5 m (Figure 3). The soil excavated during the construction was used to create the basin dykes and to fill the surrounding area.
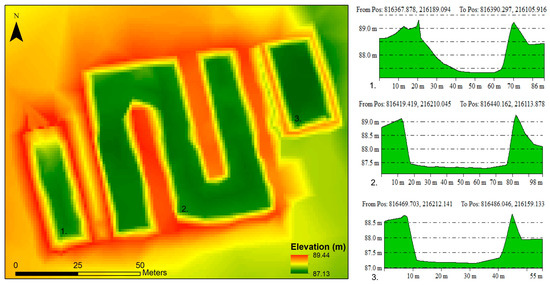
Figure 3.
Digital elevation model of the liquid waste disposal and longitudinal cross sections of the basins.
3.2. Physical and Chemical Measurements of the Soil
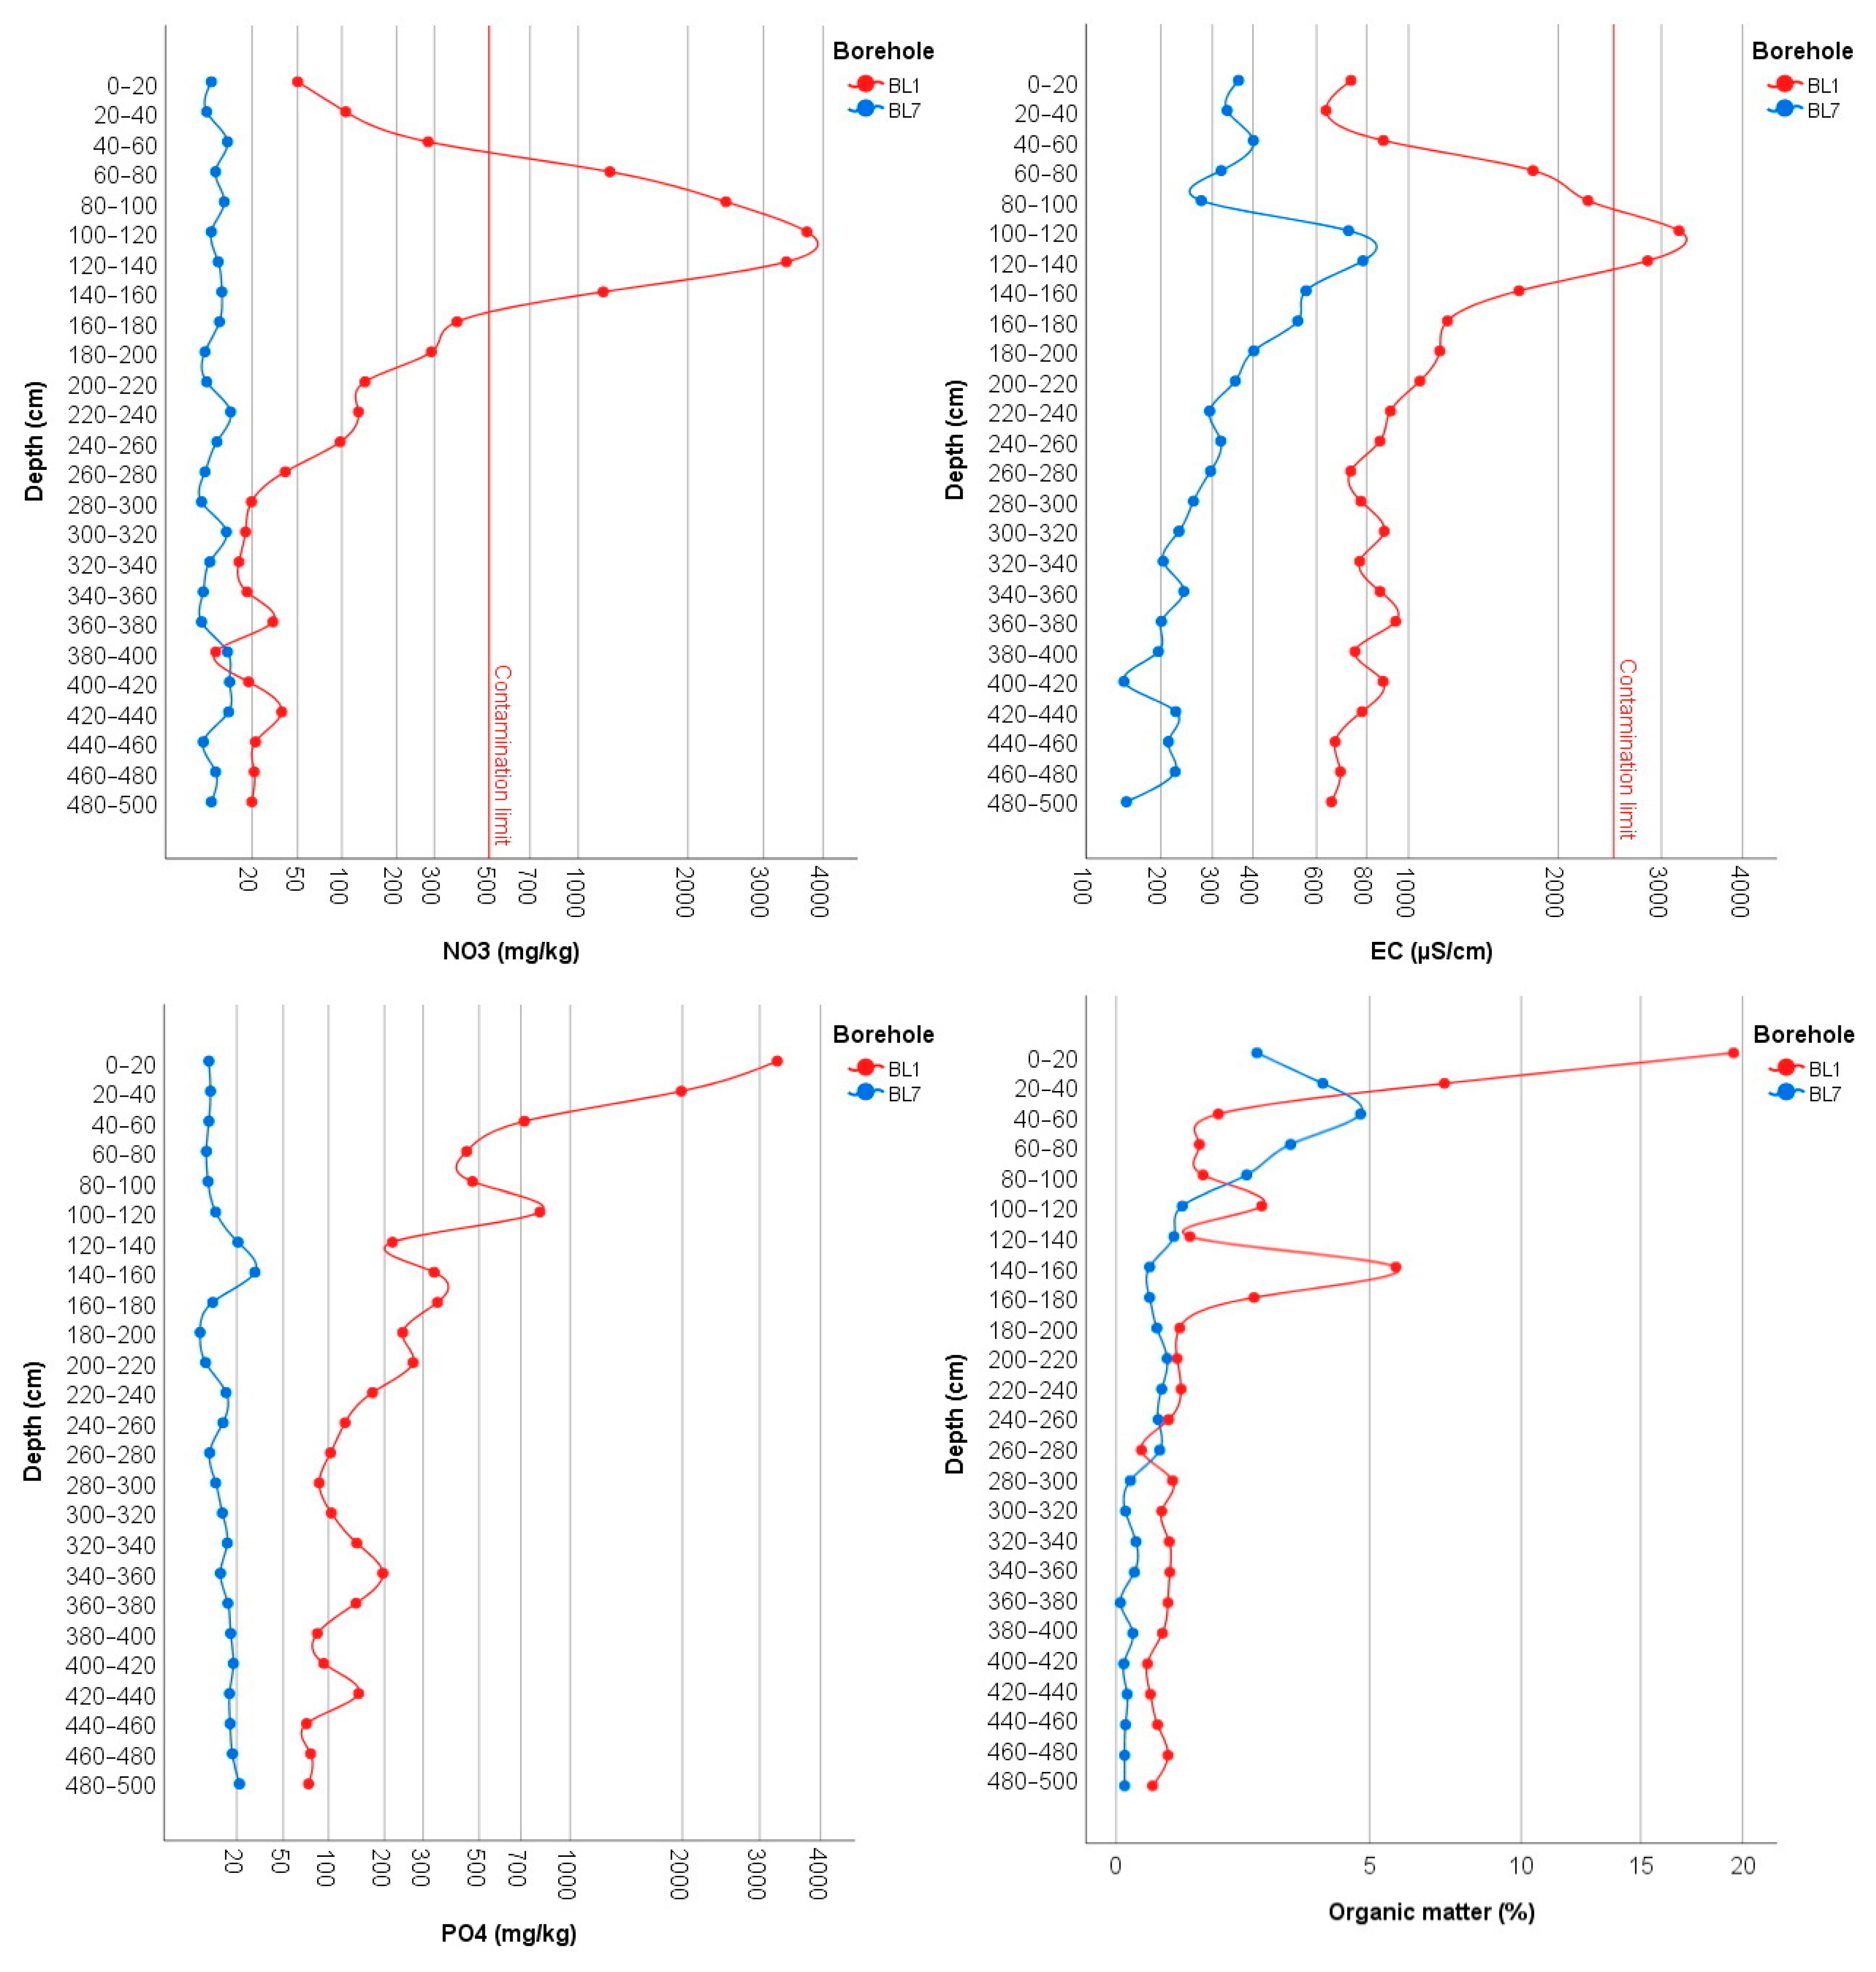
Chemical analysis of soil samples from the BL1 monitoring well, constructed in the middle of the first basin, and the BL7 monitoring well, which was used as a control, showed significant differences for all parameters measured. While NO3− concentrations in natural soils range around a few mg/kg, concentrations inside the first disposal basin significantly exceeded the 500 mg/kg contamination limit with a maximum value of 3706 mg/kg at the depth of 100–120 cm (Figure 4). The vertical distribution of NO3− values shows a characteristic leaching profile. The accumulation zone is currently located at the depth of 60–160 cm, where values are higher than 1000 mg/kg; however, due to the high solubility of NO3−, this is expected to shift with precipitation to deeper layers reaching the groundwater table. This suggests that the accumulation of inorganic nitrogen in the soil will remain a significant source of pollution for a long time in the future. In the BL7 control section no NO3− accumulation zones were observed, and concentrations were below 20 mg/kg in all layers.
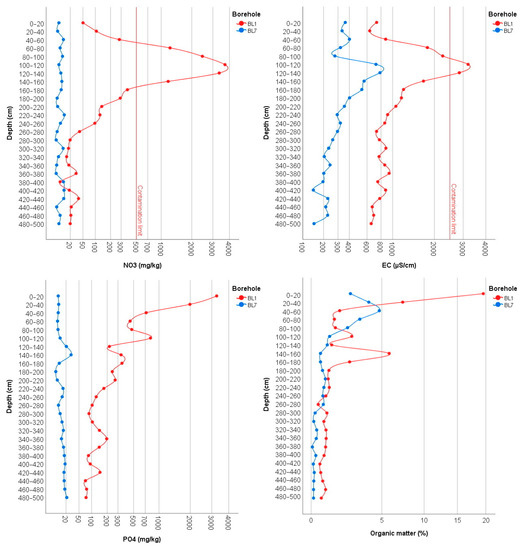
Figure 4.
The vertical distribution of NO3−, EC, PO43−, and organic matter in the monitoring wells BL1 and BL7.
The electrical conductivity (EC) measured in a 1:2.5 soil suspension in the BL1 borehole profile shows a high similarity with the vertical distribution of the nitrate values. Thus, the highest values were found in the 60–160 cm zone as well. In the control, significantly lower EC values were measured in all layers; however, higher EC values at the depth of 100–200 cm are not directly related to NO3− concentrations.
Since phosphate (PO43−) is significantly less mobile than nitrate and more strongly bound to soil particles, the distribution of PO43− within the borehole section therefore shows a different vertical distribution with highest values in the upper layers (Figure 4). Significant differences between the control BL7 and BL1 boreholes are also observed in this case; while in the BL1 well, high phosphate accumulation was detected, the accumulation in BL7 well was much lower. The upper 0–40 cm zone of the BL1 borehole was considered the most contaminated, with 3270 mg/kg at a depth of 0–20 cm and 1986 mg/kg at a depth of 20–40 cm at. Although phosphate concentrations decrease gradually in the deeper layers, at all levels in the 40–220 cm zone it is above 200 mg/kg, which also indicates considerable accumulation. In the deeper layers, two peaks are observed at depths of 340–360 cm and 420–440 cm, with values of almost 200 mg/kg. In the control section, although a PO43− peak occurs at a depth of 140–160 cm, it does not exceed 50 mg/kg.
The vertical changes in organic matter (humus) content show a similar pattern to PO43−. Organic matter of 20% in the soil of the first basin cannot be explained by natural humification processes at all; it is clearly the result of accumulated sewage sludge. The nearly 1% of organic matter measured in the deeper 300–500 cm zone indicates that organic matter is continuously leaching from the subsurface. In the control section, the highest humus content was measured at a depth of 40–60 cm, which can be explained by the fact that the original topsoil was filled with subsoil excavated from the basins.
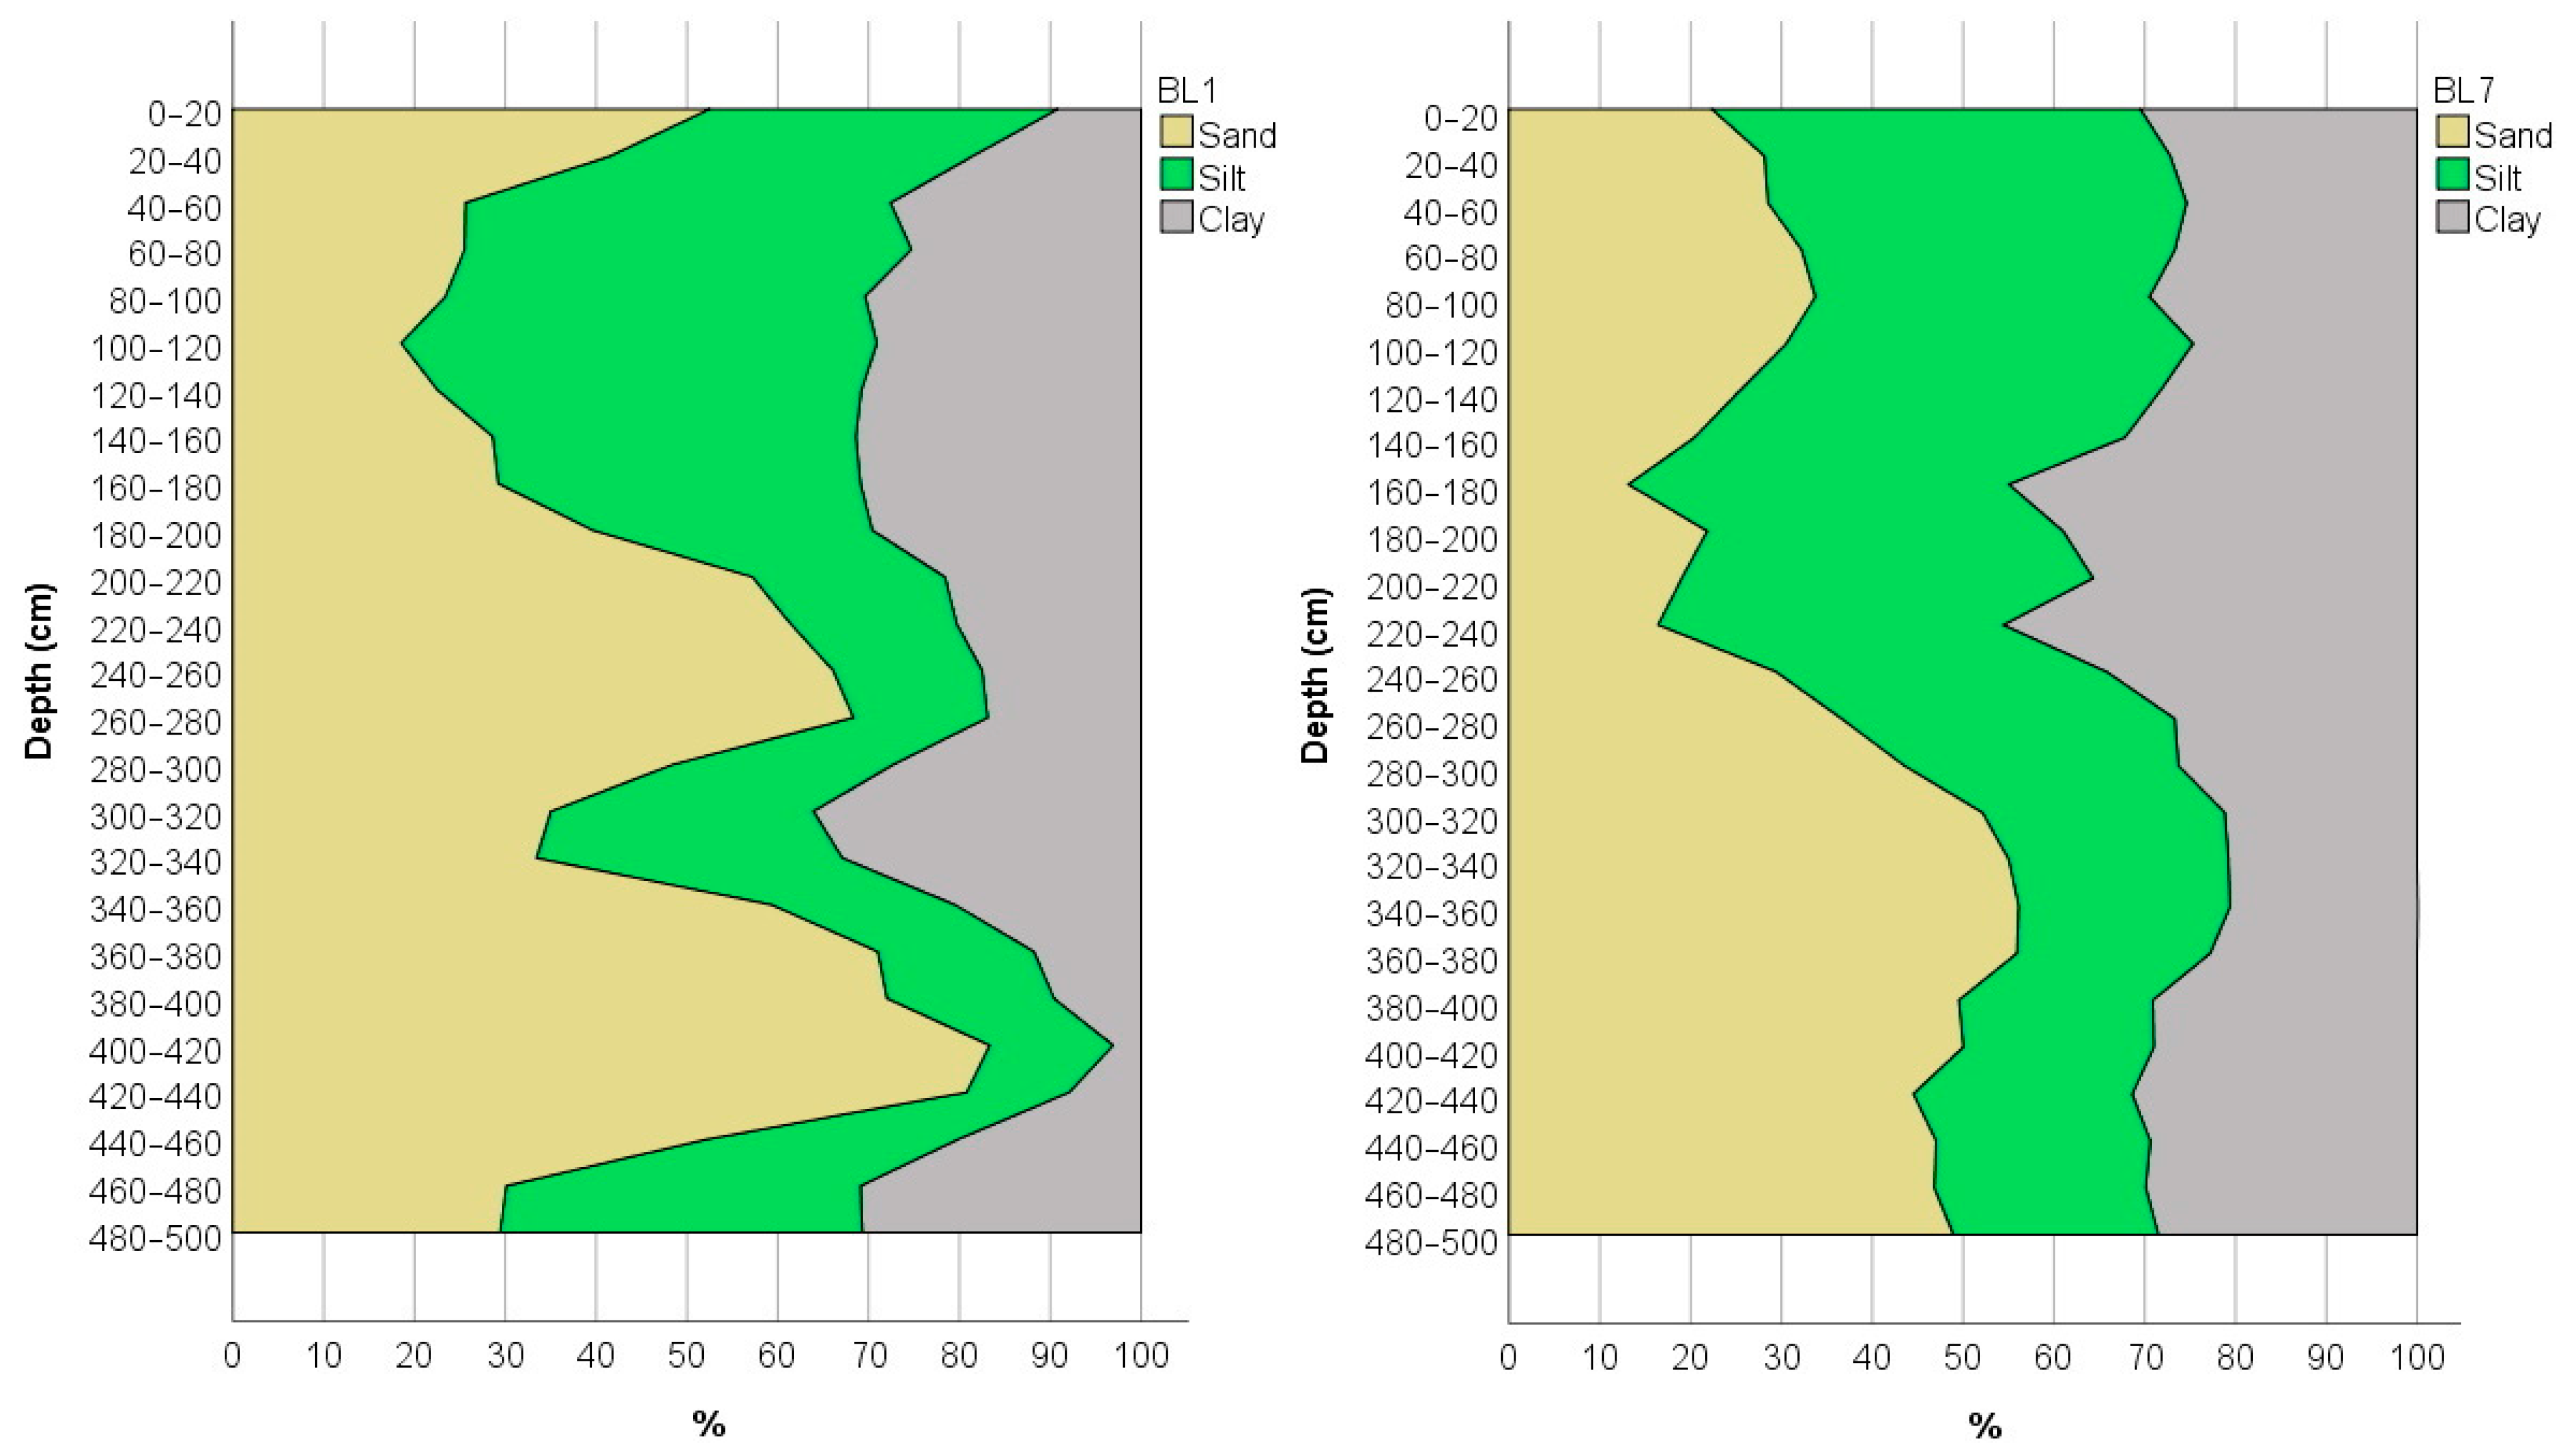
Since soil texture has a considerable influence on the spread of contamination, the mechanical composition of the soil was determined in the 5 m borehole section of the BL1 and BL7 monitoring wells (Figure 5). The results indicate that loamy soils are predominant in the sample area; however, the sand content shows significant variation. In profile BL1, the sand fraction of over 50% was measured in ten layers, while in the 400–440 cm zone it is over 80%, resulting in a loamy-sand texture. The lowest sand content was measured in the 40–180 cm zone (<30%), resulting in a clay-loam texture. The clay content varies between 3% and 36% in the borehole section. Increased sand fraction in the deeper layers (>300 cm) of the BL7 borehole section is also observed, resulting in a sandy clay loam texture. The clay content varied between 20–45%. The relatively high silt and clay content may contribute to a reduced spatial extent of contamination; however, the higher ammonium fixation capacity of clay minerals may significantly increase the presence of contamination over time [48,49].
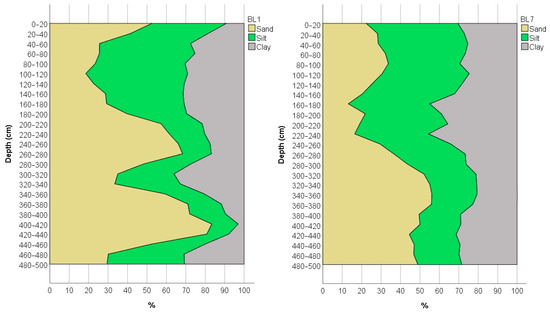
Figure 5.
Texture of the borehole profile of the monitoring well BL1, located in the first disposal basin, and well BL7, located east from the disposal basins.
3.3. Groundwater Contamination in the Area
Large amounts of raw municipal wastewater have been discharged over nearly two decades, resulting in serious contamination of the groundwater resources in the area. Anthropogenic effects were detected for all groundwater monitoring wells during sampling. The summary of the parameters measured in the summers of 2020 and 2021 are shown in Table 2.

Table 2.
Summary of the water quality parameters measured in the summers of 2020 and 2021.
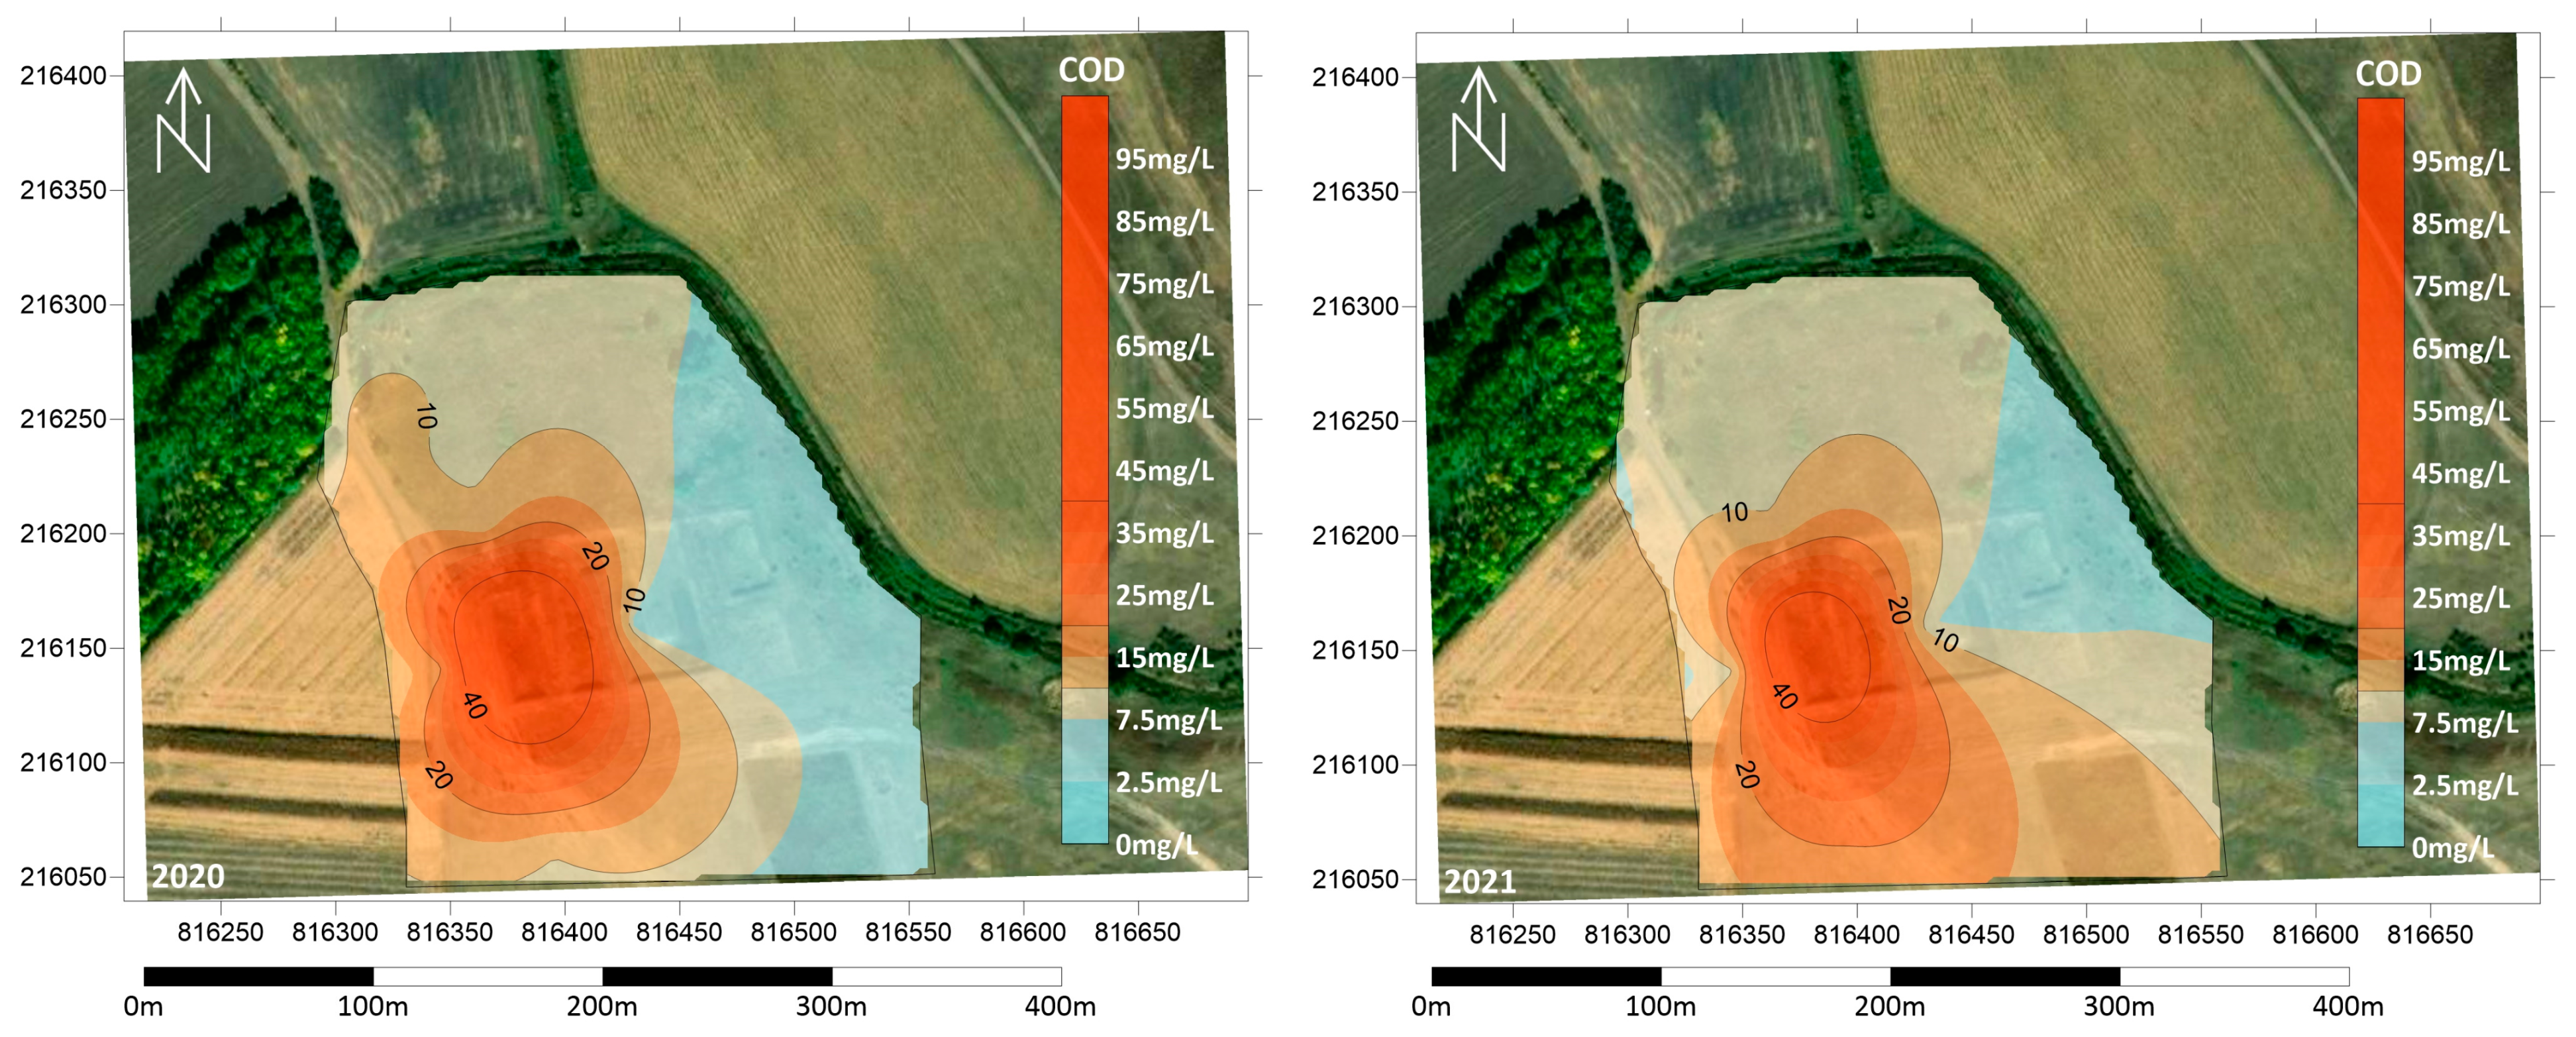
In order to determine the spatial distribution of the investigated parameters, interpolated maps were created based on the concentrations at the sampling points measured in the summers of 2020 and 2021. Domestic wastewater contains large amounts of organic matter. Ten years after the closure of the liquid waste disposal site, chemical oxygen demand (COD) values close to 100 mg/L were measured in the vicinity of the first basin for both years, indicating significant contamination (Figure 6). The values measured in all monitoring wells were above 4.5 mg/L, with concentrations above 10 mg/L in the majority of the area. The highest values were measured in wells west and south of the first basin.

Figure 6.
Texture spatial distribution of COD concentration in the summers of 2020 and 2021.
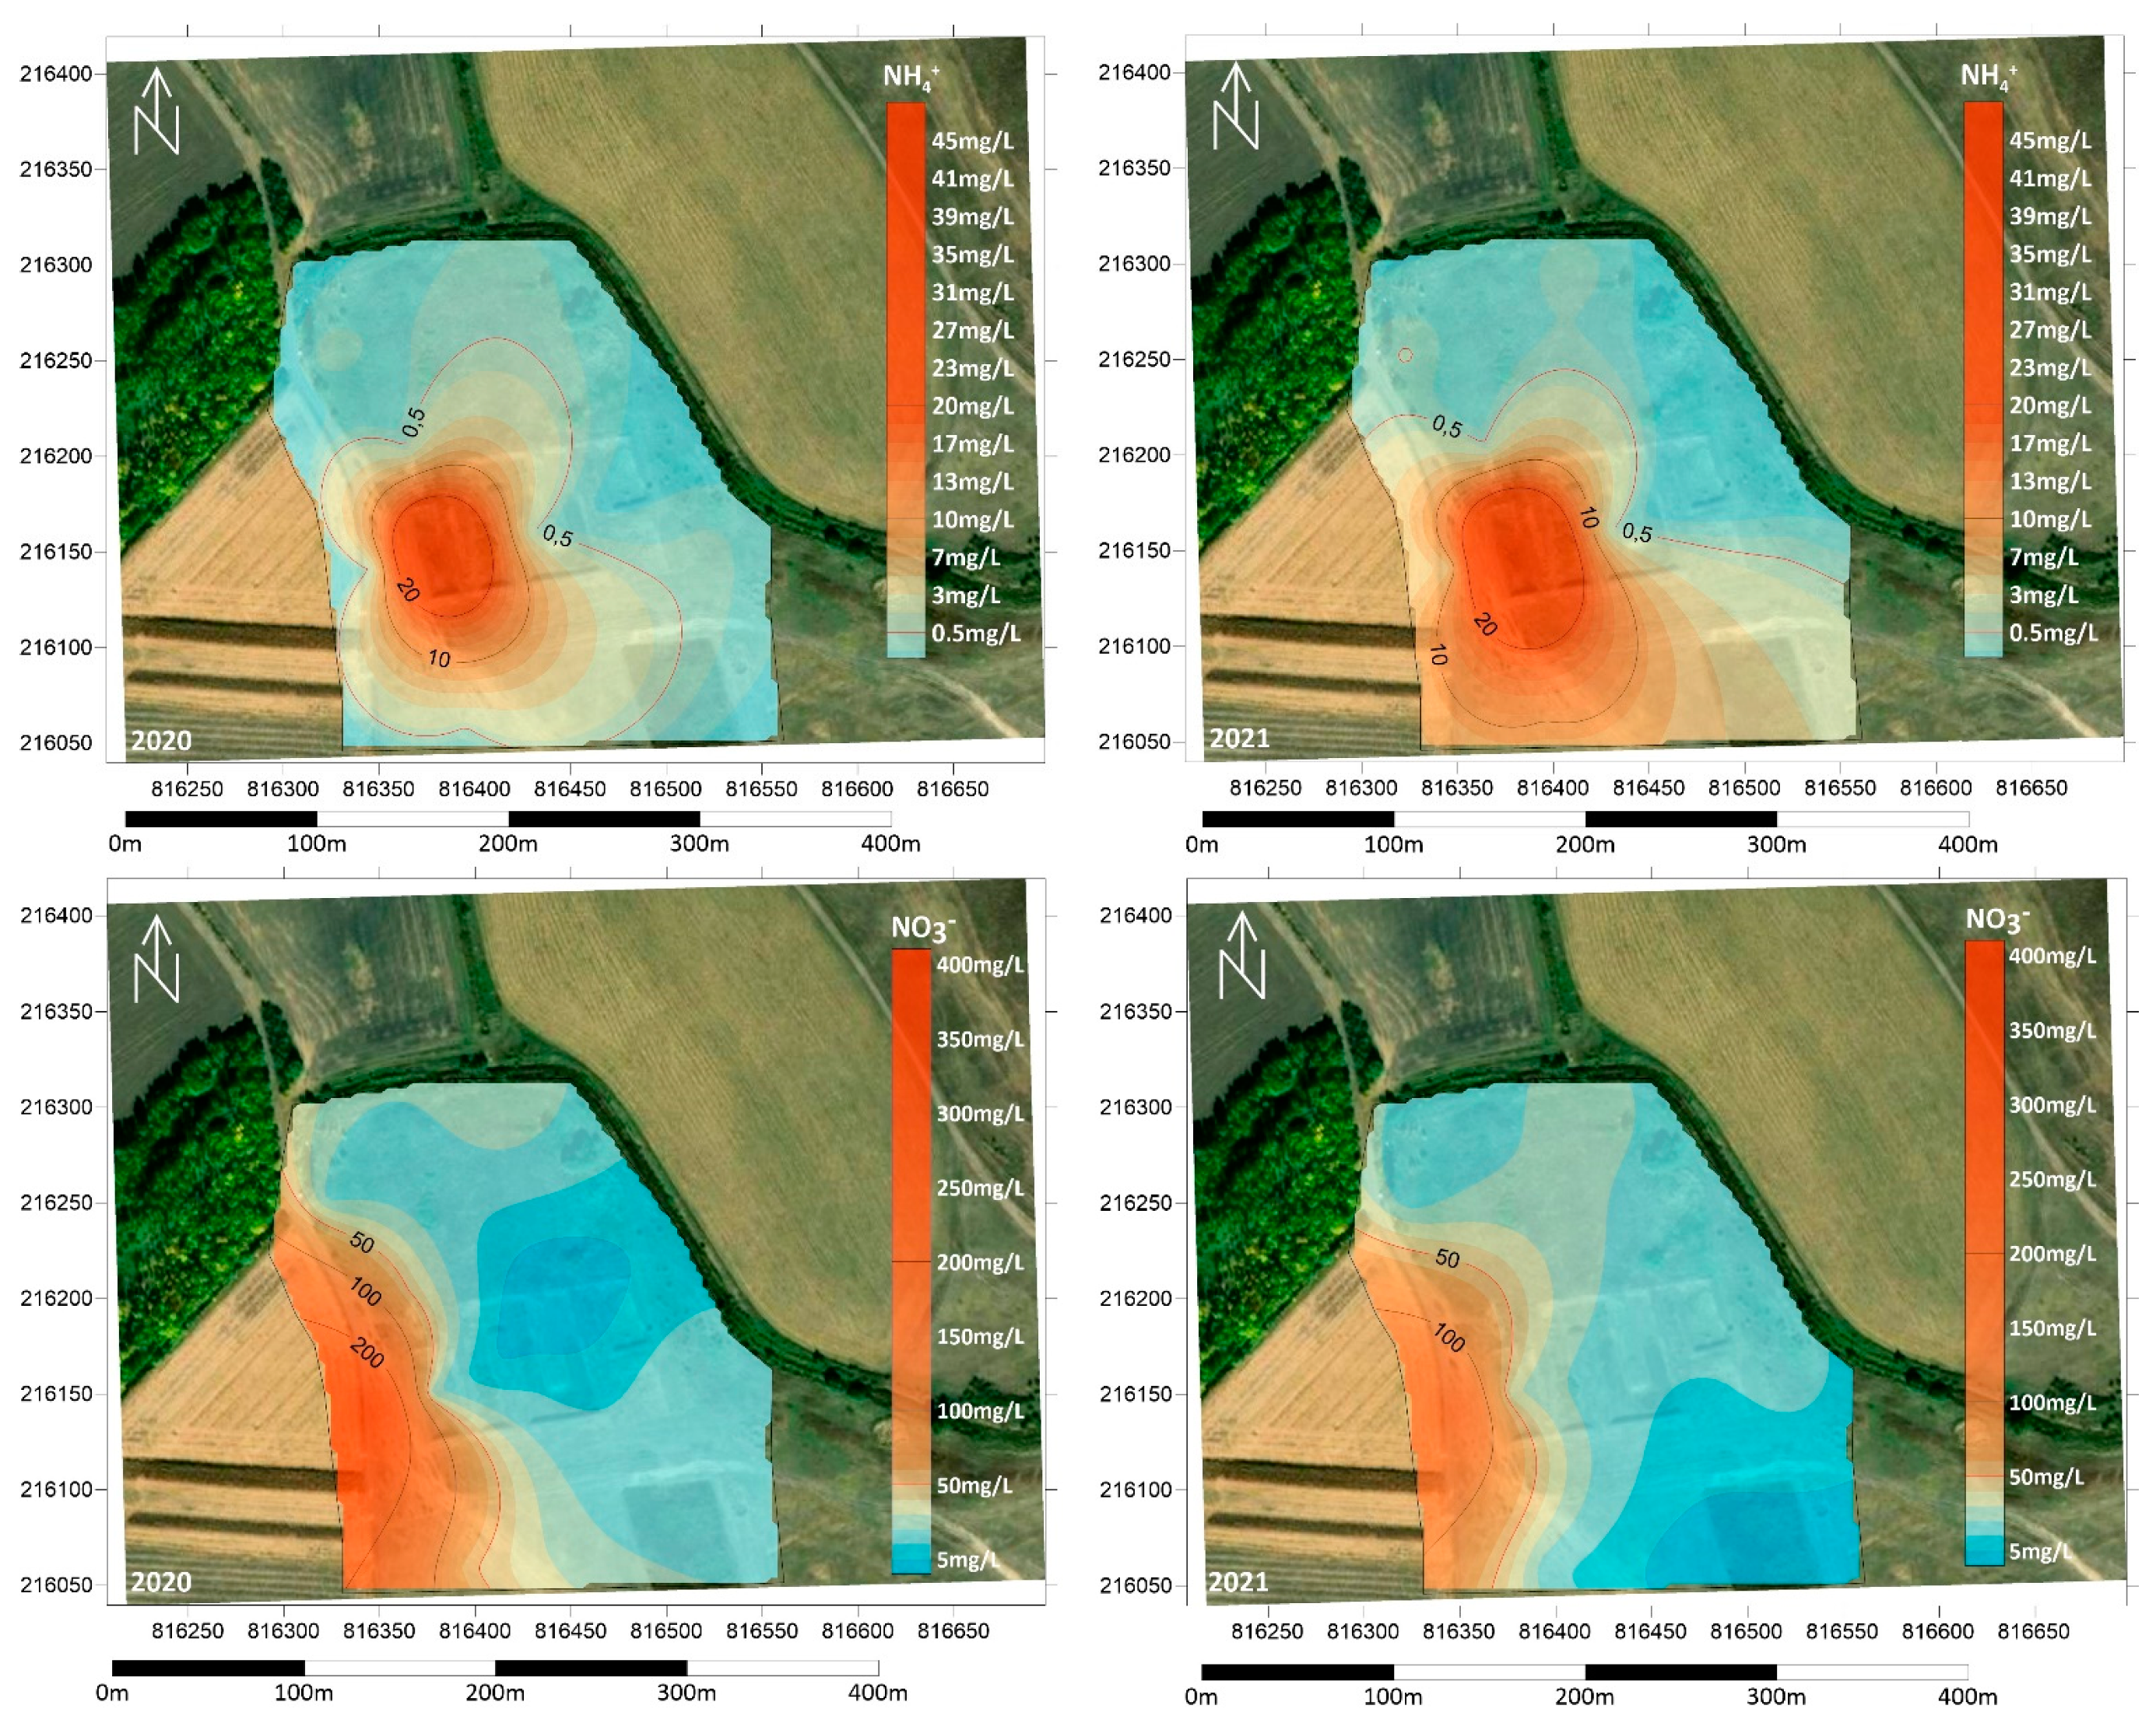
The presence of NH4+ indicates the decomposition of the organic matter content of the groundwater, which indirectly refers to wastewater load. Ammonium cannot oxidise to NO2− and then to NO3− in the presence of organic carbon and in the absence of sufficient dissolved oxygen; therefore, concentrations approximately 100 times higher than the contamination limit of 0.5 mg/L were measured in the BL1 monitoring well in the first basin (Figure 7). Concentrations of 56 mg/L were detected in the summer of 2021, and above 45 mg/L in all sampling events. NH4+ values decrease radically with distance from the infiltration basin as oxidative conditions are improved; however, concentrations are above the contamination limit in almost all monitoring wells except the furthest ones, BL7 and BL8. However, concentrations higher than 0.2 mg/L in these wells also indicate the influence of wastewater discharge.

Figure 7.
Spatial distribution of NH4+ and NO3− concentration in the summers of 2020 and 2021.
NO3− concentrations have an increasing pattern with distance from the infiltration basin, unlike the spatial distribution of NH4+ (Figure 7). The most significant increase was observed to the west, where the concentration in well BL3 was close to 400 mg/L in the summer of 2020. Concentrations above the contamination limit of 50 mg/L were also detected in well BL4 and the BL6 monitoring well located closest to the infiltration basin. The lowest values were measured in the BL7 monitoring well, with a mean of 24.5 mg/L (Figure 7).
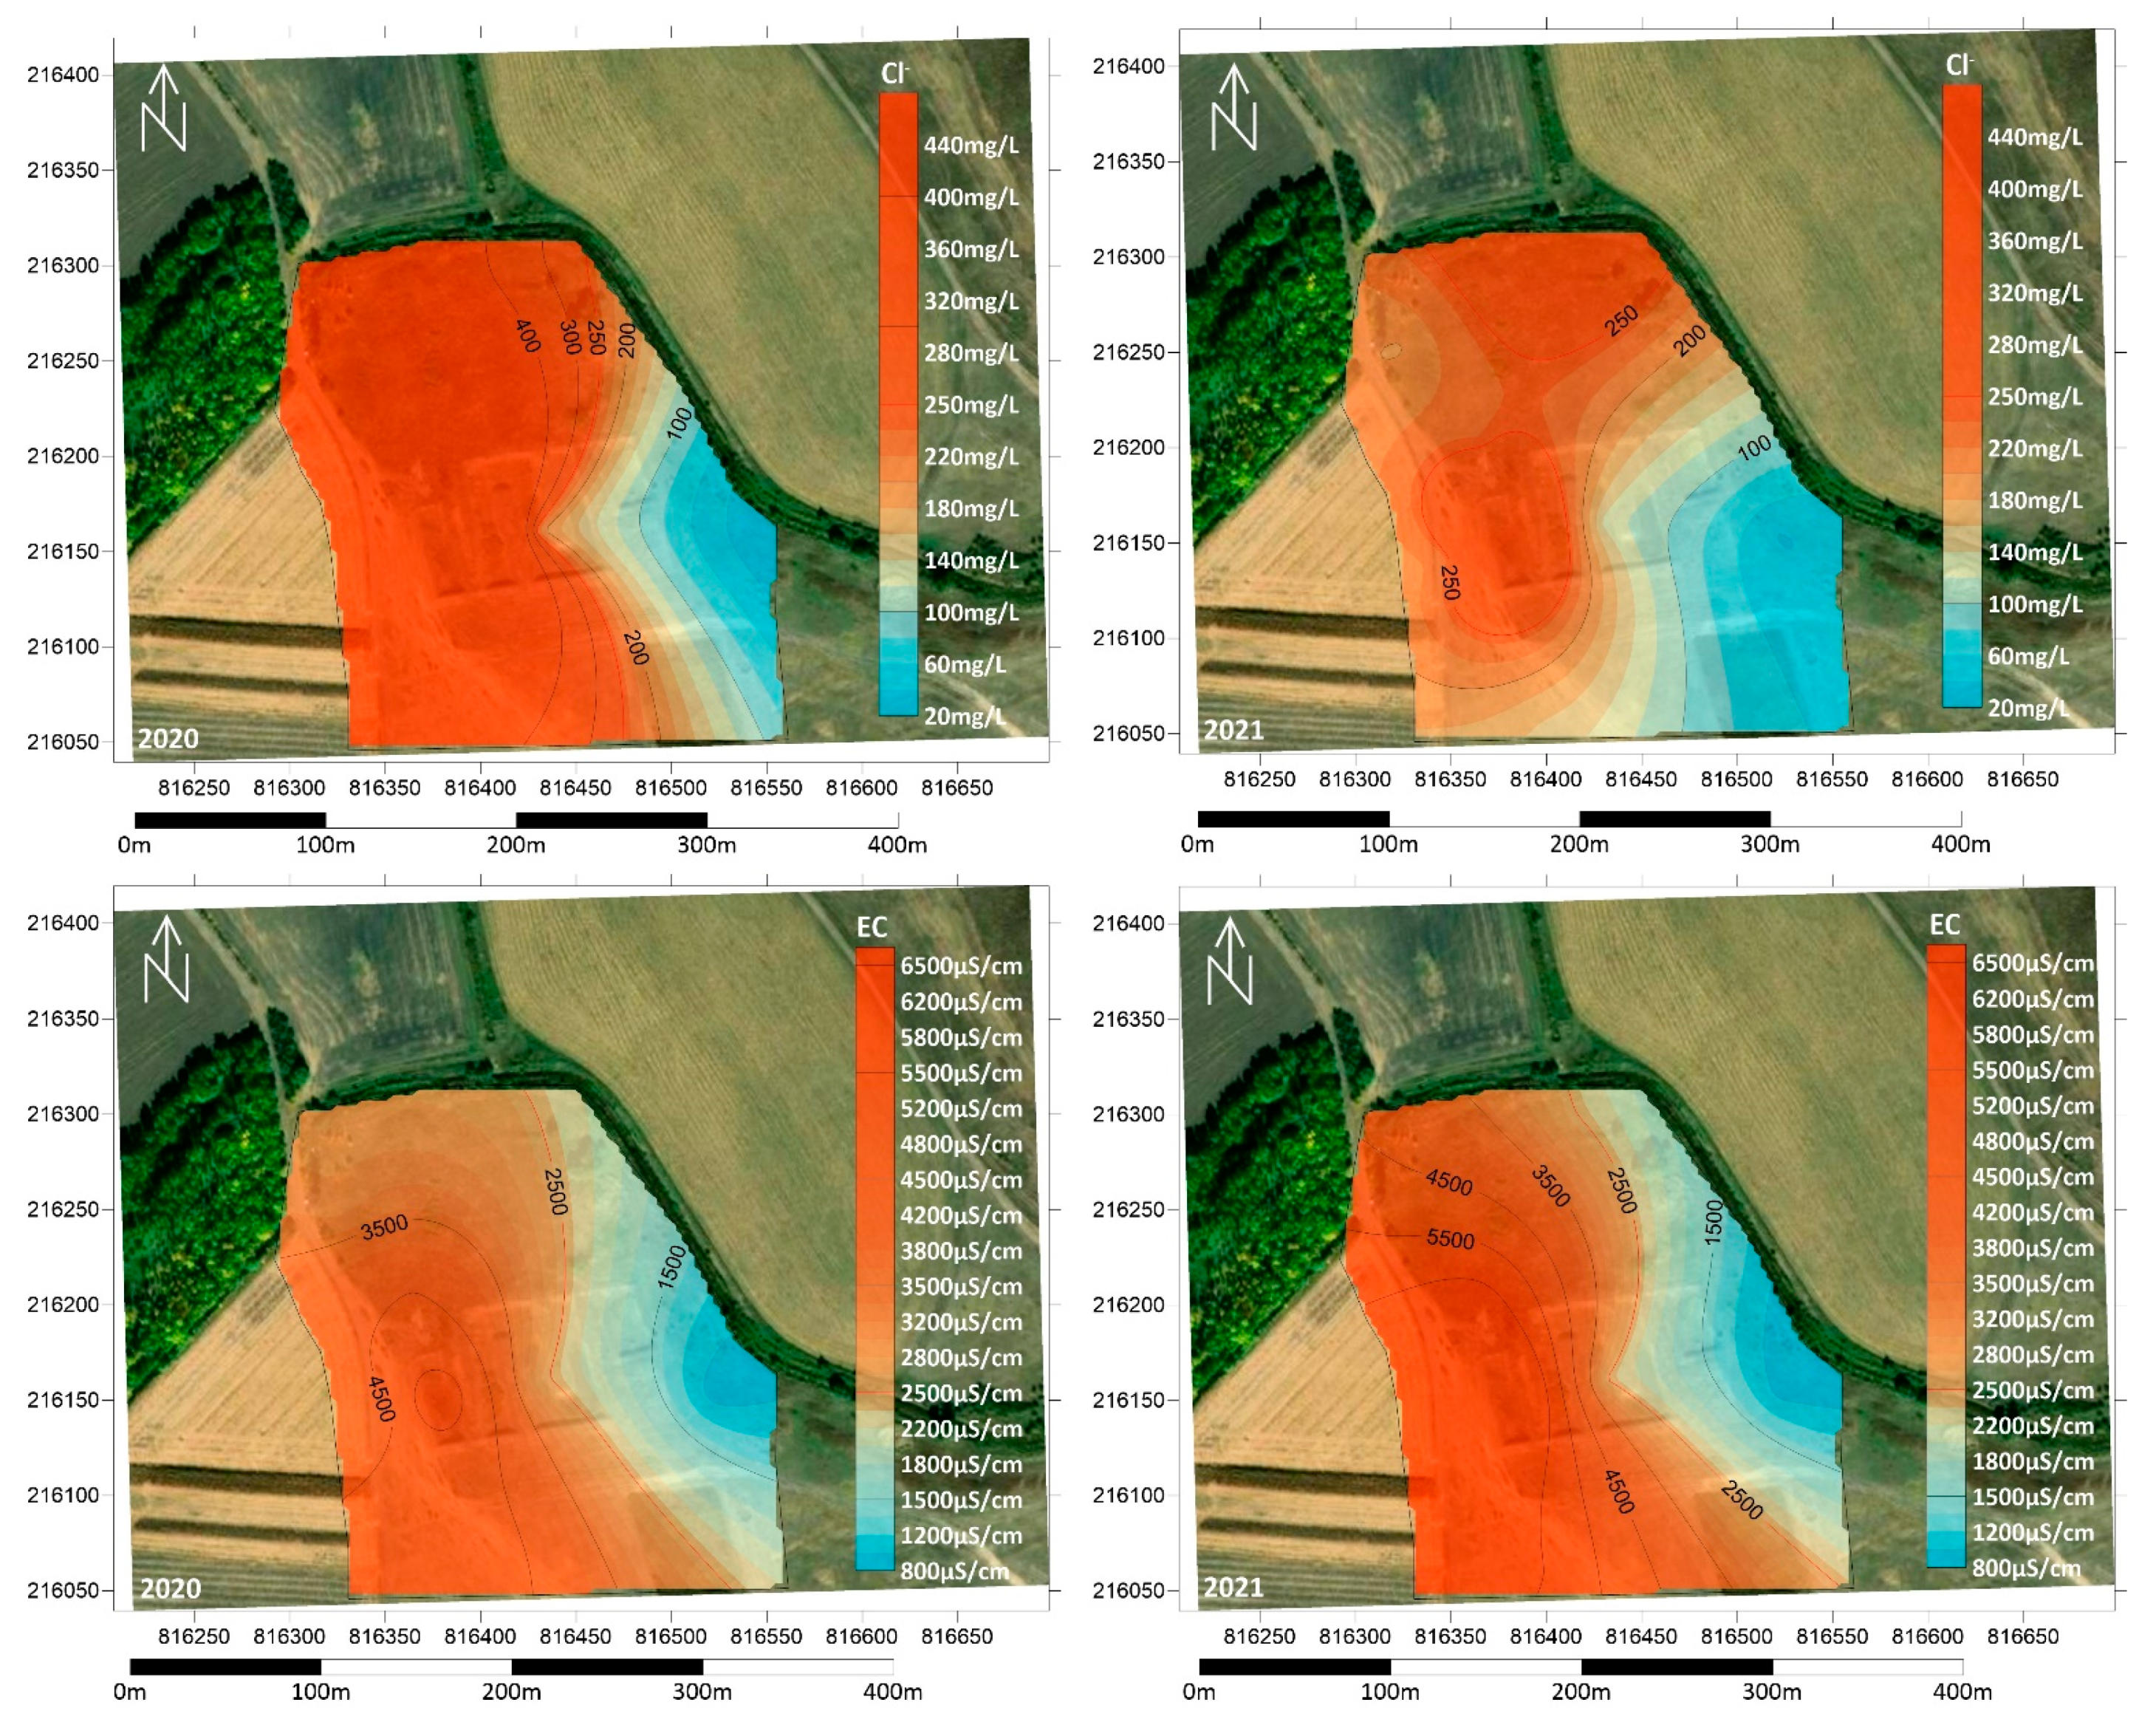
Chloride (Cl−) is readily soluble in water, and although it occurs in highly variable concentrations in natural waters, if it occurs with elevated COD or NH4+ concentrations, it indicates sewage discharge. In both years studied, the area was found to be highly contaminated with chloride, with values significantly exceeding the 250 mg/L limit (Figure 8). The only exception was well BL7, also used as a control, where the concentration was below 100 mg/L. Electrical conductivity (EC) values due to the spatial distribution of the other ions are highest in the central, south-western and east-western part of the site. The highest values fluctuated between 4000 and 9500 µS/cm. Values below the 2500 µS/cm limit were only measured in well BL7.

Figure 8.
Spatial distribution of Cl− concentration and EC in the summers of 2020 and 2021.
These results are consistent with those of other studies carried out in liquid waste disposal areas, which have shown high levels of contamination of groundwater resources [50,51,52,53]. Brennan et al. [54] investigated the impacts of landfill leachate in municipal wastewater treatment plants, and the results, similar to our measurements, showed significant concentrations of ammonium in the area. Szabó et al. [34] measured high inorganic nitrogen forms and elevated Na concentrations in a recultivated landfill environment in in the great Hungarian Plain. Consistent with our results, their results showed that pollutants continued to contaminate the area for several decades after the elimination of pollution sources.
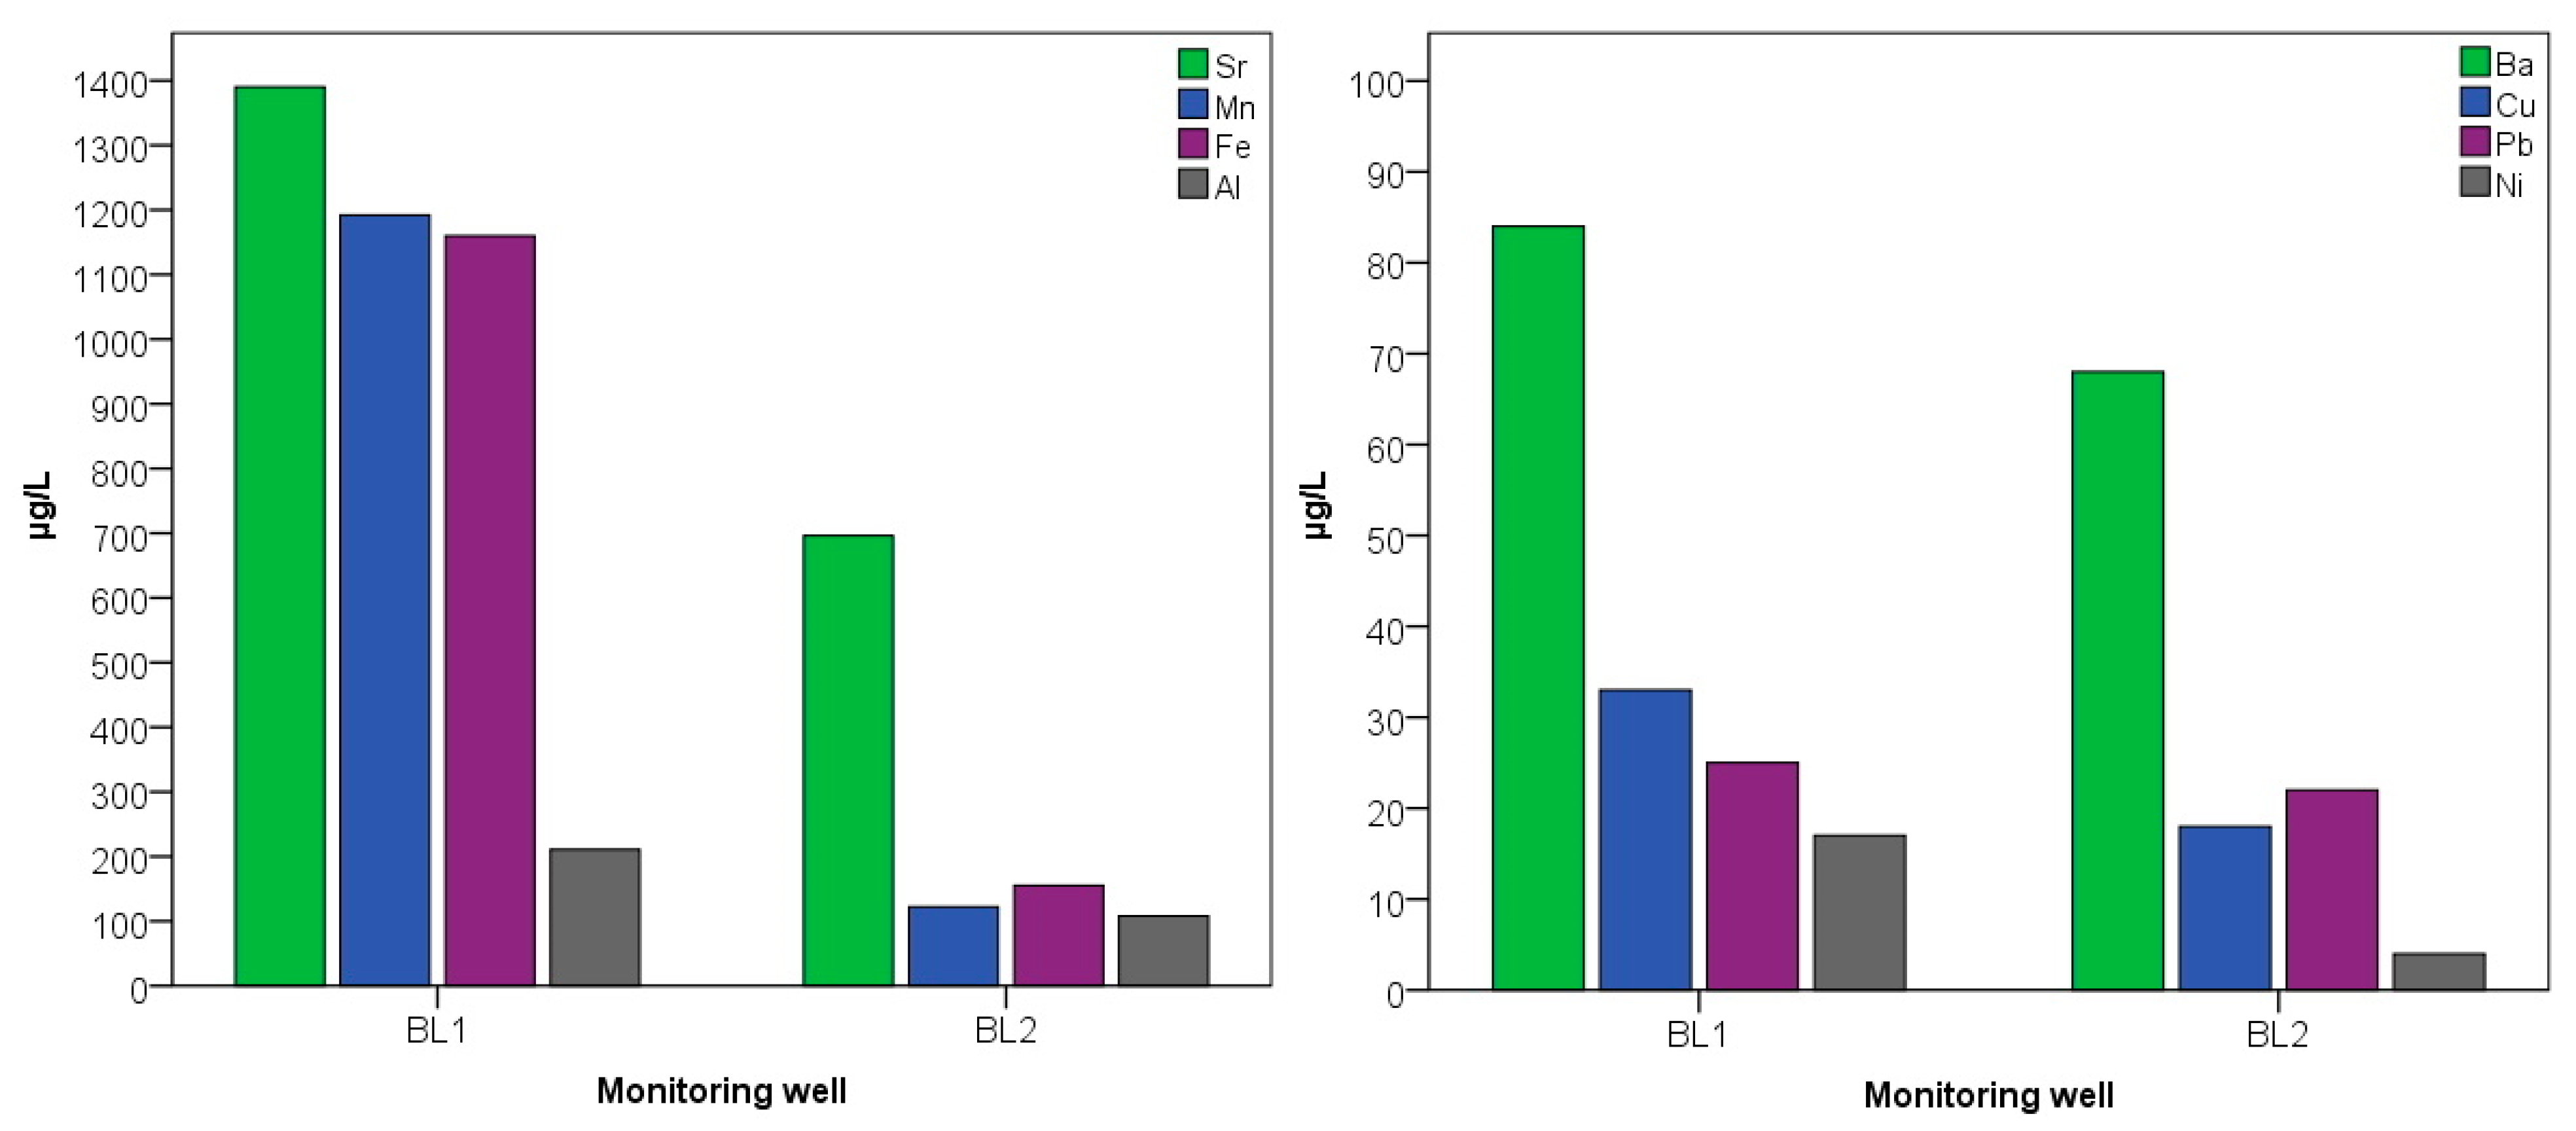
Water samples from the monitoring wells in the infiltration (BL1) and oxidation (BL2) basins were analysed for both micro (Al, Ba, Cu, Fe, Mn, Pb, Sr, Zn) and macro (Na, K, Ca, Mg) elements. Results are presented in Figure 9. For all parameters present at detectable concentrations, considerable differences were found. For microelements, manganese showed the largest difference, varying almost tenfold in the different wells. The concentration of 1920 µg/L in well BL1 decreased to 122 µg/L. The Fe concentration of 1160 µg/L in well BL1 was almost seven times higher than the 155 µg/L in well BL2. The considerable amount of Fe is derived from the high Fe content in the aquifer of the municipality used as the drinking water supply. The high strontium concentration in BL1 (1390 µg/L) was reduced by almost half in BL2 (696 µg/L). Although no values above the limit were measured for Ba, Cu, Pb and Ni, the higher values in the receiving basin may have been caused by vehicles transporting wastewater. Co, Cr and Zn were not detectable in any of the samples. By investigating the heavy metal contamination of an open land wastewater disposal site, similar to our sample area, significantly higher concentrations of iron and manganese were measured near to the source points of pollution compared to control points [55]. Industrial effluent into municipal wastewater is the main source of elevated microelement content and has been the subject of several studies [56]. Since no or only small amounts of industrial effluent have been discharged into the area, the microelement content of the water samples does not exceed the limit value.

Figure 9.
Microelement values of water samples from BL1 and BL2 monitoring wells in the summer of 2020.
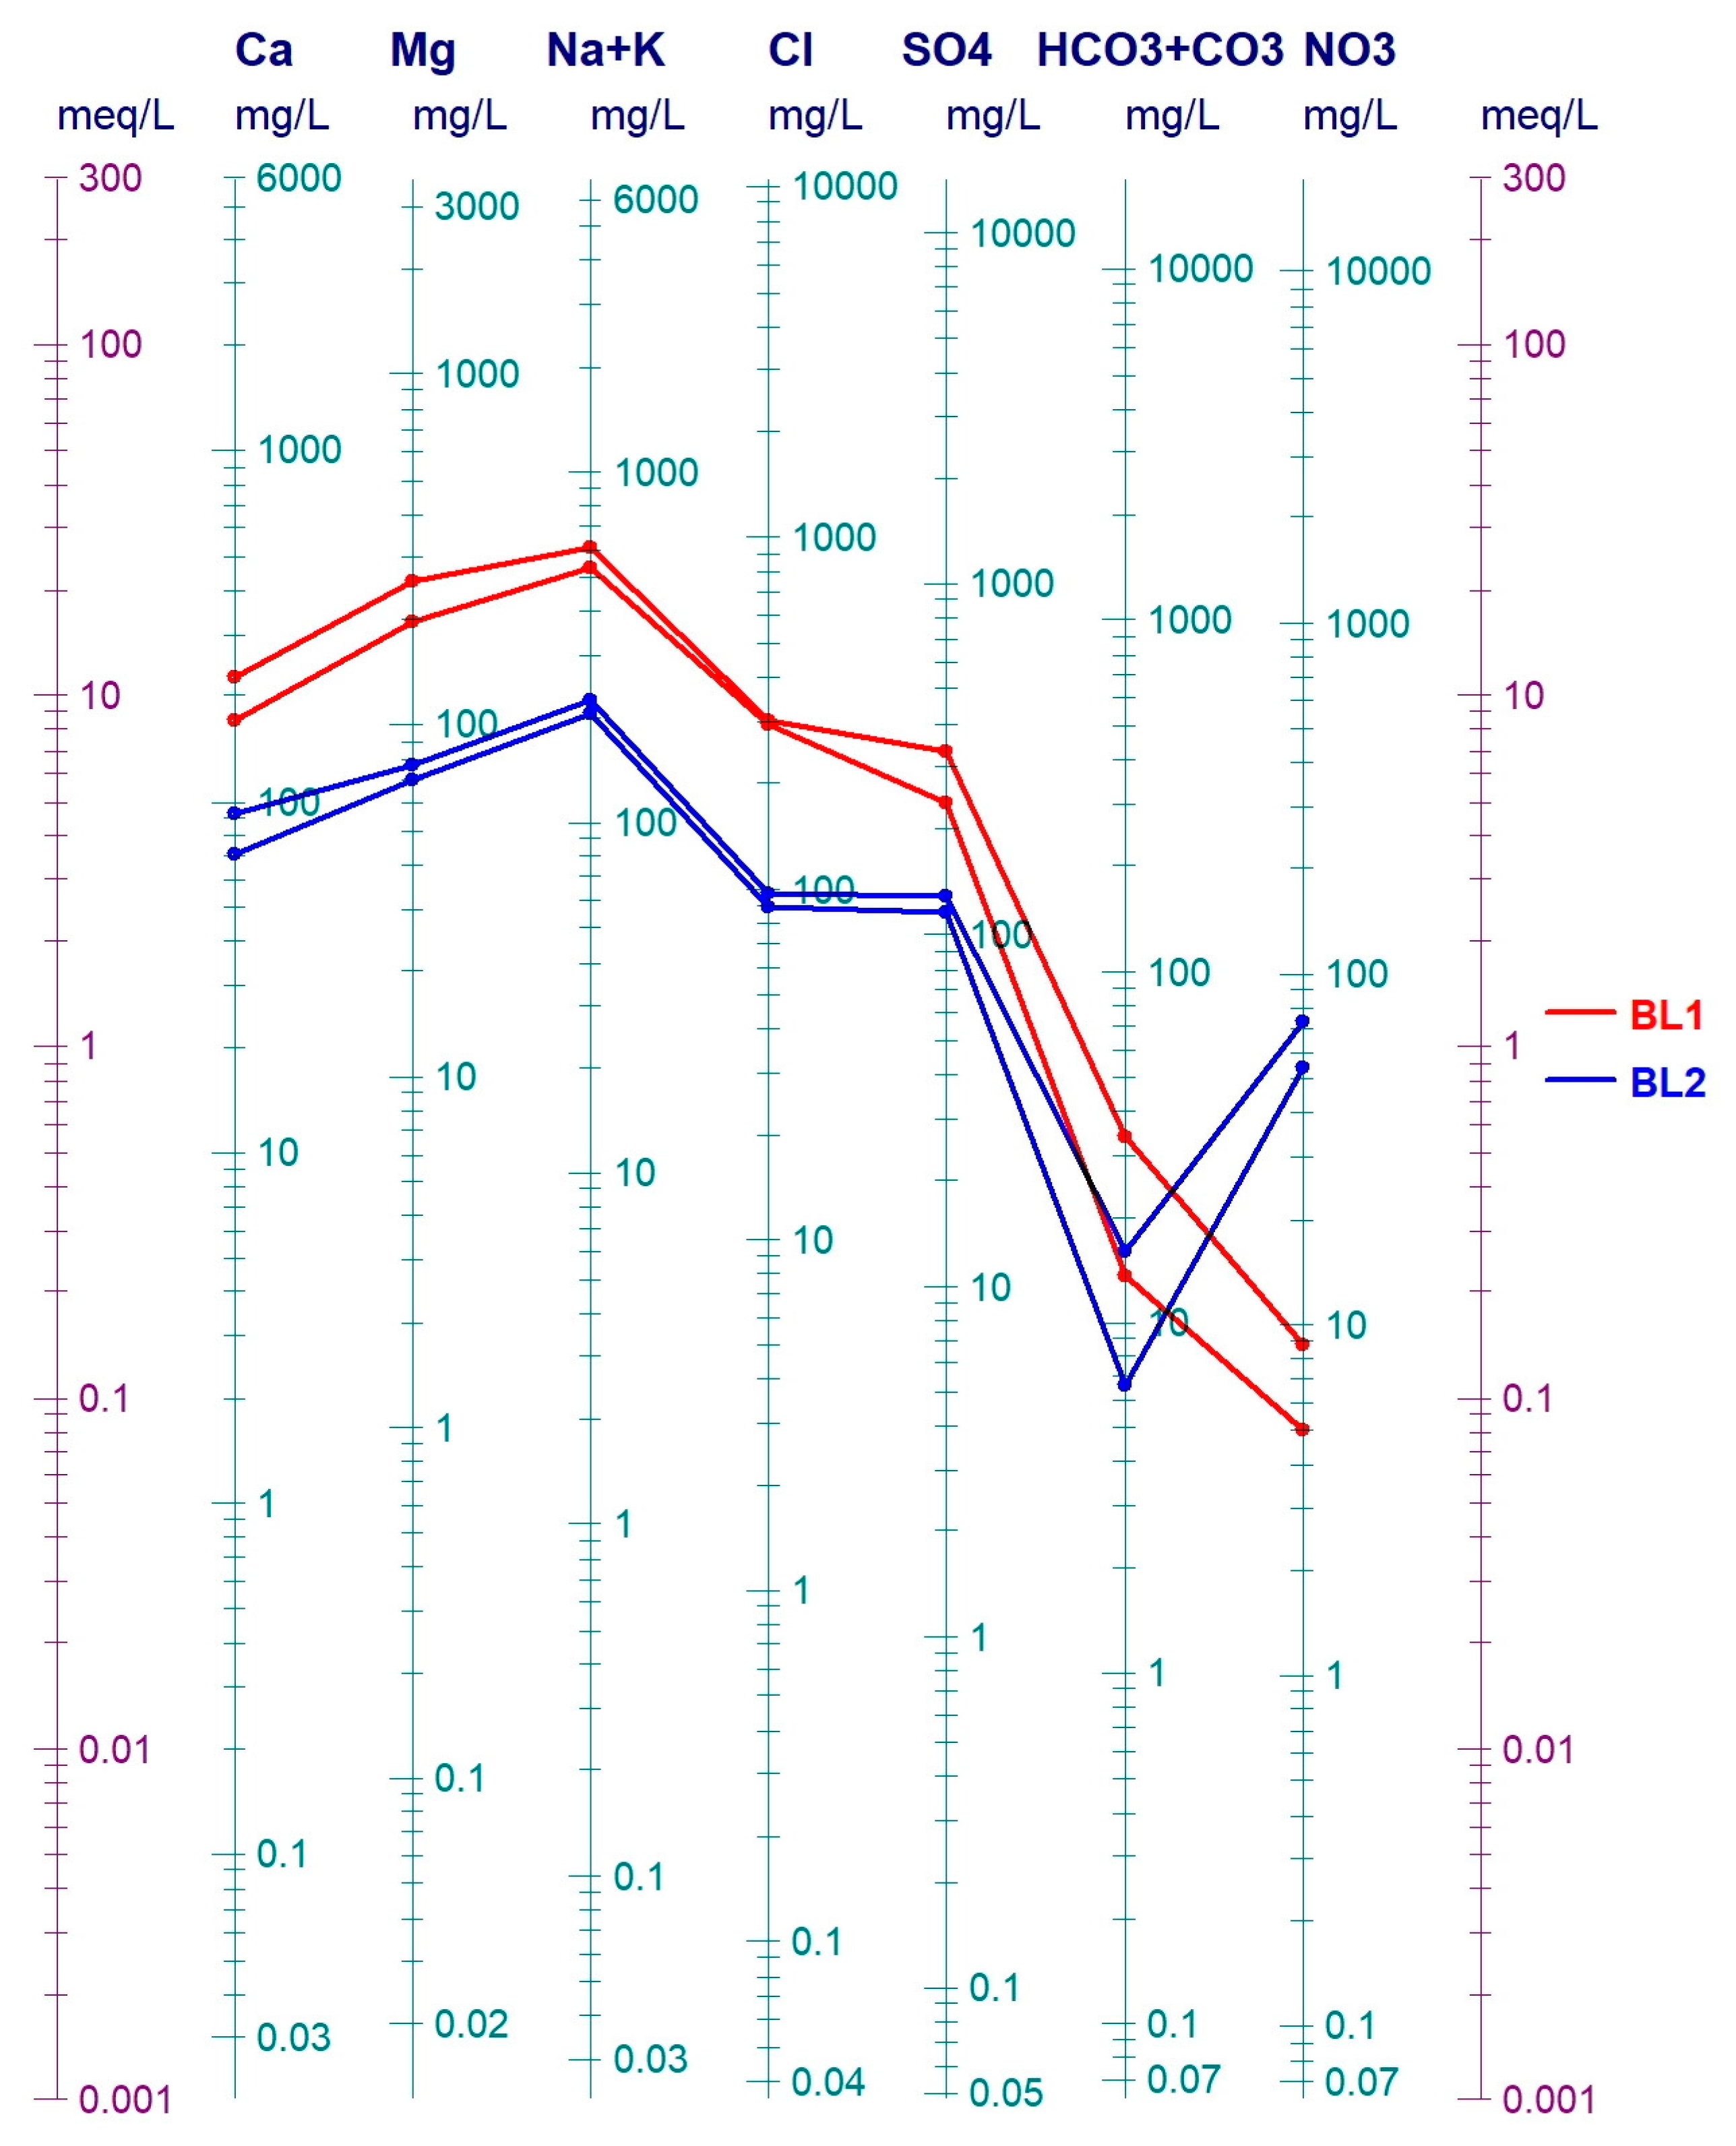
It was found that Ca, Mg, Na, K values were significantly higher in well BL1 than in BL2. The cation and anion relations were plotted on a semi-logarithmic Schoeller–Berkaloff diagram (Figure 10). Potassium was present at more than ten times higher concentrations in BL1 (69.3 mg/L) than in BL2 (4.6 mg/L). Na+ exceeded the contamination limit of 200 mg/L in both wells, while 561 mg/L was measured in well BL1. The values for Ca and Mg were twice and three times higher, respectively, in well BL1 compared to BL2. Elevated Na+ content of municipal wastewater is stated by several studies [57]. Since Na+ has a low retardation factor, Szabó et al. [34] used it for the calibration of contaminant transport models.

Figure 10.
Major cation and anion values of water samples from BL1 and BL2 monitoring wells in the summer and autumn of 2020.
4. Conclusions
The study examined the effects of a municipal liquid waste disposal site operating between 1994 and 2010 on soil and groundwater. After the wastewater collection of the municipality was regulated, the disposal site was subsequently decommissioned without recultivation or further action. In order to analyse the current state of the disposal site, a high precision digital elevation model was created. According to this, considerable accumulation of sewage sludge was detected in the first infiltration basin. This is confirmed by the results of soil analysis, which detected extremely high NO3− and PO43− concentrations in the five-meter-deep borehole profile.
Based on the results of water analysis, the significant contamination of the area can be stated. Effects of wastewater effluent were detected for all groundwater monitoring wells during sampling. Extremely high concentrations of ammonium and organic matter were detected in the groundwater of the basins, indicating that contaminated soil remains a major source of pollutants more than 10 years after closure. NO3− concentrations above the contamination limit were measured outside the basins. For all micro- and macroelements present in detectable concentrations, a significant increase was observed in the infiltration basin compared to the oxidation basin. Our results have revealed that the surroundings are also heavily contaminated.
The significance of our study is to highlight the environmental challenges associated with liquid waste disposal sites, which exist in many parts of the world and in many cases remain unsolved due to the high cost of recultivation. Our results also highlight the fact that even decades after contaminant replenishment has ceased, accumulated contaminants can still make these sites a serious source of hazard, especially if environmental elements within the affected area are vulnerable. Recultivation of liquid waste disposal sites of similar characteristics is therefore strongly recommended.
Author Contributions
Conceptualization, T.M., G.S. (György Szabó) and D.B.; methodology, T.M., Z.S. and E.B.; software, T.M. and D.B.; validation, T.M., G.S. (György Szabó), Z.S. and D.B.; formal analysis, T.M.; investigation, T.M., G.S. (György Szabó) and D.B.; resources, T.M. and G.S. (Gergely Szabó); data curation, T.M., G.S. (Gergely Szabó) and D.B.; writing—original draft preparation, T.M., G.S. (Gergely Szabó) and D.B.; writing—review and editing, T.M., G.S. (György Szabó) and D.B.; visualization, T.M. and D.B.; supervision, T.M. All authors have read and agreed to the published version of the manuscript.
Funding
This research was financed by NTP-NFTÖ-20-B, National Talent Programme, Ministry of Human Capacities.
Institutional Review Board Statement
Not applicable.
Informed Consent Statement
Not applicable.
Data Availability Statement
Not applicable.
Acknowledgments
The work of Tamás Mester was supported by the ÚNKP-21-4-II New National Excellence Program of the Ministry of Human Capacities. We acknowledge the Agilent Technologies and the Novo-Lab Ltd. (Budapest, Hungary) for providing the MP-AES 4200 and ETHOS UP instruments for the elemental analysis. Project no. TKP2021-NKTA-32 has been implemented with the support provided from the National Research, Development and Innovation Fund of Hungary, financed under the TKP2021-NKTA funding scheme.
Conflicts of Interest
The authors declare no conflict of interest.
References
- Bugajski, P.M.; Kurek, K.; Młyński, D.; Operacz, A. Designed and real hydraulic load of household wastewater treatment plants. J. Water Land Dev. 2019, 40, 155–160. [Google Scholar] [CrossRef]
- Janža, M.; Prestor, J.; Pestotnik, S.; Jamnik, B. Nitrogen mass balance and pressure impact model applied to an urban aquifer. Water 2020, 12, 1171. [Google Scholar] [CrossRef] [Green Version]
- Ahmad, W.; Ghanem, M. Effect of wastewater on the spring water quality of Sarida Catchment–West Bank. Arab. J. Basic Appl. Sci. 2021, 28, 292–299. [Google Scholar] [CrossRef]
- Ghanem, M.; Ahmad, W.; Keilani, Y.; Sawaftah, F.; Schelter, L.; Schuettrumpf, H. Spring water quality in the central West Bank, Palestine. J. Asian Earth Sci. X 2021, 5, 100052. [Google Scholar] [CrossRef]
- Roba, C.; Bălc, R.; Andreica, D.; Pădurean, A.; Pogăcean, P.; Chertes, T.; Moldovan, F.; Mocan, B.; Roșu, C. Assessment of groundwater quality in nw of romania and its suitability for drinking and agricultural purposes. Environ. Eng. Manag. J. (EEMJ) 2021, 20, 435–437. [Google Scholar] [CrossRef]
- Mester, T.; Szabó, G.; Balla, D. Assessment of shallow groundwater purification processes after the construction of a municipal sewerage network. Water 2021, 13, 1946. [Google Scholar] [CrossRef]
- Hastuti, E.; Riyana, R.; Joy, B.; Supratman, U.; Pamekas, R. Integrated Community Onsite Sanitation System for Close Loop Faecal Management. In E3S Web of Conferences; EDP Sciences: Les Ulis, France, 2021; Volume 249. [Google Scholar]
- Khalil, C.; Al Hageh, C.; Korfali, S.; Khnayzer, R.S. Municipal leachates health risks: Chemical and cytotoxicity assessment from regulated and unregulated municipal dumpsites in Lebanon. Chemosphere 2018, 208, 1–13. [Google Scholar] [CrossRef]
- Amusan, A.A.; Ige, D.V.; Olawale, R. Characteristics of soils and crops’ uptake of metals in municipal waste dump sites in Nigeria. J. Hum. Ecol. 2005, 17, 167–171. [Google Scholar] [CrossRef]
- Haile, D.; Gabbiye, N. Groundwater quality assessment of Chilanchil Abay watershed: The case of Bahir-Dar City waste disposal site. In Advances of Science and Technology; Springer: Cham, Switzerland, 2020; pp. 36–58. [Google Scholar]
- Mukherjee, A.G.; Wanjari, U.R.; Chakraborty, R.; Renu, K.; Vellingiri, B.; George, A.; Gopalakrishnan, A.V. A review on modern and smart technologies for efficient waste disposal and management. J. Environ. Manag. 2021, 297, 113347. [Google Scholar] [CrossRef]
- Han, D.; Tong, X.; Currell, M.J.; Cao, G.; Jin, M.; Tong, C. Evaluation of the impact of an uncontrolled landfill on surrounding groundwater quality, Zhoukou, China. J. Geochem. Explor. 2014, 136, 24–39. [Google Scholar] [CrossRef]
- Moore, E.; Udom, G.; Ngobiri, N. Assessment and impact of current sewage disposal practices in selected niger delta environment. Afr. J. Environ. Nat. Sci. 2019, 2, 77–86. [Google Scholar]
- Oakley, H.R. The disposal of communal waste. J. R. Soc. Arts 1967, 115, 533–546. [Google Scholar]
- Lyubimova, T.P.; Lepikhin, A.P.; Parshakova, Y.N.; Tsiberkin, K.B. Numerical modeling of liquid-waste infiltration from storage facilities into surrounding groundwater and surface-water bodies. J. Appl. Mech. Tech. 2016, 57, 1208–1216. [Google Scholar] [CrossRef]
- Tanna, R.N.; Moncur, M.C.; Birks, S.J.; Gibson, J.J.; Ptacek, C.J.; Mayer, B.; Wieser, M.E.; Wrona, F.J.; Munkittrick, K.R. Utility of a multi-tracer approach as a component of adaptive monitoring for municipal wastewater impacts. Water Qual. Res. J. 2020, 55, 327–341. [Google Scholar] [CrossRef]
- Hughes, G.M. Selection of refuse disposal sites in northeastern Illinois. Environ. Geol. 17 1967, 26. Available online: https://www.ideals.illinois.edu/bitstream/handle/2142/78852/selectionofrefus17hugh.pdf?sequence=1 (accessed on 5 December 2021).
- Kanmani, S.; Gandhimathi, R. Assessment of heavy metal contamination in soil due to leachate migration from an open dumping site. Appl. Water Sci. 2013, 3, 193–205. [Google Scholar] [CrossRef] [Green Version]
- Gorzelak, M.; Dąbrowska, D. Assessment of changes in the quality of ground water in the area of landfill site in Poczesna (South Poland) using the LWPI index. Environ. Socio-Econ. Stud. 2021, 9, 35–43. [Google Scholar] [CrossRef]
- Anomohanran, O.; Utieyin, B.S.; Ofomola, M.O. Delineation of groundwater vulnerability to pollution around dumpsites in Sapele, Nigeria. Int. J. Hydrol. Sci. Technol. 2021, 12, 59–76. [Google Scholar] [CrossRef]
- Wakida, F.T.; Lerner, D.N. Non-agricultural sources of groundwater nitrate: A review and case study. Water Res. 2005, 39, 3–16. [Google Scholar] [CrossRef]
- Fudala-Ksiazek, S.; Kulbat, E.; Luczkiewicz, A. Nitrification, denitrification, and dephosphatation capability of activated sludge during co-treatment of intermediate-age landfill leachates with municipal wastewater. Environ. Technol. 2018, 39, 986–996. [Google Scholar] [CrossRef] [PubMed]
- Buss, S.R.; Herbert, A.W.; Morgan, P.; Thornton, S.F.; Smith, J.W.N. A review of ammonium attenuation in soil and groundwater. Q. J. Eng. Geol. Hydrogeol. 2004, 37, 347–359. [Google Scholar] [CrossRef]
- Stevenson, F.J. Origin and distribution of nitrogen in soil. Soil Nitrogen 1965, 10, 1–42. [Google Scholar]
- Knops, J.M.; Tilman, D. Dynamics of soil nitrogen and carbon accumulation for 61 years after agricultural abandonment. Ecology 2000, 81, 88–98. [Google Scholar] [CrossRef]
- Anikwe, M.A.N.; Nwobodo, K.C.A. Long term effect of municipal waste disposal on soil properties and productivity of sites used for urban agriculture in Abakaliki, Nigeria. Bioresour. Technol. 2002, 83, 241–250. [Google Scholar] [CrossRef]
- Reynolds-Vargas, J.; Fraile-Merino, J.; Hirata, R. Trends in Nitrate Concentrations and Determination of Its Origin Using Stable Isotopes (¹⁸O and ¹⁵N) in Groundwater of the Western Central Valley, Costa Rica. Ambio 2006, 35, 229–236. [Google Scholar] [CrossRef]
- Stollenwerk, K.G. Simulation of phosphate transport in sewage-contaminated groundwater, Cape Cod, Massachusetts. Appl. Geochem. 1996, 11, 317–324. [Google Scholar] [CrossRef]
- LeBlanc, D.R. Sewage Plume in a Sand and Gravel Aquifer, Cape Cod, Massachusetts (Vol. 2218); Department of the Interior, US Geological Survey: Alexandria, VA, USA, 1985.
- Hirschberg, K.J.B. Liquid-waste disposal in Perth, A hydrogeological assessment. West. Aust. Geol. Surv. Rep. 1986, 19, 55–61. [Google Scholar]
- Yoada, R.M.; Chirawurah, D.; Adongo, P.B. Domestic waste disposal practice and perceptions of private sector waste management in urban Accra. BMC Public Health 2014, 14, 697. [Google Scholar] [CrossRef] [Green Version]
- Appleyard, S.J. Impact of liquid waste disposal on potable groundwater resources near Perth, Western Australia. Environ. Geol. 1996, 28, 106–110. [Google Scholar] [CrossRef]
- Szabó, G.; Bessenyei, É.; Hajnal, A.; Csige, I.; Szabó, G.; Tóth, C.; Posta, J.; Mester, T. The Use of Sodium to Calibrate the Transport Modeling of Water Pollution in Sandy Formations Around an Uninsulated Sewage Disposal Site. Water Air Soil Pollut. 2016, 227, 45. [Google Scholar] [CrossRef] [Green Version]
- Ringo, J. Status of Sewage Disposal in Dodoma Municipality, Tanzania. Int. J. Mar. Atmos. Earth Sci. 2016, 4, 24–34. [Google Scholar]
- Marek, D.; Baun, M.; Dąbrowski, M. The challenge of implementing European Union environmental law in the new member states: The Urban Waste Water Treatment Directive in the Czech Republic and Poland. Environ. Plan. C Polit. Space 2017, 35, 1117–1135. [Google Scholar] [CrossRef]
- Somlyódy, L.; Buzás, K.; Clement, A.; Melicz, Z. Strategies for approximating EU legislation in Hungary: The Sajó River case. Water Sci. Technol. 1999, 40, 87–94. [Google Scholar] [CrossRef]
- Somlyódy, L.; Patziger, M. Urban wastewater development in Central and Eastern Europe. Water Sci. Technol. 2012, 66, 1081–1087. [Google Scholar] [CrossRef]
- Mester, T.; Balla, D.; Szabó, G. Assessment of Groundwater Quality Changes in the Rural Environment of the Hungarian Great Plain Based on Selected Water Quality Indicators. Water Air Soil Pollut. 2020, 231, 1–14. [Google Scholar] [CrossRef]
- Hungarian Central Statistical Office. 2021. Available online: https://www.ksh.hu/stadat_files/kor/hu/kor0067.html (accessed on 3 December 2021).
- Michéli, E.; Fuchs, M.; Hegymegi, P.; Stefanovits, P. Classification of the major soils of Hungary and their correlation with the World Reference Base for Soil Resources (WRB). Agrokém. és Talajt. 2006, 55, 19–28. [Google Scholar] [CrossRef]
- Dövényi, Z. Magyarország Kistájainak Katasztere [Inventory of Microregions in Hungary]; MTA Földrajztudományi Kutatóintézet—MTA Geographical Research Institute: Budapest, Hungary, 2010; 876p. [Google Scholar]
- Hungarian Central Statistical Office (HSCO). 2021. Available online: https://nyilvantarto.hu/hu/statisztikak?stat=kozerdeku (accessed on 11 July 2021).
- Mester, T.; Balla, D.; Karancsi, G.; Bessenyei, É.; Szabó, G. Effects of nitrogen loading from domestic wastewater on groundwater quality. Water SA 2019, 45, 349–358. [Google Scholar] [CrossRef] [Green Version]
- Müller, H.W.; Dohrmann, R.; Klosa, D.; Rehder, S.; Eckelmann, W. Comparison of two procedures for particle-size analysis: Köhn pipette and X-ray granulometry. J. Plant Nutr. Soil Sci. 2009, 172, 172–179. [Google Scholar] [CrossRef]
- Ślósarczyk, K.; Witkowski, A.J. Preliminary Evaluation of the Possible Occurrence of Pesticides in Groundwater Contaminated with Nitrates—A Case Study from Southern Poland. Water 2021, 13, 3091. [Google Scholar] [CrossRef]
- El Mountassir, O.; Bahir, M.; Ouazar, D.; Chehbouni, A.; Carreira, P.M. Temporal and spatial assessment of groundwater contamination with nitrate using nitrate pollution index (NPI), groundwater pollution index (GPI), and GIS (case study: Essaouira basin, Morocco). Environ. Sci. Pollut. Res. 2021, 1–18. [Google Scholar] [CrossRef]
- Aravinthasamy, P.; Karunanidhi, D.; Subramani, T.; Roy, P.D. Demarcation of groundwater quality domains using GIS for best agricultural practices in the drought-prone Shanmuganadhi River basin of South India. Environ. Sci. Pollut. Res. 2021, 28, 18423–18435. [Google Scholar] [CrossRef]
- Beauchamp, E.G.; Drury, C.F. Ammonium fixation, release, nitrification, and immobilization in high-and low-fixing soils. Soil Sci. Soc. Am. J. 1991, 55, 125–129. [Google Scholar] [CrossRef]
- Agehara, S.; Warncke, D.D. Soil moisture and temperature effects on nitrogen release from organic nitrogen sources. Soil Sci. Soc. Am. J. 2005, 69, 1844–1855. [Google Scholar] [CrossRef] [Green Version]
- Leonard, M.; Gilpin, B. Potential Impacts of On-Site Sewage Disposal on Groundwater; Institute of Environmental Science and Research Limited: Porirua, New Zealand, 2006. [Google Scholar]
- Al Yaqout, A.F. Assessment and analysis of industrial liquid waste and sludge disposal at unlined landfill sites in arid climate. Waste Manag. 2003, 23, 817–824. [Google Scholar] [CrossRef]
- Okoye, B.S.; Umeora, C.O.; Ifebi, O.C.; Onwuzuligbo, C.C. Effects of sewage disposal systems on the environment in public housing estates in enugu metrpolis. Afr. J. Environ. 2018, 1, 120–130. [Google Scholar]
- Talalaj, I.A.; Biedka, P. Use of the landfill water pollution index (LWPI) for groundwater quality assessment near the landfill sites. Environ. Sci. Pollut. Res. 2016, 23, 24601–24613. [Google Scholar] [CrossRef] [Green Version]
- Brennan, R.B.; Clifford, E.; Devroedt, C.; Morrison, L.; Healy, M.G. Treatment of landfill leachate in municipal wastewater treatment plants and impacts on effluent ammonium concentrations. J. Environ. Manag. 2017, 188, 64–72. [Google Scholar] [CrossRef] [Green Version]
- James, A.; Percy, M.; Ameh, O.S. Heavy metals pollution status of the Katima Mulilo Urban open land wastewater disposal centre and the immediate vicinity. Cogent Environ. Sci. 2020, 6, 1726093. [Google Scholar] [CrossRef]
- Gulyás, G.; Pitás, V.; Fazekas, B.; Kárpáti, Á. Heavy metal balance in a communal wastewater treatment plant. Hung. J. Ind. Chem. 2015, 43, 1–5. [Google Scholar] [CrossRef] [Green Version]
- Szabó, G.; Bessenyei, É. Studying groundwater pollution in the surroundings of a recultivated sewage disposal site in eastern Hungary. J. Selçuk Univ. Nat. Appl. Sci. 2013, 1–12. Available online: http://josunas.selcuk.edu.tr/login/index.php/josunas/article/view/66 (accessed on 29 December 2021).
Publisher’s Note: MDPI stays neutral with regard to jurisdictional claims in published maps and institutional affiliations. |
© 2022 by the authors. Licensee MDPI, Basel, Switzerland. This article is an open access article distributed under the terms and conditions of the Creative Commons Attribution (CC BY) license (https://creativecommons.org/licenses/by/4.0/).

